Project
ENCODE: H3K4me3 ChIP-Seq of primary human cells
Navigation
Downloads

Results for GLIS1
Z-value: 0.16
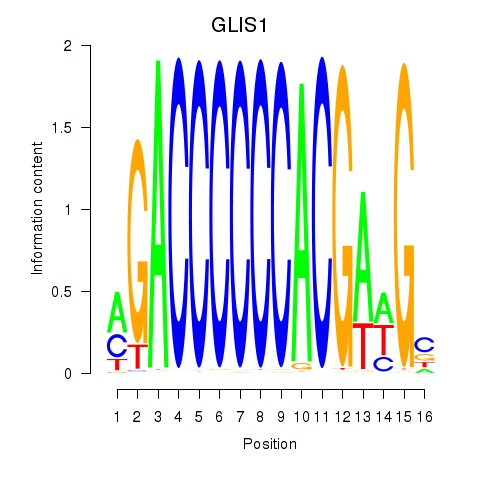
Motif logo
Transcription factors associated with GLIS1
| Gene Symbol | Gene ID | Gene Info |
|---|---|---|
|
GLIS1
|
ENSG00000174332.3 | GLIS family zinc finger 1 |
Correlations of motif activity and signal intensity at CREs associated with the motif's TFs:
This plot shows correlation between observed signal intensity of a CRE associated with the transcription factor across all samples and activity of the motif.
For each TF, only the top 5 correlated CREs are shown.
| CRE | Gene | Distance | Association probability | Pearson corr. coef. | P-value | Plot |
|---|---|---|---|---|---|---|
| chr1_54205372_54205532 | GLIS1 | 5575 | 0.204329 | -0.69 | 4.1e-02 | Click! |
| chr1_54203045_54203196 | GLIS1 | 3243 | 0.245145 | -0.59 | 9.7e-02 | Click! |
| chr1_54202397_54202548 | GLIS1 | 2595 | 0.275475 | -0.54 | 1.3e-01 | Click! |
| chr1_54205007_54205362 | GLIS1 | 5307 | 0.206770 | -0.54 | 1.3e-01 | Click! |
| chr1_54195063_54195214 | GLIS1 | 4739 | 0.217334 | -0.44 | 2.4e-01 | Click! |
Activity of the GLIS1 motif across conditions
Conditions sorted by the z-value of the GLIS1 motif activity
Move your cursor over a bar to see sample name and corresponding Z-value.
Top target CREs of the motif:
| Cis Regulatory Element (CRE) | Target Score | Top associated gene | Gene Info | Distance of CRE to TSS | CRE/Gene association probability |
|---|---|---|---|---|---|
| chr18_11751659_11751810 | 0.08 |
GNAL |
guanine nucleotide binding protein (G protein), alpha activating activity polypeptide, olfactory type |
227 |
0.94 |
| chr11_1593572_1594262 | 0.08 |
KRTAP5-AS1 |
KRTAP5-1/KRTAP5-2 antisense RNA 1 |
54 |
0.92 |
| chr18_60825688_60825839 | 0.06 |
RP11-299P2.1 |
|
7210 |
0.25 |
| chr1_118156630_118156781 | 0.06 |
FAM46C |
family with sequence similarity 46, member C |
8149 |
0.22 |
| chr7_151119334_151119485 | 0.06 |
RP4-555L14.4 |
|
5360 |
0.12 |
| chr4_185185188_185185495 | 0.06 |
ENSG00000221523 |
. |
3243 |
0.26 |
| chr12_58290122_58290785 | 0.05 |
XRCC6BP1 |
XRCC6 binding protein 1 |
44907 |
0.08 |
| chr10_103539328_103539744 | 0.05 |
NPM3 |
nucleophosmin/nucleoplasmin 3 |
3634 |
0.18 |
| chr19_7599221_7599435 | 0.03 |
PNPLA6 |
patatin-like phospholipase domain containing 6 |
75 |
0.94 |
| chr8_29120281_29120556 | 0.02 |
KIF13B |
kinesin family member 13B |
172 |
0.94 |
| chr5_150520697_150520848 | 0.02 |
ANXA6 |
annexin A6 |
429 |
0.85 |
| chr16_58059170_58059939 | 0.02 |
MMP15 |
matrix metallopeptidase 15 (membrane-inserted) |
84 |
0.96 |
| chr11_45201780_45202121 | 0.02 |
PRDM11 |
PR domain containing 11 |
1478 |
0.49 |
| chr17_80655275_80656143 | 0.02 |
RAB40B |
RAB40B, member RAS oncogene family |
829 |
0.47 |
| chr8_11627244_11627926 | 0.01 |
NEIL2 |
nei endonuclease VIII-like 2 (E. coli) |
337 |
0.84 |
| chr14_105668576_105668727 | 0.01 |
BRF1 |
BRF1, RNA polymerase III transcription initiation factor 90 kDa subunit |
20231 |
0.14 |
| chr15_43881579_43882371 | 0.01 |
PPIP5K1 |
diphosphoinositol pentakisphosphate kinase 1 |
165 |
0.91 |
| chr7_56183478_56183932 | 0.01 |
NUPR1L |
nuclear protein, transcriptional regulator, 1-like |
388 |
0.78 |
| chr1_59250006_59250701 | 0.01 |
JUN |
jun proto-oncogene |
568 |
0.79 |
| chr7_73498327_73498772 | 0.01 |
LIMK1 |
LIM domain kinase 1 |
279 |
0.91 |
| chr4_107237686_107238085 | 0.01 |
TBCK |
TBC1 domain containing kinase |
24 |
0.75 |
| chr1_45986537_45987565 | 0.01 |
PRDX1 |
peroxiredoxin 1 |
475 |
0.74 |
| chr19_1274680_1275381 | 0.01 |
C19orf24 |
chromosome 19 open reading frame 24 |
4 |
0.94 |
| chr9_136580274_136580425 | 0.01 |
SARDH |
sarcosine dehydrogenase |
11526 |
0.2 |
| chr2_113033235_113033667 | 0.01 |
ZC3H6 |
zinc finger CCCH-type containing 6 |
273 |
0.91 |
| chr11_68671451_68672010 | 0.01 |
IGHMBP2 |
immunoglobulin mu binding protein 2 |
365 |
0.53 |
| chrX_40027620_40027771 | 0.01 |
BCOR |
BCL6 corepressor |
8878 |
0.31 |
| chr1_236958581_236959780 | 0.01 |
MTR |
5-methyltetrahydrofolate-homocysteine methyltransferase |
198 |
0.96 |
| chr2_101197927_101198078 | 0.01 |
ENSG00000238328 |
. |
4071 |
0.2 |
| chr5_98109571_98109848 | 0.01 |
RGMB |
repulsive guidance molecule family member b |
370 |
0.62 |
| chr20_25565265_25566139 | 0.01 |
NINL |
ninein-like |
451 |
0.81 |
| chr16_1030392_1030543 | 0.01 |
AC009041.2 |
|
785 |
0.33 |
| chr18_73132_73519 | 0.01 |
RP11-683L23.1 |
Tubulin beta-8 chain-like protein LOC260334 |
23085 |
0.21 |
| chr6_24495335_24495996 | 0.01 |
ALDH5A1 |
aldehyde dehydrogenase 5 family, member A1 |
468 |
0.82 |
| chr8_103751111_103751305 | 0.01 |
ENSG00000266799 |
. |
5261 |
0.26 |
| chr8_145027093_145027557 | 0.01 |
PLEC |
plectin |
763 |
0.48 |
| chr19_55684291_55685412 | 0.01 |
SYT5 |
synaptotagmin V |
1083 |
0.28 |
| chr15_43981291_43982067 | 0.01 |
CKMT1A |
creatine kinase, mitochondrial 1A |
3405 |
0.12 |
| chr3_127319190_127319523 | 0.01 |
MCM2 |
minichromosome maintenance complex component 2 |
1411 |
0.36 |
| chr12_122467875_122468026 | 0.00 |
BCL7A |
B-cell CLL/lymphoma 7A |
8158 |
0.22 |
| chr3_50263691_50263973 | 0.00 |
GNAI2 |
guanine nucleotide binding protein (G protein), alpha inhibiting activity polypeptide 2 |
108 |
0.94 |
| chr1_241802726_241802968 | 0.00 |
OPN3 |
opsin 3 |
816 |
0.6 |
| chr16_2739999_2740150 | 0.00 |
KCTD5 |
potassium channel tetramerization domain containing 5 |
7533 |
0.1 |
| chr14_102783547_102783968 | 0.00 |
ZNF839 |
zinc finger protein 839 |
43 |
0.97 |
| chr9_141044575_141045102 | 0.00 |
TUBBP5 |
tubulin, beta pseudogene 5 |
24659 |
0.23 |
| chr10_74020790_74021082 | 0.00 |
DDIT4 |
DNA-damage-inducible transcript 4 |
12742 |
0.14 |
| chr1_226111176_226111965 | 0.00 |
PYCR2 |
pyrroline-5-carboxylate reductase family, member 2 |
389 |
0.46 |
| chr13_26761202_26761553 | 0.00 |
RNF6 |
ring finger protein (C3H2C3 type) 6 |
34463 |
0.2 |
| chr19_44488058_44488547 | 0.00 |
ZNF155 |
zinc finger protein 155 |
41 |
0.95 |
| chr13_95247882_95248356 | 0.00 |
TGDS |
TDP-glucose 4,6-dehydratase |
392 |
0.86 |
| chr7_27225817_27225968 | 0.00 |
HOXA11-AS |
HOXA11 antisense RNA |
739 |
0.31 |
| chr15_84033783_84034563 | 0.00 |
BNC1 |
basonuclin 1 |
80707 |
0.09 |
| chr14_37116502_37116669 | 0.00 |
PAX9 |
paired box 9 |
10188 |
0.18 |
| chr10_119610_120346 | 0.00 |
TUBB8 |
tubulin, beta 8 class VIII |
24474 |
0.22 |
| chr1_8763422_8763924 | 0.00 |
RERE |
arginine-glutamic acid dipeptide (RE) repeats |
395 |
0.9 |
| chr12_26348226_26348487 | 0.00 |
SSPN |
sarcospan |
73 |
0.98 |
| chr2_54198319_54198701 | 0.00 |
ACYP2 |
acylphosphatase 2, muscle type |
265 |
0.72 |
| chr11_61159610_61160825 | 0.00 |
TMEM216 |
transmembrane protein 216 |
352 |
0.79 |
| chr14_89884489_89884712 | 0.00 |
FOXN3-AS1 |
FOXN3 antisense RNA 1 |
902 |
0.43 |
| chr17_36908995_36909604 | 0.00 |
PSMB3 |
proteasome (prosome, macropain) subunit, beta type, 3 |
299 |
0.72 |
| chr20_48838007_48838158 | 0.00 |
CEBPB |
CCAAT/enhancer binding protein (C/EBP), beta |
30706 |
0.18 |
| chr12_111843881_111845308 | 0.00 |
SH2B3 |
SH2B adaptor protein 3 |
842 |
0.62 |
| chr17_5388900_5389438 | 0.00 |
DERL2 |
derlin 2 |
313 |
0.57 |
| chr3_177017776_177017927 | 0.00 |
TBL1XR1 |
transducin (beta)-like 1 X-linked receptor 1 |
102590 |
0.08 |
| chr19_48896929_48897565 | 0.00 |
GRIN2D |
glutamate receptor, ionotropic, N-methyl D-aspartate 2D |
885 |
0.4 |
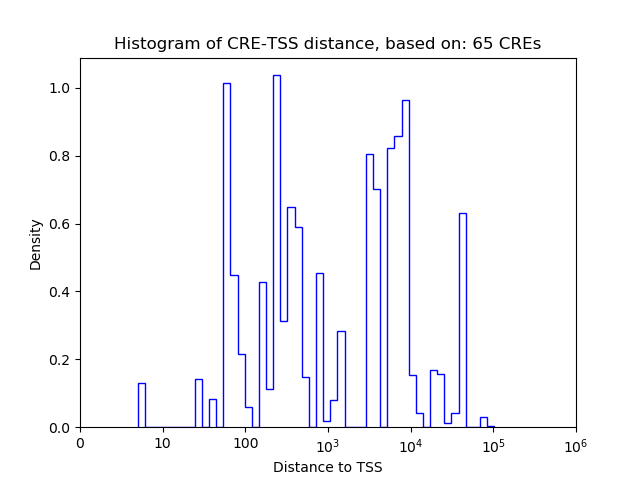
Histogram of CRE-TSS distances for CREs targeted by :
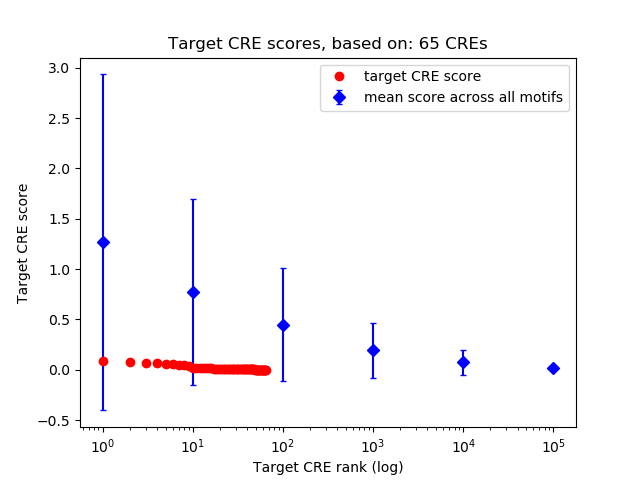
Rank distribution of CRE target scores:
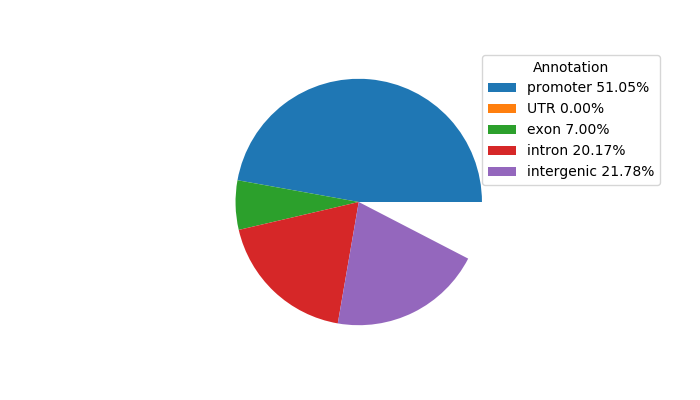
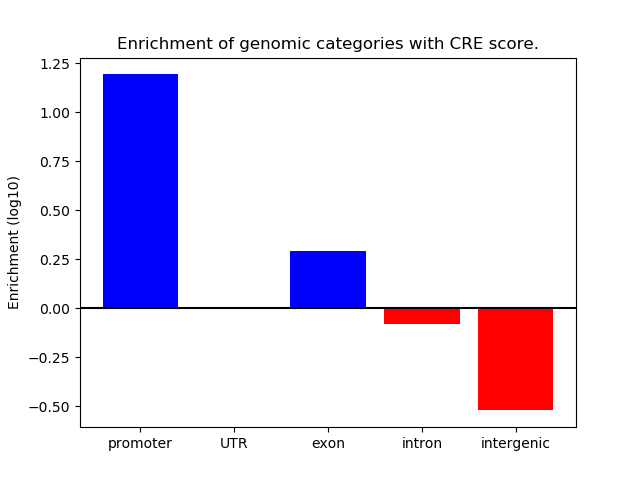
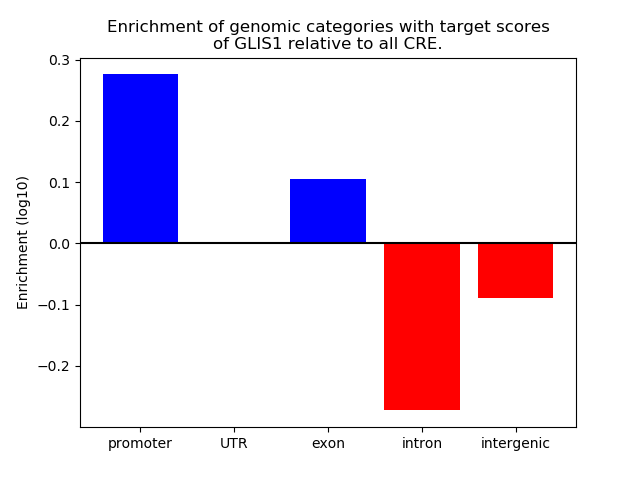
Distribution of target CREs across different genomic regions:
Network of associatons between targets according to the STRING database.

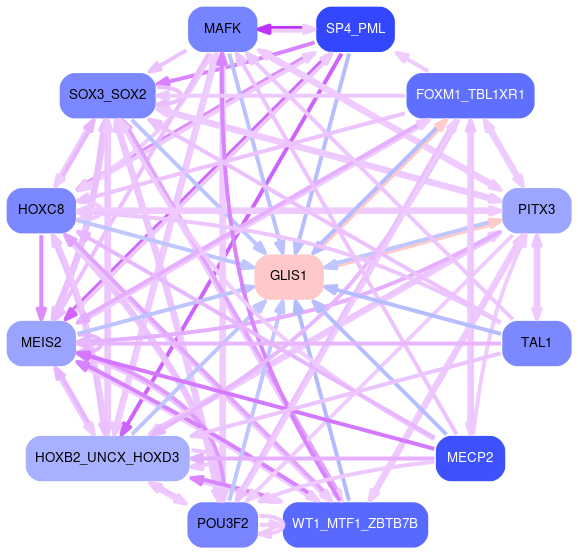
Gene Ontology Analysis
Gene overrepresentation in biological process category:
| Log-likelihood per target | Total log-likelihood | Term | Description |
|---|---|---|---|
| 0.0 | 0.1 | GO:0007191 | adenylate cyclase-activating dopamine receptor signaling pathway(GO:0007191) |