Project
ENCODE: H3K4me3 ChIP-Seq of primary human cells
Navigation
Downloads

Results for TCF7L2
Z-value: 0.67
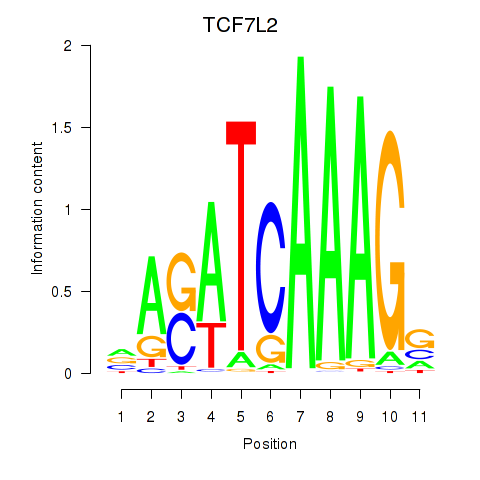
Motif logo
Transcription factors associated with TCF7L2
| Gene Symbol | Gene ID | Gene Info |
|---|---|---|
|
TCF7L2
|
ENSG00000148737.11 | transcription factor 7 like 2 |
Correlations of motif activity and signal intensity at CREs associated with the motif's TFs:
This plot shows correlation between observed signal intensity of a CRE associated with the transcription factor across all samples and activity of the motif.
For each TF, only the top 5 correlated CREs are shown.
| CRE | Gene | Distance | Association probability | Pearson corr. coef. | P-value | Plot |
|---|---|---|---|---|---|---|
| chr10_114709559_114709734 | TCF7L2 | 363 | 0.861502 | -0.80 | 9.0e-03 | Click! |
| chr10_114710044_114711028 | TCF7L2 | 20 | 0.964004 | -0.69 | 4.1e-02 | Click! |
| chr10_114888367_114888518 | TCF7L2 | 15237 | 0.287825 | 0.62 | 7.4e-02 | Click! |
| chr10_114890176_114890327 | TCF7L2 | 13428 | 0.293019 | 0.61 | 8.3e-02 | Click! |
| chr10_114847036_114847187 | TCF7L2 | 56568 | 0.156669 | 0.59 | 9.4e-02 | Click! |
Activity of the TCF7L2 motif across conditions
Conditions sorted by the z-value of the TCF7L2 motif activity
Move your cursor over a bar to see sample name and corresponding Z-value.
Top target CREs of the motif:
| Cis Regulatory Element (CRE) | Target Score | Top associated gene | Gene Info | Distance of CRE to TSS | CRE/Gene association probability |
|---|---|---|---|---|---|
| chr14_29228686_29229081 | 0.28 |
RP11-966I7.1 |
|
5586 |
0.17 |
| chr9_22237663_22237957 | 0.23 |
CDKN2B-AS1 |
CDKN2B antisense RNA 1 |
124133 |
0.06 |
| chr1_216705124_216705304 | 0.20 |
USH2A |
Usher syndrome 2A (autosomal recessive, mild) |
108476 |
0.08 |
| chr7_143579344_143579634 | 0.19 |
FAM115A |
family with sequence similarity 115, member A |
487 |
0.8 |
| chr16_69200573_69200724 | 0.18 |
ENSG00000207083 |
. |
9032 |
0.12 |
| chr18_74128974_74129353 | 0.17 |
ZNF516 |
zinc finger protein 516 |
38295 |
0.15 |
| chr3_31206984_31207188 | 0.17 |
ENSG00000265376 |
. |
3807 |
0.34 |
| chr3_156847874_156848025 | 0.16 |
ENSG00000201778 |
. |
23388 |
0.15 |
| chr1_231543825_231544251 | 0.16 |
EGLN1 |
egl-9 family hypoxia-inducible factor 1 |
16752 |
0.2 |
| chr8_89842231_89842382 | 0.16 |
RP11-586K2.1 |
|
129786 |
0.06 |
| chr1_170633420_170634117 | 0.16 |
PRRX1 |
paired related homeobox 1 |
690 |
0.8 |
| chr8_17611273_17611424 | 0.15 |
MTUS1 |
microtubule associated tumor suppressor 1 |
2142 |
0.28 |
| chr6_155475558_155475911 | 0.15 |
TIAM2 |
T-cell lymphoma invasion and metastasis 2 |
5479 |
0.3 |
| chr9_21558481_21558945 | 0.15 |
MIR31HG |
MIR31 host gene (non-protein coding) |
955 |
0.56 |
| chr1_39175248_39175457 | 0.15 |
RRAGC |
Ras-related GTP binding C |
150143 |
0.04 |
| chr17_77911547_77911698 | 0.14 |
TBC1D16 |
TBC1 domain family, member 16 |
13005 |
0.19 |
| chr10_29449257_29449592 | 0.14 |
LYZL1 |
lysozyme-like 1 |
128566 |
0.06 |
| chr10_119564055_119564206 | 0.14 |
RP11-354M20.3 |
|
212868 |
0.02 |
| chr4_20260773_20260924 | 0.14 |
SLIT2 |
slit homolog 2 (Drosophila) |
4305 |
0.36 |
| chr7_110731629_110731847 | 0.14 |
LRRN3 |
leucine rich repeat neuronal 3 |
639 |
0.79 |
| chr2_230845561_230845747 | 0.14 |
ENSG00000206725 |
. |
7623 |
0.17 |
| chr9_18474095_18474958 | 0.14 |
ADAMTSL1 |
ADAMTS-like 1 |
295 |
0.95 |
| chr17_2326867_2327018 | 0.14 |
AC006435.1 |
Uncharacterized protein |
8211 |
0.13 |
| chr6_117920563_117920770 | 0.13 |
GOPC |
golgi-associated PDZ and coiled-coil motif containing |
2861 |
0.34 |
| chr10_48439314_48439655 | 0.13 |
GDF10 |
growth differentiation factor 10 |
508 |
0.78 |
| chr7_114396273_114396424 | 0.13 |
ENSG00000272230 |
. |
102948 |
0.07 |
| chr8_97536070_97536353 | 0.13 |
SDC2 |
syndecan 2 |
29975 |
0.22 |
| chr4_30724120_30724271 | 0.13 |
PCDH7 |
protocadherin 7 |
218 |
0.97 |
| chr13_24144563_24144801 | 0.13 |
TNFRSF19 |
tumor necrosis factor receptor superfamily, member 19 |
121 |
0.98 |
| chr2_33547327_33547478 | 0.13 |
ENSG00000252246 |
. |
10563 |
0.21 |
| chr7_113722711_113723554 | 0.13 |
FOXP2 |
forkhead box P2 |
3483 |
0.3 |
| chr10_104512266_104512417 | 0.13 |
WBP1L |
WW domain binding protein 1-like |
8614 |
0.15 |
| chr4_188523294_188523560 | 0.13 |
ZFP42 |
ZFP42 zinc finger protein |
393498 |
0.01 |
| chr1_7439604_7439992 | 0.12 |
RP3-453P22.2 |
|
9681 |
0.21 |
| chr4_96140627_96140803 | 0.12 |
BMPR1B |
bone morphogenetic protein receptor, type IB |
115209 |
0.07 |
| chr19_31182299_31182450 | 0.12 |
ENSG00000223148 |
. |
77247 |
0.12 |
| chr5_54456050_54456451 | 0.12 |
GPX8 |
glutathione peroxidase 8 (putative) |
252 |
0.86 |
| chr12_70132575_70133879 | 0.12 |
RAB3IP |
RAB3A interacting protein |
47 |
0.95 |
| chr17_72414902_72415053 | 0.12 |
ENSG00000200021 |
. |
1134 |
0.39 |
| chr3_45181744_45181895 | 0.12 |
CDCP1 |
CUB domain containing protein 1 |
6095 |
0.25 |
| chr7_140049305_140049502 | 0.12 |
SLC37A3 |
solute carrier family 37, member 3 |
917 |
0.52 |
| chr4_113739356_113739869 | 0.12 |
ANK2 |
ankyrin 2, neuronal |
347 |
0.9 |
| chr3_30323778_30323929 | 0.12 |
ENSG00000199927 |
. |
22174 |
0.27 |
| chr6_132735691_132735842 | 0.12 |
MOXD1 |
monooxygenase, DBH-like 1 |
13082 |
0.25 |
| chr10_104467333_104467484 | 0.11 |
ARL3 |
ADP-ribosylation factor-like 3 |
6756 |
0.16 |
| chr3_114341689_114341840 | 0.11 |
ZBTB20 |
zinc finger and BTB domain containing 20 |
1289 |
0.61 |
| chr7_24861371_24861547 | 0.11 |
DFNA5 |
deafness, autosomal dominant 5 |
52215 |
0.15 |
| chr11_129154900_129155051 | 0.11 |
ARHGAP32 |
Rho GTPase activating protein 32 |
5756 |
0.29 |
| chrX_107442700_107442953 | 0.11 |
COL4A6 |
collagen, type IV, alpha 6 |
39627 |
0.18 |
| chr4_75409052_75409203 | 0.11 |
RP11-727M10.2 |
|
66845 |
0.1 |
| chr1_224808626_224808777 | 0.11 |
CNIH3 |
cornichon family AMPA receptor auxiliary protein 3 |
4706 |
0.23 |
| chr10_73357870_73358021 | 0.11 |
CDH23 |
cadherin-related 23 |
27393 |
0.22 |
| chr6_122931066_122932065 | 0.11 |
PKIB |
protein kinase (cAMP-dependent, catalytic) inhibitor beta |
188 |
0.97 |
| chr2_106008512_106008663 | 0.11 |
FHL2 |
four and a half LIM domains 2 |
4655 |
0.22 |
| chr5_39423074_39423254 | 0.11 |
DAB2 |
Dab, mitogen-responsive phosphoprotein, homolog 2 (Drosophila) |
1806 |
0.48 |
| chr17_40811022_40812282 | 0.11 |
TUBG2 |
tubulin, gamma 2 |
329 |
0.76 |
| chr15_39873424_39874712 | 0.11 |
THBS1 |
thrombospondin 1 |
774 |
0.66 |
| chr18_25692719_25692870 | 0.11 |
CDH2 |
cadherin 2, type 1, N-cadherin (neuronal) |
15601 |
0.31 |
| chr4_20420225_20420376 | 0.11 |
SLIT2-IT1 |
SLIT2 intronic transcript 1 (non-protein coding) |
26488 |
0.25 |
| chrX_10587548_10588615 | 0.11 |
MID1 |
midline 1 (Opitz/BBB syndrome) |
378 |
0.91 |
| chr2_189843684_189844024 | 0.11 |
ENSG00000221502 |
. |
1036 |
0.57 |
| chr18_10378310_10378461 | 0.11 |
ENSG00000239031 |
. |
11612 |
0.27 |
| chr8_25364997_25365236 | 0.11 |
CDCA2 |
cell division cycle associated 2 |
48401 |
0.15 |
| chr8_145012479_145013719 | 0.11 |
PLEC |
plectin |
659 |
0.56 |
| chr14_91022372_91022523 | 0.11 |
ENSG00000252748 |
. |
9038 |
0.23 |
| chr11_22361977_22362128 | 0.11 |
CTD-2140G10.2 |
|
2261 |
0.27 |
| chrX_129401591_129402943 | 0.10 |
ZNF280C |
zinc finger protein 280C |
590 |
0.77 |
| chr7_134469694_134469845 | 0.10 |
CALD1 |
caldesmon 1 |
5340 |
0.32 |
| chr5_42944152_42944647 | 0.10 |
SEPP1 |
selenoprotein P, plasma, 1 |
56905 |
0.11 |
| chr13_24144834_24145038 | 0.10 |
TNFRSF19 |
tumor necrosis factor receptor superfamily, member 19 |
133 |
0.98 |
| chr18_18949298_18949449 | 0.10 |
GREB1L |
growth regulation by estrogen in breast cancer-like |
5819 |
0.24 |
| chr11_17365393_17365544 | 0.10 |
NCR3LG1 |
natural killer cell cytotoxicity receptor 3 ligand 1 |
7805 |
0.17 |
| chr17_3379316_3379539 | 0.10 |
ASPA |
aspartoacylase |
131 |
0.94 |
| chr14_104582609_104583337 | 0.10 |
ENSG00000207568 |
. |
769 |
0.59 |
| chr3_136674210_136674460 | 0.10 |
IL20RB |
interleukin 20 receptor beta |
2372 |
0.29 |
| chr20_32030739_32031661 | 0.10 |
SNTA1 |
syntrophin, alpha 1 |
498 |
0.77 |
| chr13_31506617_31506793 | 0.10 |
TEX26-AS1 |
TEX26 antisense RNA 1 |
16 |
0.63 |
| chr9_36780232_36780383 | 0.10 |
ENSG00000266255 |
. |
43289 |
0.16 |
| chr18_56121962_56122204 | 0.10 |
ENSG00000207778 |
. |
3777 |
0.21 |
| chr15_70877228_70877484 | 0.10 |
UACA |
uveal autoantigen with coiled-coil domains and ankyrin repeats |
117264 |
0.06 |
| chr2_109935421_109935606 | 0.10 |
ENSG00000265965 |
. |
5432 |
0.33 |
| chr3_112358958_112359194 | 0.10 |
CCDC80 |
coiled-coil domain containing 80 |
1040 |
0.62 |
| chr20_31980035_31980186 | 0.10 |
CDK5RAP1 |
CDK5 regulatory subunit associated protein 1 |
4771 |
0.2 |
| chr1_112862120_112862271 | 0.10 |
ENSG00000238761 |
. |
51431 |
0.14 |
| chr18_5456644_5456917 | 0.10 |
RP11-286N3.1 |
|
6846 |
0.24 |
| chr13_39939438_39939589 | 0.10 |
ENSG00000238408 |
. |
81840 |
0.11 |
| chr1_83809421_83809572 | 0.10 |
ENSG00000223231 |
. |
450064 |
0.01 |
| chr6_72178498_72178870 | 0.10 |
ENSG00000207827 |
. |
65360 |
0.11 |
| chr4_62239698_62239849 | 0.10 |
LPHN3 |
latrophilin 3 |
123066 |
0.07 |
| chr14_73203955_73204106 | 0.10 |
ENSG00000206751 |
. |
116009 |
0.06 |
| chr11_129061346_129061497 | 0.10 |
ARHGAP32 |
Rho GTPase activating protein 32 |
672 |
0.75 |
| chr6_85482826_85483217 | 0.10 |
TBX18 |
T-box 18 |
8784 |
0.3 |
| chr4_46392579_46392730 | 0.09 |
GABRA2 |
gamma-aminobutyric acid (GABA) A receptor, alpha 2 |
233 |
0.66 |
| chr2_98962891_98963586 | 0.09 |
AC092675.4 |
|
220 |
0.79 |
| chr12_65094854_65095005 | 0.09 |
AC025262.1 |
Mesenchymal stem cell protein DSC96; Uncharacterized protein |
4600 |
0.17 |
| chr6_766934_767097 | 0.09 |
EXOC2 |
exocyst complex component 2 |
73898 |
0.12 |
| chr9_80978023_80978174 | 0.09 |
PSAT1 |
phosphoserine aminotransferase 1 |
66039 |
0.14 |
| chr4_109093935_109094718 | 0.09 |
ENSG00000232021 |
. |
249 |
0.94 |
| chr17_53785965_53786128 | 0.09 |
TMEM100 |
transmembrane protein 100 |
13113 |
0.26 |
| chr11_78060225_78060376 | 0.09 |
GAB2 |
GRB2-associated binding protein 2 |
7374 |
0.19 |
| chr2_58250808_58250969 | 0.09 |
VRK2 |
vaccinia related kinase 2 |
22841 |
0.23 |
| chr13_49671623_49671774 | 0.09 |
ENSG00000199788 |
. |
2171 |
0.35 |
| chr6_116219645_116219796 | 0.09 |
FRK |
fyn-related kinase |
104215 |
0.08 |
| chr1_208382598_208382749 | 0.09 |
PLXNA2 |
plexin A2 |
34992 |
0.24 |
| chr12_115120954_115121265 | 0.09 |
TBX3 |
T-box 3 |
286 |
0.93 |
| chr2_13025402_13025553 | 0.09 |
ENSG00000264370 |
. |
147984 |
0.05 |
| chr18_65339031_65339182 | 0.09 |
DSEL |
dermatan sulfate epimerase-like |
154889 |
0.04 |
| chr10_72595926_72596153 | 0.09 |
SGPL1 |
sphingosine-1-phosphate lyase 1 |
8215 |
0.2 |
| chr2_56145290_56145441 | 0.09 |
EFEMP1 |
EGF containing fibulin-like extracellular matrix protein 1 |
4991 |
0.23 |
| chr7_14031804_14031996 | 0.09 |
ETV1 |
ets variant 1 |
850 |
0.71 |
| chr2_69240059_69240934 | 0.09 |
ANTXR1 |
anthrax toxin receptor 1 |
33 |
0.98 |
| chr1_38273956_38274902 | 0.09 |
C1orf122 |
chromosome 1 open reading frame 122 |
347 |
0.59 |
| chr17_47077532_47077683 | 0.09 |
IGF2BP1 |
insulin-like growth factor 2 mRNA binding protein 1 |
2499 |
0.14 |
| chr7_55089056_55089207 | 0.09 |
EGFR |
epidermal growth factor receptor |
2320 |
0.44 |
| chr1_218672576_218672996 | 0.09 |
C1orf143 |
chromosome 1 open reading frame 143 |
10652 |
0.26 |
| chr20_19956969_19957196 | 0.09 |
NAA20 |
N(alpha)-acetyltransferase 20, NatB catalytic subunit |
40678 |
0.16 |
| chr1_19890491_19890661 | 0.09 |
ENSG00000239027 |
. |
31808 |
0.11 |
| chr5_139135811_139135962 | 0.09 |
ENSG00000200756 |
. |
38211 |
0.14 |
| chr10_123559846_123559997 | 0.09 |
ENSG00000201884 |
. |
46194 |
0.16 |
| chr16_12968171_12968322 | 0.09 |
SHISA9 |
shisa family member 9 |
27231 |
0.17 |
| chr3_130445342_130445493 | 0.09 |
PIK3R4 |
phosphoinositide-3-kinase, regulatory subunit 4 |
615 |
0.81 |
| chr4_57737524_57737675 | 0.09 |
REST |
RE1-silencing transcription factor |
36476 |
0.12 |
| chr4_57479562_57479713 | 0.09 |
HOPX |
HOP homeobox |
42833 |
0.15 |
| chr1_156676036_156676613 | 0.09 |
CRABP2 |
cellular retinoic acid binding protein 2 |
716 |
0.47 |
| chr18_46470667_46471250 | 0.08 |
SMAD7 |
SMAD family member 7 |
3917 |
0.29 |
| chr10_65217250_65217401 | 0.08 |
JMJD1C-AS1 |
JMJD1C antisense RNA 1 |
7664 |
0.22 |
| chr15_77574490_77574641 | 0.08 |
PEAK1 |
pseudopodium-enriched atypical kinase 1 |
26671 |
0.24 |
| chr17_74713425_74713631 | 0.08 |
MXRA7 |
matrix-remodelling associated 7 |
6430 |
0.08 |
| chr2_114635332_114635622 | 0.08 |
ACTR3 |
ARP3 actin-related protein 3 homolog (yeast) |
12060 |
0.21 |
| chr8_124398923_124399125 | 0.08 |
ATAD2 |
ATPase family, AAA domain containing 2 |
9681 |
0.16 |
| chr19_57066223_57066374 | 0.08 |
AC007228.11 |
|
12482 |
0.12 |
| chr4_186159475_186159626 | 0.08 |
SNX25 |
sorting nexin 25 |
28317 |
0.16 |
| chr12_95557800_95557974 | 0.08 |
FGD6 |
FYVE, RhoGEF and PH domain containing 6 |
47138 |
0.13 |
| chr4_188040588_188040739 | 0.08 |
ENSG00000252382 |
. |
262053 |
0.02 |
| chr9_137967884_137968035 | 0.08 |
OLFM1 |
olfactomedin 1 |
447 |
0.88 |
| chr16_10216450_10216601 | 0.08 |
GRIN2A |
glutamate receptor, ionotropic, N-methyl D-aspartate 2A |
57743 |
0.14 |
| chr3_114803658_114803956 | 0.08 |
ZBTB20 |
zinc finger and BTB domain containing 20 |
13585 |
0.32 |
| chr9_74295565_74295716 | 0.08 |
TMEM2 |
transmembrane protein 2 |
24208 |
0.27 |
| chr10_11372412_11372563 | 0.08 |
CELF2-AS1 |
CELF2 antisense RNA 1 |
10640 |
0.29 |
| chr17_46671414_46671766 | 0.08 |
HOXB5 |
homeobox B5 |
267 |
0.75 |
| chr7_64166117_64166268 | 0.08 |
ZNF107 |
zinc finger protein 107 |
16459 |
0.25 |
| chr12_27717509_27717879 | 0.08 |
PPFIBP1 |
PTPRF interacting protein, binding protein 1 (liprin beta 1) |
26638 |
0.2 |
| chr14_85977416_85977567 | 0.08 |
RP11-497E19.2 |
Uncharacterized protein |
17452 |
0.24 |
| chr8_121255567_121255788 | 0.08 |
COL14A1 |
collagen, type XIV, alpha 1 |
46522 |
0.19 |
| chr2_80531135_80531286 | 0.08 |
LRRTM1 |
leucine rich repeat transmembrane neuronal 1 |
189 |
0.96 |
| chr21_26869722_26869873 | 0.08 |
ENSG00000238314 |
. |
27284 |
0.2 |
| chr11_65662993_65663440 | 0.08 |
FOSL1 |
FOS-like antigen 1 |
4674 |
0.08 |
| chr2_226989327_226989478 | 0.08 |
ENSG00000263363 |
. |
534107 |
0.0 |
| chr22_32226315_32226466 | 0.08 |
ENSG00000252909 |
. |
6834 |
0.18 |
| chr21_28891695_28891846 | 0.08 |
ADAMTS5 |
ADAM metallopeptidase with thrombospondin type 1 motif, 5 |
552938 |
0.0 |
| chr17_63738986_63739137 | 0.08 |
CEP112 |
centrosomal protein 112kDa |
7781 |
0.32 |
| chr15_99978934_99979109 | 0.08 |
RP11-20G13.2 |
|
37501 |
0.14 |
| chr16_73177494_73177661 | 0.08 |
C16orf47 |
chromosome 16 open reading frame 47 |
769 |
0.76 |
| chr10_11645069_11645220 | 0.08 |
RP11-138I18.1 |
|
8160 |
0.23 |
| chr22_45898330_45898748 | 0.08 |
FBLN1 |
fibulin 1 |
173 |
0.96 |
| chr5_137609759_137610630 | 0.08 |
GFRA3 |
GDNF family receptor alpha 3 |
60 |
0.96 |
| chr16_65152808_65153250 | 0.08 |
CDH11 |
cadherin 11, type 2, OB-cadherin (osteoblast) |
2804 |
0.44 |
| chr9_94609987_94610138 | 0.08 |
ROR2 |
receptor tyrosine kinase-like orphan receptor 2 |
101100 |
0.08 |
| chr1_113305688_113305839 | 0.08 |
FAM19A3 |
family with sequence similarity 19 (chemokine (C-C motif)-like), member A3 |
42564 |
0.1 |
| chr4_3287785_3287979 | 0.08 |
RGS12 |
regulator of G-protein signaling 12 |
22880 |
0.2 |
| chr17_4108461_4108643 | 0.08 |
ENSG00000207390 |
. |
12489 |
0.13 |
| chr3_24562978_24563646 | 0.08 |
ENSG00000265028 |
. |
386 |
0.87 |
| chrX_145612851_145613002 | 0.08 |
ENSG00000201594 |
. |
103836 |
0.08 |
| chr5_169398695_169398846 | 0.08 |
FAM196B |
family with sequence similarity 196, member B |
8974 |
0.26 |
| chr6_149368169_149368320 | 0.08 |
RP11-162J8.3 |
|
14535 |
0.25 |
| chr2_75071412_75071563 | 0.08 |
HK2 |
hexokinase 2 |
9190 |
0.26 |
| chr19_37129764_37129915 | 0.07 |
ZNF461 |
zinc finger protein 461 |
27886 |
0.11 |
| chr6_110092141_110092292 | 0.07 |
FIG4 |
FIG4 homolog, SAC1 lipid phosphatase domain containing (S. cerevisiae) |
4284 |
0.32 |
| chr2_33362321_33362472 | 0.07 |
LTBP1 |
latent transforming growth factor beta binding protein 1 |
2672 |
0.4 |
| chr20_50063008_50063250 | 0.07 |
ENSG00000266761 |
. |
6385 |
0.28 |
| chr17_48940296_48940587 | 0.07 |
TOB1 |
transducer of ERBB2, 1 |
3265 |
0.18 |
| chr11_12836551_12836790 | 0.07 |
RP11-47J17.3 |
|
8544 |
0.22 |
| chr13_60804762_60805082 | 0.07 |
ENSG00000202151 |
. |
42958 |
0.17 |
| chr7_33074071_33074368 | 0.07 |
NT5C3A |
5'-nucleotidase, cytosolic IIIA |
1362 |
0.38 |
| chr9_126487964_126488115 | 0.07 |
RP11-417B4.2 |
|
10677 |
0.27 |
| chr12_114841509_114841660 | 0.07 |
TBX5 |
T-box 5 |
119 |
0.97 |
| chr2_47397808_47397988 | 0.07 |
CALM2 |
calmodulin 2 (phosphorylase kinase, delta) |
5752 |
0.22 |
| chrX_3629951_3631442 | 0.07 |
PRKX |
protein kinase, X-linked |
953 |
0.63 |
| chr5_137946467_137946893 | 0.07 |
CTNNA1 |
catenin (cadherin-associated protein), alpha 1, 102kDa |
13 |
0.97 |
| chr6_2432850_2433042 | 0.07 |
ENSG00000266252 |
. |
23077 |
0.27 |
| chr1_207483226_207483573 | 0.07 |
CD55 |
CD55 molecule, decay accelerating factor for complement (Cromer blood group) |
11454 |
0.26 |
| chr15_79168875_79169112 | 0.07 |
MORF4L1 |
mortality factor 4 like 1 |
159 |
0.95 |
| chr19_37997163_37998354 | 0.07 |
ZNF793 |
zinc finger protein 793 |
83 |
0.53 |
| chr10_14920855_14921866 | 0.07 |
SUV39H2 |
suppressor of variegation 3-9 homolog 2 (Drosophila) |
439 |
0.82 |
| chr3_27574944_27575095 | 0.07 |
ENSG00000238912 |
. |
14330 |
0.2 |
| chr2_161274557_161274766 | 0.07 |
RBMS1 |
RNA binding motif, single stranded interacting protein 1 |
1972 |
0.35 |
| chr10_33619964_33620115 | 0.07 |
NRP1 |
neuropilin 1 |
3271 |
0.33 |
| chr4_30721317_30721851 | 0.07 |
PCDH7 |
protocadherin 7 |
453 |
0.9 |
| chr11_2224499_2224650 | 0.07 |
ENSG00000265258 |
. |
30281 |
0.09 |
| chr6_138427102_138427253 | 0.07 |
PERP |
PERP, TP53 apoptosis effector |
1471 |
0.51 |
| chrX_24414490_24414641 | 0.07 |
ENSG00000264746 |
. |
47639 |
0.14 |
| chr16_89983998_89984846 | 0.07 |
MC1R |
melanocortin 1 receptor (alpha melanocyte stimulating hormone receptor) |
135 |
0.9 |
| chr11_96438289_96438578 | 0.07 |
ENSG00000200411 |
. |
230577 |
0.02 |
| chr1_17871786_17871970 | 0.07 |
ARHGEF10L |
Rho guanine nucleotide exchange factor (GEF) 10-like |
5548 |
0.27 |
| chr5_119959781_119959971 | 0.07 |
PRR16 |
proline rich 16 |
7093 |
0.32 |
| chr5_78985270_78986298 | 0.07 |
CMYA5 |
cardiomyopathy associated 5 |
84 |
0.98 |
| chr7_142506835_142506986 | 0.07 |
PRSS3P2 |
protease, serine, 3 pseudogene 2 |
25779 |
0.15 |
| chr2_19807627_19807801 | 0.07 |
OSR1 |
odd-skipped related transciption factor 1 |
249300 |
0.02 |
| chr20_656076_656227 | 0.07 |
RP5-850E9.3 |
Uncharacterized protein |
293 |
0.74 |
| chr15_37402275_37402801 | 0.07 |
MEIS2 |
Meis homeobox 2 |
9034 |
0.23 |
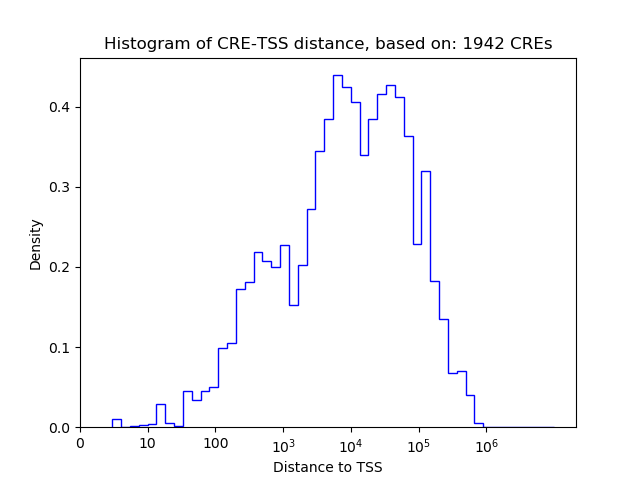
Histogram of CRE-TSS distances for CREs targeted by :
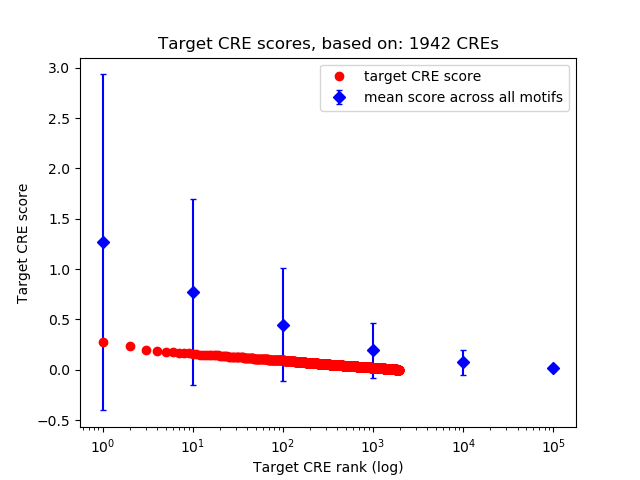
Rank distribution of CRE target scores:
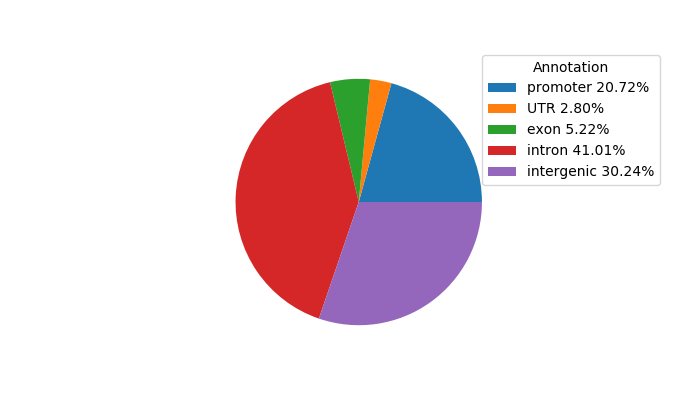
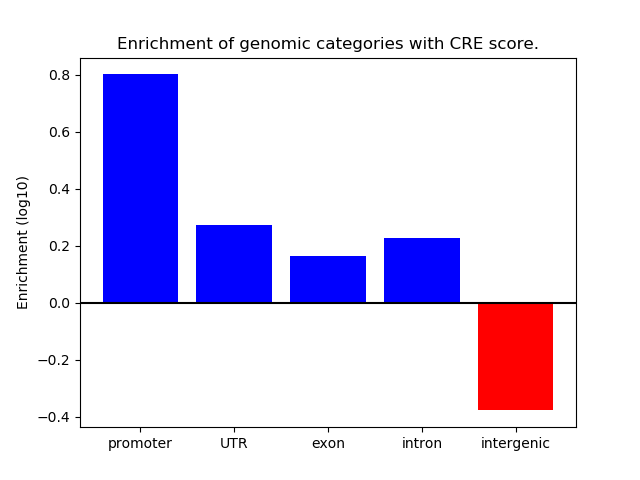
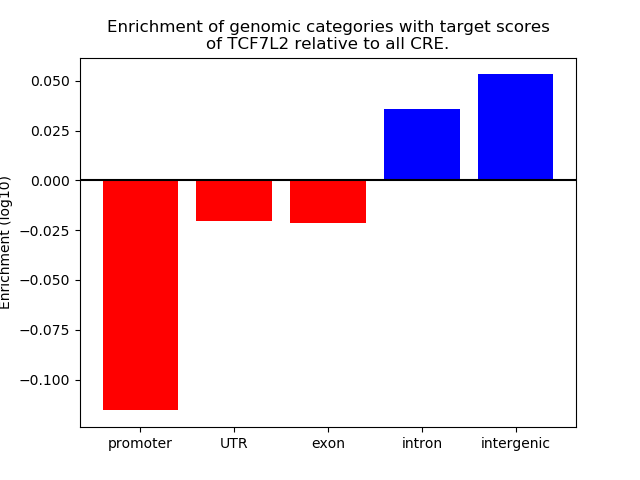
Distribution of target CREs across different genomic regions:
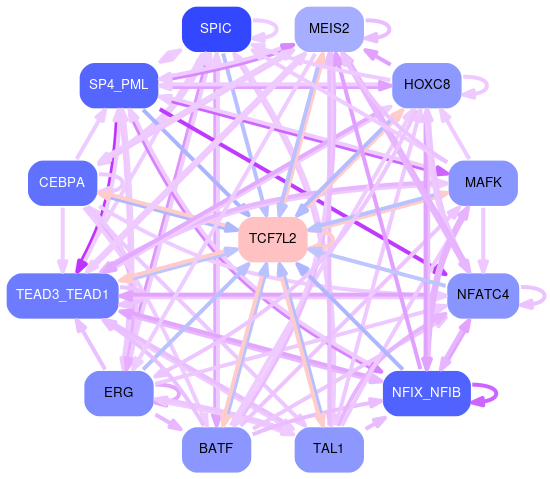
Network of associatons between targets according to the STRING database.

Gene Ontology Analysis
Gene overrepresentation in biological process category:
| Log-likelihood per target | Total log-likelihood | Term | Description |
|---|---|---|---|
| 0.0 | 0.1 | GO:0010159 | specification of organ position(GO:0010159) |
| 0.0 | 0.1 | GO:0035385 | Roundabout signaling pathway(GO:0035385) |
| 0.0 | 0.1 | GO:0006533 | aspartate metabolic process(GO:0006531) aspartate catabolic process(GO:0006533) |
| 0.0 | 0.1 | GO:0010757 | negative regulation of plasminogen activation(GO:0010757) |
| 0.0 | 0.1 | GO:0090037 | regulation of protein kinase C signaling(GO:0090036) positive regulation of protein kinase C signaling(GO:0090037) |
| 0.0 | 0.1 | GO:0060976 | coronary vasculature development(GO:0060976) |
| 0.0 | 0.1 | GO:2000095 | regulation of Wnt signaling pathway, planar cell polarity pathway(GO:2000095) |
| 0.0 | 0.1 | GO:0033088 | negative regulation of immature T cell proliferation(GO:0033087) negative regulation of immature T cell proliferation in thymus(GO:0033088) |
| 0.0 | 0.1 | GO:0015803 | branched-chain amino acid transport(GO:0015803) leucine transport(GO:0015820) |
| 0.0 | 0.1 | GO:0071692 | sequestering of extracellular ligand from receptor(GO:0035581) sequestering of TGFbeta in extracellular matrix(GO:0035583) protein localization to extracellular region(GO:0071692) maintenance of protein location in extracellular region(GO:0071694) extracellular regulation of signal transduction(GO:1900115) extracellular negative regulation of signal transduction(GO:1900116) |
| 0.0 | 0.1 | GO:0034629 | cellular protein complex localization(GO:0034629) |
| 0.0 | 0.2 | GO:0045880 | positive regulation of smoothened signaling pathway(GO:0045880) |
| 0.0 | 0.0 | GO:0001973 | adenosine receptor signaling pathway(GO:0001973) G-protein coupled purinergic receptor signaling pathway(GO:0035588) |
| 0.0 | 0.0 | GO:0070254 | mucus secretion(GO:0070254) |
| 0.0 | 0.1 | GO:0031340 | positive regulation of vesicle fusion(GO:0031340) |
| 0.0 | 0.0 | GO:0031223 | auditory behavior(GO:0031223) |
| 0.0 | 0.0 | GO:0042996 | regulation of Golgi to plasma membrane protein transport(GO:0042996) |
| 0.0 | 0.0 | GO:0060028 | convergent extension involved in axis elongation(GO:0060028) |
| 0.0 | 0.1 | GO:0018027 | peptidyl-lysine dimethylation(GO:0018027) |
| 0.0 | 0.1 | GO:0098876 | Golgi to plasma membrane transport(GO:0006893) vesicle-mediated transport to the plasma membrane(GO:0098876) |
| 0.0 | 0.0 | GO:0070141 | response to UV-A(GO:0070141) |
| 0.0 | 0.0 | GO:0008218 | bioluminescence(GO:0008218) |
| 0.0 | 0.0 | GO:0016199 | axon midline choice point recognition(GO:0016199) |
| 0.0 | 0.0 | GO:0043374 | CD8-positive, alpha-beta T cell activation(GO:0036037) CD8-positive, alpha-beta T cell differentiation(GO:0043374) |
| 0.0 | 0.0 | GO:0032224 | positive regulation of synaptic transmission, cholinergic(GO:0032224) |
Gene overrepresentation in cellular component category:
| Log-likelihood per target | Total log-likelihood | Term | Description |
|---|---|---|---|
| 0.0 | 0.0 | GO:0071664 | catenin-TCF7L2 complex(GO:0071664) |
| 0.0 | 0.1 | GO:0005606 | laminin-1 complex(GO:0005606) |
| 0.0 | 0.1 | GO:0016342 | catenin complex(GO:0016342) |
| 0.0 | 0.0 | GO:0045323 | interleukin-1 receptor complex(GO:0045323) |
Gene overrepresentation in molecular function category:
| Log-likelihood per target | Total log-likelihood | Term | Description |
|---|---|---|---|
| 0.0 | 0.1 | GO:0070052 | collagen V binding(GO:0070052) |
| 0.0 | 0.1 | GO:0005006 | epidermal growth factor-activated receptor activity(GO:0005006) |
| 0.0 | 0.1 | GO:0004862 | cAMP-dependent protein kinase inhibitor activity(GO:0004862) |
| 0.0 | 0.1 | GO:0048495 | Roundabout binding(GO:0048495) |
| 0.0 | 0.1 | GO:0004980 | melanocyte-stimulating hormone receptor activity(GO:0004980) |
| 0.0 | 0.2 | GO:0005031 | tumor necrosis factor-activated receptor activity(GO:0005031) |
| 0.0 | 0.1 | GO:0004046 | aminoacylase activity(GO:0004046) |
| 0.0 | 0.0 | GO:0008454 | alpha-1,3-mannosylglycoprotein 4-beta-N-acetylglucosaminyltransferase activity(GO:0008454) |
| 0.0 | 0.1 | GO:0055106 | ligase regulator activity(GO:0055103) ubiquitin-protein transferase regulator activity(GO:0055106) |
| 0.0 | 0.1 | GO:0047023 | androsterone dehydrogenase activity(GO:0047023) |
| 0.0 | 0.0 | GO:0050220 | prostaglandin-E synthase activity(GO:0050220) |
| 0.0 | 0.1 | GO:0008046 | axon guidance receptor activity(GO:0008046) |
| 0.0 | 0.0 | GO:0015016 | [heparan sulfate]-glucosamine N-sulfotransferase activity(GO:0015016) |
| 0.0 | 0.0 | GO:0004500 | dopamine beta-monooxygenase activity(GO:0004500) |
| 0.0 | 0.1 | GO:0045295 | gamma-catenin binding(GO:0045295) |
| 0.0 | 0.1 | GO:0017154 | semaphorin receptor activity(GO:0017154) |
| 0.0 | 0.1 | GO:0070700 | BMP receptor binding(GO:0070700) |
| 0.0 | 0.1 | GO:0008503 | benzodiazepine receptor activity(GO:0008503) |
| 0.0 | 0.1 | GO:0015057 | thrombin receptor activity(GO:0015057) |
Gene overrepresentation in curated gene sets: canonical pathways category:
| Log-likelihood per target | Total log-likelihood | Term | Description |
|---|---|---|---|
| 0.0 | 0.0 | PID ECADHERIN KERATINOCYTE PATHWAY | E-cadherin signaling in keratinocytes |