Project
ENCODE: H3K4me3 ChIP-Seq of different mouse tissues during embryonic development
Navigation
Downloads

Results for Glis1
Z-value: 0.25
Motif logo
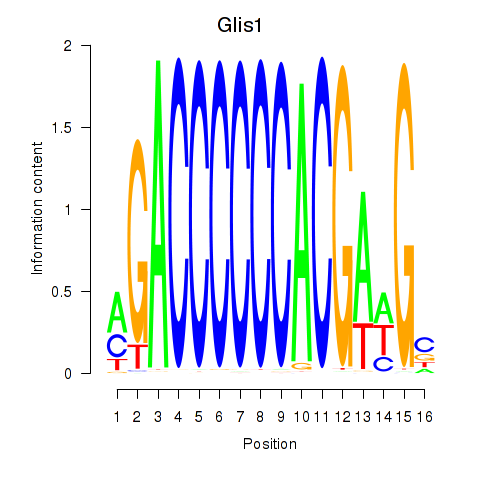
Transcription factors associated with Glis1
| Gene Symbol | Gene ID | Gene Info |
|---|---|---|
|
Glis1
|
ENSMUSG00000034762.3 | GLIS family zinc finger 1 |
Correlations of motif activity and signal intensity at CREs associated with the motif's TFs:
This plot shows correlation between observed signal intensity of a CRE associated with the transcription factor across all samples and activity of the motif.
For each TF, only the top 5 correlated CREs are shown.
| CRE | Gene | Distance | Association probability | Pearson corr. coef. | P-value | Plot |
|---|---|---|---|---|---|---|
| chr4_107457367_107458506 | Glis1 | 18938 | 0.161467 | -0.63 | 7.7e-08 | Click! |
| chr4_107458555_107458755 | Glis1 | 19657 | 0.160617 | -0.48 | 1.1e-04 | Click! |
| chr4_107459273_107459544 | Glis1 | 20410 | 0.159631 | -0.43 | 5.8e-04 | Click! |
| chr4_107458870_107459029 | Glis1 | 19951 | 0.160263 | -0.42 | 8.2e-04 | Click! |
| chr4_107443262_107443753 | Glis1 | 4509 | 0.193722 | -0.41 | 1.2e-03 | Click! |
Activity of the Glis1 motif across conditions
Conditions sorted by the z-value of the Glis1 motif activity
Move your cursor over a bar to see sample name and corresponding Z-value.
Top target CREs of the motif:
| Cis Regulatory Element (CRE) | Target Score | Top associated gene | Gene Info | Distance of CRE to TSS | CRE/Gene association probability |
|---|---|---|---|---|---|
| chr1_84694736_84695168 | 1.31 |
Mir5126 |
microRNA 5126 |
887 |
0.41 |
| chr1_134232926_134233818 | 1.07 |
Adora1 |
adenosine A1 receptor |
1206 |
0.39 |
| chr10_76960868_76961875 | 0.81 |
Pcbp3 |
poly(rC) binding protein 3 |
417 |
0.81 |
| chr8_117259792_117260803 | 0.81 |
Cmip |
c-Maf inducing protein |
3180 |
0.33 |
| chr10_77339253_77340474 | 0.74 |
Adarb1 |
adenosine deaminase, RNA-specific, B1 |
313 |
0.91 |
| chrX_60891819_60892374 | 0.60 |
Sox3 |
SRY (sex determining region Y)-box 3 |
1334 |
0.33 |
| chr18_64931481_64931680 | 0.59 |
Nedd4l |
neural precursor cell expressed, developmentally down-regulated gene 4-like |
10451 |
0.21 |
| chr15_45114048_45115133 | 0.56 |
Kcnv1 |
potassium channel, subfamily V, member 1 |
237 |
0.95 |
| chrX_74328574_74328761 | 0.55 |
Plxna3 |
plexin A3 |
399 |
0.64 |
| chr7_4546391_4547839 | 0.48 |
Syt5 |
synaptotagmin V |
142 |
0.89 |
| chr9_112231189_112232055 | 0.47 |
Arpp21 |
cyclic AMP-regulated phosphoprotein, 21 |
280 |
0.9 |
| chr5_52114654_52115728 | 0.46 |
Gm43177 |
predicted gene 43177 |
2121 |
0.23 |
| chr9_47688636_47688874 | 0.37 |
Gm47198 |
predicted gene, 47198 |
82386 |
0.09 |
| chr7_47357377_47358685 | 0.33 |
Mrgpra1 |
MAS-related GPR, member A1 |
3791 |
0.17 |
| chr1_120340233_120341796 | 0.32 |
C1ql2 |
complement component 1, q subcomponent-like 2 |
432 |
0.88 |
| chr4_141623201_141623679 | 0.32 |
Slc25a34 |
solute carrier family 25, member 34 |
381 |
0.76 |
| chr5_33234965_33235220 | 0.28 |
Ctbp1 |
C-terminal binding protein 1 |
14158 |
0.14 |
| chr15_36790299_36790969 | 0.26 |
Ywhaz |
tyrosine 3-monooxygenase/tryptophan 5-monooxygenase activation protein, zeta polypeptide |
1780 |
0.3 |
| chr17_47759581_47759790 | 0.25 |
Tfeb |
transcription factor EB |
510 |
0.69 |
| chr4_82481887_82482038 | 0.24 |
Nfib |
nuclear factor I/B |
17354 |
0.19 |
| chr4_147969208_147969498 | 0.23 |
Nppb |
natriuretic peptide type B |
16435 |
0.09 |
| chr3_92689234_92689738 | 0.20 |
Gm4202 |
predicted gene 4202 |
60 |
0.92 |
| chr3_87763267_87765638 | 0.18 |
Pear1 |
platelet endothelial aggregation receptor 1 |
2238 |
0.23 |
| chr16_35155941_35156382 | 0.18 |
Adcy5 |
adenylate cyclase 5 |
1284 |
0.52 |
| chr5_27048872_27050274 | 0.16 |
Dpp6 |
dipeptidylpeptidase 6 |
180 |
0.97 |
| chr11_3289715_3290157 | 0.16 |
Patz1 |
POZ (BTB) and AT hook containing zinc finger 1 |
57 |
0.96 |
| chr9_41582824_41584205 | 0.16 |
Mir125b-1 |
microRNA 125b-1 |
1588 |
0.2 |
| chr10_77589724_77589999 | 0.14 |
Pttg1ip |
pituitary tumor-transforming 1 interacting protein |
467 |
0.67 |
| chr8_90347037_90348254 | 0.14 |
Tox3 |
TOX high mobility group box family member 3 |
481 |
0.89 |
| chr9_15043198_15043353 | 0.11 |
Panx1 |
pannexin 1 |
522 |
0.79 |
| chr16_91300793_91302112 | 0.10 |
Gm15966 |
predicted gene 15966 |
24288 |
0.11 |
| chr6_51438062_51438277 | 0.10 |
Nfe2l3 |
nuclear factor, erythroid derived 2, like 3 |
5420 |
0.17 |
| chrX_101418815_101419777 | 0.10 |
Zmym3 |
zinc finger, MYM-type 3 |
502 |
0.72 |
| chr9_120539607_120540979 | 0.10 |
Entpd3 |
ectonucleoside triphosphate diphosphohydrolase 3 |
475 |
0.72 |
| chr15_99673865_99674141 | 0.09 |
Asic1 |
acid-sensing (proton-gated) ion channel 1 |
1336 |
0.24 |
| chr10_67939481_67939695 | 0.09 |
Zfp365 |
zinc finger protein 365 |
26926 |
0.16 |
| chr10_40037096_40037418 | 0.09 |
Mfsd4b1 |
major facilitator superfamily domain containing 4B1 |
11989 |
0.12 |
| chr4_133887863_133888313 | 0.09 |
Rps6ka1 |
ribosomal protein S6 kinase polypeptide 1 |
291 |
0.84 |
| chr4_135569876_135571129 | 0.08 |
Grhl3 |
grainyhead like transcription factor 3 |
3128 |
0.19 |
| chr17_56159563_56159714 | 0.08 |
Tnfaip8l1 |
tumor necrosis factor, alpha-induced protein 8-like 1 |
2839 |
0.13 |
| chr3_87971097_87972446 | 0.07 |
Nes |
nestin |
642 |
0.51 |
| chr17_37045646_37045989 | 0.07 |
Gabbr1 |
gamma-aminobutyric acid (GABA) B receptor, 1 |
149 |
0.9 |
| chr7_4780097_4780248 | 0.07 |
Il11 |
interleukin 11 |
2031 |
0.13 |
| chr16_25407334_25407877 | 0.06 |
Gm18896 |
predicted gene, 18896 |
35668 |
0.22 |
| chr17_27039067_27039218 | 0.06 |
Ggnbp1 |
gametogenetin binding protein 1 |
6283 |
0.1 |
| chr2_31653889_31654934 | 0.06 |
Gm13424 |
predicted gene 13424 |
6059 |
0.11 |
| chr9_96437149_96438639 | 0.05 |
BC043934 |
cDNA sequence BC043934 |
244 |
0.9 |
| chr19_56721512_56724019 | 0.05 |
Adrb1 |
adrenergic receptor, beta 1 |
566 |
0.72 |
| chr15_85498204_85498365 | 0.05 |
7530416G11Rik |
RIKEN cDNA 7530416G11 gene |
4943 |
0.21 |
| chr17_56007063_56007232 | 0.04 |
Mpnd |
MPN domain containing |
1436 |
0.18 |
| chr11_77461921_77463199 | 0.04 |
Coro6 |
coronin 6 |
85 |
0.96 |
| chr4_156218489_156218788 | 0.04 |
Perm1 |
PPARGC1 and ESRR induced regulator, muscle 1 |
2770 |
0.12 |
| chr8_3493164_3494008 | 0.04 |
Zfp358 |
zinc finger protein 358 |
416 |
0.72 |
| chr12_86678734_86679882 | 0.04 |
Vash1 |
vasohibin 1 |
608 |
0.67 |
| chr10_99106796_99107039 | 0.03 |
Poc1b |
POC1 centriolar protein B |
119 |
0.91 |
| chr9_37527353_37531611 | 0.03 |
Esam |
endothelial cell-specific adhesion molecule |
701 |
0.51 |
| chr14_118415886_118416037 | 0.03 |
Gm5672 |
predicted gene 5672 |
39767 |
0.12 |
| chr7_69490962_69491246 | 0.03 |
Gm38584 |
predicted gene, 38584 |
303 |
0.89 |
| chr11_98294715_98295282 | 0.03 |
Gm20644 |
predicted gene 20644 |
9616 |
0.1 |
| chrX_151046950_151048159 | 0.03 |
Fgd1 |
FYVE, RhoGEF and PH domain containing 1 |
384 |
0.84 |
| chr9_77568953_77569104 | 0.02 |
Gm25250 |
predicted gene, 25250 |
8686 |
0.15 |
| chr1_75449862_75451492 | 0.02 |
Asic4 |
acid-sensing (proton-gated) ion channel family member 4 |
22 |
0.95 |
| chr7_16046118_16046491 | 0.02 |
Bicra |
BRD4 interacting chromatin remodeling complex associated protein |
1617 |
0.28 |
| chr17_47974557_47975659 | 0.02 |
Gm14871 |
predicted gene 14871 |
28464 |
0.11 |
| chr8_104602083_104602837 | 0.02 |
Cdh16 |
cadherin 16 |
10804 |
0.09 |
| chr4_133011887_133012436 | 0.02 |
Ahdc1 |
AT hook, DNA binding motif, containing 1 |
43 |
0.97 |
| chr4_88012278_88012656 | 0.01 |
Mllt3 |
myeloid/lymphoid or mixed-lineage leukemia; translocated to, 3 |
20346 |
0.16 |
| chr2_58566360_58567217 | 0.01 |
Acvr1 |
activin A receptor, type 1 |
38 |
0.91 |
| chr4_140702801_140703286 | 0.01 |
Rcc2 |
regulator of chromosome condensation 2 |
1570 |
0.26 |
| chr17_66443636_66444700 | 0.01 |
Mtcl1 |
microtubule crosslinking factor 1 |
4201 |
0.18 |
| chr7_67952842_67953773 | 0.01 |
Igf1r |
insulin-like growth factor I receptor |
480 |
0.84 |
| chr18_68870761_68871683 | 0.01 |
Gm50260 |
predicted gene, 50260 |
65864 |
0.12 |
| chr2_23069108_23069648 | 0.01 |
Acbd5 |
acyl-Coenzyme A binding domain containing 5 |
51 |
0.97 |
| chr13_24936981_24938020 | 0.01 |
9330162012Rik |
cDNA RIKEN 9330162012 gene |
99 |
0.58 |
| chr2_93955897_93957365 | 0.01 |
Gm13889 |
predicted gene 13889 |
418 |
0.79 |
| chr1_172126792_172127154 | 0.01 |
Pex19 |
peroxisomal biogenesis factor 19 |
200 |
0.88 |
| chr15_93824709_93825690 | 0.00 |
Gm49445 |
predicted gene, 49445 |
161 |
0.97 |
| chr6_8509479_8509788 | 0.00 |
Glcci1 |
glucocorticoid induced transcript 1 |
33 |
0.9 |
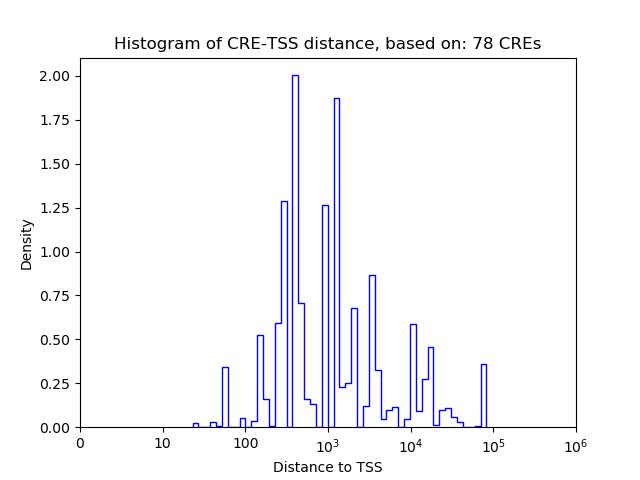
Histogram of CRE-TSS distances for CREs targeted by :
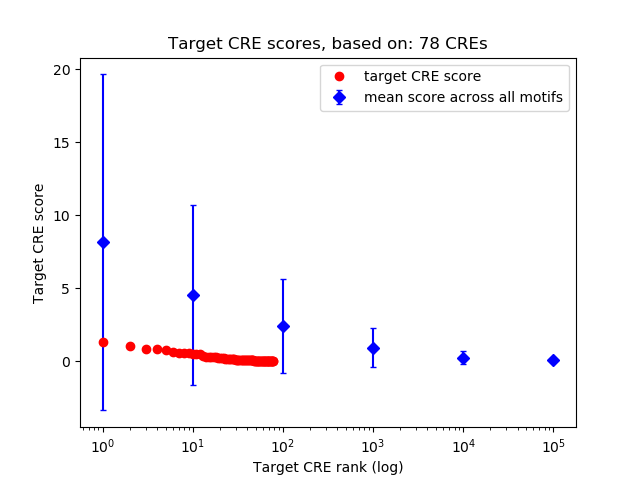
Rank distribution of CRE target scores:
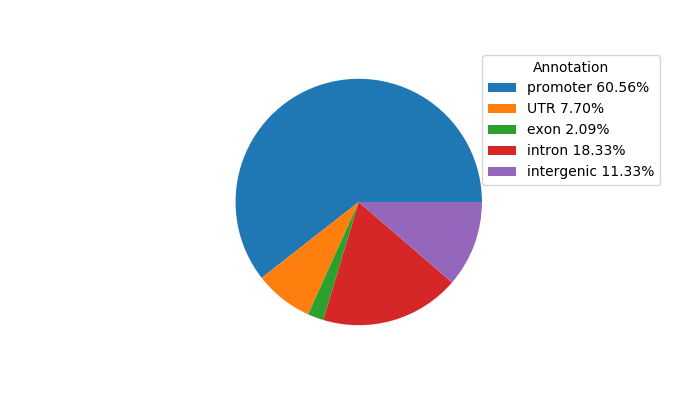
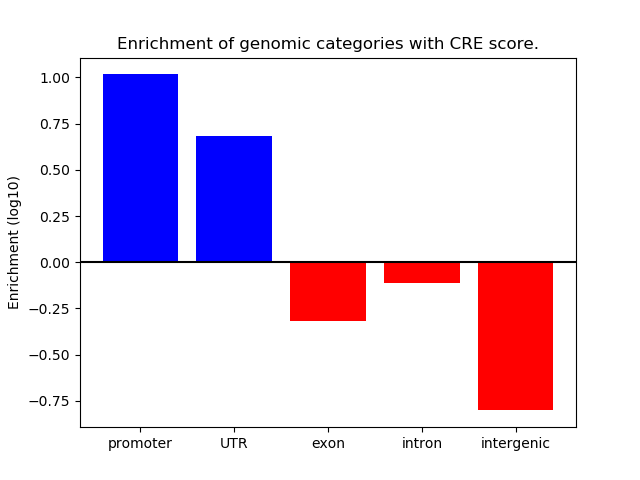
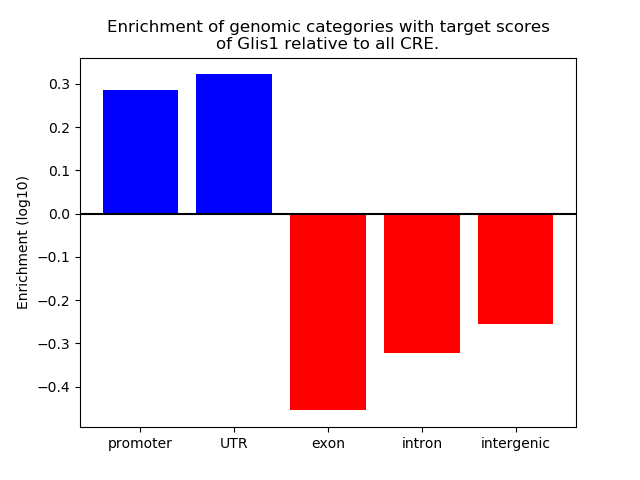
Distribution of target CREs across different genomic regions:
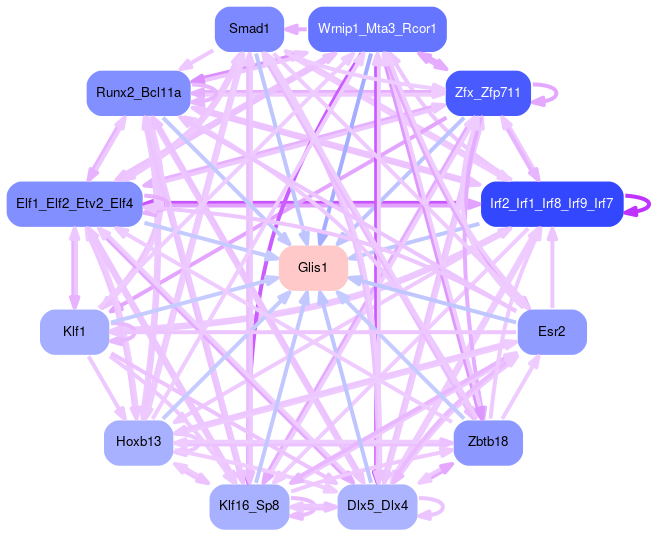
Network of associatons between targets according to the STRING database.

Gene Ontology Analysis
Gene overrepresentation in biological process category:
| Log-likelihood per target | Total log-likelihood | Term | Description |
|---|---|---|---|
| 0.2 | 0.7 | GO:0006382 | adenosine to inosine editing(GO:0006382) |
| 0.1 | 0.4 | GO:0055118 | negative regulation of cardiac muscle contraction(GO:0055118) |
| 0.1 | 0.4 | GO:0021637 | trigeminal nerve morphogenesis(GO:0021636) trigeminal nerve structural organization(GO:0021637) |
| 0.1 | 0.4 | GO:0007220 | Notch receptor processing(GO:0007220) |
| 0.0 | 0.1 | GO:0050717 | positive regulation of interleukin-1 alpha secretion(GO:0050717) |
| 0.0 | 0.1 | GO:2001286 | regulation of caveolin-mediated endocytosis(GO:2001286) |
| 0.0 | 0.4 | GO:0048488 | synaptic vesicle endocytosis(GO:0048488) |
| 0.0 | 0.1 | GO:0090168 | Golgi reassembly(GO:0090168) |
| 0.0 | 0.1 | GO:1902915 | negative regulation of protein K63-linked ubiquitination(GO:1900045) negative regulation of protein polyubiquitination(GO:1902915) |
| 0.0 | 0.1 | GO:0007195 | adenylate cyclase-inhibiting dopamine receptor signaling pathway(GO:0007195) |
| 0.0 | 0.0 | GO:0014873 | response to muscle activity involved in regulation of muscle adaptation(GO:0014873) |
| 0.0 | 0.1 | GO:0033602 | negative regulation of gamma-aminobutyric acid secretion(GO:0014053) negative regulation of dopamine secretion(GO:0033602) |
| 0.0 | 0.1 | GO:2000491 | positive regulation of hepatic stellate cell activation(GO:2000491) |
| 0.0 | 0.2 | GO:0021854 | hypothalamus development(GO:0021854) |
| 0.0 | 0.0 | GO:0043152 | induction of bacterial agglutination(GO:0043152) |
| 0.0 | 0.4 | GO:0034605 | cellular response to heat(GO:0034605) |
| 0.0 | 0.0 | GO:0002025 | vasodilation by norepinephrine-epinephrine involved in regulation of systemic arterial blood pressure(GO:0002025) positive regulation of renin secretion into blood stream(GO:1900135) |
| 0.0 | 0.0 | GO:0060486 | Clara cell differentiation(GO:0060486) |
Gene overrepresentation in cellular component category:
| Log-likelihood per target | Total log-likelihood | Term | Description |
|---|---|---|---|
| 0.0 | 0.4 | GO:0002116 | semaphorin receptor complex(GO:0002116) |
| 0.0 | 0.4 | GO:0031045 | dense core granule(GO:0031045) |
| 0.0 | 0.4 | GO:0032279 | asymmetric synapse(GO:0032279) |
| 0.0 | 0.1 | GO:0097648 | G-protein coupled receptor dimeric complex(GO:0038037) G-protein coupled receptor complex(GO:0097648) |
| 0.0 | 0.0 | GO:0071008 | U2-type post-mRNA release spliceosomal complex(GO:0071008) |
Gene overrepresentation in molecular function category:
| Log-likelihood per target | Total log-likelihood | Term | Description |
|---|---|---|---|
| 0.2 | 0.7 | GO:0003726 | double-stranded RNA adenosine deaminase activity(GO:0003726) |
| 0.2 | 0.7 | GO:1990829 | C-rich single-stranded DNA binding(GO:1990829) |
| 0.1 | 0.4 | GO:0001609 | G-protein coupled adenosine receptor activity(GO:0001609) |
| 0.0 | 0.4 | GO:0017154 | semaphorin receptor activity(GO:0017154) |
| 0.0 | 0.1 | GO:0034056 | estrogen response element binding(GO:0034056) |
| 0.0 | 0.4 | GO:0005112 | Notch binding(GO:0005112) |
| 0.0 | 0.1 | GO:0019871 | sodium channel inhibitor activity(GO:0019871) |
| 0.0 | 0.1 | GO:0004965 | G-protein coupled GABA receptor activity(GO:0004965) |
| 0.0 | 0.1 | GO:0008294 | calcium- and calmodulin-responsive adenylate cyclase activity(GO:0008294) |
| 0.0 | 0.5 | GO:0005251 | delayed rectifier potassium channel activity(GO:0005251) |
| 0.0 | 0.0 | GO:0004939 | beta-adrenergic receptor activity(GO:0004939) |
| 0.0 | 0.3 | GO:0001106 | RNA polymerase II transcription corepressor activity(GO:0001106) |
Gene overrepresentation in curated gene sets: REACTOME pathways category:
| Log-likelihood per target | Total log-likelihood | Term | Description |
|---|---|---|---|
| 0.0 | 0.4 | REACTOME NUCLEOTIDE LIKE PURINERGIC RECEPTORS | Genes involved in Nucleotide-like (purinergic) receptors |
| 0.0 | 0.4 | REACTOME SEMA3A PLEXIN REPULSION SIGNALING BY INHIBITING INTEGRIN ADHESION | Genes involved in SEMA3A-Plexin repulsion signaling by inhibiting Integrin adhesion |
| 0.0 | 0.4 | REACTOME ACTIVATED NOTCH1 TRANSMITS SIGNAL TO THE NUCLEUS | Genes involved in Activated NOTCH1 Transmits Signal to the Nucleus |
| 0.0 | 0.5 | REACTOME VOLTAGE GATED POTASSIUM CHANNELS | Genes involved in Voltage gated Potassium channels |