Project
ENCODE: H3K4me3 ChIP-Seq of different mouse tissues during embryonic development
Navigation
Downloads

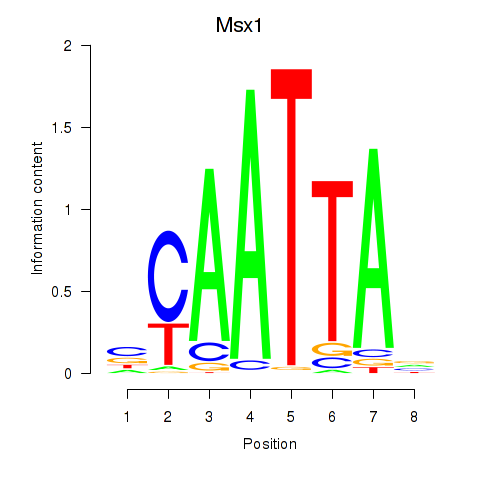
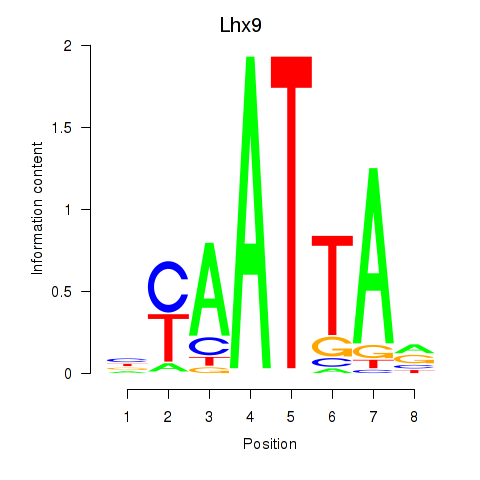
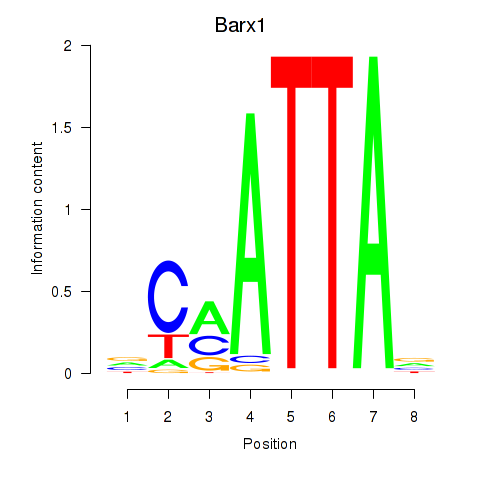
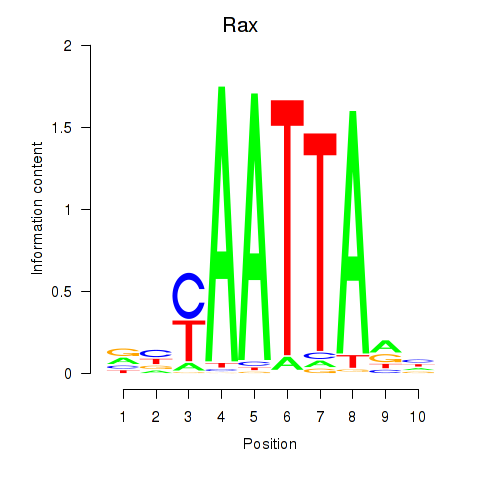
Results for Msx1_Lhx9_Barx1_Rax_Dlx6
Z-value: 0.03
Motif logo
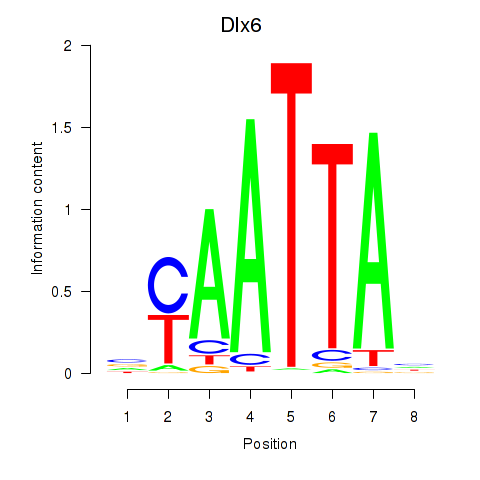
Transcription factors associated with Msx1_Lhx9_Barx1_Rax_Dlx6
| Gene Symbol | Gene ID | Gene Info |
|---|---|---|
|
Msx1
|
ENSMUSG00000048450.10 | msh homeobox 1 |
|
Lhx9
|
ENSMUSG00000019230.8 | LIM homeobox protein 9 |
|
Barx1
|
ENSMUSG00000021381.4 | BarH-like homeobox 1 |
|
Rax
|
ENSMUSG00000024518.3 | retina and anterior neural fold homeobox |
|
Dlx6
|
ENSMUSG00000029754.7 | distal-less homeobox 6 |
Correlations of motif activity and signal intensity at CREs associated with the motif's TFs:
This plot shows correlation between observed signal intensity of a CRE associated with the transcription factor across all samples and activity of the motif.
For each TF, only the top 5 correlated CREs are shown.
| CRE | Gene | Distance | Association probability | Pearson corr. coef. | P-value | Plot |
|---|---|---|---|---|---|---|
| chr13_48705941_48707011 | Barx1 | 43478 | 0.123843 | -0.52 | 2.3e-05 | Click! |
| chr13_48653777_48653928 | Barx1 | 9146 | 0.164548 | -0.40 | 1.6e-03 | Click! |
| chr13_48672349_48673068 | Barx1 | 9710 | 0.181755 | -0.37 | 3.5e-03 | Click! |
| chr13_48690152_48690303 | Barx1 | 27229 | 0.156064 | -0.36 | 4.4e-03 | Click! |
| chr13_48662411_48662862 | Barx1 | 362 | 0.861298 | -0.36 | 4.5e-03 | Click! |
| chr6_6863311_6863498 | Dlx6 | 70 | 0.942139 | -0.57 | 2.4e-06 | Click! |
| chr6_6862423_6863134 | Dlx6 | 556 | 0.564015 | -0.56 | 4.1e-06 | Click! |
| chr6_6863513_6864355 | Dlx6 | 136 | 0.908655 | -0.49 | 7.4e-05 | Click! |
| chr1_138837882_138838896 | Lhx9 | 4040 | 0.177311 | -0.62 | 1.1e-07 | Click! |
| chr1_138836757_138837880 | Lhx9 | 3659 | 0.185652 | -0.56 | 3.4e-06 | Click! |
| chr1_138839332_138840406 | Lhx9 | 2560 | 0.219839 | -0.55 | 4.9e-06 | Click! |
| chr1_138845983_138846955 | Lhx9 | 1110 | 0.419252 | -0.54 | 7.7e-06 | Click! |
| chr1_138840955_138842561 | Lhx9 | 671 | 0.633639 | -0.53 | 1.4e-05 | Click! |
| chr5_37821115_37822599 | Msx1 | 2725 | 0.276938 | -0.47 | 1.5e-04 | Click! |
| chr5_37822743_37822894 | Msx1 | 1764 | 0.368392 | -0.43 | 6.7e-04 | Click! |
| chr5_37826544_37829286 | Msx1 | 3332 | 0.253918 | -0.39 | 1.8e-03 | Click! |
| chr5_37825667_37826469 | Msx1 | 1485 | 0.421691 | -0.34 | 7.9e-03 | Click! |
| chr5_37816984_37817928 | Msx1 | 7126 | 0.201534 | -0.34 | 8.1e-03 | Click! |
| chr18_65937605_65939242 | Rax | 305 | 0.714707 | -0.32 | 1.4e-02 | Click! |
| chr18_65941567_65941718 | Rax | 1855 | 0.183964 | -0.29 | 2.5e-02 | Click! |
| chr18_65941284_65941553 | Rax | 1631 | 0.207199 | -0.24 | 6.8e-02 | Click! |
| chr18_65939857_65940008 | Rax | 145 | 0.905969 | -0.17 | 2.0e-01 | Click! |
Activity of the Msx1_Lhx9_Barx1_Rax_Dlx6 motif across conditions
Conditions sorted by the z-value of the Msx1_Lhx9_Barx1_Rax_Dlx6 motif activity
Move your cursor over a bar to see sample name and corresponding Z-value.
Top target CREs of the motif:
| Cis Regulatory Element (CRE) | Target Score | Top associated gene | Gene Info | Distance of CRE to TSS | CRE/Gene association probability |
|---|---|---|---|---|---|
| chr19_45446379_45446948 | 0.02 |
Btrc |
beta-transducin repeat containing protein |
1155 |
0.47 |
| chr1_165765873_165766425 | 0.01 |
Creg1 |
cellular repressor of E1A-stimulated genes 1 |
2403 |
0.15 |
| chr17_71267820_71268552 | 0.01 |
Emilin2 |
elastin microfibril interfacer 2 |
411 |
0.81 |
| chr8_122697299_122697450 | 0.01 |
Gm10612 |
predicted gene 10612 |
486 |
0.63 |
| chr6_72109159_72109629 | 0.01 |
Gm29438 |
predicted gene 29438 |
5193 |
0.13 |
| chr18_84858127_84859558 | 0.01 |
Gm16146 |
predicted gene 16146 |
705 |
0.62 |
| chr7_28432065_28432228 | 0.01 |
Samd4b |
sterile alpha motif domain containing 4B |
4045 |
0.1 |
| chr12_40034316_40035114 | 0.01 |
Arl4a |
ADP-ribosylation factor-like 4A |
2652 |
0.25 |
| chr11_107337425_107337975 | 0.01 |
Pitpnc1 |
phosphatidylinositol transfer protein, cytoplasmic 1 |
63 |
0.82 |
| chr4_109475656_109476957 | 0.01 |
Rnf11 |
ring finger protein 11 |
369 |
0.86 |
| chr6_90324065_90325476 | 0.01 |
Chst13 |
carbohydrate sulfotransferase 13 |
415 |
0.73 |
| chr13_90844060_90844211 | 0.01 |
Gm18518 |
predicted gene, 18518 |
23471 |
0.19 |
| chr15_102998770_103001153 | 0.01 |
Hoxc6 |
homeobox C6 |
568 |
0.54 |
| chr12_63141893_63142044 | 0.01 |
Gm48415 |
predicted gene, 48415 |
28213 |
0.23 |
| chr10_127524483_127527059 | 0.01 |
Shmt2 |
serine hydroxymethyltransferase 2 (mitochondrial) |
3327 |
0.13 |
| chr12_21286427_21286936 | 0.00 |
Cpsf3 |
cleavage and polyadenylation specificity factor 3 |
282 |
0.56 |
| chr5_137981579_137981833 | 0.00 |
Azgp1 |
alpha-2-glycoprotein 1, zinc |
138 |
0.91 |
| chr6_120579351_120580579 | 0.00 |
Gm44124 |
predicted gene, 44124 |
211 |
0.9 |
| chrX_36561829_36562111 | 0.00 |
Pgrmc1 |
progesterone receptor membrane component 1 |
36236 |
0.15 |
| chr5_122499512_122499696 | 0.00 |
Atp2a2 |
ATPase, Ca++ transporting, cardiac muscle, slow twitch 2 |
2013 |
0.17 |
| chr4_59292243_59292651 | 0.00 |
Susd1 |
sushi domain containing 1 |
23519 |
0.17 |
| chr10_26861885_26862036 | 0.00 |
Arhgap18 |
Rho GTPase activating protein 18 |
1382 |
0.51 |
| chr16_55968878_55969045 | 0.00 |
Rpl24 |
ribosomal protein L24 |
1034 |
0.33 |
| chrX_74272032_74272366 | 0.00 |
Snora70 |
small nucleolar RNA, H/ACA box 70 |
285 |
0.49 |
| chr3_89251147_89252390 | 0.00 |
Krtcap2 |
keratinocyte associated protein 2 |
2901 |
0.08 |
| chr15_25623874_25624025 | 0.00 |
Myo10 |
myosin X |
1400 |
0.41 |
| chr17_27907820_27908197 | 0.00 |
Gm49801 |
predicted gene, 49801 |
205 |
0.55 |
| chr1_185204747_185204898 | 0.00 |
Rab3gap2 |
RAB3 GTPase activating protein subunit 2 |
644 |
0.65 |
| chr13_105223990_105224297 | 0.00 |
Gm25631 |
predicted gene, 25631 |
745 |
0.75 |
| chr4_49633576_49634072 | 0.00 |
Rnf20 |
ring finger protein 20 |
1665 |
0.35 |
| chr13_17798092_17798243 | 0.00 |
Cdk13 |
cyclin-dependent kinase 13 |
3164 |
0.17 |
| chr4_33248789_33249100 | 0.00 |
Pnrc1 |
proline-rich nuclear receptor coactivator 1 |
434 |
0.81 |
| chr15_7480037_7480275 | 0.00 |
Egflam |
EGF-like, fibronectin type III and laminin G domains |
81761 |
0.09 |
| chr13_83566010_83566411 | 0.00 |
Mef2c |
myocyte enhancer factor 2C |
6138 |
0.29 |
| chr12_71854490_71854641 | 0.00 |
Gm7985 |
predicted gene 7985 |
7274 |
0.22 |
| chr3_54732807_54733381 | 0.00 |
Exosc8 |
exosome component 8 |
129 |
0.94 |
| chr15_5235307_5235458 | 0.00 |
Ptger4 |
prostaglandin E receptor 4 (subtype EP4) |
7328 |
0.14 |
| chrX_74271838_74271989 | 0.00 |
Rpl10 |
ribosomal protein L10 |
76 |
0.84 |
| chr13_102546187_102546470 | 0.00 |
Gm29927 |
predicted gene, 29927 |
43957 |
0.17 |
| chr11_19941321_19941472 | 0.00 |
Spred2 |
sprouty-related EVH1 domain containing 2 |
13174 |
0.26 |
| chr4_117303729_117304908 | 0.00 |
Rnf220 |
ring finger protein 220 |
4290 |
0.15 |
| chr8_120289045_120289196 | 0.00 |
Gse1 |
genetic suppressor element 1, coiled-coil protein |
60664 |
0.1 |
| chr15_10685847_10685998 | 0.00 |
Rai14 |
retinoic acid induced 14 |
27618 |
0.16 |
| chr16_3887471_3887622 | 0.00 |
Naa60 |
N(alpha)-acetyltransferase 60, NatF catalytic subunit |
2777 |
0.11 |
| chr6_148831609_148831850 | 0.00 |
Ipo8 |
importin 8 |
262 |
0.49 |
| chr19_10828857_10829008 | 0.00 |
Cd6 |
CD6 antigen |
924 |
0.41 |
| chr2_30135275_30135623 | 0.00 |
Tbc1d13 |
TBC1 domain family, member 13 |
1581 |
0.23 |
| chr7_49915184_49916836 | 0.00 |
Slc6a5 |
solute carrier family 6 (neurotransmitter transporter, glycine), member 5 |
4310 |
0.29 |
| chr1_14208000_14208233 | 0.00 |
Eya1 |
EYA transcriptional coactivator and phosphatase 1 |
23376 |
0.18 |
| chr1_105666225_105666644 | 0.00 |
Relch |
RAB11 binding and LisH domain, coiled-coil and HEAT repeat containing |
1993 |
0.25 |
| chr7_4867774_4867925 | 0.00 |
Isoc2b |
isochorismatase domain containing 2b |
1656 |
0.18 |
| chr7_116092687_116092838 | 0.00 |
1700003G18Rik |
RIKEN cDNA 1700003G18 gene |
336 |
0.62 |
| chr16_93437966_93438557 | 0.00 |
1700029J03Rik |
RIKEN cDNA 1700029J03 gene |
12351 |
0.18 |
| chr7_112956295_112957421 | 0.00 |
Rassf10 |
Ras association (RalGDS/AF-6) domain family (N-terminal) member 10 |
2896 |
0.26 |
| chr15_83056191_83057345 | 0.00 |
Nfam1 |
Nfat activating molecule with ITAM motif 1 |
23462 |
0.11 |
| chr15_58818735_58818886 | 0.00 |
Gm24041 |
predicted gene, 24041 |
668 |
0.62 |
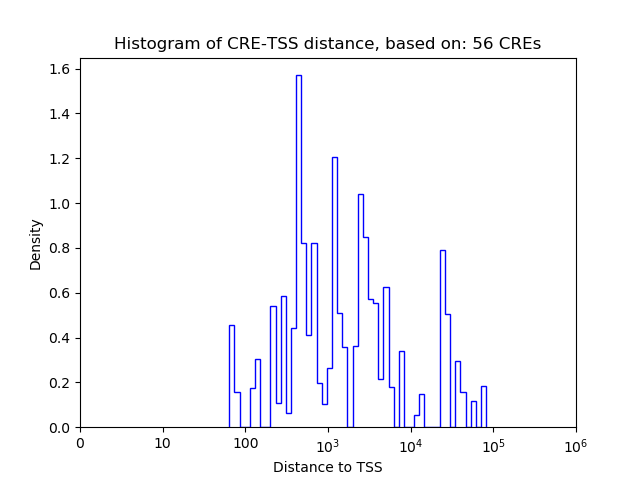
Histogram of CRE-TSS distances for CREs targeted by :
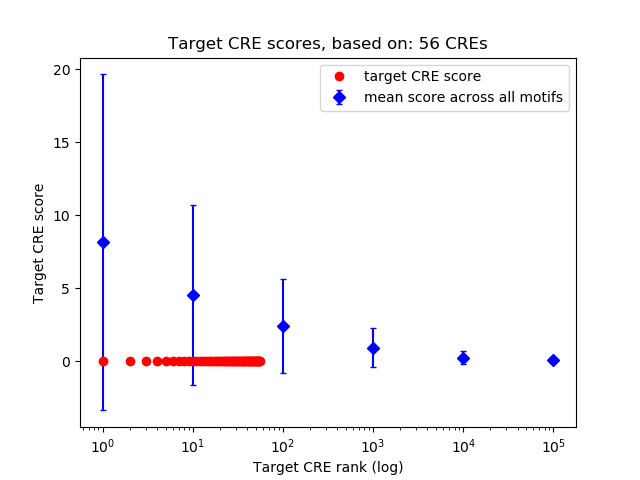
Rank distribution of CRE target scores:
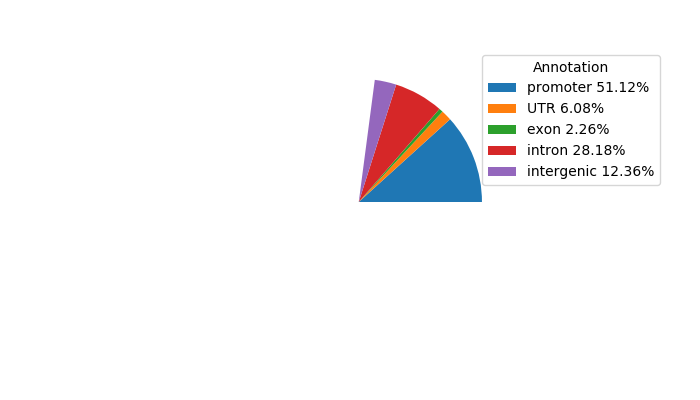
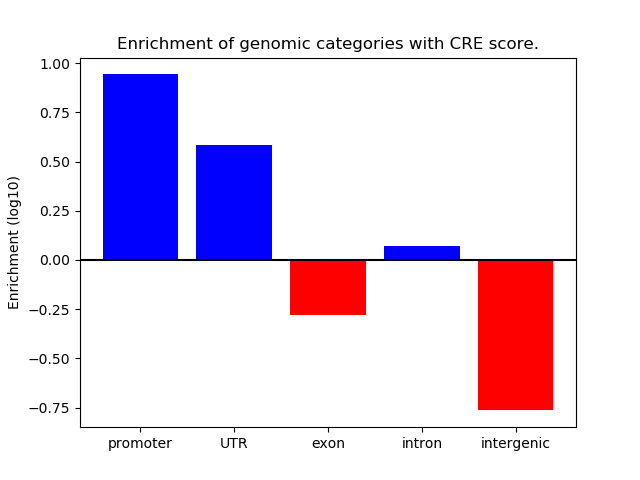
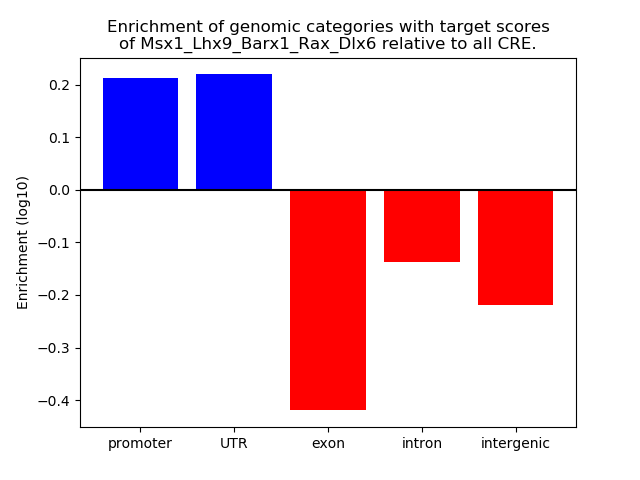
Distribution of target CREs across different genomic regions:
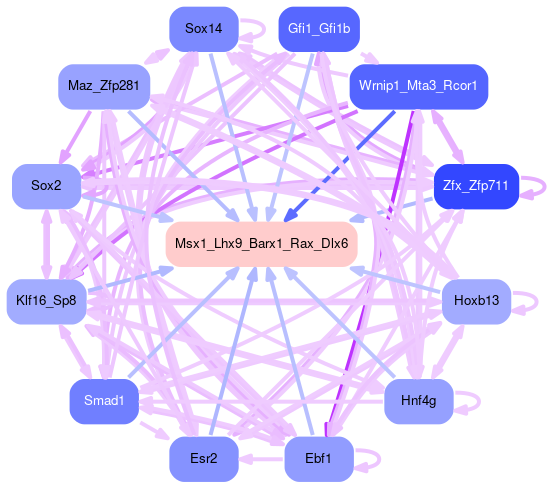
Network of associatons between targets according to the STRING database.
