Project
ENCODE: H3K4me3 ChIP-Seq of different mouse tissues during embryonic development
Navigation
Downloads

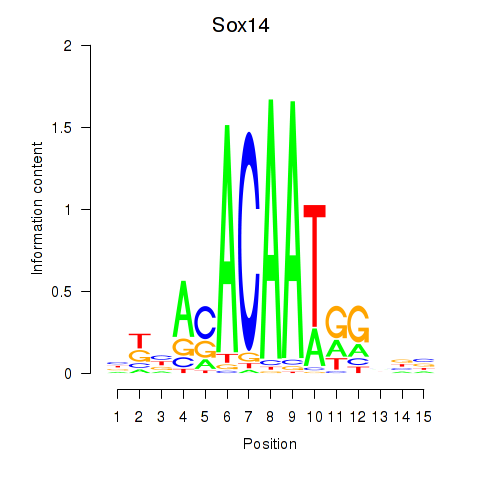
Results for Sox14
Z-value: 4.82
Motif logo
Transcription factors associated with Sox14
| Gene Symbol | Gene ID | Gene Info |
|---|---|---|
|
Sox14
|
ENSMUSG00000053747.8 | SRY (sex determining region Y)-box 14 |
Correlations of motif activity and signal intensity at CREs associated with the motif's TFs:
This plot shows correlation between observed signal intensity of a CRE associated with the transcription factor across all samples and activity of the motif.
For each TF, only the top 5 correlated CREs are shown.
| CRE | Gene | Distance | Association probability | Pearson corr. coef. | P-value | Plot |
|---|---|---|---|---|---|---|
| chr9_99873057_99873527 | Sox14 | 2363 | 0.289993 | 0.69 | 1.5e-09 | Click! |
| chr9_99873689_99874102 | Sox14 | 1760 | 0.356365 | 0.55 | 4.3e-06 | Click! |
| chr9_99871221_99872842 | Sox14 | 3624 | 0.232622 | 0.55 | 4.3e-06 | Click! |
| chr9_99872892_99873043 | Sox14 | 2688 | 0.268492 | 0.43 | 5.6e-04 | Click! |
| chr9_99869828_99871174 | Sox14 | 5154 | 0.207846 | 0.38 | 3.1e-03 | Click! |
Activity of the Sox14 motif across conditions
Conditions sorted by the z-value of the Sox14 motif activity
Move your cursor over a bar to see sample name and corresponding Z-value.
Top target CREs of the motif:
| Cis Regulatory Element (CRE) | Target Score | Top associated gene | Gene Info | Distance of CRE to TSS | CRE/Gene association probability |
|---|---|---|---|---|---|
| chr10_81229656_81230911 | 31.25 |
Atcay |
ataxia, cerebellar, Cayman type |
502 |
0.53 |
| chr8_70119024_70120981 | 30.41 |
Ncan |
neurocan |
871 |
0.35 |
| chr3_34652462_34653573 | 24.96 |
Sox2 |
SRY (sex determining region Y)-box 2 |
2612 |
0.16 |
| chr8_123413418_123414506 | 24.89 |
Tubb3 |
tubulin, beta 3 class III |
2372 |
0.11 |
| chr13_20473087_20474265 | 24.15 |
Gm32036 |
predicted gene, 32036 |
186 |
0.89 |
| chr2_6883618_6884699 | 23.27 |
Gm13389 |
predicted gene 13389 |
112 |
0.85 |
| chr1_66386919_66387899 | 22.79 |
Map2 |
microtubule-associated protein 2 |
398 |
0.87 |
| chr16_16558986_16560577 | 21.78 |
Fgd4 |
FYVE, RhoGEF and PH domain containing 4 |
209 |
0.94 |
| chr8_94995272_94995731 | 20.64 |
Adgrg1 |
adhesion G protein-coupled receptor G1 |
160 |
0.93 |
| chr5_19907724_19909563 | 20.08 |
Magi2 |
membrane associated guanylate kinase, WW and PDZ domain containing 2 |
682 |
0.82 |
| chr9_108824114_108825614 | 19.09 |
Gm35025 |
predicted gene, 35025 |
3 |
0.87 |
| chr14_66344363_66345813 | 18.64 |
Stmn4 |
stathmin-like 4 |
707 |
0.65 |
| chr2_181763361_181764530 | 18.09 |
Myt1 |
myelin transcription factor 1 |
613 |
0.66 |
| chr15_76519928_76521866 | 17.82 |
Scrt1 |
scratch family zinc finger 1 |
1005 |
0.28 |
| chr10_29145199_29145467 | 17.55 |
Gm9996 |
predicted gene 9996 |
1139 |
0.36 |
| chr1_9601164_9602408 | 17.34 |
Vxn |
vexin |
587 |
0.67 |
| chr1_42689823_42691041 | 16.81 |
Pantr1 |
POU domain, class 3, transcription factor 3 adjacent noncoding transcript 1 |
2661 |
0.19 |
| chr7_79500711_79501247 | 16.34 |
Mir9-3hg |
Mir9-3 host gene |
858 |
0.39 |
| chr8_123410787_123412789 | 16.04 |
Tubb3 |
tubulin, beta 3 class III |
198 |
0.84 |
| chr3_17790851_17791260 | 15.99 |
Mir124-2hg |
Mir124-2 host gene (non-protein coding) |
1098 |
0.49 |
| chr4_134470669_134471383 | 15.86 |
Stmn1 |
stathmin 1 |
1284 |
0.28 |
| chr7_79505833_79506958 | 15.81 |
Mir9-3 |
microRNA 9-3 |
1131 |
0.28 |
| chr2_32428080_32429746 | 15.80 |
Slc25a25 |
solute carrier family 25 (mitochondrial carrier, phosphate carrier), member 25 |
1839 |
0.19 |
| chr15_72807706_72808811 | 15.66 |
Peg13 |
paternally expressed 13 |
2066 |
0.4 |
| chr1_136132801_136134260 | 15.64 |
Kif21b |
kinesin family member 21B |
2076 |
0.19 |
| chr13_83741336_83742027 | 15.55 |
C130071C03Rik |
RIKEN cDNA C130071C03 gene |
2818 |
0.16 |
| chr10_29143400_29144848 | 15.48 |
Soga3 |
SOGA family member 3 |
65 |
0.5 |
| chr7_24485614_24487418 | 15.45 |
Cadm4 |
cell adhesion molecule 4 |
4493 |
0.1 |
| chr7_51623529_51624502 | 15.08 |
Slc17a6 |
solute carrier family 17 (sodium-dependent inorganic phosphate cotransporter), member 6 |
1133 |
0.51 |
| chr2_105680581_105683424 | 14.79 |
Pax6 |
paired box 6 |
290 |
0.89 |
| chr12_29528407_29529244 | 14.67 |
Myt1l |
myelin transcription factor 1-like |
424 |
0.85 |
| chr13_109442519_109443753 | 14.46 |
Pde4d |
phosphodiesterase 4D, cAMP specific |
953 |
0.73 |
| chr13_83740463_83741042 | 14.45 |
C130071C03Rik |
RIKEN cDNA C130071C03 gene |
1889 |
0.2 |
| chr9_4793875_4794307 | 14.41 |
Gria4 |
glutamate receptor, ionotropic, AMPA4 (alpha 4) |
1428 |
0.59 |
| chr18_59062200_59063436 | 14.39 |
Minar2 |
membrane integral NOTCH2 associated receptor 2 |
307 |
0.94 |
| chr3_94478073_94479450 | 14.21 |
Celf3 |
CUGBP, Elav-like family member 3 |
70 |
0.92 |
| chr13_83719687_83720586 | 14.16 |
C130071C03Rik |
RIKEN cDNA C130071C03 gene |
1245 |
0.36 |
| chr2_152080491_152081480 | 14.15 |
Scrt2 |
scratch family zinc finger 2 |
544 |
0.7 |
| chr9_41378412_41379411 | 13.95 |
Mir100hg |
Mir100 Mirlet7a-2 Mir125b-1 cluster host gene |
2350 |
0.27 |
| chr9_58197310_58202560 | 13.84 |
Islr2 |
immunoglobulin superfamily containing leucine-rich repeat 2 |
637 |
0.54 |
| chr8_117259792_117260803 | 13.72 |
Cmip |
c-Maf inducing protein |
3180 |
0.33 |
| chr2_65620767_65621991 | 13.68 |
Scn2a |
sodium channel, voltage-gated, type II, alpha |
568 |
0.82 |
| chr4_22835212_22836357 | 13.55 |
Gm24078 |
predicted gene, 24078 |
88653 |
0.09 |
| chr9_52148115_52149635 | 13.45 |
Zc3h12c |
zinc finger CCCH type containing 12C |
19236 |
0.18 |
| chr13_29014902_29016014 | 13.45 |
A330102I10Rik |
RIKEN cDNA A330102I10 gene |
835 |
0.7 |
| chr10_18470218_18471289 | 13.28 |
Nhsl1 |
NHS-like 1 |
772 |
0.72 |
| chr8_94994139_94995207 | 13.14 |
Adgrg1 |
adhesion G protein-coupled receptor G1 |
77 |
0.95 |
| chr10_57784547_57786586 | 13.13 |
Fabp7 |
fatty acid binding protein 7, brain |
643 |
0.68 |
| chr3_158559356_158560580 | 13.13 |
Lrrc7 |
leucine rich repeat containing 7 |
1368 |
0.57 |
| chr19_6499251_6500132 | 13.12 |
Nrxn2 |
neurexin II |
1856 |
0.23 |
| chr3_108410436_108412210 | 13.10 |
Celsr2 |
cadherin, EGF LAG seven-pass G-type receptor 2 |
4229 |
0.11 |
| chr12_29529828_29531185 | 13.08 |
Gm20208 |
predicted gene, 20208 |
609 |
0.74 |
| chr3_88458101_88459325 | 13.08 |
Sema4a |
sema domain, immunoglobulin domain (Ig), transmembrane domain (TM) and short cytoplasmic domain, (semaphorin) 4A |
163 |
0.88 |
| chrX_153501207_153502250 | 13.00 |
Ubqln2 |
ubiquilin 2 |
3501 |
0.22 |
| chr5_142811653_142812209 | 12.91 |
Tnrc18 |
trinucleotide repeat containing 18 |
5449 |
0.19 |
| chr10_57787071_57787893 | 12.73 |
Fabp7 |
fatty acid binding protein 7, brain |
2559 |
0.25 |
| chr15_87626925_87627959 | 12.70 |
Tafa5 |
TAFA chemokine like family member 5 |
2212 |
0.46 |
| chrX_23284413_23285126 | 12.67 |
Klhl13 |
kelch-like 13 |
60 |
0.99 |
| chr3_80800286_80803016 | 12.65 |
Gria2 |
glutamate receptor, ionotropic, AMPA2 (alpha 2) |
928 |
0.67 |
| chr10_36509078_36510052 | 12.63 |
Hs3st5 |
heparan sulfate (glucosamine) 3-O-sulfotransferase 5 |
2158 |
0.44 |
| chr5_38158101_38158252 | 12.62 |
Nsg1 |
neuron specific gene family member 1 |
855 |
0.55 |
| chr3_88213113_88214199 | 12.58 |
Gm3764 |
predicted gene 3764 |
829 |
0.3 |
| chr16_77235848_77236417 | 12.50 |
Mir99ahg |
Mir99a and Mirlet7c-1 host gene (non-protein coding) |
185 |
0.96 |
| chr2_181313043_181314281 | 12.46 |
Stmn3 |
stathmin-like 3 |
838 |
0.42 |
| chr7_45784257_45784949 | 12.42 |
Sult2b1 |
sulfotransferase family, cytosolic, 2B, member 1 |
66 |
0.88 |
| chr13_29016243_29017259 | 12.34 |
A330102I10Rik |
RIKEN cDNA A330102I10 gene |
43 |
0.98 |
| chr1_172024290_172024847 | 12.27 |
Vangl2 |
VANGL planar cell polarity 2 |
2143 |
0.23 |
| chrX_143930842_143933141 | 12.25 |
Dcx |
doublecortin |
1059 |
0.64 |
| chr8_123333823_123334660 | 12.21 |
Spire2 |
spire type actin nucleation factor 2 |
1528 |
0.22 |
| chr4_9270926_9271667 | 12.21 |
Clvs1 |
clavesin 1 |
159 |
0.96 |
| chr2_181767278_181768191 | 12.11 |
Myt1 |
myelin transcription factor 1 |
222 |
0.91 |
| chr4_154962821_154963090 | 11.82 |
Pank4 |
pantothenate kinase 4 |
1168 |
0.26 |
| chr1_42539071_42540720 | 11.75 |
Gm37047 |
predicted gene, 37047 |
48082 |
0.15 |
| chr6_28828230_28829085 | 11.67 |
Lrrc4 |
leucine rich repeat containing 4 |
1688 |
0.37 |
| chr6_55681271_55682057 | 11.62 |
Neurod6 |
neurogenic differentiation 6 |
401 |
0.86 |
| chr2_90886739_90886966 | 11.40 |
C1qtnf4 |
C1q and tumor necrosis factor related protein 4 |
992 |
0.36 |
| chr1_42691569_42692627 | 11.25 |
Pantr1 |
POU domain, class 3, transcription factor 3 adjacent noncoding transcript 1 |
995 |
0.42 |
| chr13_83734808_83735118 | 11.16 |
C130071C03Rik |
RIKEN cDNA C130071C03 gene |
2397 |
0.18 |
| chrX_49272929_49273965 | 11.16 |
Enox2 |
ecto-NOX disulfide-thiol exchanger 2 |
14765 |
0.24 |
| chr17_32808952_32809925 | 11.11 |
Zfp811 |
zinc finger protein 811 |
404 |
0.53 |
| chr15_92160888_92162023 | 11.10 |
Cntn1 |
contactin 1 |
98 |
0.98 |
| chr7_62422629_62423664 | 11.04 |
Gm32061 |
predicted gene, 32061 |
99 |
0.96 |
| chr2_105678552_105679922 | 11.02 |
Pax6 |
paired box 6 |
630 |
0.68 |
| chr9_110053895_110054422 | 11.00 |
Map4 |
microtubule-associated protein 4 |
2106 |
0.22 |
| chr3_8509825_8511666 | 10.89 |
Stmn2 |
stathmin-like 2 |
1159 |
0.54 |
| chr2_6874299_6875742 | 10.70 |
Celf2 |
CUGBP, Elav-like family member 2 |
2423 |
0.29 |
| chr2_70564530_70567543 | 10.69 |
Gad1 |
glutamate decarboxylase 1 |
341 |
0.83 |
| chr6_93911862_93913573 | 10.68 |
Magi1 |
membrane associated guanylate kinase, WW and PDZ domain containing 1 |
213 |
0.95 |
| chr12_29537800_29538885 | 10.63 |
Myt1l |
myelin transcription factor 1-like |
3120 |
0.28 |
| chr6_53880545_53881917 | 10.61 |
Gm22910 |
predicted gene, 22910 |
9083 |
0.21 |
| chr10_80300884_80302968 | 10.61 |
Apc2 |
APC regulator of WNT signaling pathway 2 |
106 |
0.9 |
| chr11_32001099_32002296 | 10.58 |
Nsg2 |
neuron specific gene family member 2 |
1195 |
0.52 |
| chr14_124675118_124677112 | 10.53 |
Fgf14 |
fibroblast growth factor 14 |
1012 |
0.63 |
| chr14_29718651_29719941 | 10.45 |
Cacna2d3 |
calcium channel, voltage-dependent, alpha2/delta subunit 3 |
2499 |
0.26 |
| chr18_77563377_77563753 | 10.43 |
Rnf165 |
ring finger protein 165 |
1044 |
0.59 |
| chr5_103209022_103210413 | 10.35 |
Mapk10 |
mitogen-activated protein kinase 10 |
705 |
0.75 |
| chr1_177449667_177450314 | 10.26 |
Zbtb18 |
zinc finger and BTB domain containing 18 |
4169 |
0.18 |
| chr7_144898015_144898977 | 10.17 |
Gm26793 |
predicted gene, 26793 |
1035 |
0.34 |
| chr5_103210548_103211780 | 10.12 |
Mapk10 |
mitogen-activated protein kinase 10 |
109 |
0.98 |
| chr5_37247333_37247632 | 10.12 |
Crmp1 |
collapsin response mediator protein 1 |
197 |
0.95 |
| chrX_136590440_136591154 | 10.12 |
Tceal3 |
transcription elongation factor A (SII)-like 3 |
45 |
0.96 |
| chr1_95665138_95666758 | 10.06 |
St8sia4 |
ST8 alpha-N-acetyl-neuraminide alpha-2,8-sialyltransferase 4 |
1587 |
0.41 |
| chr8_54954519_54955779 | 10.02 |
Gpm6a |
glycoprotein m6a |
306 |
0.88 |
| chr14_108910678_108911967 | 10.02 |
Slitrk1 |
SLIT and NTRK-like family, member 1 |
2836 |
0.42 |
| chr1_66321652_66322390 | 10.00 |
Map2 |
microtubule-associated protein 2 |
23 |
0.98 |
| chr2_158606690_158608449 | 10.00 |
Gm14204 |
predicted gene 14204 |
3021 |
0.15 |
| chr1_143640264_143641520 | 9.97 |
B3galt2 |
UDP-Gal:betaGlcNAc beta 1,3-galactosyltransferase, polypeptide 2 |
228 |
0.59 |
| chr13_54874116_54875277 | 9.95 |
Gm29431 |
predicted gene 29431 |
12774 |
0.13 |
| chr19_26769741_26770665 | 9.95 |
Smarca2 |
SWI/SNF related, matrix associated, actin dependent regulator of chromatin, subfamily a, member 2 |
288 |
0.92 |
| chr18_72347538_72348154 | 9.92 |
Dcc |
deleted in colorectal carcinoma |
3171 |
0.38 |
| chr4_45824847_45825701 | 9.91 |
Igfbpl1 |
insulin-like growth factor binding protein-like 1 |
1649 |
0.31 |
| chr9_102352095_102352639 | 9.86 |
Ephb1 |
Eph receptor B1 |
2326 |
0.28 |
| chr13_83732205_83734272 | 9.85 |
C130071C03Rik |
RIKEN cDNA C130071C03 gene |
672 |
0.58 |
| chrX_58033180_58034063 | 9.84 |
Zic3 |
zinc finger protein of the cerebellum 3 |
2611 |
0.36 |
| chr3_119154592_119155474 | 9.82 |
Gm43410 |
predicted gene 43410 |
286789 |
0.01 |
| chr5_120706498_120706989 | 9.80 |
Dtx1 |
deltex 1, E3 ubiquitin ligase |
854 |
0.44 |
| chr5_115431565_115432258 | 9.79 |
Msi1 |
musashi RNA-binding protein 1 |
1306 |
0.22 |
| chr8_34890130_34891317 | 9.78 |
Tnks |
tankyrase, TRF1-interacting ankyrin-related ADP-ribose polymerase |
572 |
0.8 |
| chrX_7919510_7921219 | 9.78 |
Pcsk1n |
proprotein convertase subtilisin/kexin type 1 inhibitor |
542 |
0.52 |
| chr3_88210777_88211200 | 9.76 |
Gm3764 |
predicted gene 3764 |
1516 |
0.18 |
| chr3_17791717_17791961 | 9.72 |
Mir124-2hg |
Mir124-2 host gene (non-protein coding) |
1882 |
0.32 |
| chr8_94995811_94996872 | 9.68 |
Adgrg1 |
adhesion G protein-coupled receptor G1 |
680 |
0.57 |
| chr15_98989928_98991865 | 9.67 |
4930578M01Rik |
RIKEN cDNA 4930578M01 gene |
5002 |
0.1 |
| chr1_32173438_32173903 | 9.61 |
Khdrbs2 |
KH domain containing, RNA binding, signal transduction associated 2 |
783 |
0.74 |
| chr6_116106085_116106744 | 9.60 |
Gm20404 |
predicted gene 20404 |
1236 |
0.34 |
| chr7_27735092_27735839 | 9.54 |
Zfp60 |
zinc finger protein 60 |
902 |
0.47 |
| chr14_60380755_60381381 | 9.53 |
Amer2 |
APC membrane recruitment 2 |
2782 |
0.3 |
| chrX_110809955_110811467 | 9.49 |
Gm44593 |
predicted gene 44593 |
1613 |
0.43 |
| chr1_32174771_32175297 | 9.46 |
Khdrbs2 |
KH domain containing, RNA binding, signal transduction associated 2 |
2147 |
0.41 |
| chr19_47018258_47018719 | 9.46 |
Nt5c2 |
5'-nucleotidase, cytosolic II |
3335 |
0.15 |
| chr2_37517668_37518398 | 9.44 |
Gpr21 |
G protein-coupled receptor 21 |
1407 |
0.29 |
| chr4_110285468_110287125 | 9.43 |
Elavl4 |
ELAV like RNA binding protein 4 |
320 |
0.94 |
| chr4_22485088_22485284 | 9.41 |
Pou3f2 |
POU domain, class 3, transcription factor 2 |
3180 |
0.21 |
| chr12_117153278_117156362 | 9.41 |
Gm10421 |
predicted gene 10421 |
3169 |
0.37 |
| chr12_52700044_52701597 | 9.41 |
Akap6 |
A kinase (PRKA) anchor protein 6 |
1437 |
0.46 |
| chr7_141949754_141950818 | 9.38 |
Brsk2 |
BR serine/threonine kinase 2 |
200 |
0.83 |
| chr4_70530858_70531844 | 9.36 |
Megf9 |
multiple EGF-like-domains 9 |
3577 |
0.38 |
| chr15_98983254_98984205 | 9.36 |
4930578M01Rik |
RIKEN cDNA 4930578M01 gene |
102 |
0.93 |
| chr2_52557337_52558561 | 9.34 |
Cacnb4 |
calcium channel, voltage-dependent, beta 4 subunit |
611 |
0.74 |
| chr4_126465012_126466992 | 9.33 |
Ago1 |
argonaute RISC catalytic subunit 1 |
2419 |
0.18 |
| chr7_93083157_93083738 | 9.29 |
Gm9934 |
predicted gene 9934 |
2420 |
0.25 |
| chr16_13986350_13987796 | 9.28 |
Ifitm7 |
interferon induced transmembrane protein 7 |
185 |
0.71 |
| chr7_128690432_128691249 | 9.26 |
Gm16044 |
predicted gene 16044 |
1849 |
0.17 |
| chr11_54596874_54597434 | 9.25 |
Rapgef6 |
Rap guanine nucleotide exchange factor (GEF) 6 |
980 |
0.6 |
| chr12_103315511_103316208 | 9.18 |
Fam181a |
family with sequence similarity 181, member A |
900 |
0.36 |
| chr13_83727321_83728283 | 9.17 |
C130071C03Rik |
RIKEN cDNA C130071C03 gene |
304 |
0.83 |
| chr13_83714553_83714869 | 9.17 |
C130071C03Rik |
RIKEN cDNA C130071C03 gene |
6670 |
0.14 |
| chr4_33926104_33927188 | 9.17 |
Cnr1 |
cannabinoid receptor 1 (brain) |
444 |
0.88 |
| chr7_126823319_126824529 | 9.17 |
Fam57b |
family with sequence similarity 57, member B |
621 |
0.41 |
| chr3_17783692_17784517 | 9.14 |
Mir124-2hg |
Mir124-2 host gene (non-protein coding) |
5817 |
0.2 |
| chr4_9269280_9270516 | 9.12 |
Clvs1 |
clavesin 1 |
551 |
0.81 |
| chr9_21937619_21937949 | 9.12 |
Plppr2 |
phospholipid phosphatase related 2 |
490 |
0.61 |
| chr16_77421091_77421970 | 9.08 |
9430053O09Rik |
RIKEN cDNA 9430053O09 gene |
290 |
0.84 |
| chr10_34299043_34301066 | 9.07 |
Tspyl4 |
TSPY-like 4 |
798 |
0.4 |
| chr13_78193022_78193812 | 9.06 |
Nr2f1 |
nuclear receptor subfamily 2, group F, member 1 |
2956 |
0.18 |
| chr15_76124987_76126454 | 9.06 |
BC024139 |
cDNA sequence BC024139 |
351 |
0.73 |
| chr11_102393440_102394677 | 9.04 |
Rundc3a |
RUN domain containing 3A |
655 |
0.52 |
| chr7_79502506_79503035 | 8.96 |
Mir9-3 |
microRNA 9-3 |
2494 |
0.13 |
| chr6_134886811_134888239 | 8.96 |
Gpr19 |
G protein-coupled receptor 19 |
243 |
0.87 |
| chr2_22626812_22627730 | 8.93 |
Gad2 |
glutamic acid decarboxylase 2 |
3967 |
0.16 |
| chr18_43686487_43688415 | 8.91 |
Jakmip2 |
janus kinase and microtubule interacting protein 2 |
174 |
0.96 |
| chr2_57613916_57615034 | 8.88 |
Gm13532 |
predicted gene 13532 |
14753 |
0.2 |
| chr10_69705909_69707430 | 8.88 |
Ank3 |
ankyrin 3, epithelial |
191 |
0.97 |
| chr3_34655841_34656295 | 8.86 |
Sox2ot |
SOX2 overlapping transcript (non-protein coding) |
32 |
0.96 |
| chr15_25753053_25753722 | 8.85 |
Myo10 |
myosin X |
408 |
0.88 |
| chr18_37217058_37218378 | 8.85 |
Gm10544 |
predicted gene 10544 |
39196 |
0.08 |
| chr1_184997307_184998530 | 8.75 |
Mark1 |
MAP/microtubule affinity regulating kinase 1 |
1557 |
0.41 |
| chr1_6760592_6761327 | 8.74 |
St18 |
suppression of tumorigenicity 18 |
23384 |
0.23 |
| chr13_83717521_83718816 | 8.68 |
C130071C03Rik |
RIKEN cDNA C130071C03 gene |
3213 |
0.17 |
| chr9_36821403_36822795 | 8.66 |
Fez1 |
fasciculation and elongation protein zeta 1 (zygin I) |
235 |
0.9 |
| chr19_47017426_47018238 | 8.66 |
Nt5c2 |
5'-nucleotidase, cytosolic II |
2679 |
0.17 |
| chr3_34648572_34651394 | 8.64 |
Sox2 |
SRY (sex determining region Y)-box 2 |
422 |
0.73 |
| chr5_98180058_98181966 | 8.62 |
Prdm8 |
PR domain containing 8 |
34 |
0.97 |
| chr5_88583963_88584847 | 8.59 |
Rufy3 |
RUN and FYVE domain containing 3 |
611 |
0.7 |
| chr2_74426676_74427273 | 8.59 |
Lnpk |
lunapark, ER junction formation factor |
106132 |
0.05 |
| chr10_92159598_92160059 | 8.59 |
Rmst |
rhabdomyosarcoma 2 associated transcript (non-coding RNA) |
2933 |
0.28 |
| chr2_17669711_17670390 | 8.58 |
Nebl |
nebulette |
60993 |
0.13 |
| chr8_14382368_14383445 | 8.57 |
Dlgap2 |
DLG associated protein 2 |
910 |
0.66 |
| chr1_137902039_137902674 | 8.56 |
Gm4258 |
predicted gene 4258 |
3758 |
0.11 |
| chr13_34128849_34129198 | 8.56 |
Tubb2b |
tubulin, beta 2B class IIB |
1331 |
0.28 |
| chr5_37245879_37246957 | 8.53 |
Crmp1 |
collapsin response mediator protein 1 |
573 |
0.76 |
| chr8_89036575_89038609 | 8.50 |
Sall1 |
spalt like transcription factor 1 |
6570 |
0.23 |
| chr11_104234777_104235157 | 8.49 |
Mapt |
microtubule-associated protein tau |
3383 |
0.19 |
| chr6_13835523_13837039 | 8.49 |
Gpr85 |
G protein-coupled receptor 85 |
960 |
0.59 |
| chrX_69363262_69363944 | 8.46 |
Gm14705 |
predicted gene 14705 |
2334 |
0.33 |
| chr13_109928298_109928867 | 8.42 |
Pde4d |
phosphodiesterase 4D, cAMP specific |
1738 |
0.46 |
| chr1_42262366_42263014 | 8.41 |
Gm28175 |
predicted gene 28175 |
833 |
0.63 |
| chr5_111424407_111425623 | 8.39 |
Gm43119 |
predicted gene 43119 |
1426 |
0.38 |
| chr13_110277692_110277997 | 8.37 |
Rab3c |
RAB3C, member RAS oncogene family |
2306 |
0.36 |
| chr16_72027587_72029370 | 8.36 |
Gm49667 |
predicted gene, 49667 |
149434 |
0.04 |
| chr2_113828248_113829427 | 8.35 |
Scg5 |
secretogranin V |
75 |
0.97 |
| chr8_121649714_121650258 | 8.33 |
Zcchc14 |
zinc finger, CCHC domain containing 14 |
2915 |
0.16 |
| chr9_99770772_99771039 | 8.33 |
Gm23949 |
predicted gene, 23949 |
20388 |
0.17 |
| chr3_34563437_34564219 | 8.32 |
Sox2ot |
SOX2 overlapping transcript (non-protein coding) |
3436 |
0.19 |
| chr12_72374494_72375432 | 8.31 |
Rtn1 |
reticulon 1 |
34091 |
0.18 |
| chr10_3863416_3864702 | 8.30 |
Gm16149 |
predicted gene 16149 |
5548 |
0.21 |
| chr1_177446374_177448525 | 8.28 |
Zbtb18 |
zinc finger and BTB domain containing 18 |
1628 |
0.31 |
| chr13_83718912_83719403 | 8.25 |
C130071C03Rik |
RIKEN cDNA C130071C03 gene |
2224 |
0.22 |
| chrX_143929366_143930062 | 8.25 |
Dcx |
doublecortin |
3336 |
0.34 |
| chr10_90576163_90577493 | 8.20 |
Anks1b |
ankyrin repeat and sterile alpha motif domain containing 1B |
13 |
0.99 |
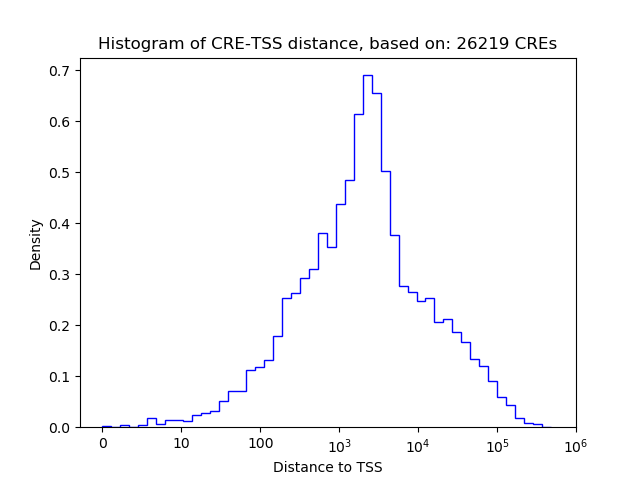
Histogram of CRE-TSS distances for CREs targeted by :
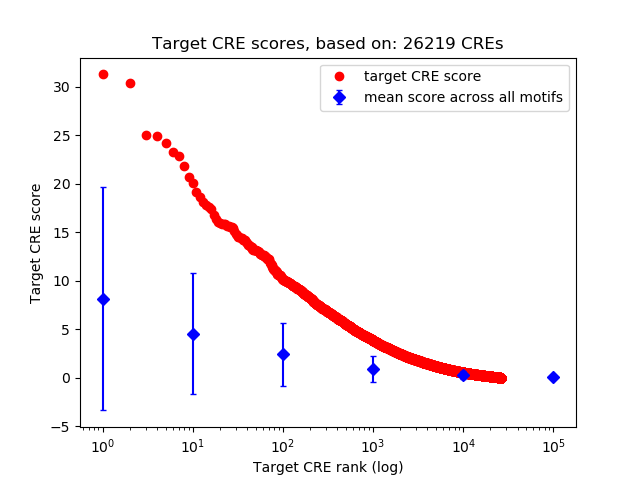
Rank distribution of CRE target scores:
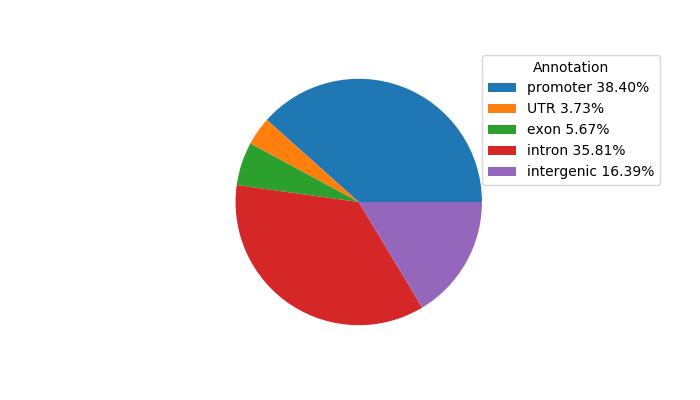
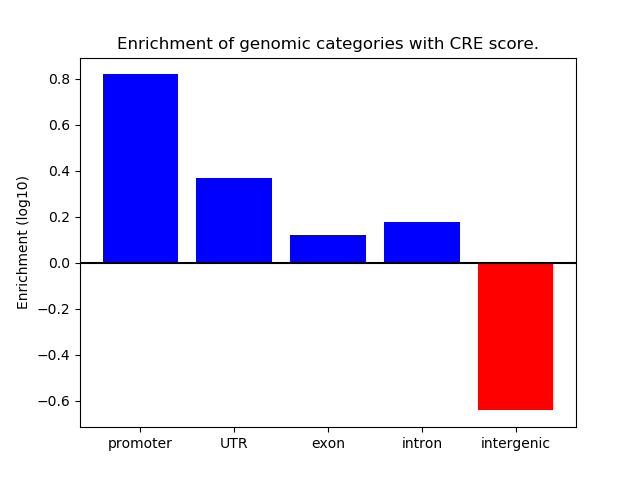
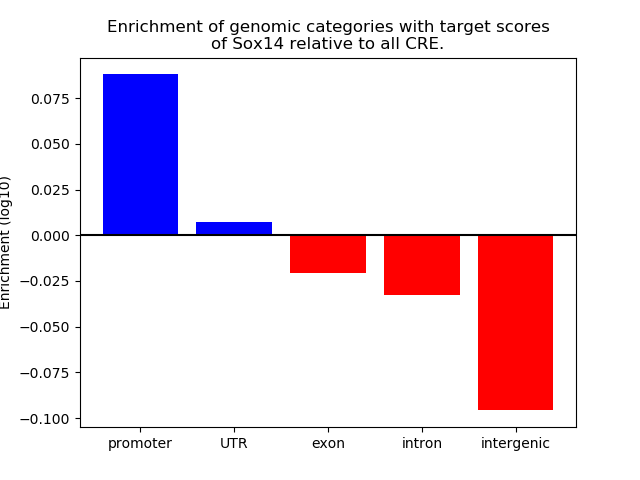
Distribution of target CREs across different genomic regions:
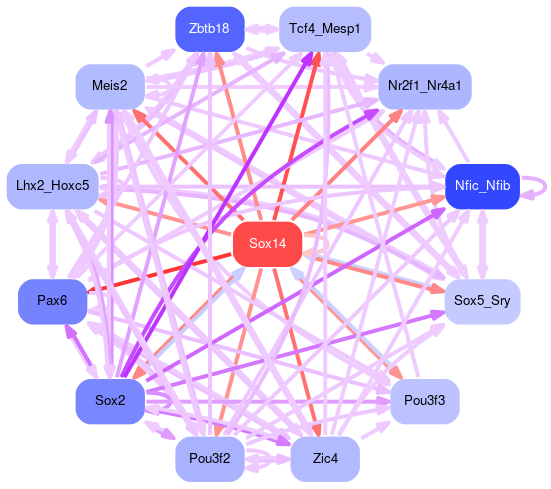
Network of associatons between targets according to the STRING database.

Gene Ontology Analysis
Gene overrepresentation in biological process category:
| Log-likelihood per target | Total log-likelihood | Term | Description |
|---|---|---|---|
| 15.4 | 46.1 | GO:0097118 | neuroligin clustering involved in postsynaptic membrane assembly(GO:0097118) |
| 11.2 | 33.7 | GO:0021912 | regulation of transcription from RNA polymerase II promoter involved in spinal cord motor neuron fate specification(GO:0021912) |
| 7.4 | 59.2 | GO:0021796 | cerebral cortex regionalization(GO:0021796) |
| 6.1 | 24.5 | GO:0007258 | JUN phosphorylation(GO:0007258) |
| 6.0 | 23.8 | GO:0030035 | microspike assembly(GO:0030035) |
| 5.4 | 16.1 | GO:2000211 | regulation of glutamate metabolic process(GO:2000211) |
| 5.3 | 21.4 | GO:0072051 | juxtaglomerular apparatus development(GO:0072051) |
| 5.2 | 20.9 | GO:0021698 | cerebellar cortex structural organization(GO:0021698) |
| 5.0 | 15.1 | GO:1901078 | negative regulation of relaxation of muscle(GO:1901078) |
| 4.8 | 14.4 | GO:0048880 | sensory system development(GO:0048880) |
| 4.6 | 18.6 | GO:0033563 | dorsal/ventral axon guidance(GO:0033563) |
| 4.2 | 12.6 | GO:1904059 | regulation of locomotor rhythm(GO:1904059) |
| 4.1 | 20.7 | GO:0048852 | diencephalon morphogenesis(GO:0048852) |
| 4.1 | 24.8 | GO:0045213 | neurotransmitter receptor metabolic process(GO:0045213) |
| 4.0 | 8.1 | GO:0035262 | gonad morphogenesis(GO:0035262) |
| 4.0 | 16.0 | GO:0097476 | motor neuron migration(GO:0097475) spinal cord motor neuron migration(GO:0097476) |
| 3.9 | 23.4 | GO:0097119 | postsynaptic density protein 95 clustering(GO:0097119) |
| 3.9 | 11.6 | GO:0009449 | gamma-aminobutyric acid biosynthetic process(GO:0009449) |
| 3.8 | 15.2 | GO:0051581 | negative regulation of neurotransmitter uptake(GO:0051581) regulation of serotonin uptake(GO:0051611) negative regulation of serotonin uptake(GO:0051612) |
| 3.8 | 18.8 | GO:0060164 | regulation of timing of neuron differentiation(GO:0060164) |
| 3.7 | 15.0 | GO:0036515 | serotonergic neuron axon guidance(GO:0036515) |
| 3.7 | 36.6 | GO:0097120 | receptor localization to synapse(GO:0097120) |
| 3.4 | 10.3 | GO:0099558 | maintenance of synapse structure(GO:0099558) |
| 3.4 | 20.3 | GO:0090273 | regulation of somatostatin secretion(GO:0090273) |
| 3.4 | 13.4 | GO:1903818 | positive regulation of delayed rectifier potassium channel activity(GO:1902261) positive regulation of voltage-gated potassium channel activity(GO:1903818) |
| 3.3 | 23.0 | GO:0045607 | regulation of auditory receptor cell differentiation(GO:0045607) regulation of mechanoreceptor differentiation(GO:0045631) regulation of inner ear receptor cell differentiation(GO:2000980) |
| 3.2 | 12.8 | GO:0021960 | anterior commissure morphogenesis(GO:0021960) |
| 3.2 | 15.9 | GO:0014816 | skeletal muscle satellite cell differentiation(GO:0014816) |
| 3.2 | 9.5 | GO:1904742 | regulation of telomeric DNA binding(GO:1904742) |
| 3.1 | 6.3 | GO:0061642 | chemoattraction of axon(GO:0061642) |
| 3.1 | 34.4 | GO:0071625 | vocalization behavior(GO:0071625) |
| 2.9 | 8.8 | GO:0035887 | aortic smooth muscle cell differentiation(GO:0035887) |
| 2.9 | 20.5 | GO:0021979 | hypothalamus cell differentiation(GO:0021979) |
| 2.9 | 20.4 | GO:0042118 | endothelial cell activation(GO:0042118) |
| 2.8 | 5.7 | GO:0007386 | compartment pattern specification(GO:0007386) |
| 2.8 | 8.4 | GO:0097503 | sialylation(GO:0097503) |
| 2.8 | 11.1 | GO:0003357 | noradrenergic neuron differentiation(GO:0003357) |
| 2.8 | 8.3 | GO:0060084 | synaptic transmission involved in micturition(GO:0060084) |
| 2.8 | 8.3 | GO:0097155 | fasciculation of sensory neuron axon(GO:0097155) |
| 2.6 | 5.3 | GO:0097113 | AMPA glutamate receptor clustering(GO:0097113) glutamate receptor clustering(GO:0097688) |
| 2.6 | 2.6 | GO:0060174 | limb bud formation(GO:0060174) |
| 2.6 | 2.6 | GO:0021553 | olfactory nerve development(GO:0021553) |
| 2.5 | 10.1 | GO:0031117 | positive regulation of microtubule depolymerization(GO:0031117) |
| 2.5 | 15.1 | GO:0097090 | presynaptic membrane organization(GO:0097090) |
| 2.5 | 15.0 | GO:0021978 | telencephalon regionalization(GO:0021978) |
| 2.5 | 4.9 | GO:0021529 | spinal cord oligodendrocyte cell differentiation(GO:0021529) spinal cord oligodendrocyte cell fate specification(GO:0021530) |
| 2.4 | 22.0 | GO:0021860 | pyramidal neuron development(GO:0021860) |
| 2.4 | 9.7 | GO:0033602 | negative regulation of dopamine secretion(GO:0033602) |
| 2.4 | 7.2 | GO:0010046 | response to mycotoxin(GO:0010046) |
| 2.4 | 7.2 | GO:0046684 | response to pyrethroid(GO:0046684) |
| 2.4 | 28.5 | GO:0048268 | clathrin coat assembly(GO:0048268) |
| 2.4 | 2.4 | GO:1990791 | dorsal root ganglion development(GO:1990791) |
| 2.4 | 9.5 | GO:0021957 | corticospinal tract morphogenesis(GO:0021957) |
| 2.3 | 4.7 | GO:0050923 | regulation of negative chemotaxis(GO:0050923) |
| 2.3 | 2.3 | GO:0060221 | retinal rod cell differentiation(GO:0060221) |
| 2.3 | 16.0 | GO:0098870 | neuronal action potential propagation(GO:0019227) action potential propagation(GO:0098870) |
| 2.3 | 38.8 | GO:0071475 | cellular hyperosmotic salinity response(GO:0071475) |
| 2.2 | 4.4 | GO:0021773 | striatal medium spiny neuron differentiation(GO:0021773) |
| 2.2 | 19.6 | GO:0031536 | positive regulation of exit from mitosis(GO:0031536) |
| 2.2 | 10.8 | GO:0035469 | determination of pancreatic left/right asymmetry(GO:0035469) |
| 2.2 | 4.3 | GO:2000821 | regulation of grooming behavior(GO:2000821) |
| 2.1 | 27.6 | GO:0051654 | establishment of mitochondrion localization(GO:0051654) |
| 2.1 | 6.3 | GO:0034093 | positive regulation of maintenance of sister chromatid cohesion(GO:0034093) positive regulation of maintenance of mitotic sister chromatid cohesion(GO:0034184) |
| 2.1 | 23.2 | GO:0021542 | dentate gyrus development(GO:0021542) |
| 2.1 | 6.3 | GO:0021882 | regulation of transcription from RNA polymerase II promoter involved in forebrain neuron fate commitment(GO:0021882) |
| 2.1 | 6.3 | GO:0006532 | aspartate biosynthetic process(GO:0006532) |
| 2.1 | 6.2 | GO:1900186 | negative regulation of clathrin-mediated endocytosis(GO:1900186) |
| 2.1 | 6.2 | GO:0060594 | mammary gland specification(GO:0060594) |
| 2.1 | 49.5 | GO:0001964 | startle response(GO:0001964) |
| 2.0 | 26.6 | GO:0001504 | neurotransmitter uptake(GO:0001504) |
| 2.0 | 6.1 | GO:0070649 | formin-nucleated actin cable assembly(GO:0070649) |
| 2.0 | 2.0 | GO:1904861 | excitatory synapse assembly(GO:1904861) |
| 2.0 | 2.0 | GO:0061743 | motor learning(GO:0061743) |
| 1.9 | 1.9 | GO:0021847 | ventricular zone neuroblast division(GO:0021847) |
| 1.9 | 7.7 | GO:0006538 | glutamate catabolic process(GO:0006538) |
| 1.9 | 5.8 | GO:0021615 | glossopharyngeal nerve morphogenesis(GO:0021615) |
| 1.9 | 3.8 | GO:0021902 | commitment of neuronal cell to specific neuron type in forebrain(GO:0021902) |
| 1.9 | 7.6 | GO:0015015 | heparan sulfate proteoglycan biosynthetic process, enzymatic modification(GO:0015015) |
| 1.9 | 5.6 | GO:0072137 | condensed mesenchymal cell proliferation(GO:0072137) |
| 1.9 | 3.7 | GO:0021937 | cerebellar Purkinje cell-granule cell precursor cell signaling involved in regulation of granule cell precursor cell proliferation(GO:0021937) |
| 1.8 | 3.7 | GO:0021555 | midbrain-hindbrain boundary morphogenesis(GO:0021555) |
| 1.8 | 9.2 | GO:0021785 | branchiomotor neuron axon guidance(GO:0021785) |
| 1.8 | 7.3 | GO:1903421 | regulation of synaptic vesicle recycling(GO:1903421) |
| 1.8 | 3.6 | GO:0006868 | glutamine transport(GO:0006868) |
| 1.8 | 5.3 | GO:2000325 | regulation of ligand-dependent nuclear receptor transcription coactivator activity(GO:2000325) positive regulation of ligand-dependent nuclear receptor transcription coactivator activity(GO:2000327) |
| 1.8 | 5.3 | GO:0070777 | D-aspartate transport(GO:0070777) D-aspartate import(GO:0070779) |
| 1.7 | 24.2 | GO:0031290 | retinal ganglion cell axon guidance(GO:0031290) |
| 1.7 | 8.6 | GO:2000851 | positive regulation of glucocorticoid secretion(GO:2000851) |
| 1.7 | 3.4 | GO:0060279 | positive regulation of ovulation(GO:0060279) |
| 1.7 | 1.7 | GO:0021559 | trigeminal nerve development(GO:0021559) |
| 1.7 | 20.2 | GO:0007216 | G-protein coupled glutamate receptor signaling pathway(GO:0007216) |
| 1.7 | 10.0 | GO:0060080 | inhibitory postsynaptic potential(GO:0060080) |
| 1.7 | 5.0 | GO:0007412 | axon target recognition(GO:0007412) |
| 1.6 | 16.4 | GO:0035235 | ionotropic glutamate receptor signaling pathway(GO:0035235) |
| 1.6 | 58.7 | GO:0021954 | central nervous system neuron development(GO:0021954) |
| 1.6 | 4.7 | GO:0070634 | transepithelial ammonium transport(GO:0070634) |
| 1.5 | 27.7 | GO:0007214 | gamma-aminobutyric acid signaling pathway(GO:0007214) |
| 1.5 | 6.1 | GO:0006382 | adenosine to inosine editing(GO:0006382) |
| 1.5 | 15.3 | GO:2000463 | positive regulation of excitatory postsynaptic potential(GO:2000463) |
| 1.5 | 7.7 | GO:0051823 | regulation of synapse structural plasticity(GO:0051823) |
| 1.5 | 6.1 | GO:1903966 | monounsaturated fatty acid metabolic process(GO:1903964) monounsaturated fatty acid biosynthetic process(GO:1903966) |
| 1.5 | 4.6 | GO:1904219 | regulation of CDP-diacylglycerol-serine O-phosphatidyltransferase activity(GO:1904217) positive regulation of CDP-diacylglycerol-serine O-phosphatidyltransferase activity(GO:1904219) regulation of serine C-palmitoyltransferase activity(GO:1904220) positive regulation of serine C-palmitoyltransferase activity(GO:1904222) |
| 1.5 | 4.5 | GO:0007158 | neuron cell-cell adhesion(GO:0007158) |
| 1.5 | 7.4 | GO:0061302 | smooth muscle cell-matrix adhesion(GO:0061302) |
| 1.5 | 5.9 | GO:0021914 | negative regulation of smoothened signaling pathway involved in ventral spinal cord patterning(GO:0021914) |
| 1.5 | 11.7 | GO:0090244 | Wnt signaling pathway involved in somitogenesis(GO:0090244) |
| 1.5 | 2.9 | GO:0042297 | vocal learning(GO:0042297) imitative learning(GO:0098596) learned vocalization behavior or vocal learning(GO:0098598) |
| 1.5 | 8.8 | GO:0090394 | negative regulation of excitatory postsynaptic potential(GO:0090394) |
| 1.5 | 27.6 | GO:0060384 | innervation(GO:0060384) |
| 1.5 | 7.3 | GO:0032229 | negative regulation of synaptic transmission, GABAergic(GO:0032229) |
| 1.4 | 14.5 | GO:0008038 | neuron recognition(GO:0008038) |
| 1.4 | 2.9 | GO:0060166 | olfactory pit development(GO:0060166) |
| 1.4 | 7.1 | GO:0048681 | negative regulation of axon regeneration(GO:0048681) |
| 1.4 | 4.2 | GO:0072318 | clathrin coat disassembly(GO:0072318) |
| 1.4 | 1.4 | GO:0045876 | positive regulation of sister chromatid cohesion(GO:0045876) |
| 1.4 | 4.2 | GO:0033326 | cerebrospinal fluid secretion(GO:0033326) |
| 1.4 | 5.5 | GO:1903215 | negative regulation of protein targeting to mitochondrion(GO:1903215) |
| 1.4 | 1.4 | GO:1901187 | regulation of ephrin receptor signaling pathway(GO:1901187) |
| 1.4 | 4.1 | GO:0070268 | cornification(GO:0070268) |
| 1.3 | 4.0 | GO:1900620 | acetylcholine biosynthetic process(GO:0008292) acetate ester biosynthetic process(GO:1900620) |
| 1.3 | 4.0 | GO:0030070 | insulin processing(GO:0030070) |
| 1.3 | 10.5 | GO:0051968 | positive regulation of synaptic transmission, glutamatergic(GO:0051968) |
| 1.3 | 3.9 | GO:0061589 | calcium activated phosphatidylserine scrambling(GO:0061589) |
| 1.3 | 41.6 | GO:0007019 | microtubule depolymerization(GO:0007019) |
| 1.3 | 33.7 | GO:0071526 | semaphorin-plexin signaling pathway(GO:0071526) |
| 1.3 | 5.2 | GO:0000160 | phosphorelay signal transduction system(GO:0000160) |
| 1.3 | 12.8 | GO:0009312 | oligosaccharide biosynthetic process(GO:0009312) |
| 1.3 | 2.5 | GO:0071895 | odontoblast differentiation(GO:0071895) |
| 1.2 | 17.5 | GO:0048714 | positive regulation of oligodendrocyte differentiation(GO:0048714) |
| 1.2 | 3.7 | GO:0045900 | negative regulation of translational elongation(GO:0045900) |
| 1.2 | 1.2 | GO:0090493 | catecholamine uptake(GO:0090493) dopamine uptake(GO:0090494) |
| 1.2 | 3.6 | GO:1902071 | regulation of hypoxia-inducible factor-1alpha signaling pathway(GO:1902071) |
| 1.2 | 7.1 | GO:0060052 | neurofilament cytoskeleton organization(GO:0060052) |
| 1.2 | 4.7 | GO:0034773 | histone H4-K20 trimethylation(GO:0034773) |
| 1.2 | 5.9 | GO:0046532 | regulation of photoreceptor cell differentiation(GO:0046532) |
| 1.2 | 5.9 | GO:0021936 | regulation of cerebellar granule cell precursor proliferation(GO:0021936) |
| 1.2 | 55.1 | GO:0051965 | positive regulation of synapse assembly(GO:0051965) |
| 1.2 | 10.5 | GO:0000103 | sulfate assimilation(GO:0000103) |
| 1.2 | 2.3 | GO:0046959 | habituation(GO:0046959) |
| 1.2 | 11.6 | GO:0043931 | ossification involved in bone maturation(GO:0043931) bone maturation(GO:0070977) |
| 1.2 | 1.2 | GO:0030497 | fatty acid elongation(GO:0030497) |
| 1.2 | 16.2 | GO:0048026 | positive regulation of mRNA splicing, via spliceosome(GO:0048026) |
| 1.1 | 5.7 | GO:0071442 | positive regulation of histone H3-K14 acetylation(GO:0071442) |
| 1.1 | 6.9 | GO:0097264 | self proteolysis(GO:0097264) |
| 1.1 | 3.4 | GO:0009826 | unidimensional cell growth(GO:0009826) |
| 1.1 | 4.5 | GO:0010891 | negative regulation of sequestering of triglyceride(GO:0010891) |
| 1.1 | 3.4 | GO:1900245 | positive regulation of MDA-5 signaling pathway(GO:1900245) |
| 1.1 | 4.4 | GO:0060159 | regulation of dopamine receptor signaling pathway(GO:0060159) |
| 1.1 | 3.3 | GO:2001025 | positive regulation of response to drug(GO:2001025) |
| 1.1 | 1.1 | GO:0035461 | vitamin transmembrane transport(GO:0035461) |
| 1.1 | 28.3 | GO:0021766 | hippocampus development(GO:0021766) |
| 1.1 | 5.4 | GO:0034047 | regulation of protein phosphatase type 2A activity(GO:0034047) |
| 1.1 | 5.4 | GO:0071397 | cellular response to cholesterol(GO:0071397) |
| 1.1 | 3.2 | GO:0021794 | thalamus development(GO:0021794) |
| 1.0 | 3.1 | GO:0098903 | regulation of membrane repolarization during action potential(GO:0098903) |
| 1.0 | 5.1 | GO:0002315 | marginal zone B cell differentiation(GO:0002315) |
| 1.0 | 7.0 | GO:0046543 | development of secondary female sexual characteristics(GO:0046543) |
| 1.0 | 12.0 | GO:0016486 | peptide hormone processing(GO:0016486) |
| 1.0 | 1.0 | GO:1902416 | positive regulation of mRNA binding(GO:1902416) positive regulation of RNA binding(GO:1905216) |
| 1.0 | 5.0 | GO:0021895 | cerebral cortex neuron differentiation(GO:0021895) |
| 1.0 | 4.9 | GO:0007096 | regulation of exit from mitosis(GO:0007096) |
| 1.0 | 7.8 | GO:0060539 | diaphragm development(GO:0060539) |
| 1.0 | 1.0 | GO:0097154 | GABAergic neuron differentiation(GO:0097154) |
| 1.0 | 1.0 | GO:0021631 | optic nerve morphogenesis(GO:0021631) |
| 1.0 | 1.0 | GO:0015746 | tricarboxylic acid transport(GO:0006842) citrate transport(GO:0015746) |
| 0.9 | 8.5 | GO:0045176 | apical protein localization(GO:0045176) |
| 0.9 | 7.5 | GO:0046548 | retinal rod cell development(GO:0046548) |
| 0.9 | 2.8 | GO:0019355 | nicotinamide nucleotide biosynthetic process from aspartate(GO:0019355) 'de novo' NAD biosynthetic process from aspartate(GO:0034628) |
| 0.9 | 2.8 | GO:0060478 | acrosomal vesicle exocytosis(GO:0060478) |
| 0.9 | 5.6 | GO:0072044 | collecting duct development(GO:0072044) |
| 0.9 | 3.7 | GO:1902953 | positive regulation of ER to Golgi vesicle-mediated transport(GO:1902953) |
| 0.9 | 4.6 | GO:0014051 | gamma-aminobutyric acid secretion(GO:0014051) |
| 0.9 | 10.1 | GO:0060074 | synapse maturation(GO:0060074) |
| 0.9 | 0.9 | GO:0061591 | calcium activated phospholipid scrambling(GO:0061588) calcium activated phosphatidylcholine scrambling(GO:0061590) calcium activated galactosylceramide scrambling(GO:0061591) |
| 0.9 | 1.8 | GO:0030951 | establishment or maintenance of microtubule cytoskeleton polarity(GO:0030951) |
| 0.9 | 0.9 | GO:0001997 | positive regulation of the force of heart contraction by epinephrine-norepinephrine(GO:0001997) positive regulation of the force of heart contraction by chemical signal(GO:0003099) |
| 0.9 | 0.9 | GO:0072697 | protein localization to cell cortex(GO:0072697) |
| 0.9 | 3.5 | GO:0002087 | regulation of respiratory gaseous exchange by neurological system process(GO:0002087) |
| 0.9 | 2.6 | GO:0060573 | ventral spinal cord interneuron specification(GO:0021521) cell fate specification involved in pattern specification(GO:0060573) |
| 0.9 | 1.7 | GO:0070253 | somatostatin secretion(GO:0070253) |
| 0.9 | 1.7 | GO:0030916 | otic vesicle formation(GO:0030916) |
| 0.9 | 1.7 | GO:0001975 | response to amphetamine(GO:0001975) |
| 0.9 | 16.3 | GO:0050771 | negative regulation of axonogenesis(GO:0050771) |
| 0.8 | 0.8 | GO:0070571 | negative regulation of neuron projection regeneration(GO:0070571) |
| 0.8 | 4.2 | GO:0051152 | positive regulation of smooth muscle cell differentiation(GO:0051152) |
| 0.8 | 4.1 | GO:0006685 | sphingomyelin catabolic process(GO:0006685) |
| 0.8 | 1.6 | GO:0071899 | regulation of estrogen receptor binding(GO:0071898) negative regulation of estrogen receptor binding(GO:0071899) |
| 0.8 | 1.6 | GO:0042713 | sperm ejaculation(GO:0042713) |
| 0.8 | 0.8 | GO:0038026 | reelin-mediated signaling pathway(GO:0038026) |
| 0.8 | 4.0 | GO:0031339 | negative regulation of vesicle fusion(GO:0031339) |
| 0.8 | 65.2 | GO:0007612 | learning(GO:0007612) |
| 0.8 | 3.2 | GO:0016339 | calcium-dependent cell-cell adhesion via plasma membrane cell adhesion molecules(GO:0016339) |
| 0.8 | 16.0 | GO:2001222 | regulation of neuron migration(GO:2001222) |
| 0.8 | 1.6 | GO:1901386 | negative regulation of voltage-gated calcium channel activity(GO:1901386) |
| 0.8 | 4.8 | GO:0035418 | protein localization to synapse(GO:0035418) |
| 0.8 | 1.6 | GO:0021523 | somatic motor neuron differentiation(GO:0021523) |
| 0.8 | 1.6 | GO:0032097 | positive regulation of response to food(GO:0032097) positive regulation of appetite(GO:0032100) |
| 0.8 | 11.7 | GO:0051016 | barbed-end actin filament capping(GO:0051016) |
| 0.8 | 8.5 | GO:0051966 | regulation of synaptic transmission, glutamatergic(GO:0051966) |
| 0.8 | 52.7 | GO:0007156 | homophilic cell adhesion via plasma membrane adhesion molecules(GO:0007156) |
| 0.8 | 0.8 | GO:1901529 | positive regulation of anion channel activity(GO:1901529) |
| 0.8 | 1.5 | GO:0031915 | positive regulation of synaptic plasticity(GO:0031915) |
| 0.7 | 3.0 | GO:0097283 | keratinocyte apoptotic process(GO:0097283) regulation of keratinocyte apoptotic process(GO:1902172) |
| 0.7 | 1.5 | GO:2000766 | negative regulation of cytoplasmic translation(GO:2000766) |
| 0.7 | 3.0 | GO:1901621 | negative regulation of smoothened signaling pathway involved in dorsal/ventral neural tube patterning(GO:1901621) |
| 0.7 | 6.6 | GO:0007616 | long-term memory(GO:0007616) |
| 0.7 | 0.7 | GO:2000849 | glucocorticoid secretion(GO:0035933) regulation of glucocorticoid secretion(GO:2000849) |
| 0.7 | 2.2 | GO:1902564 | negative regulation of neutrophil activation(GO:1902564) |
| 0.7 | 1.4 | GO:0035973 | aggrephagy(GO:0035973) |
| 0.7 | 11.4 | GO:0007416 | synapse assembly(GO:0007416) |
| 0.7 | 0.7 | GO:0060278 | regulation of ovulation(GO:0060278) |
| 0.7 | 8.5 | GO:0046931 | pore complex assembly(GO:0046931) |
| 0.7 | 7.8 | GO:2000311 | regulation of alpha-amino-3-hydroxy-5-methyl-4-isoxazole propionate selective glutamate receptor activity(GO:2000311) |
| 0.7 | 3.5 | GO:2000253 | positive regulation of feeding behavior(GO:2000253) |
| 0.7 | 1.4 | GO:0071205 | protein localization to juxtaparanode region of axon(GO:0071205) |
| 0.7 | 2.1 | GO:2000686 | regulation of rubidium ion transmembrane transporter activity(GO:2000686) |
| 0.7 | 1.4 | GO:1904528 | regulation of microtubule binding(GO:1904526) positive regulation of microtubule binding(GO:1904528) |
| 0.7 | 0.7 | GO:0044340 | canonical Wnt signaling pathway involved in regulation of cell proliferation(GO:0044340) |
| 0.7 | 1.4 | GO:0042091 | interleukin-10 biosynthetic process(GO:0042091) regulation of interleukin-10 biosynthetic process(GO:0045074) |
| 0.7 | 2.1 | GO:0030327 | prenylated protein catabolic process(GO:0030327) |
| 0.7 | 8.9 | GO:0006376 | mRNA splice site selection(GO:0006376) |
| 0.7 | 3.4 | GO:0045113 | regulation of integrin biosynthetic process(GO:0045113) |
| 0.7 | 0.7 | GO:0070346 | positive regulation of fat cell proliferation(GO:0070346) |
| 0.7 | 2.0 | GO:0021570 | rhombomere 4 development(GO:0021570) |
| 0.7 | 1.4 | GO:2000048 | negative regulation of cell-cell adhesion mediated by cadherin(GO:2000048) |
| 0.7 | 1.4 | GO:0031547 | brain-derived neurotrophic factor receptor signaling pathway(GO:0031547) |
| 0.7 | 3.4 | GO:0016576 | histone dephosphorylation(GO:0016576) |
| 0.7 | 2.7 | GO:0060836 | lymphatic endothelial cell differentiation(GO:0060836) |
| 0.7 | 0.7 | GO:0006680 | glucosylceramide catabolic process(GO:0006680) |
| 0.7 | 3.3 | GO:0030432 | peristalsis(GO:0030432) |
| 0.7 | 0.7 | GO:0014042 | positive regulation of neuron maturation(GO:0014042) |
| 0.7 | 2.0 | GO:1904694 | negative regulation of vascular smooth muscle contraction(GO:1904694) |
| 0.7 | 17.9 | GO:0046839 | phospholipid dephosphorylation(GO:0046839) |
| 0.7 | 1.3 | GO:0010728 | regulation of hydrogen peroxide biosynthetic process(GO:0010728) |
| 0.7 | 2.0 | GO:0070948 | regulation of neutrophil mediated cytotoxicity(GO:0070948) regulation of neutrophil mediated killing of symbiont cell(GO:0070949) |
| 0.7 | 4.6 | GO:0016082 | synaptic vesicle priming(GO:0016082) |
| 0.7 | 0.7 | GO:1904948 | midbrain dopaminergic neuron differentiation(GO:1904948) |
| 0.6 | 3.2 | GO:0042989 | sequestering of actin monomers(GO:0042989) |
| 0.6 | 1.9 | GO:1902534 | single-organism membrane invagination(GO:1902534) |
| 0.6 | 3.8 | GO:0031115 | negative regulation of microtubule polymerization(GO:0031115) |
| 0.6 | 3.2 | GO:0021942 | radial glia guided migration of Purkinje cell(GO:0021942) |
| 0.6 | 1.9 | GO:0021707 | cerebellar granular layer formation(GO:0021684) cerebellar granule cell differentiation(GO:0021707) |
| 0.6 | 6.2 | GO:0030828 | positive regulation of cGMP biosynthetic process(GO:0030828) |
| 0.6 | 4.3 | GO:0060012 | synaptic transmission, glycinergic(GO:0060012) |
| 0.6 | 0.6 | GO:0008065 | establishment of blood-nerve barrier(GO:0008065) |
| 0.6 | 0.6 | GO:1902498 | regulation of protein autoubiquitination(GO:1902498) |
| 0.6 | 0.6 | GO:1903279 | regulation of calcium:sodium antiporter activity(GO:1903279) |
| 0.6 | 1.2 | GO:0009629 | response to gravity(GO:0009629) |
| 0.6 | 2.4 | GO:2000096 | positive regulation of Wnt signaling pathway, planar cell polarity pathway(GO:2000096) |
| 0.6 | 1.8 | GO:0006651 | diacylglycerol biosynthetic process(GO:0006651) |
| 0.6 | 1.2 | GO:0035609 | C-terminal protein deglutamylation(GO:0035609) |
| 0.6 | 0.6 | GO:0043553 | negative regulation of phosphatidylinositol 3-kinase activity(GO:0043553) |
| 0.6 | 1.2 | GO:1990035 | calcium ion import into cell(GO:1990035) |
| 0.6 | 4.2 | GO:1903044 | protein localization to membrane raft(GO:1903044) |
| 0.6 | 1.2 | GO:0010936 | negative regulation of macrophage cytokine production(GO:0010936) |
| 0.6 | 0.6 | GO:0051385 | response to mineralocorticoid(GO:0051385) |
| 0.6 | 0.6 | GO:0030397 | membrane disassembly(GO:0030397) nuclear envelope disassembly(GO:0051081) |
| 0.6 | 1.2 | GO:2000546 | positive regulation of cell chemotaxis to fibroblast growth factor(GO:1904849) positive regulation of endothelial cell chemotaxis to fibroblast growth factor(GO:2000546) |
| 0.6 | 5.3 | GO:0001967 | suckling behavior(GO:0001967) |
| 0.6 | 15.6 | GO:0019228 | neuronal action potential(GO:0019228) |
| 0.6 | 0.6 | GO:0014722 | regulation of skeletal muscle contraction by calcium ion signaling(GO:0014722) |
| 0.6 | 4.6 | GO:2000300 | regulation of synaptic vesicle exocytosis(GO:2000300) |
| 0.6 | 2.8 | GO:0009256 | 10-formyltetrahydrofolate metabolic process(GO:0009256) |
| 0.6 | 1.7 | GO:0060178 | regulation of exocyst localization(GO:0060178) |
| 0.5 | 4.9 | GO:0072501 | cellular divalent inorganic anion homeostasis(GO:0072501) |
| 0.5 | 3.8 | GO:1901538 | DNA methylation involved in embryo development(GO:0043045) changes to DNA methylation involved in embryo development(GO:1901538) |
| 0.5 | 5.4 | GO:0031507 | heterochromatin assembly(GO:0031507) |
| 0.5 | 1.6 | GO:2001013 | epithelial cell proliferation involved in renal tubule morphogenesis(GO:2001013) |
| 0.5 | 4.3 | GO:0042984 | amyloid precursor protein biosynthetic process(GO:0042983) regulation of amyloid precursor protein biosynthetic process(GO:0042984) |
| 0.5 | 1.6 | GO:0070314 | G1 to G0 transition(GO:0070314) |
| 0.5 | 2.7 | GO:0007168 | receptor guanylyl cyclase signaling pathway(GO:0007168) |
| 0.5 | 3.2 | GO:0060179 | male mating behavior(GO:0060179) |
| 0.5 | 3.2 | GO:1902231 | positive regulation of intrinsic apoptotic signaling pathway in response to DNA damage(GO:1902231) |
| 0.5 | 1.6 | GO:0015744 | succinate transport(GO:0015744) |
| 0.5 | 1.0 | GO:0001560 | regulation of cell growth by extracellular stimulus(GO:0001560) |
| 0.5 | 1.5 | GO:0009414 | response to water deprivation(GO:0009414) |
| 0.5 | 1.0 | GO:0070858 | negative regulation of bile acid biosynthetic process(GO:0070858) negative regulation of bile acid metabolic process(GO:1904252) |
| 0.5 | 2.0 | GO:0050966 | detection of mechanical stimulus involved in sensory perception of pain(GO:0050966) |
| 0.5 | 1.5 | GO:2000574 | regulation of microtubule motor activity(GO:2000574) |
| 0.5 | 3.0 | GO:0014059 | dopamine secretion(GO:0014046) regulation of dopamine secretion(GO:0014059) |
| 0.5 | 3.5 | GO:0046069 | cGMP catabolic process(GO:0046069) |
| 0.5 | 3.5 | GO:0006044 | N-acetylglucosamine metabolic process(GO:0006044) |
| 0.5 | 5.0 | GO:0033523 | histone H2B ubiquitination(GO:0033523) |
| 0.5 | 0.5 | GO:0071879 | positive regulation of adrenergic receptor signaling pathway(GO:0071879) |
| 0.5 | 1.0 | GO:0001992 | regulation of systemic arterial blood pressure by vasopressin(GO:0001992) |
| 0.5 | 1.0 | GO:0016560 | protein import into peroxisome matrix, docking(GO:0016560) |
| 0.5 | 0.5 | GO:0042420 | dopamine catabolic process(GO:0042420) |
| 0.5 | 1.0 | GO:1903800 | positive regulation of production of miRNAs involved in gene silencing by miRNA(GO:1903800) |
| 0.5 | 4.4 | GO:0021879 | forebrain neuron differentiation(GO:0021879) |
| 0.5 | 1.0 | GO:1900109 | regulation of histone H3-K9 dimethylation(GO:1900109) |
| 0.5 | 9.6 | GO:0051489 | regulation of filopodium assembly(GO:0051489) |
| 0.5 | 1.9 | GO:0021871 | forebrain regionalization(GO:0021871) |
| 0.5 | 1.4 | GO:1904749 | regulation of protein localization to nucleolus(GO:1904749) positive regulation of protein localization to nucleolus(GO:1904751) |
| 0.5 | 3.8 | GO:0021670 | lateral ventricle development(GO:0021670) |
| 0.5 | 1.9 | GO:2001286 | regulation of caveolin-mediated endocytosis(GO:2001286) |
| 0.5 | 1.4 | GO:0035553 | oxidative RNA demethylation(GO:0035513) oxidative single-stranded RNA demethylation(GO:0035553) |
| 0.5 | 1.8 | GO:0021988 | olfactory lobe development(GO:0021988) |
| 0.5 | 1.4 | GO:0090074 | negative regulation of protein homodimerization activity(GO:0090074) |
| 0.5 | 0.5 | GO:2000017 | positive regulation of determination of dorsal identity(GO:2000017) |
| 0.5 | 0.9 | GO:0055099 | response to high density lipoprotein particle(GO:0055099) |
| 0.4 | 0.9 | GO:0019064 | fusion of virus membrane with host plasma membrane(GO:0019064) membrane fusion involved in viral entry into host cell(GO:0039663) multi-organism membrane fusion(GO:0044800) |
| 0.4 | 1.3 | GO:0002678 | positive regulation of chronic inflammatory response(GO:0002678) |
| 0.4 | 4.0 | GO:0045475 | locomotor rhythm(GO:0045475) |
| 0.4 | 0.4 | GO:0035633 | maintenance of blood-brain barrier(GO:0035633) |
| 0.4 | 0.4 | GO:0072092 | ureteric bud invasion(GO:0072092) |
| 0.4 | 0.9 | GO:1903237 | negative regulation of leukocyte tethering or rolling(GO:1903237) |
| 0.4 | 5.3 | GO:0051127 | positive regulation of actin nucleation(GO:0051127) |
| 0.4 | 0.4 | GO:0046499 | S-adenosylmethioninamine metabolic process(GO:0046499) |
| 0.4 | 1.3 | GO:0014028 | notochord formation(GO:0014028) |
| 0.4 | 1.3 | GO:0098795 | mRNA cleavage involved in gene silencing by miRNA(GO:0035279) mRNA cleavage involved in gene silencing(GO:0098795) |
| 0.4 | 0.9 | GO:0071873 | response to norepinephrine(GO:0071873) |
| 0.4 | 12.2 | GO:0043252 | sodium-independent organic anion transport(GO:0043252) |
| 0.4 | 3.0 | GO:0042760 | very long-chain fatty acid catabolic process(GO:0042760) |
| 0.4 | 1.7 | GO:0035989 | tendon development(GO:0035989) |
| 0.4 | 2.6 | GO:0035280 | miRNA loading onto RISC involved in gene silencing by miRNA(GO:0035280) |
| 0.4 | 0.4 | GO:0045163 | clustering of voltage-gated potassium channels(GO:0045163) |
| 0.4 | 0.4 | GO:2000095 | regulation of Wnt signaling pathway, planar cell polarity pathway(GO:2000095) |
| 0.4 | 5.1 | GO:0032094 | response to food(GO:0032094) |
| 0.4 | 1.3 | GO:0042769 | DNA damage response, detection of DNA damage(GO:0042769) |
| 0.4 | 0.8 | GO:0070672 | response to interleukin-15(GO:0070672) |
| 0.4 | 0.4 | GO:0034770 | histone H4-K20 methylation(GO:0034770) |
| 0.4 | 1.2 | GO:2000586 | regulation of platelet-derived growth factor receptor-beta signaling pathway(GO:2000586) negative regulation of platelet-derived growth factor receptor-beta signaling pathway(GO:2000587) |
| 0.4 | 0.8 | GO:0015888 | thiamine transport(GO:0015888) |
| 0.4 | 3.7 | GO:0006054 | N-acetylneuraminate metabolic process(GO:0006054) |
| 0.4 | 18.8 | GO:0007218 | neuropeptide signaling pathway(GO:0007218) |
| 0.4 | 0.8 | GO:0060825 | fibroblast growth factor receptor signaling pathway involved in neural plate anterior/posterior pattern formation(GO:0060825) regulation of fibroblast growth factor receptor signaling pathway involved in neural plate anterior/posterior pattern formation(GO:2000313) |
| 0.4 | 0.8 | GO:0060075 | regulation of resting membrane potential(GO:0060075) |
| 0.4 | 2.0 | GO:0021984 | adenohypophysis development(GO:0021984) |
| 0.4 | 2.0 | GO:0090331 | negative regulation of platelet aggregation(GO:0090331) |
| 0.4 | 1.2 | GO:1903998 | regulation of eating behavior(GO:1903998) |
| 0.4 | 2.8 | GO:0035269 | protein O-linked mannosylation(GO:0035269) |
| 0.4 | 2.8 | GO:0046847 | filopodium assembly(GO:0046847) |
| 0.4 | 1.6 | GO:0035247 | peptidyl-arginine methylation, to asymmetrical-dimethyl arginine(GO:0019919) peptidyl-arginine omega-N-methylation(GO:0035247) |
| 0.4 | 0.4 | GO:0044341 | sodium-dependent phosphate transport(GO:0044341) |
| 0.4 | 25.7 | GO:0097485 | neuron projection guidance(GO:0097485) |
| 0.4 | 2.4 | GO:0014003 | oligodendrocyte development(GO:0014003) |
| 0.4 | 2.4 | GO:0043615 | astrocyte cell migration(GO:0043615) |
| 0.4 | 8.2 | GO:0006491 | N-glycan processing(GO:0006491) |
| 0.4 | 1.5 | GO:0006566 | threonine metabolic process(GO:0006566) |
| 0.4 | 15.6 | GO:0007040 | lysosome organization(GO:0007040) lytic vacuole organization(GO:0080171) |
| 0.4 | 2.3 | GO:0051386 | regulation of neurotrophin TRK receptor signaling pathway(GO:0051386) |
| 0.4 | 1.1 | GO:0006177 | GMP biosynthetic process(GO:0006177) |
| 0.4 | 1.1 | GO:0051684 | maintenance of Golgi location(GO:0051684) |
| 0.4 | 0.7 | GO:0060468 | prevention of polyspermy(GO:0060468) |
| 0.4 | 2.2 | GO:0015846 | polyamine transport(GO:0015846) |
| 0.4 | 2.2 | GO:0061003 | positive regulation of dendritic spine morphogenesis(GO:0061003) |
| 0.4 | 0.7 | GO:2000667 | positive regulation of interleukin-5 secretion(GO:2000664) positive regulation of interleukin-13 secretion(GO:2000667) |
| 0.4 | 0.4 | GO:0051593 | response to folic acid(GO:0051593) |
| 0.4 | 1.1 | GO:0043267 | negative regulation of potassium ion transport(GO:0043267) |
| 0.4 | 0.4 | GO:1902630 | regulation of membrane hyperpolarization(GO:1902630) |
| 0.4 | 1.1 | GO:0031620 | regulation of fever generation(GO:0031620) |
| 0.4 | 0.4 | GO:0006106 | fumarate metabolic process(GO:0006106) |
| 0.4 | 1.1 | GO:1904378 | maintenance of unfolded protein(GO:0036506) maintenance of unfolded protein involved in ERAD pathway(GO:1904378) |
| 0.4 | 0.7 | GO:0090170 | MAPK import into nucleus(GO:0000189) regulation of Golgi inheritance(GO:0090170) |
| 0.4 | 2.2 | GO:0002591 | positive regulation of antigen processing and presentation of peptide antigen via MHC class I(GO:0002591) |
| 0.4 | 1.4 | GO:1902913 | positive regulation of neuroepithelial cell differentiation(GO:1902913) |
| 0.4 | 0.7 | GO:0000720 | pyrimidine dimer repair by nucleotide-excision repair(GO:0000720) |
| 0.4 | 0.4 | GO:2000172 | regulation of branching morphogenesis of a nerve(GO:2000172) |
| 0.4 | 0.7 | GO:0048934 | peripheral nervous system neuron differentiation(GO:0048934) peripheral nervous system neuron development(GO:0048935) |
| 0.4 | 0.7 | GO:0090135 | actin filament branching(GO:0090135) |
| 0.4 | 0.7 | GO:0061001 | regulation of dendritic spine morphogenesis(GO:0061001) |
| 0.4 | 4.6 | GO:0034587 | piRNA metabolic process(GO:0034587) |
| 0.4 | 3.9 | GO:1905145 | acetylcholine receptor signaling pathway(GO:0095500) postsynaptic signal transduction(GO:0098926) signal transduction involved in cellular response to ammonium ion(GO:1903831) response to acetylcholine(GO:1905144) cellular response to acetylcholine(GO:1905145) |
| 0.4 | 3.9 | GO:0006828 | manganese ion transport(GO:0006828) |
| 0.4 | 2.1 | GO:0015884 | folic acid transport(GO:0015884) |
| 0.4 | 0.4 | GO:1903116 | positive regulation of actin filament-based movement(GO:1903116) |
| 0.4 | 0.7 | GO:0010360 | negative regulation of anion channel activity(GO:0010360) |
| 0.3 | 2.1 | GO:0042866 | pyruvate biosynthetic process(GO:0042866) |
| 0.3 | 1.0 | GO:0070164 | negative regulation of adiponectin secretion(GO:0070164) |
| 0.3 | 1.7 | GO:0048670 | regulation of collateral sprouting(GO:0048670) |
| 0.3 | 2.4 | GO:0070914 | UV-damage excision repair(GO:0070914) |
| 0.3 | 1.7 | GO:0032049 | cardiolipin biosynthetic process(GO:0032049) |
| 0.3 | 0.3 | GO:1903715 | regulation of aerobic respiration(GO:1903715) |
| 0.3 | 6.1 | GO:0050885 | neuromuscular process controlling balance(GO:0050885) |
| 0.3 | 0.3 | GO:0000320 | re-entry into mitotic cell cycle(GO:0000320) |
| 0.3 | 0.7 | GO:0043578 | nuclear matrix organization(GO:0043578) nuclear matrix anchoring at nuclear membrane(GO:0090292) |
| 0.3 | 0.7 | GO:0034729 | histone H3-K79 methylation(GO:0034729) |
| 0.3 | 1.0 | GO:1901301 | regulation of cargo loading into COPII-coated vesicle(GO:1901301) |
| 0.3 | 1.0 | GO:0019859 | pyrimidine nucleobase catabolic process(GO:0006208) thymine catabolic process(GO:0006210) thymine metabolic process(GO:0019859) |
| 0.3 | 1.0 | GO:0006564 | L-serine biosynthetic process(GO:0006564) |
| 0.3 | 1.3 | GO:0033762 | response to glucagon(GO:0033762) |
| 0.3 | 1.0 | GO:0060339 | negative regulation of type I interferon-mediated signaling pathway(GO:0060339) |
| 0.3 | 1.6 | GO:0000022 | mitotic spindle elongation(GO:0000022) mitotic spindle midzone assembly(GO:0051256) |
| 0.3 | 1.6 | GO:0006361 | transcription initiation from RNA polymerase I promoter(GO:0006361) |
| 0.3 | 0.3 | GO:0090191 | negative regulation of branching involved in ureteric bud morphogenesis(GO:0090191) |
| 0.3 | 1.0 | GO:1903774 | positive regulation of viral budding via host ESCRT complex(GO:1903774) |
| 0.3 | 0.9 | GO:0032202 | telomere assembly(GO:0032202) |
| 0.3 | 1.6 | GO:0090190 | positive regulation of branching involved in ureteric bud morphogenesis(GO:0090190) |
| 0.3 | 0.6 | GO:2000598 | regulation of cyclin catabolic process(GO:2000598) negative regulation of cyclin catabolic process(GO:2000599) |
| 0.3 | 1.8 | GO:0001921 | positive regulation of receptor recycling(GO:0001921) |
| 0.3 | 0.6 | GO:0016539 | intein-mediated protein splicing(GO:0016539) protein splicing(GO:0030908) |
| 0.3 | 0.6 | GO:1902309 | negative regulation of peptidyl-serine dephosphorylation(GO:1902309) |
| 0.3 | 6.0 | GO:0042462 | eye photoreceptor cell development(GO:0042462) |
| 0.3 | 0.9 | GO:0070309 | lens fiber cell morphogenesis(GO:0070309) |
| 0.3 | 0.9 | GO:0019464 | glycine catabolic process(GO:0006546) glycine decarboxylation via glycine cleavage system(GO:0019464) |
| 0.3 | 1.2 | GO:0006627 | protein processing involved in protein targeting to mitochondrion(GO:0006627) |
| 0.3 | 0.3 | GO:2000110 | negative regulation of macrophage apoptotic process(GO:2000110) |
| 0.3 | 0.3 | GO:0045448 | regulation of mitotic cell cycle, embryonic(GO:0009794) mitotic cell cycle, embryonic(GO:0045448) |
| 0.3 | 2.0 | GO:0060294 | cilium movement involved in cell motility(GO:0060294) |
| 0.3 | 0.9 | GO:1901029 | negative regulation of mitochondrial outer membrane permeabilization involved in apoptotic signaling pathway(GO:1901029) |
| 0.3 | 0.6 | GO:0021854 | hypothalamus development(GO:0021854) |
| 0.3 | 2.2 | GO:0010826 | negative regulation of centrosome duplication(GO:0010826) negative regulation of centrosome cycle(GO:0046606) |
| 0.3 | 0.8 | GO:1905098 | negative regulation of guanyl-nucleotide exchange factor activity(GO:1905098) |
| 0.3 | 1.1 | GO:0044387 | negative regulation of protein kinase activity by regulation of protein phosphorylation(GO:0044387) |
| 0.3 | 1.1 | GO:2000651 | positive regulation of sodium ion transmembrane transporter activity(GO:2000651) |
| 0.3 | 1.1 | GO:0071847 | TNFSF11-mediated signaling pathway(GO:0071847) |
| 0.3 | 1.1 | GO:0072396 | response to cell cycle checkpoint signaling(GO:0072396) response to DNA integrity checkpoint signaling(GO:0072402) response to DNA damage checkpoint signaling(GO:0072423) |
| 0.3 | 1.7 | GO:1901724 | positive regulation of cell proliferation involved in kidney development(GO:1901724) |
| 0.3 | 1.1 | GO:0030091 | protein repair(GO:0030091) |
| 0.3 | 0.8 | GO:0090240 | positive regulation of histone H4 acetylation(GO:0090240) |
| 0.3 | 1.1 | GO:0038031 | non-canonical Wnt signaling pathway via JNK cascade(GO:0038031) |
| 0.3 | 0.5 | GO:0061418 | regulation of transcription from RNA polymerase II promoter in response to hypoxia(GO:0061418) |
| 0.3 | 0.5 | GO:0016259 | selenocysteine metabolic process(GO:0016259) |
| 0.3 | 1.3 | GO:0030321 | transepithelial chloride transport(GO:0030321) |
| 0.3 | 0.8 | GO:0034983 | peptidyl-lysine deacetylation(GO:0034983) |
| 0.3 | 0.3 | GO:0014734 | skeletal muscle hypertrophy(GO:0014734) |
| 0.3 | 1.3 | GO:0043562 | cellular response to nitrogen starvation(GO:0006995) cellular response to nitrogen levels(GO:0043562) |
| 0.3 | 0.3 | GO:0061502 | early endosome to recycling endosome transport(GO:0061502) |
| 0.3 | 2.6 | GO:1990403 | embryonic brain development(GO:1990403) |
| 0.3 | 0.5 | GO:1902730 | regulation of heparan sulfate proteoglycan biosynthetic process(GO:0010908) positive regulation of heparan sulfate proteoglycan biosynthetic process(GO:0010909) positive regulation of proteoglycan biosynthetic process(GO:1902730) |
| 0.3 | 0.8 | GO:0045041 | protein import into mitochondrial intermembrane space(GO:0045041) |
| 0.3 | 0.8 | GO:0035964 | COPI-coated vesicle budding(GO:0035964) |
| 0.3 | 0.8 | GO:1901491 | negative regulation of lymphangiogenesis(GO:1901491) |
| 0.3 | 0.5 | GO:0089700 | protein kinase D signaling(GO:0089700) |
| 0.3 | 0.8 | GO:0046341 | CDP-diacylglycerol metabolic process(GO:0046341) |
| 0.3 | 1.8 | GO:0019226 | transmission of nerve impulse(GO:0019226) |
| 0.3 | 5.4 | GO:0021549 | cerebellum development(GO:0021549) |
| 0.3 | 0.3 | GO:0018076 | N-terminal peptidyl-lysine acetylation(GO:0018076) |
| 0.3 | 4.3 | GO:0048791 | calcium ion-regulated exocytosis of neurotransmitter(GO:0048791) |
| 0.3 | 1.0 | GO:0070940 | dephosphorylation of RNA polymerase II C-terminal domain(GO:0070940) |
| 0.3 | 3.5 | GO:0032011 | ARF protein signal transduction(GO:0032011) regulation of ARF protein signal transduction(GO:0032012) |
| 0.3 | 0.3 | GO:0046881 | positive regulation of follicle-stimulating hormone secretion(GO:0046881) |
| 0.2 | 1.2 | GO:0006528 | asparagine metabolic process(GO:0006528) |
| 0.2 | 0.7 | GO:0000733 | DNA strand renaturation(GO:0000733) |
| 0.2 | 0.5 | GO:0001922 | B-1 B cell homeostasis(GO:0001922) |
| 0.2 | 2.0 | GO:0006622 | protein targeting to lysosome(GO:0006622) |
| 0.2 | 1.7 | GO:0018026 | peptidyl-lysine monomethylation(GO:0018026) |
| 0.2 | 1.0 | GO:1900364 | regulation of mRNA polyadenylation(GO:1900363) negative regulation of mRNA polyadenylation(GO:1900364) |
| 0.2 | 2.0 | GO:0060359 | response to ammonium ion(GO:0060359) |
| 0.2 | 0.5 | GO:0040009 | regulation of growth rate(GO:0040009) |
| 0.2 | 1.2 | GO:0031987 | locomotion involved in locomotory behavior(GO:0031987) |
| 0.2 | 0.5 | GO:0060648 | mammary gland bud morphogenesis(GO:0060648) |
| 0.2 | 0.7 | GO:0010446 | response to alkaline pH(GO:0010446) |
| 0.2 | 0.5 | GO:0097062 | dendritic spine maintenance(GO:0097062) |
| 0.2 | 0.7 | GO:2000052 | positive regulation of non-canonical Wnt signaling pathway(GO:2000052) |
| 0.2 | 2.4 | GO:0034389 | lipid particle organization(GO:0034389) |
| 0.2 | 0.2 | GO:0060700 | regulation of ribonuclease activity(GO:0060700) |
| 0.2 | 2.1 | GO:0034063 | stress granule assembly(GO:0034063) |
| 0.2 | 0.5 | GO:1902445 | regulation of mitochondrial membrane permeability involved in programmed necrotic cell death(GO:1902445) |
| 0.2 | 0.2 | GO:2000383 | regulation of ectoderm development(GO:2000383) negative regulation of ectoderm development(GO:2000384) |
| 0.2 | 0.7 | GO:0046379 | extracellular polysaccharide biosynthetic process(GO:0045226) extracellular polysaccharide metabolic process(GO:0046379) |
| 0.2 | 0.2 | GO:0021546 | rhombomere development(GO:0021546) |
| 0.2 | 0.7 | GO:0045760 | positive regulation of action potential(GO:0045760) |
| 0.2 | 0.7 | GO:0006420 | arginyl-tRNA aminoacylation(GO:0006420) |
| 0.2 | 2.8 | GO:0051294 | establishment of spindle orientation(GO:0051294) |
| 0.2 | 0.7 | GO:0002636 | positive regulation of germinal center formation(GO:0002636) |
| 0.2 | 0.7 | GO:0051182 | coenzyme transport(GO:0051182) |
| 0.2 | 0.2 | GO:0097029 | mature conventional dendritic cell differentiation(GO:0097029) |
| 0.2 | 0.7 | GO:0036481 | intrinsic apoptotic signaling pathway in response to hydrogen peroxide(GO:0036481) |
| 0.2 | 0.2 | GO:1990034 | calcium ion export from cell(GO:1990034) |
| 0.2 | 1.1 | GO:0072540 | T-helper 17 cell lineage commitment(GO:0072540) |
| 0.2 | 0.2 | GO:0051231 | spindle elongation(GO:0051231) |
| 0.2 | 0.2 | GO:0035054 | embryonic heart tube anterior/posterior pattern specification(GO:0035054) |
| 0.2 | 2.6 | GO:0030322 | stabilization of membrane potential(GO:0030322) |
| 0.2 | 0.4 | GO:0010986 | positive regulation of lipoprotein particle clearance(GO:0010986) |
| 0.2 | 1.3 | GO:0048172 | regulation of short-term neuronal synaptic plasticity(GO:0048172) |
| 0.2 | 0.9 | GO:2000399 | negative regulation of thymocyte aggregation(GO:2000399) |
| 0.2 | 1.1 | GO:0046836 | glycolipid transport(GO:0046836) |
| 0.2 | 13.2 | GO:0010923 | negative regulation of phosphatase activity(GO:0010923) |
| 0.2 | 7.3 | GO:0050770 | regulation of axonogenesis(GO:0050770) |
| 0.2 | 0.2 | GO:0090110 | cargo loading into COPII-coated vesicle(GO:0090110) |
| 0.2 | 0.6 | GO:0006172 | ADP biosynthetic process(GO:0006172) |
| 0.2 | 0.6 | GO:0071798 | response to prostaglandin D(GO:0071798) cellular response to prostaglandin D stimulus(GO:0071799) |
| 0.2 | 1.6 | GO:0032239 | regulation of nucleobase-containing compound transport(GO:0032239) |
| 0.2 | 1.2 | GO:0051418 | interphase microtubule nucleation by interphase microtubule organizing center(GO:0051415) microtubule nucleation by microtubule organizing center(GO:0051418) |
| 0.2 | 0.2 | GO:0003419 | growth plate cartilage chondrocyte proliferation(GO:0003419) |
| 0.2 | 0.4 | GO:0061055 | myotome development(GO:0061055) |
| 0.2 | 0.2 | GO:0045869 | negative regulation of single stranded viral RNA replication via double stranded DNA intermediate(GO:0045869) |
| 0.2 | 0.8 | GO:0030263 | apoptotic chromosome condensation(GO:0030263) |
| 0.2 | 1.4 | GO:0034625 | fatty acid elongation, saturated fatty acid(GO:0019367) fatty acid elongation, unsaturated fatty acid(GO:0019368) fatty acid elongation, monounsaturated fatty acid(GO:0034625) fatty acid elongation, polyunsaturated fatty acid(GO:0034626) |
| 0.2 | 3.2 | GO:0032528 | microvillus organization(GO:0032528) |
| 0.2 | 0.4 | GO:0007066 | female meiosis sister chromatid cohesion(GO:0007066) |
| 0.2 | 0.8 | GO:0061668 | mitochondrial ribosome assembly(GO:0061668) |
| 0.2 | 0.4 | GO:0061304 | retinal blood vessel morphogenesis(GO:0061304) |
| 0.2 | 0.8 | GO:1903071 | positive regulation of ER-associated ubiquitin-dependent protein catabolic process(GO:1903071) |
| 0.2 | 0.8 | GO:0046013 | regulation of T cell homeostatic proliferation(GO:0046013) |
| 0.2 | 0.4 | GO:0060620 | regulation of cholesterol import(GO:0060620) regulation of sterol import(GO:2000909) |
| 0.2 | 0.2 | GO:0072553 | terminal button organization(GO:0072553) |
| 0.2 | 1.4 | GO:1900264 | regulation of DNA-directed DNA polymerase activity(GO:1900262) positive regulation of DNA-directed DNA polymerase activity(GO:1900264) |
| 0.2 | 0.2 | GO:1901490 | regulation of lymphangiogenesis(GO:1901490) positive regulation of lymphangiogenesis(GO:1901492) |
| 0.2 | 1.0 | GO:0080182 | histone H3-K4 trimethylation(GO:0080182) |
| 0.2 | 0.6 | GO:0035385 | Roundabout signaling pathway(GO:0035385) |
| 0.2 | 0.6 | GO:1901097 | negative regulation of autophagosome maturation(GO:1901097) |
| 0.2 | 0.4 | GO:0008291 | acetylcholine metabolic process(GO:0008291) acetate ester metabolic process(GO:1900619) |
| 0.2 | 1.9 | GO:0036065 | fucosylation(GO:0036065) |
| 0.2 | 0.9 | GO:0030174 | regulation of DNA-dependent DNA replication initiation(GO:0030174) |
| 0.2 | 1.3 | GO:0032986 | nucleosome disassembly(GO:0006337) protein-DNA complex disassembly(GO:0032986) |
| 0.2 | 0.6 | GO:0070375 | ERK5 cascade(GO:0070375) |
| 0.2 | 0.7 | GO:0042138 | meiotic DNA double-strand break formation(GO:0042138) |
| 0.2 | 0.2 | GO:1903238 | positive regulation of leukocyte tethering or rolling(GO:1903238) |
| 0.2 | 2.8 | GO:0030262 | cellular component disassembly involved in execution phase of apoptosis(GO:0006921) apoptotic nuclear changes(GO:0030262) |
| 0.2 | 4.0 | GO:0007340 | acrosome reaction(GO:0007340) |
| 0.2 | 0.7 | GO:1900113 | negative regulation of histone H3-K9 trimethylation(GO:1900113) |
| 0.2 | 0.5 | GO:0009233 | menaquinone metabolic process(GO:0009233) |
| 0.2 | 1.1 | GO:0007342 | fusion of sperm to egg plasma membrane(GO:0007342) |
| 0.2 | 0.2 | GO:0097680 | double-strand break repair via classical nonhomologous end joining(GO:0097680) |
| 0.2 | 0.4 | GO:0045578 | negative regulation of B cell differentiation(GO:0045578) |
| 0.2 | 6.7 | GO:0007409 | axonogenesis(GO:0007409) |
| 0.2 | 0.4 | GO:1902774 | late endosome to lysosome transport(GO:1902774) |
| 0.2 | 0.2 | GO:0071816 | protein insertion into ER membrane(GO:0045048) tail-anchored membrane protein insertion into ER membrane(GO:0071816) |
| 0.2 | 0.4 | GO:0015808 | L-alanine transport(GO:0015808) |
| 0.2 | 1.2 | GO:1901409 | regulation of phosphorylation of RNA polymerase II C-terminal domain(GO:1901407) positive regulation of phosphorylation of RNA polymerase II C-terminal domain(GO:1901409) |
| 0.2 | 0.5 | GO:0006362 | transcription elongation from RNA polymerase I promoter(GO:0006362) |
| 0.2 | 0.7 | GO:0034969 | histone arginine methylation(GO:0034969) |
| 0.2 | 0.3 | GO:2000698 | positive regulation of epithelial cell differentiation involved in kidney development(GO:2000698) |
| 0.2 | 0.7 | GO:0016557 | peroxisome membrane biogenesis(GO:0016557) |
| 0.2 | 0.5 | GO:0006216 | cytidine catabolic process(GO:0006216) cytidine deamination(GO:0009972) cytidine metabolic process(GO:0046087) |
| 0.2 | 0.3 | GO:0035092 | sperm chromatin condensation(GO:0035092) |
| 0.2 | 0.2 | GO:0060916 | mesenchymal cell proliferation involved in lung development(GO:0060916) |
| 0.2 | 0.2 | GO:0072008 | glomerular mesangial cell differentiation(GO:0072008) glomerular mesangial cell development(GO:0072144) |
| 0.2 | 4.5 | GO:0045599 | negative regulation of fat cell differentiation(GO:0045599) |
| 0.2 | 0.5 | GO:0050955 | thermoception(GO:0050955) |
| 0.2 | 0.2 | GO:0007638 | mechanosensory behavior(GO:0007638) |
| 0.2 | 0.8 | GO:0071786 | endoplasmic reticulum tubular network organization(GO:0071786) |
| 0.2 | 0.7 | GO:0070172 | positive regulation of tooth mineralization(GO:0070172) |
| 0.2 | 0.6 | GO:0035414 | negative regulation of catenin import into nucleus(GO:0035414) |
| 0.2 | 0.5 | GO:0018364 | peptidyl-glutamine methylation(GO:0018364) |
| 0.2 | 0.2 | GO:0017085 | response to insecticide(GO:0017085) |
| 0.2 | 0.2 | GO:0032289 | central nervous system myelin formation(GO:0032289) |
| 0.2 | 0.6 | GO:0045657 | positive regulation of monocyte differentiation(GO:0045657) |
| 0.2 | 0.6 | GO:0010458 | exit from mitosis(GO:0010458) |
| 0.2 | 0.5 | GO:0051574 | positive regulation of histone H3-K9 methylation(GO:0051574) |
| 0.2 | 0.5 | GO:0060231 | mesenchymal to epithelial transition(GO:0060231) |
| 0.2 | 0.2 | GO:0061738 | late endosomal microautophagy(GO:0061738) |
| 0.2 | 0.2 | GO:0031446 | regulation of fast-twitch skeletal muscle fiber contraction(GO:0031446) positive regulation of fast-twitch skeletal muscle fiber contraction(GO:0031448) |
| 0.2 | 0.2 | GO:0018125 | peptidyl-cysteine methylation(GO:0018125) |
| 0.2 | 0.3 | GO:0048290 | isotype switching to IgA isotypes(GO:0048290) regulation of isotype switching to IgA isotypes(GO:0048296) |
| 0.2 | 1.2 | GO:0048168 | regulation of neuronal synaptic plasticity(GO:0048168) |
| 0.2 | 0.3 | GO:0046487 | glyoxylate metabolic process(GO:0046487) |
| 0.2 | 0.3 | GO:0042851 | L-alanine metabolic process(GO:0042851) |
| 0.2 | 0.9 | GO:0072311 | renal filtration cell differentiation(GO:0061318) glomerular epithelium development(GO:0072010) glomerular visceral epithelial cell differentiation(GO:0072112) glomerular epithelial cell differentiation(GO:0072311) |
| 0.2 | 0.2 | GO:0009298 | GDP-mannose biosynthetic process(GO:0009298) |
| 0.2 | 0.2 | GO:0031652 | positive regulation of heat generation(GO:0031652) |
| 0.1 | 1.2 | GO:0036342 | post-anal tail morphogenesis(GO:0036342) |
| 0.1 | 0.3 | GO:0044065 | regulation of respiratory system process(GO:0044065) |
| 0.1 | 0.3 | GO:0061428 | negative regulation of transcription from RNA polymerase II promoter in response to hypoxia(GO:0061428) |
| 0.1 | 0.7 | GO:0030259 | lipid glycosylation(GO:0030259) |
| 0.1 | 0.4 | GO:0090289 | regulation of osteoclast proliferation(GO:0090289) positive regulation of osteoclast proliferation(GO:0090290) |
| 0.1 | 0.3 | GO:0015014 | heparan sulfate proteoglycan biosynthetic process, polysaccharide chain biosynthetic process(GO:0015014) |
| 0.1 | 1.3 | GO:0048280 | vesicle fusion with Golgi apparatus(GO:0048280) |
| 0.1 | 13.0 | GO:0071804 | cellular potassium ion transport(GO:0071804) |
| 0.1 | 1.2 | GO:0043651 | linoleic acid metabolic process(GO:0043651) |
| 0.1 | 0.3 | GO:0002485 | antigen processing and presentation of endogenous peptide antigen via MHC class I via ER pathway(GO:0002484) antigen processing and presentation of endogenous peptide antigen via MHC class I via ER pathway, TAP-dependent(GO:0002485) |
| 0.1 | 0.3 | GO:0070317 | negative regulation of G0 to G1 transition(GO:0070317) |
| 0.1 | 0.4 | GO:0019695 | choline metabolic process(GO:0019695) |
| 0.1 | 0.1 | GO:0097466 | glycoprotein ERAD pathway(GO:0097466) response to glycoprotein(GO:1904587) |
| 0.1 | 2.3 | GO:0007405 | neuroblast proliferation(GO:0007405) |
| 0.1 | 0.1 | GO:2000370 | positive regulation of clathrin-mediated endocytosis(GO:2000370) |
| 0.1 | 2.0 | GO:0050650 | chondroitin sulfate proteoglycan biosynthetic process(GO:0050650) |
| 0.1 | 1.1 | GO:0046755 | viral budding(GO:0046755) multi-organism organelle organization(GO:1902590) multi-organism membrane budding(GO:1902592) |
| 0.1 | 0.1 | GO:0015817 | histidine transport(GO:0015817) |
| 0.1 | 0.3 | GO:0001927 | exocyst assembly(GO:0001927) |
| 0.1 | 1.0 | GO:0051026 | chiasma assembly(GO:0051026) |
| 0.1 | 0.6 | GO:0043266 | regulation of potassium ion transport(GO:0043266) |
| 0.1 | 0.6 | GO:0010666 | positive regulation of striated muscle cell apoptotic process(GO:0010663) positive regulation of cardiac muscle cell apoptotic process(GO:0010666) |
| 0.1 | 2.3 | GO:0051443 | positive regulation of ubiquitin-protein transferase activity(GO:0051443) |
| 0.1 | 0.8 | GO:0007288 | sperm axoneme assembly(GO:0007288) |
| 0.1 | 1.1 | GO:0032988 | ribonucleoprotein complex disassembly(GO:0032988) |
| 0.1 | 1.1 | GO:0097094 | craniofacial suture morphogenesis(GO:0097094) |
| 0.1 | 0.3 | GO:0043654 | recognition of apoptotic cell(GO:0043654) |
| 0.1 | 0.5 | GO:0042483 | negative regulation of odontogenesis(GO:0042483) |
| 0.1 | 0.5 | GO:0032827 | natural killer cell differentiation involved in immune response(GO:0002325) negative regulation of natural killer cell differentiation(GO:0032824) regulation of natural killer cell differentiation involved in immune response(GO:0032826) negative regulation of natural killer cell differentiation involved in immune response(GO:0032827) |
| 0.1 | 0.4 | GO:0070900 | mitochondrial tRNA modification(GO:0070900) mitochondrial RNA modification(GO:1900864) |
| 0.1 | 0.1 | GO:0070669 | response to interleukin-2(GO:0070669) |
| 0.1 | 0.3 | GO:0032066 | nucleolus to nucleoplasm transport(GO:0032066) |
| 0.1 | 0.4 | GO:0045085 | negative regulation of interleukin-2 biosynthetic process(GO:0045085) |
| 0.1 | 0.3 | GO:0032439 | endosome localization(GO:0032439) |
| 0.1 | 2.0 | GO:2000785 | regulation of autophagosome assembly(GO:2000785) |
| 0.1 | 0.3 | GO:0090310 | negative regulation of methylation-dependent chromatin silencing(GO:0090310) |
| 0.1 | 0.1 | GO:0032741 | positive regulation of interleukin-18 production(GO:0032741) |
| 0.1 | 0.4 | GO:0046951 | ketone body biosynthetic process(GO:0046951) |
| 0.1 | 0.4 | GO:0007060 | male meiosis chromosome segregation(GO:0007060) |
| 0.1 | 0.2 | GO:0014901 | regulation of satellite cell activation involved in skeletal muscle regeneration(GO:0014717) satellite cell activation involved in skeletal muscle regeneration(GO:0014901) |
| 0.1 | 0.1 | GO:0060155 | platelet dense granule organization(GO:0060155) |
| 0.1 | 0.2 | GO:0048294 | negative regulation of isotype switching(GO:0045829) negative regulation of isotype switching to IgE isotypes(GO:0048294) |
| 0.1 | 0.4 | GO:0006553 | lysine metabolic process(GO:0006553) |
| 0.1 | 0.4 | GO:0019853 | L-ascorbic acid biosynthetic process(GO:0019853) |
| 0.1 | 0.2 | GO:0035095 | behavioral response to nicotine(GO:0035095) |
| 0.1 | 0.4 | GO:0042363 | vitamin catabolic process(GO:0009111) fat-soluble vitamin catabolic process(GO:0042363) |
| 0.1 | 0.4 | GO:0006667 | sphinganine metabolic process(GO:0006667) |
| 0.1 | 0.1 | GO:0061043 | regulation of vascular wound healing(GO:0061043) |
| 0.1 | 0.1 | GO:0071698 | olfactory placode formation(GO:0030910) olfactory placode development(GO:0071698) olfactory placode morphogenesis(GO:0071699) |
| 0.1 | 0.2 | GO:0071028 | nuclear RNA surveillance(GO:0071027) nuclear mRNA surveillance(GO:0071028) |
| 0.1 | 0.4 | GO:0035582 | sequestering of BMP in extracellular matrix(GO:0035582) |
| 0.1 | 0.1 | GO:0061083 | regulation of protein refolding(GO:0061083) |
| 0.1 | 0.3 | GO:0006772 | thiamine metabolic process(GO:0006772) thiamine-containing compound metabolic process(GO:0042723) |
| 0.1 | 0.1 | GO:0071034 | CUT catabolic process(GO:0071034) CUT metabolic process(GO:0071043) |
| 0.1 | 0.3 | GO:0019042 | viral latency(GO:0019042) |
| 0.1 | 0.2 | GO:2001140 | regulation of phospholipid transport(GO:2001138) positive regulation of phospholipid transport(GO:2001140) |
| 0.1 | 0.7 | GO:0031119 | tRNA pseudouridine synthesis(GO:0031119) |
| 0.1 | 0.8 | GO:0043206 | extracellular fibril organization(GO:0043206) |
| 0.1 | 0.1 | GO:0019344 | cysteine biosynthetic process(GO:0019344) |
| 0.1 | 1.2 | GO:0006264 | mitochondrial DNA replication(GO:0006264) |
| 0.1 | 0.1 | GO:0042048 | olfactory behavior(GO:0042048) |
| 0.1 | 0.1 | GO:0034454 | microtubule anchoring at centrosome(GO:0034454) |
| 0.1 | 0.2 | GO:0009223 | pyrimidine deoxyribonucleotide catabolic process(GO:0009223) |
| 0.1 | 0.6 | GO:0006268 | DNA unwinding involved in DNA replication(GO:0006268) |
| 0.1 | 0.3 | GO:0034473 | U1 snRNA 3'-end processing(GO:0034473) U5 snRNA 3'-end processing(GO:0034476) |
| 0.1 | 1.0 | GO:0009143 | nucleoside triphosphate catabolic process(GO:0009143) |
| 0.1 | 0.8 | GO:0097499 | protein localization to nonmotile primary cilium(GO:0097499) |
| 0.1 | 0.2 | GO:0006449 | regulation of translational termination(GO:0006449) |
| 0.1 | 0.1 | GO:0046504 | ether lipid biosynthetic process(GO:0008611) glycerol ether biosynthetic process(GO:0046504) cellular lipid biosynthetic process(GO:0097384) ether biosynthetic process(GO:1901503) |
| 0.1 | 2.1 | GO:0050808 | synapse organization(GO:0050808) |
| 0.1 | 0.1 | GO:0060459 | left lung development(GO:0060459) left lung morphogenesis(GO:0060460) |
| 0.1 | 0.2 | GO:0043137 | DNA replication, removal of RNA primer(GO:0043137) |
| 0.1 | 0.1 | GO:0052173 | response to defenses of other organism involved in symbiotic interaction(GO:0052173) response to host defenses(GO:0052200) response to host(GO:0075136) |
| 0.1 | 0.2 | GO:0031498 | chromatin disassembly(GO:0031498) |
| 0.1 | 1.0 | GO:0000291 | nuclear-transcribed mRNA catabolic process, exonucleolytic(GO:0000291) |
| 0.1 | 0.3 | GO:0015812 | gamma-aminobutyric acid transport(GO:0015812) |
| 0.1 | 0.3 | GO:0033119 | negative regulation of RNA splicing(GO:0033119) |
| 0.1 | 1.6 | GO:0001764 | neuron migration(GO:0001764) |
| 0.1 | 5.5 | GO:0045665 | negative regulation of neuron differentiation(GO:0045665) |
| 0.1 | 0.2 | GO:0090383 | phagosome acidification(GO:0090383) |
| 0.1 | 0.7 | GO:0043374 | CD8-positive, alpha-beta T cell differentiation(GO:0043374) |
| 0.1 | 0.5 | GO:0006384 | transcription initiation from RNA polymerase III promoter(GO:0006384) |
| 0.1 | 0.3 | GO:0000393 | spliceosomal conformational changes to generate catalytic conformation(GO:0000393) |
| 0.1 | 0.6 | GO:0035025 | positive regulation of Rho protein signal transduction(GO:0035025) |
| 0.1 | 0.2 | GO:0090666 | scaRNA localization to Cajal body(GO:0090666) |
| 0.1 | 0.9 | GO:0046579 | positive regulation of Ras protein signal transduction(GO:0046579) |
| 0.1 | 0.4 | GO:0046015 | regulation of transcription by glucose(GO:0046015) |
| 0.1 | 0.3 | GO:0042640 | anagen(GO:0042640) |
| 0.1 | 0.1 | GO:0072506 | phosphate ion homeostasis(GO:0055062) trivalent inorganic anion homeostasis(GO:0072506) |
| 0.1 | 0.6 | GO:0010919 | regulation of inositol phosphate biosynthetic process(GO:0010919) |
| 0.1 | 0.2 | GO:0003096 | renal sodium ion transport(GO:0003096) renal sodium ion absorption(GO:0070294) |
| 0.1 | 0.3 | GO:0040037 | negative regulation of fibroblast growth factor receptor signaling pathway(GO:0040037) |
| 0.1 | 1.0 | GO:0043113 | receptor clustering(GO:0043113) |
| 0.1 | 0.3 | GO:0045039 | protein import into mitochondrial inner membrane(GO:0045039) |
| 0.1 | 0.1 | GO:0070668 | mast cell proliferation(GO:0070662) regulation of mast cell proliferation(GO:0070666) positive regulation of mast cell proliferation(GO:0070668) |
| 0.1 | 0.2 | GO:0072531 | pyrimidine-containing compound transmembrane transport(GO:0072531) |
| 0.1 | 0.2 | GO:0035948 | positive regulation of gluconeogenesis by positive regulation of transcription from RNA polymerase II promoter(GO:0035948) |
| 0.1 | 0.5 | GO:0019441 | tryptophan catabolic process(GO:0006569) tryptophan catabolic process to kynurenine(GO:0019441) indole-containing compound catabolic process(GO:0042436) indolalkylamine catabolic process(GO:0046218) |
| 0.1 | 0.4 | GO:0035305 | negative regulation of dephosphorylation(GO:0035305) |
| 0.1 | 0.2 | GO:1902065 | response to L-glutamate(GO:1902065) |
| 0.1 | 0.1 | GO:0032025 | response to cobalt ion(GO:0032025) |
| 0.1 | 0.3 | GO:0018202 | peptidyl-histidine modification(GO:0018202) |
| 0.1 | 0.3 | GO:0007220 | Notch receptor processing(GO:0007220) |
| 0.1 | 4.4 | GO:0050684 | regulation of mRNA processing(GO:0050684) |
| 0.1 | 0.5 | GO:0015816 | glycine transport(GO:0015816) |
| 0.1 | 0.1 | GO:0070094 | positive regulation of glucagon secretion(GO:0070094) |
| 0.1 | 0.2 | GO:0035507 | regulation of myosin-light-chain-phosphatase activity(GO:0035507) |
| 0.1 | 0.5 | GO:0007000 | nucleolus organization(GO:0007000) |
| 0.1 | 0.7 | GO:0050905 | neuromuscular process(GO:0050905) |
| 0.1 | 0.1 | GO:0060287 | epithelial cilium movement involved in determination of left/right asymmetry(GO:0060287) |
| 0.1 | 0.1 | GO:0032383 | regulation of intracellular lipid transport(GO:0032377) regulation of intracellular sterol transport(GO:0032380) regulation of intracellular cholesterol transport(GO:0032383) |
| 0.1 | 0.1 | GO:0030167 | proteoglycan catabolic process(GO:0030167) |
| 0.1 | 0.1 | GO:0010961 | cellular magnesium ion homeostasis(GO:0010961) |
| 0.1 | 0.1 | GO:0044375 | regulation of peroxisome size(GO:0044375) |
| 0.1 | 0.4 | GO:0048733 | sebaceous gland development(GO:0048733) |
| 0.1 | 0.1 | GO:0048550 | negative regulation of pinocytosis(GO:0048550) |
| 0.1 | 0.1 | GO:0006573 | valine metabolic process(GO:0006573) |
| 0.1 | 0.6 | GO:0036158 | outer dynein arm assembly(GO:0036158) |
| 0.1 | 0.1 | GO:0045585 | regulation of cytotoxic T cell differentiation(GO:0045583) positive regulation of cytotoxic T cell differentiation(GO:0045585) |
| 0.1 | 1.8 | GO:0015914 | phospholipid transport(GO:0015914) |
| 0.1 | 0.2 | GO:0018242 | protein O-linked glycosylation via serine(GO:0018242) |
| 0.1 | 0.1 | GO:0071672 | negative regulation of smooth muscle cell chemotaxis(GO:0071672) |
| 0.1 | 0.3 | GO:0061622 | glycolytic process through glucose-1-phosphate(GO:0061622) |
| 0.1 | 1.3 | GO:0016578 | histone deubiquitination(GO:0016578) |
| 0.1 | 0.2 | GO:0006600 | creatine metabolic process(GO:0006600) |
| 0.1 | 0.1 | GO:0035771 | interleukin-4-mediated signaling pathway(GO:0035771) |
| 0.1 | 2.1 | GO:0006414 | translational elongation(GO:0006414) |
| 0.1 | 0.3 | GO:0051131 | chaperone-mediated protein complex assembly(GO:0051131) |
| 0.1 | 0.4 | GO:0006777 | Mo-molybdopterin cofactor biosynthetic process(GO:0006777) Mo-molybdopterin cofactor metabolic process(GO:0019720) molybdopterin cofactor biosynthetic process(GO:0032324) molybdopterin cofactor metabolic process(GO:0043545) prosthetic group metabolic process(GO:0051189) |
| 0.1 | 0.1 | GO:0015755 | fructose transport(GO:0015755) |
| 0.1 | 0.2 | GO:0009051 | pentose-phosphate shunt, oxidative branch(GO:0009051) |
| 0.1 | 0.1 | GO:1903265 | positive regulation of tumor necrosis factor-mediated signaling pathway(GO:1903265) |
| 0.1 | 0.1 | GO:2000623 | regulation of nuclear-transcribed mRNA catabolic process, nonsense-mediated decay(GO:2000622) negative regulation of nuclear-transcribed mRNA catabolic process, nonsense-mediated decay(GO:2000623) |
| 0.1 | 0.1 | GO:0008354 | germ cell migration(GO:0008354) |
| 0.1 | 0.2 | GO:0034204 | lipid translocation(GO:0034204) |
| 0.1 | 0.5 | GO:0033235 | positive regulation of protein sumoylation(GO:0033235) |
| 0.1 | 0.1 | GO:0019614 | catechol-containing compound catabolic process(GO:0019614) catecholamine catabolic process(GO:0042424) |
| 0.1 | 0.4 | GO:0098734 | protein depalmitoylation(GO:0002084) macromolecule depalmitoylation(GO:0098734) |
| 0.1 | 2.0 | GO:0048812 | neuron projection morphogenesis(GO:0048812) |
| 0.1 | 0.2 | GO:0007084 | mitotic nuclear envelope reassembly(GO:0007084) |
| 0.1 | 0.1 | GO:0000255 | allantoin metabolic process(GO:0000255) |
| 0.1 | 0.3 | GO:0097484 | dendrite extension(GO:0097484) |
| 0.1 | 0.3 | GO:0009125 | nucleoside monophosphate catabolic process(GO:0009125) |
| 0.1 | 0.1 | GO:0097011 | cellular response to granulocyte macrophage colony-stimulating factor stimulus(GO:0097011) |
| 0.1 | 0.2 | GO:0015822 | ornithine transport(GO:0015822) L-ornithine transmembrane transport(GO:1903352) |
| 0.1 | 0.1 | GO:0002904 | positive regulation of B cell apoptotic process(GO:0002904) |
| 0.1 | 0.2 | GO:0034214 | protein hexamerization(GO:0034214) |
| 0.1 | 0.1 | GO:0090343 | positive regulation of cell aging(GO:0090343) positive regulation of cellular senescence(GO:2000774) |
| 0.1 | 0.2 | GO:0006307 | DNA dealkylation involved in DNA repair(GO:0006307) |
| 0.1 | 0.1 | GO:2000288 | positive regulation of myoblast proliferation(GO:2000288) |
| 0.1 | 0.1 | GO:0090071 | negative regulation of ribosome biogenesis(GO:0090071) |
| 0.0 | 0.3 | GO:0006729 | tetrahydrobiopterin biosynthetic process(GO:0006729) |
| 0.0 | 0.2 | GO:0033136 | serine phosphorylation of STAT3 protein(GO:0033136) |
| 0.0 | 0.9 | GO:0035329 | hippo signaling(GO:0035329) |
| 0.0 | 0.0 | GO:0051036 | regulation of endosome size(GO:0051036) |
| 0.0 | 0.0 | GO:0002481 | antigen processing and presentation of exogenous peptide antigen via MHC class Ib(GO:0002477) antigen processing and presentation of exogenous protein antigen via MHC class Ib, TAP-dependent(GO:0002481) |
| 0.0 | 0.2 | GO:2000060 | positive regulation of protein ubiquitination involved in ubiquitin-dependent protein catabolic process(GO:2000060) |
| 0.0 | 0.1 | GO:0019249 | lactate biosynthetic process from pyruvate(GO:0019244) lactate biosynthetic process(GO:0019249) |
| 0.0 | 0.2 | GO:0044038 | cell wall mannoprotein biosynthetic process(GO:0000032) mannoprotein metabolic process(GO:0006056) mannoprotein biosynthetic process(GO:0006057) cell wall glycoprotein biosynthetic process(GO:0031506) cell wall biogenesis(GO:0042546) cell wall macromolecule biosynthetic process(GO:0044038) chain elongation of O-linked mannose residue(GO:0044845) cellular component macromolecule biosynthetic process(GO:0070589) |
| 0.0 | 0.1 | GO:0006568 | tryptophan metabolic process(GO:0006568) indolalkylamine metabolic process(GO:0006586) |
| 0.0 | 0.0 | GO:0036315 | cellular response to sterol(GO:0036315) |
| 0.0 | 0.1 | GO:0010520 | meiotic gene conversion(GO:0006311) regulation of reciprocal meiotic recombination(GO:0010520) gene conversion(GO:0035822) |
| 0.0 | 0.7 | GO:0008333 | endosome to lysosome transport(GO:0008333) |
| 0.0 | 1.7 | GO:0050911 | detection of chemical stimulus involved in sensory perception of smell(GO:0050911) |
| 0.0 | 1.0 | GO:0000184 | nuclear-transcribed mRNA catabolic process, nonsense-mediated decay(GO:0000184) |
| 0.0 | 0.0 | GO:1900377 | negative regulation of melanin biosynthetic process(GO:0048022) negative regulation of secondary metabolite biosynthetic process(GO:1900377) |
| 0.0 | 0.2 | GO:0035426 | extracellular matrix-cell signaling(GO:0035426) |
| 0.0 | 0.1 | GO:0045956 | positive regulation of calcium ion-dependent exocytosis(GO:0045956) |
| 0.0 | 0.1 | GO:0009253 | peptidoglycan metabolic process(GO:0000270) peptidoglycan catabolic process(GO:0009253) |
| 0.0 | 0.1 | GO:0046167 | glycerol-3-phosphate biosynthetic process(GO:0046167) |
| 0.0 | 0.8 | GO:0006890 | retrograde vesicle-mediated transport, Golgi to ER(GO:0006890) |
| 0.0 | 0.2 | GO:0035234 | ectopic germ cell programmed cell death(GO:0035234) |
| 0.0 | 0.3 | GO:0045056 | transcytosis(GO:0045056) |
| 0.0 | 0.0 | GO:2000402 | negative regulation of lymphocyte migration(GO:2000402) |
| 0.0 | 0.1 | GO:0061727 | methylglyoxal catabolic process to D-lactate via S-lactoyl-glutathione(GO:0019243) methylglyoxal catabolic process(GO:0051596) methylglyoxal catabolic process to lactate(GO:0061727) |
| 0.0 | 0.1 | GO:0000492 | small nucleolar ribonucleoprotein complex assembly(GO:0000491) box C/D snoRNP assembly(GO:0000492) |
| 0.0 | 0.0 | GO:0021819 | layer formation in cerebral cortex(GO:0021819) |
| 0.0 | 0.0 | GO:1901727 | positive regulation of histone deacetylase activity(GO:1901727) |
| 0.0 | 0.1 | GO:0002282 | microglial cell activation involved in immune response(GO:0002282) |
| 0.0 | 0.2 | GO:0016255 | attachment of GPI anchor to protein(GO:0016255) |
| 0.0 | 0.0 | GO:1900368 | regulation of RNA interference(GO:1900368) |
| 0.0 | 0.0 | GO:0046471 | phosphatidylglycerol metabolic process(GO:0046471) |
| 0.0 | 0.3 | GO:0010388 | cullin deneddylation(GO:0010388) |
| 0.0 | 0.1 | GO:0060005 | vestibular reflex(GO:0060005) |
| 0.0 | 0.1 | GO:1903336 | negative regulation of vacuolar transport(GO:1903336) |
| 0.0 | 0.1 | GO:0001546 | preantral ovarian follicle growth(GO:0001546) multi-layer follicle stage(GO:0048162) |
| 0.0 | 0.3 | GO:0035428 | hexose transmembrane transport(GO:0035428) |
| 0.0 | 0.4 | GO:0006353 | DNA-templated transcription, termination(GO:0006353) |
| 0.0 | 0.4 | GO:0043248 | proteasome assembly(GO:0043248) |
| 0.0 | 0.1 | GO:0070889 | platelet alpha granule organization(GO:0070889) |
| 0.0 | 0.1 | GO:0070813 | hydrogen sulfide metabolic process(GO:0070813) |
| 0.0 | 0.2 | GO:0018344 | protein geranylgeranylation(GO:0018344) |
| 0.0 | 0.0 | GO:0050919 | negative chemotaxis(GO:0050919) |
| 0.0 | 0.1 | GO:0038107 | determination of left/right asymmetry in lateral mesoderm(GO:0003140) nodal signaling pathway involved in determination of left/right asymmetry(GO:0038107) regulation of transcription from RNA polymerase II promoter involved in determination of left/right symmetry(GO:1900094) nodal signaling pathway involved in determination of lateral mesoderm left/right asymmetry(GO:1900164) |
| 0.0 | 0.4 | GO:0007095 | mitotic G2 DNA damage checkpoint(GO:0007095) |
| 0.0 | 0.1 | GO:0035728 | response to hepatocyte growth factor(GO:0035728) cellular response to hepatocyte growth factor stimulus(GO:0035729) |
| 0.0 | 0.2 | GO:0031065 | positive regulation of histone deacetylation(GO:0031065) |
| 0.0 | 0.0 | GO:0016561 | protein import into peroxisome matrix, translocation(GO:0016561) |
| 0.0 | 0.1 | GO:0010635 | regulation of mitochondrial fusion(GO:0010635) |
| 0.0 | 0.1 | GO:0060368 | regulation of Fc receptor mediated stimulatory signaling pathway(GO:0060368) |
| 0.0 | 0.0 | GO:0007632 | visual behavior(GO:0007632) |
| 0.0 | 0.1 | GO:0006048 | UDP-N-acetylglucosamine biosynthetic process(GO:0006048) |
| 0.0 | 0.0 | GO:2000275 | regulation of oxidative phosphorylation uncoupler activity(GO:2000275) |
| 0.0 | 0.0 | GO:0060447 | bud outgrowth involved in lung branching(GO:0060447) |
| 0.0 | 0.0 | GO:0015705 | iodide transport(GO:0015705) |
| 0.0 | 0.0 | GO:0007621 | negative regulation of female receptivity(GO:0007621) |
| 0.0 | 0.1 | GO:0033566 | gamma-tubulin complex localization(GO:0033566) |
| 0.0 | 0.0 | GO:1904294 | positive regulation of ERAD pathway(GO:1904294) |
| 0.0 | 0.2 | GO:0050435 | beta-amyloid metabolic process(GO:0050435) |
| 0.0 | 0.0 | GO:0061470 | T follicular helper cell differentiation(GO:0061470) |
| 0.0 | 0.1 | GO:0006987 | activation of signaling protein activity involved in unfolded protein response(GO:0006987) |
| 0.0 | 0.1 | GO:0051503 | adenine nucleotide transport(GO:0051503) |
| 0.0 | 0.2 | GO:0001867 | complement activation, lectin pathway(GO:0001867) |
| 0.0 | 0.3 | GO:1901663 | quinone biosynthetic process(GO:1901663) |
| 0.0 | 0.8 | GO:0061077 | chaperone-mediated protein folding(GO:0061077) |
| 0.0 | 0.0 | GO:0042373 | vitamin K metabolic process(GO:0042373) |
| 0.0 | 0.0 | GO:0070091 | glucagon secretion(GO:0070091) |
| 0.0 | 0.2 | GO:2001015 | negative regulation of skeletal muscle cell differentiation(GO:2001015) |
| 0.0 | 0.1 | GO:0070525 | tRNA threonylcarbamoyladenosine metabolic process(GO:0070525) |
| 0.0 | 0.0 | GO:0060300 | regulation of cytokine activity(GO:0060300) |
| 0.0 | 0.0 | GO:0019676 | ammonia assimilation cycle(GO:0019676) |
| 0.0 | 0.0 | GO:0009946 | proximal/distal axis specification(GO:0009946) specification of axis polarity(GO:0065001) |
| 0.0 | 0.1 | GO:0006013 | mannose metabolic process(GO:0006013) |
| 0.0 | 0.0 | GO:0007227 | signal transduction downstream of smoothened(GO:0007227) |
| 0.0 | 0.1 | GO:0006663 | platelet activating factor biosynthetic process(GO:0006663) platelet activating factor metabolic process(GO:0046469) |
| 0.0 | 0.0 | GO:0046100 | hypoxanthine metabolic process(GO:0046100) hypoxanthine biosynthetic process(GO:0046101) |
| 0.0 | 0.0 | GO:0071047 | nuclear polyadenylation-dependent mRNA catabolic process(GO:0071042) polyadenylation-dependent mRNA catabolic process(GO:0071047) |
| 0.0 | 0.1 | GO:0039532 | negative regulation of viral-induced cytoplasmic pattern recognition receptor signaling pathway(GO:0039532) |
| 0.0 | 0.0 | GO:0070601 | centromeric sister chromatid cohesion(GO:0070601) |
| 0.0 | 0.0 | GO:0000012 | single strand break repair(GO:0000012) |
| 0.0 | 0.0 | GO:0003356 | regulation of cilium beat frequency(GO:0003356) |
| 0.0 | 0.0 | GO:1902410 | mitotic cytokinetic process(GO:1902410) |
| 0.0 | 0.0 | GO:0070842 | aggresome assembly(GO:0070842) |
| 0.0 | 0.0 | GO:0010499 | proteasomal ubiquitin-independent protein catabolic process(GO:0010499) |
| 0.0 | 0.2 | GO:0000038 | very long-chain fatty acid metabolic process(GO:0000038) |
| 0.0 | 0.1 | GO:0060009 | Sertoli cell development(GO:0060009) |
| 0.0 | 0.0 | GO:0032570 | response to progesterone(GO:0032570) |
| 0.0 | 0.0 | GO:0035372 | protein localization to microtubule(GO:0035372) |
| 0.0 | 0.0 | GO:0021535 | cell migration in hindbrain(GO:0021535) |
| 0.0 | 0.1 | GO:0034144 | negative regulation of toll-like receptor 4 signaling pathway(GO:0034144) |
| 0.0 | 0.0 | GO:0090435 | protein localization to nuclear envelope(GO:0090435) |
Gene overrepresentation in cellular component category:
| Log-likelihood per target | Total log-likelihood | Term | Description |
|---|---|---|---|
| 12.4 | 37.3 | GO:0097451 | glial limiting end-foot(GO:0097451) |
| 4.7 | 32.9 | GO:0036056 | filtration diaphragm(GO:0036056) slit diaphragm(GO:0036057) |
| 4.2 | 20.9 | GO:0032983 | kainate selective glutamate receptor complex(GO:0032983) |
| 3.3 | 26.6 | GO:0042788 | polysomal ribosome(GO:0042788) |
| 3.2 | 9.6 | GO:0014701 | junctional sarcoplasmic reticulum membrane(GO:0014701) |
| 3.1 | 21.5 | GO:0032584 | growth cone membrane(GO:0032584) |
| 2.5 | 5.0 | GO:0097441 | basilar dendrite(GO:0097441) |
| 2.4 | 2.4 | GO:0034750 | Scrib-APC-beta-catenin complex(GO:0034750) |
| 2.4 | 14.2 | GO:0044300 | cerebellar mossy fiber(GO:0044300) |
| 2.4 | 28.3 | GO:0043194 | axon initial segment(GO:0043194) |
| 2.3 | 18.6 | GO:0071437 | invadopodium(GO:0071437) |
| 2.1 | 6.4 | GO:0072534 | perineuronal net(GO:0072534) |
| 2.1 | 40.8 | GO:0060077 | inhibitory synapse(GO:0060077) |
| 2.1 | 19.1 | GO:0044224 | juxtaparanode region of axon(GO:0044224) |
| 2.1 | 16.9 | GO:0043083 | synaptic cleft(GO:0043083) |
| 2.1 | 18.6 | GO:0005883 | neurofilament(GO:0005883) |
| 2.0 | 53.7 | GO:0044295 | axonal growth cone(GO:0044295) |
| 2.0 | 29.7 | GO:1902711 | GABA receptor complex(GO:1902710) GABA-A receptor complex(GO:1902711) |
| 1.9 | 5.7 | GO:0097648 | G-protein coupled receptor dimeric complex(GO:0038037) G-protein coupled receptor complex(GO:0097648) |
| 1.9 | 58.9 | GO:0005790 | smooth endoplasmic reticulum(GO:0005790) |
| 1.9 | 11.3 | GO:0031258 | lamellipodium membrane(GO:0031258) |
| 1.7 | 8.4 | GO:0030122 | AP-2 adaptor complex(GO:0030122) |
| 1.7 | 3.4 | GO:1990635 | proximal dendrite(GO:1990635) |
| 1.6 | 22.5 | GO:0071565 | nBAF complex(GO:0071565) |
| 1.6 | 72.7 | GO:0042734 | presynaptic membrane(GO:0042734) |
| 1.3 | 12.0 | GO:0002116 | semaphorin receptor complex(GO:0002116) |
| 1.3 | 3.9 | GO:0005853 | eukaryotic translation elongation factor 1 complex(GO:0005853) |
| 1.3 | 8.8 | GO:0008290 | F-actin capping protein complex(GO:0008290) |
| 1.3 | 2.5 | GO:0044326 | dendritic spine neck(GO:0044326) |
| 1.3 | 31.3 | GO:0032281 | AMPA glutamate receptor complex(GO:0032281) |
| 1.2 | 10.8 | GO:0048786 | presynaptic active zone(GO:0048786) |
| 1.2 | 11.8 | GO:0001518 | voltage-gated sodium channel complex(GO:0001518) |
| 1.2 | 36.3 | GO:0005891 | voltage-gated calcium channel complex(GO:0005891) |
| 1.1 | 14.6 | GO:0043196 | varicosity(GO:0043196) |
| 1.1 | 36.4 | GO:0099501 | synaptic vesicle membrane(GO:0030672) exocytic vesicle membrane(GO:0099501) |
| 1.1 | 32.6 | GO:0031941 | filamentous actin(GO:0031941) |
| 1.1 | 3.2 | GO:0033269 | internode region of axon(GO:0033269) |
| 1.1 | 8.5 | GO:0030673 | axolemma(GO:0030673) |
| 0.9 | 2.8 | GO:0016533 | cyclin-dependent protein kinase 5 holoenzyme complex(GO:0016533) |
| 0.9 | 8.4 | GO:0031527 | filopodium membrane(GO:0031527) |
| 0.9 | 0.9 | GO:0070033 | synaptobrevin 2-SNAP-25-syntaxin-1a-complexin II complex(GO:0070033) |
| 0.9 | 2.7 | GO:0033010 | paranodal junction(GO:0033010) |
| 0.9 | 4.4 | GO:0071547 | piP-body(GO:0071547) |
| 0.9 | 2.7 | GO:0097427 | microtubule bundle(GO:0097427) |
| 0.9 | 6.2 | GO:0005952 | cAMP-dependent protein kinase complex(GO:0005952) |
| 0.9 | 6.1 | GO:0016593 | Cdc73/Paf1 complex(GO:0016593) |
| 0.9 | 121.3 | GO:0045211 | postsynaptic membrane(GO:0045211) |
| 0.8 | 5.9 | GO:0097449 | astrocyte projection(GO:0097449) |
| 0.8 | 9.2 | GO:0035102 | PRC1 complex(GO:0035102) |
| 0.8 | 5.6 | GO:0035253 | ciliary rootlet(GO:0035253) |
| 0.8 | 8.0 | GO:0030877 | beta-catenin destruction complex(GO:0030877) |
| 0.8 | 2.3 | GO:0033268 | node of Ranvier(GO:0033268) |
| 0.8 | 4.6 | GO:0070852 | cell body fiber(GO:0070852) |
| 0.7 | 29.1 | GO:0030175 | filopodium(GO:0030175) |
| 0.7 | 6.0 | GO:0000137 | Golgi cis cisterna(GO:0000137) |
| 0.7 | 1.3 | GO:0036449 | microtubule minus-end(GO:0036449) |
| 0.6 | 49.6 | GO:0043204 | perikaryon(GO:0043204) |
| 0.6 | 1.8 | GO:0097513 | myosin II filament(GO:0097513) |
| 0.6 | 3.1 | GO:0032590 | dendrite membrane(GO:0032590) |
| 0.6 | 4.2 | GO:0031045 | dense core granule(GO:0031045) |
| 0.6 | 1.2 | GO:0032937 | SREBP-SCAP-Insig complex(GO:0032937) |
| 0.6 | 0.6 | GO:0035838 | growing cell tip(GO:0035838) |
| 0.6 | 9.9 | GO:0032809 | neuronal cell body membrane(GO:0032809) |
| 0.6 | 4.5 | GO:0005677 | chromatin silencing complex(GO:0005677) |
| 0.5 | 1.6 | GO:0032541 | cortical endoplasmic reticulum(GO:0032541) |
| 0.5 | 5.9 | GO:0042405 | nuclear inclusion body(GO:0042405) |
| 0.5 | 10.1 | GO:0043198 | dendritic shaft(GO:0043198) |
| 0.5 | 2.6 | GO:0005638 | lamin filament(GO:0005638) |
| 0.5 | 0.5 | GO:0044316 | cone cell pedicle(GO:0044316) |
| 0.5 | 0.5 | GO:0035748 | myelin sheath abaxonal region(GO:0035748) |
| 0.5 | 2.0 | GO:0043202 | lysosomal lumen(GO:0043202) |
| 0.5 | 1.5 | GO:0034706 | sodium channel complex(GO:0034706) |
| 0.5 | 0.5 | GO:0044294 | dendritic growth cone(GO:0044294) |
| 0.5 | 31.9 | GO:0030426 | growth cone(GO:0030426) |
| 0.5 | 1.4 | GO:0034274 | Atg12-Atg5-Atg16 complex(GO:0034274) |
| 0.5 | 20.2 | GO:0008076 | voltage-gated potassium channel complex(GO:0008076) |
| 0.4 | 5.4 | GO:0097431 | mitotic spindle pole(GO:0097431) |
| 0.4 | 2.6 | GO:0001674 | female germ cell nucleus(GO:0001674) |
| 0.4 | 1.7 | GO:0032839 | dendrite cytoplasm(GO:0032839) |
| 0.4 | 1.7 | GO:0044530 | supraspliceosomal complex(GO:0044530) |
| 0.4 | 0.8 | GO:0017071 | intracellular cyclic nucleotide activated cation channel complex(GO:0017071) |
| 0.4 | 0.8 | GO:0033648 | host intracellular organelle(GO:0033647) host intracellular membrane-bounded organelle(GO:0033648) |
| 0.4 | 0.8 | GO:0016514 | SWI/SNF complex(GO:0016514) |
| 0.4 | 3.6 | GO:0008074 | guanylate cyclase complex, soluble(GO:0008074) |
| 0.4 | 1.1 | GO:0090498 | extrinsic component of Golgi membrane(GO:0090498) |
| 0.4 | 2.2 | GO:0070688 | MLL5-L complex(GO:0070688) |
| 0.4 | 0.4 | GO:0008274 | gamma-tubulin large complex(GO:0000931) gamma-tubulin ring complex(GO:0008274) |
| 0.4 | 1.1 | GO:0097629 | extrinsic component of omegasome membrane(GO:0097629) |
| 0.3 | 1.7 | GO:0033588 | Elongator holoenzyme complex(GO:0033588) |
| 0.3 | 2.8 | GO:0031235 | intrinsic component of the cytoplasmic side of the plasma membrane(GO:0031235) |
| 0.3 | 3.1 | GO:0045334 | clathrin-coated endocytic vesicle(GO:0045334) |
| 0.3 | 21.0 | GO:0031463 | Cul3-RING ubiquitin ligase complex(GO:0031463) |
| 0.3 | 1.0 | GO:0072379 | BAT3 complex(GO:0071818) ER membrane insertion complex(GO:0072379) |
| 0.3 | 1.0 | GO:0005594 | collagen type IX trimer(GO:0005594) |
| 0.3 | 0.3 | GO:0071598 | neuronal ribonucleoprotein granule(GO:0071598) |
| 0.3 | 6.4 | GO:0090545 | NuRD complex(GO:0016581) CHD-type complex(GO:0090545) |
| 0.3 | 0.7 | GO:0005899 | insulin receptor complex(GO:0005899) |
| 0.3 | 0.3 | GO:0070110 | ciliary neurotrophic factor receptor complex(GO:0070110) |
| 0.3 | 2.0 | GO:0019907 | cyclin-dependent protein kinase activating kinase holoenzyme complex(GO:0019907) |
| 0.3 | 65.4 | GO:0030424 | axon(GO:0030424) |
| 0.3 | 1.0 | GO:0000791 | euchromatin(GO:0000791) |
| 0.3 | 2.2 | GO:0070578 | RISC-loading complex(GO:0070578) |
| 0.3 | 0.3 | GO:0072558 | NLRP1 inflammasome complex(GO:0072558) |
| 0.3 | 1.2 | GO:0005851 | eukaryotic translation initiation factor 2B complex(GO:0005851) |
| 0.3 | 0.6 | GO:0042827 | platelet dense granule(GO:0042827) |
| 0.3 | 1.2 | GO:1990851 | Wnt-Frizzled-LRP5/6 complex(GO:1990851) |
| 0.3 | 0.9 | GO:0005745 | m-AAA complex(GO:0005745) |
| 0.3 | 8.5 | GO:0005801 | cis-Golgi network(GO:0005801) |
| 0.3 | 0.9 | GO:0043527 | tRNA methyltransferase complex(GO:0043527) |
| 0.3 | 3.4 | GO:0043240 | Fanconi anaemia nuclear complex(GO:0043240) |
| 0.3 | 1.1 | GO:0031315 | extrinsic component of mitochondrial outer membrane(GO:0031315) |
| 0.3 | 3.9 | GO:0030134 | ER to Golgi transport vesicle(GO:0030134) |
| 0.3 | 0.8 | GO:0061689 | tricellular tight junction(GO:0061689) |
| 0.3 | 0.8 | GO:0032299 | ribonuclease H2 complex(GO:0032299) |
| 0.3 | 1.1 | GO:1990075 | periciliary membrane compartment(GO:1990075) |
| 0.2 | 9.2 | GO:0046658 | anchored component of plasma membrane(GO:0046658) |
| 0.2 | 1.2 | GO:0016600 | flotillin complex(GO:0016600) |
| 0.2 | 0.7 | GO:0036396 | MIS complex(GO:0036396) |
| 0.2 | 1.2 | GO:0034388 | Pwp2p-containing subcomplex of 90S preribosome(GO:0034388) |
| 0.2 | 13.5 | GO:0070382 | exocytic vesicle(GO:0070382) |
| 0.2 | 1.0 | GO:1990716 | axonemal central apparatus(GO:1990716) |
| 0.2 | 3.2 | GO:0097060 | synaptic membrane(GO:0097060) |
| 0.2 | 20.7 | GO:0031225 | anchored component of membrane(GO:0031225) |
| 0.2 | 0.7 | GO:0033185 | dolichol-phosphate-mannose synthase complex(GO:0033185) |
| 0.2 | 9.2 | GO:0030173 | integral component of Golgi membrane(GO:0030173) |
| 0.2 | 0.6 | GO:0070531 | BRCA1-A complex(GO:0070531) |
| 0.2 | 0.6 | GO:0070552 | BRISC complex(GO:0070552) |
| 0.2 | 0.8 | GO:1990131 | EGO complex(GO:0034448) Gtr1-Gtr2 GTPase complex(GO:1990131) |
| 0.2 | 1.2 | GO:0000923 | equatorial microtubule organizing center(GO:0000923) |
| 0.2 | 1.0 | GO:0097433 | dense body(GO:0097433) |
| 0.2 | 1.2 | GO:0001891 | phagocytic cup(GO:0001891) |
| 0.2 | 0.4 | GO:0071203 | WASH complex(GO:0071203) |
| 0.2 | 1.4 | GO:0031390 | Ctf18 RFC-like complex(GO:0031390) |
| 0.2 | 2.7 | GO:0043205 | fibril(GO:0043205) |
| 0.2 | 0.2 | GO:0044614 | nuclear pore cytoplasmic filaments(GO:0044614) |
| 0.2 | 0.8 | GO:0070545 | PeBoW complex(GO:0070545) |
| 0.2 | 2.2 | GO:0031011 | Ino80 complex(GO:0031011) |
| 0.2 | 0.7 | GO:0032777 | Piccolo NuA4 histone acetyltransferase complex(GO:0032777) |
| 0.2 | 10.2 | GO:0035097 | histone methyltransferase complex(GO:0035097) |
| 0.2 | 1.1 | GO:0030061 | mitochondrial crista(GO:0030061) |
| 0.2 | 1.1 | GO:0001652 | granular component(GO:0001652) |
| 0.2 | 6.7 | GO:0045171 | intercellular bridge(GO:0045171) |
| 0.2 | 0.2 | GO:0070765 | gamma-secretase complex(GO:0070765) |
| 0.2 | 2.1 | GO:0000159 | protein phosphatase type 2A complex(GO:0000159) |
| 0.2 | 0.2 | GO:0034679 | integrin alpha9-beta1 complex(GO:0034679) |
| 0.2 | 1.2 | GO:0033180 | proton-transporting V-type ATPase, V1 domain(GO:0033180) |
| 0.2 | 0.9 | GO:0048476 | Holliday junction resolvase complex(GO:0048476) |
| 0.2 | 0.5 | GO:0000802 | transverse filament(GO:0000802) |
| 0.2 | 1.5 | GO:0048770 | melanosome(GO:0042470) pigment granule(GO:0048770) |
| 0.2 | 0.7 | GO:0000444 | MIS12/MIND type complex(GO:0000444) |
| 0.2 | 2.5 | GO:0030014 | CCR4-NOT complex(GO:0030014) |
| 0.2 | 1.3 | GO:0019773 | proteasome core complex, alpha-subunit complex(GO:0019773) |
| 0.2 | 0.3 | GO:0036195 | muscle cell projection(GO:0036194) muscle cell projection membrane(GO:0036195) |
| 0.2 | 2.2 | GO:0032588 | trans-Golgi network membrane(GO:0032588) |
| 0.2 | 0.5 | GO:0045098 | type III intermediate filament(GO:0045098) |
| 0.2 | 0.6 | GO:0031143 | pseudopodium(GO:0031143) |
| 0.2 | 1.4 | GO:0000815 | ESCRT III complex(GO:0000815) |
| 0.2 | 0.5 | GO:0031417 | NatC complex(GO:0031417) |
| 0.2 | 45.9 | GO:0043005 | neuron projection(GO:0043005) |
| 0.2 | 2.0 | GO:0005736 | DNA-directed RNA polymerase I complex(GO:0005736) |
| 0.1 | 0.4 | GO:0097255 | R2TP complex(GO:0097255) |
| 0.1 | 0.6 | GO:1990604 | IRE1-TRAF2-ASK1 complex(GO:1990604) |
| 0.1 | 1.8 | GO:0036038 | MKS complex(GO:0036038) |
| 0.1 | 0.4 | GO:0044322 | endoplasmic reticulum quality control compartment(GO:0044322) |
| 0.1 | 1.0 | GO:0031512 | motile primary cilium(GO:0031512) |
| 0.1 | 0.4 | GO:0071817 | MMXD complex(GO:0071817) |
| 0.1 | 0.3 | GO:0045298 | tubulin complex(GO:0045298) |
| 0.1 | 1.1 | GO:0030126 | COPI vesicle coat(GO:0030126) |
| 0.1 | 0.4 | GO:1990745 | EARP complex(GO:1990745) |
| 0.1 | 0.9 | GO:0005869 | dynactin complex(GO:0005869) |
| 0.1 | 0.7 | GO:0001940 | male pronucleus(GO:0001940) |
| 0.1 | 1.0 | GO:0033276 | transcription factor TFTC complex(GO:0033276) |
| 0.1 | 0.2 | GO:0005956 | protein kinase CK2 complex(GO:0005956) |
| 0.1 | 0.3 | GO:0032444 | activin responsive factor complex(GO:0032444) |
| 0.1 | 0.6 | GO:0061700 | GATOR2 complex(GO:0061700) |
| 0.1 | 7.3 | GO:0043025 | neuronal cell body(GO:0043025) |
| 0.1 | 0.9 | GO:0000124 | SAGA complex(GO:0000124) |
| 0.1 | 0.3 | GO:0030689 | Noc complex(GO:0030689) |
| 0.1 | 0.4 | GO:0044214 | spanning component of plasma membrane(GO:0044214) spanning component of membrane(GO:0089717) |
| 0.1 | 0.3 | GO:0005608 | laminin-3 complex(GO:0005608) |
| 0.1 | 16.3 | GO:0000790 | nuclear chromatin(GO:0000790) |
| 0.1 | 8.9 | GO:0035068 | micro-ribonucleoprotein complex(GO:0035068) |
| 0.1 | 0.4 | GO:0032021 | NELF complex(GO:0032021) |
| 0.1 | 10.5 | GO:0045202 | synapse(GO:0045202) |
| 0.1 | 7.2 | GO:0044798 | nuclear transcription factor complex(GO:0044798) |
| 0.1 | 0.1 | GO:0070761 | pre-snoRNP complex(GO:0070761) |
| 0.1 | 0.9 | GO:0005839 | proteasome core complex(GO:0005839) |
| 0.1 | 0.5 | GO:0034992 | microtubule organizing center attachment site(GO:0034992) LINC complex(GO:0034993) |
| 0.1 | 0.5 | GO:0030008 | TRAPP complex(GO:0030008) |
| 0.1 | 0.3 | GO:0033256 | I-kappaB/NF-kappaB complex(GO:0033256) |
| 0.1 | 0.6 | GO:0032797 | SMN complex(GO:0032797) |
| 0.1 | 0.7 | GO:0016010 | dystrophin-associated glycoprotein complex(GO:0016010) glycoprotein complex(GO:0090665) |
| 0.1 | 0.5 | GO:0042571 | immunoglobulin complex, circulating(GO:0042571) |
| 0.1 | 0.7 | GO:0034704 | calcium channel complex(GO:0034704) |
| 0.1 | 0.4 | GO:0042622 | photoreceptor outer segment membrane(GO:0042622) |
| 0.1 | 0.1 | GO:0033202 | DNA helicase complex(GO:0033202) |
| 0.1 | 0.2 | GO:0042825 | MHC class I peptide loading complex(GO:0042824) TAP complex(GO:0042825) |
| 0.1 | 0.2 | GO:0097524 | sperm plasma membrane(GO:0097524) |
| 0.1 | 0.1 | GO:1990111 | spermatoproteasome complex(GO:1990111) |
| 0.1 | 0.2 | GO:0005958 | DNA-dependent protein kinase-DNA ligase 4 complex(GO:0005958) |
| 0.1 | 0.3 | GO:0030914 | STAGA complex(GO:0030914) |
| 0.1 | 0.2 | GO:0000172 | ribonuclease MRP complex(GO:0000172) |
| 0.1 | 0.3 | GO:0005796 | Golgi lumen(GO:0005796) |
| 0.1 | 0.3 | GO:0005890 | sodium:potassium-exchanging ATPase complex(GO:0005890) |
| 0.0 | 0.1 | GO:0031084 | BLOC-2 complex(GO:0031084) |
| 0.0 | 0.2 | GO:0005640 | nuclear outer membrane(GO:0005640) |
| 0.0 | 0.2 | GO:0031502 | dolichyl-phosphate-mannose-protein mannosyltransferase complex(GO:0031502) |
| 0.0 | 0.3 | GO:0030123 | AP-3 adaptor complex(GO:0030123) |
| 0.0 | 1.4 | GO:0005871 | kinesin complex(GO:0005871) |
| 0.0 | 0.2 | GO:0031428 | box C/D snoRNP complex(GO:0031428) |
| 0.0 | 0.1 | GO:0097149 | centralspindlin complex(GO:0097149) |
| 0.0 | 0.1 | GO:0032585 | multivesicular body membrane(GO:0032585) |
| 0.0 | 0.0 | GO:0031933 | telomeric heterochromatin(GO:0031933) |
| 0.0 | 0.2 | GO:0042765 | GPI-anchor transamidase complex(GO:0042765) |
| 0.0 | 0.0 | GO:0000439 | core TFIIH complex(GO:0000439) |
| 0.0 | 0.1 | GO:0070695 | FHF complex(GO:0070695) |
| 0.0 | 0.0 | GO:0010009 | cytoplasmic side of endosome membrane(GO:0010009) |
| 0.0 | 0.7 | GO:0032391 | photoreceptor connecting cilium(GO:0032391) |
| 0.0 | 2.8 | GO:0016607 | nuclear speck(GO:0016607) |
| 0.0 | 0.1 | GO:0048179 | activin receptor complex(GO:0048179) |
| 0.0 | 0.4 | GO:0005797 | Golgi medial cisterna(GO:0005797) |
| 0.0 | 0.1 | GO:0016942 | insulin-like growth factor binding protein complex(GO:0016942) growth factor complex(GO:0036454) insulin-like growth factor ternary complex(GO:0042567) |
| 0.0 | 0.2 | GO:0005832 | chaperonin-containing T-complex(GO:0005832) |
| 0.0 | 0.0 | GO:0070044 | synaptobrevin 2-SNAP-25-syntaxin-1a complex(GO:0070044) |
| 0.0 | 0.1 | GO:0030956 | glutamyl-tRNA(Gln) amidotransferase complex(GO:0030956) |
| 0.0 | 0.4 | GO:0030904 | retromer complex(GO:0030904) |
| 0.0 | 0.2 | GO:0000813 | ESCRT I complex(GO:0000813) |
| 0.0 | 0.1 | GO:0030289 | protein phosphatase 4 complex(GO:0030289) |
| 0.0 | 0.1 | GO:0030137 | COPI-coated vesicle(GO:0030137) |
| 0.0 | 0.0 | GO:0000125 | PCAF complex(GO:0000125) |
| 0.0 | 0.1 | GO:0000408 | EKC/KEOPS complex(GO:0000408) |
| 0.0 | 0.3 | GO:0000176 | nuclear exosome (RNase complex)(GO:0000176) |
| 0.0 | 1.0 | GO:0005643 | nuclear pore(GO:0005643) |
| 0.0 | 0.1 | GO:0043293 | apoptosome(GO:0043293) |
| 0.0 | 0.1 | GO:0005847 | mRNA cleavage and polyadenylation specificity factor complex(GO:0005847) |
| 0.0 | 0.1 | GO:0032593 | insulin-responsive compartment(GO:0032593) |
| 0.0 | 0.1 | GO:0031931 | TORC1 complex(GO:0031931) |
| 0.0 | 0.0 | GO:0032133 | chromosome passenger complex(GO:0032133) |
Gene overrepresentation in molecular function category:
| Log-likelihood per target | Total log-likelihood | Term | Description |
|---|---|---|---|
| 18.7 | 56.1 | GO:0005519 | cytoskeletal regulatory protein binding(GO:0005519) |
| 10.7 | 32.0 | GO:0031697 | beta-1 adrenergic receptor binding(GO:0031697) |
| 9.1 | 45.3 | GO:0044323 | retinoic acid-responsive element binding(GO:0044323) |
| 7.0 | 13.9 | GO:0097109 | neuroligin family protein binding(GO:0097109) |
| 6.0 | 18.1 | GO:0004351 | glutamate decarboxylase activity(GO:0004351) |
| 5.9 | 23.4 | GO:0032051 | clathrin light chain binding(GO:0032051) |
| 5.4 | 21.7 | GO:0004971 | AMPA glutamate receptor activity(GO:0004971) |
| 4.8 | 4.8 | GO:0034483 | heparan sulfate sulfotransferase activity(GO:0034483) |
| 4.6 | 32.2 | GO:0003680 | AT DNA binding(GO:0003680) |
| 3.9 | 15.5 | GO:0015277 | kainate selective glutamate receptor activity(GO:0015277) |
| 3.8 | 19.0 | GO:0003828 | alpha-N-acetylneuraminate alpha-2,8-sialyltransferase activity(GO:0003828) |
| 3.4 | 10.2 | GO:0033829 | O-fucosylpeptide 3-beta-N-acetylglucosaminyltransferase activity(GO:0033829) |
| 3.1 | 15.5 | GO:0008499 | UDP-galactose:beta-N-acetylglucosamine beta-1,3-galactosyltransferase activity(GO:0008499) |
| 3.0 | 9.1 | GO:0004949 | cannabinoid receptor activity(GO:0004949) |
| 3.0 | 24.1 | GO:0098988 | G-protein coupled glutamate receptor activity(GO:0098988) |
| 2.9 | 26.5 | GO:0001091 | RNA polymerase II basal transcription factor binding(GO:0001091) |
| 2.8 | 8.4 | GO:0005176 | ErbB-2 class receptor binding(GO:0005176) |
| 2.8 | 33.1 | GO:0005313 | L-glutamate transmembrane transporter activity(GO:0005313) |
| 2.4 | 17.0 | GO:0005004 | GPI-linked ephrin receptor activity(GO:0005004) |
| 2.4 | 7.2 | GO:0001075 | transcription factor activity, RNA polymerase II core promoter sequence-specific binding involved in preinitiation complex assembly(GO:0001075) |
| 2.2 | 11.2 | GO:0004985 | opioid receptor activity(GO:0004985) |
| 2.2 | 13.0 | GO:0048495 | Roundabout binding(GO:0048495) |
| 2.1 | 25.8 | GO:0031005 | filamin binding(GO:0031005) |
| 2.1 | 2.1 | GO:0070411 | I-SMAD binding(GO:0070411) |
| 2.0 | 22.3 | GO:0004705 | JUN kinase activity(GO:0004705) SAP kinase activity(GO:0016909) |
| 1.9 | 9.6 | GO:0001515 | opioid peptide activity(GO:0001515) |
| 1.9 | 15.2 | GO:0005237 | inhibitory extracellular ligand-gated ion channel activity(GO:0005237) |
| 1.8 | 18.4 | GO:0042577 | lipid phosphatase activity(GO:0042577) |
| 1.8 | 5.5 | GO:0042030 | ATPase inhibitor activity(GO:0042030) |
| 1.8 | 7.2 | GO:0004528 | phosphodiesterase I activity(GO:0004528) |
| 1.8 | 3.6 | GO:0015186 | L-asparagine transmembrane transporter activity(GO:0015182) L-glutamine transmembrane transporter activity(GO:0015186) |
| 1.8 | 10.6 | GO:0004385 | guanylate kinase activity(GO:0004385) |
| 1.7 | 8.6 | GO:0070300 | phosphatidic acid binding(GO:0070300) |
| 1.7 | 5.2 | GO:0003726 | double-stranded RNA adenosine deaminase activity(GO:0003726) |
| 1.7 | 6.7 | GO:0046870 | cadmium ion binding(GO:0046870) |
| 1.7 | 6.6 | GO:0005025 | transforming growth factor beta receptor activity, type I(GO:0005025) |
| 1.7 | 5.0 | GO:0008158 | hedgehog receptor activity(GO:0008158) |
| 1.6 | 10.9 | GO:0043495 | protein anchor(GO:0043495) |
| 1.6 | 10.9 | GO:0050291 | sphingosine N-acyltransferase activity(GO:0050291) |
| 1.6 | 10.9 | GO:0008046 | axon guidance receptor activity(GO:0008046) |
| 1.5 | 6.1 | GO:0032896 | palmitoyl-CoA 9-desaturase activity(GO:0032896) |
| 1.5 | 19.5 | GO:0050811 | GABA receptor binding(GO:0050811) |
| 1.5 | 5.9 | GO:0005042 | netrin receptor activity(GO:0005042) |
| 1.4 | 4.2 | GO:0034056 | estrogen response element binding(GO:0034056) |
| 1.4 | 15.5 | GO:0008331 | high voltage-gated calcium channel activity(GO:0008331) |
| 1.4 | 9.8 | GO:0030957 | Tat protein binding(GO:0030957) |
| 1.4 | 14.0 | GO:0050321 | tau-protein kinase activity(GO:0050321) |
| 1.3 | 28.2 | GO:0071837 | HMG box domain binding(GO:0071837) |
| 1.3 | 9.3 | GO:0030306 | ADP-ribosylation factor binding(GO:0030306) |
| 1.3 | 2.7 | GO:0035373 | chondroitin sulfate proteoglycan binding(GO:0035373) |
| 1.3 | 29.7 | GO:0017091 | AU-rich element binding(GO:0017091) |
| 1.3 | 6.4 | GO:0015185 | gamma-aminobutyric acid transmembrane transporter activity(GO:0015185) |
| 1.3 | 16.6 | GO:0035198 | miRNA binding(GO:0035198) |
| 1.3 | 8.9 | GO:0098632 | protein binding involved in cell-cell adhesion(GO:0098632) |
| 1.3 | 13.8 | GO:0017154 | semaphorin receptor activity(GO:0017154) |
| 1.3 | 5.0 | GO:0004966 | galanin receptor activity(GO:0004966) |
| 1.3 | 13.8 | GO:0005522 | profilin binding(GO:0005522) |
| 1.2 | 9.9 | GO:0008599 | protein phosphatase type 1 regulator activity(GO:0008599) |
| 1.2 | 13.3 | GO:0042043 | neurexin family protein binding(GO:0042043) |
| 1.2 | 6.0 | GO:0000155 | phosphorelay sensor kinase activity(GO:0000155) |
| 1.2 | 3.6 | GO:0004691 | cAMP-dependent protein kinase activity(GO:0004691) |
| 1.2 | 27.5 | GO:0045499 | chemorepellent activity(GO:0045499) |
| 1.2 | 3.6 | GO:0034925 | mono-butyltin dioxygenase activity(GO:0018586) tri-n-butyltin dioxygenase activity(GO:0018588) di-n-butyltin dioxygenase activity(GO:0018589) methylsilanetriol hydroxylase activity(GO:0018590) methyl tertiary butyl ether 3-monooxygenase activity(GO:0018591) 4-nitrocatechol 4-monooxygenase activity(GO:0018592) 4-chlorophenoxyacetate monooxygenase activity(GO:0018593) tert-butanol 2-monooxygenase activity(GO:0018594) alpha-pinene monooxygenase activity(GO:0018595) dimethylsilanediol hydroxylase activity(GO:0018596) ammonia monooxygenase activity(GO:0018597) hydroxymethylsilanetriol oxidase activity(GO:0018598) 2-hydroxyisobutyrate 3-monooxygenase activity(GO:0018599) alpha-pinene dehydrogenase activity(GO:0018600) bisphenol A hydroxylase B activity(GO:0034559) 2,2-bis(4-hydroxyphenyl)-1-propanol hydroxylase activity(GO:0034562) 9-fluorenone-3,4-dioxygenase activity(GO:0034786) anthracene 9,10-dioxygenase activity(GO:0034816) 2-(methylthio)benzothiazole monooxygenase activity(GO:0034857) 2-hydroxybenzothiazole monooxygenase activity(GO:0034858) benzothiazole monooxygenase activity(GO:0034859) 2,6-dihydroxybenzothiazole monooxygenase activity(GO:0034862) pinacolone 5-monooxygenase activity(GO:0034870) thioacetamide S-oxygenase activity(GO:0034873) thioacetamide S-oxide S-oxygenase activity(GO:0034874) endosulfan monooxygenase I activity(GO:0034888) N-nitrodimethylamine hydroxylase activity(GO:0034893) 4-(1-ethyl-1,4-dimethyl-pentyl)phenol monoxygenase activity(GO:0034897) endosulfan ether monooxygenase activity(GO:0034903) pyrene 4,5-monooxygenase activity(GO:0034925) pyrene 1,2-monooxygenase activity(GO:0034927) 1-hydroxypyrene 6,7-monooxygenase activity(GO:0034928) 1-hydroxypyrene 7,8-monooxygenase activity(GO:0034929) phenylboronic acid monooxygenase activity(GO:0034950) spheroidene monooxygenase activity(GO:0043823) |
| 1.2 | 7.1 | GO:0001588 | dopamine neurotransmitter receptor activity, coupled via Gs(GO:0001588) |
| 1.2 | 7.1 | GO:0046974 | histone methyltransferase activity (H3-K9 specific)(GO:0046974) |
| 1.1 | 15.9 | GO:0031402 | sodium ion binding(GO:0031402) |
| 1.1 | 10.2 | GO:0009931 | calcium-dependent protein serine/threonine kinase activity(GO:0009931) |
| 1.1 | 4.4 | GO:0001602 | pancreatic polypeptide receptor activity(GO:0001602) |
| 1.1 | 3.2 | GO:0048101 | calcium- and calmodulin-regulated 3',5'-cyclic-GMP phosphodiesterase activity(GO:0048101) |
| 1.1 | 3.2 | GO:0003941 | L-serine ammonia-lyase activity(GO:0003941) |
| 1.0 | 5.1 | GO:0008467 | [heparan sulfate]-glucosamine 3-sulfotransferase 1 activity(GO:0008467) |
| 1.0 | 2.0 | GO:0070679 | inositol 1,4,5 trisphosphate binding(GO:0070679) |
| 1.0 | 5.0 | GO:0034190 | apolipoprotein receptor binding(GO:0034190) |
| 1.0 | 15.7 | GO:0008266 | poly(U) RNA binding(GO:0008266) |
| 1.0 | 3.9 | GO:0008502 | melatonin receptor activity(GO:0008502) |
| 1.0 | 1.0 | GO:0015142 | citrate transmembrane transporter activity(GO:0015137) tricarboxylic acid transmembrane transporter activity(GO:0015142) |
| 1.0 | 14.3 | GO:0004435 | phosphatidylinositol phospholipase C activity(GO:0004435) |
| 1.0 | 13.4 | GO:0045295 | gamma-catenin binding(GO:0045295) |
| 1.0 | 10.5 | GO:0005234 | extracellular-glutamate-gated ion channel activity(GO:0005234) |
| 0.9 | 2.8 | GO:0005095 | GTPase inhibitor activity(GO:0005095) |
| 0.9 | 2.8 | GO:0000309 | nicotinamide-nucleotide adenylyltransferase activity(GO:0000309) nicotinate-nucleotide adenylyltransferase activity(GO:0004515) |
| 0.9 | 2.8 | GO:0004980 | melanocyte-stimulating hormone receptor activity(GO:0004980) |
| 0.9 | 9.3 | GO:0001078 | transcriptional repressor activity, RNA polymerase II core promoter proximal region sequence-specific binding(GO:0001078) |
| 0.9 | 22.0 | GO:0046875 | ephrin receptor binding(GO:0046875) |
| 0.9 | 2.7 | GO:0030160 | GKAP/Homer scaffold activity(GO:0030160) |
| 0.9 | 11.5 | GO:0015279 | store-operated calcium channel activity(GO:0015279) |
| 0.9 | 2.6 | GO:0038064 | collagen receptor activity(GO:0038064) |
| 0.9 | 17.4 | GO:0080025 | phosphatidylinositol-3,5-bisphosphate binding(GO:0080025) |
| 0.9 | 3.5 | GO:0015467 | G-protein activated inward rectifier potassium channel activity(GO:0015467) |
| 0.9 | 2.6 | GO:0051430 | corticotropin-releasing hormone receptor 1 binding(GO:0051430) |
| 0.8 | 4.2 | GO:0008454 | alpha-1,3-mannosylglycoprotein 4-beta-N-acetylglucosaminyltransferase activity(GO:0008454) |
| 0.8 | 22.3 | GO:0050699 | WW domain binding(GO:0050699) |
| 0.8 | 4.1 | GO:0030550 | acetylcholine receptor inhibitor activity(GO:0030550) |
| 0.8 | 5.0 | GO:0019992 | diacylglycerol binding(GO:0019992) |
| 0.8 | 20.6 | GO:0001106 | RNA polymerase II transcription corepressor activity(GO:0001106) |
| 0.8 | 4.9 | GO:0004983 | neuropeptide Y receptor activity(GO:0004983) |
| 0.8 | 10.5 | GO:0004890 | GABA-A receptor activity(GO:0004890) |
| 0.8 | 21.8 | GO:0001105 | RNA polymerase II transcription coactivator activity(GO:0001105) |
| 0.8 | 2.4 | GO:1990430 | extracellular matrix protein binding(GO:1990430) |
| 0.8 | 23.5 | GO:0030507 | spectrin binding(GO:0030507) |
| 0.8 | 8.5 | GO:0070016 | armadillo repeat domain binding(GO:0070016) |
| 0.8 | 3.8 | GO:0008294 | calcium- and calmodulin-responsive adenylate cyclase activity(GO:0008294) |
| 0.7 | 3.0 | GO:0097001 | ceramide binding(GO:0097001) |
| 0.7 | 10.4 | GO:0099589 | G-protein coupled serotonin receptor activity(GO:0004993) serotonin receptor activity(GO:0099589) |
| 0.7 | 1.5 | GO:0004886 | 9-cis retinoic acid receptor activity(GO:0004886) |
| 0.7 | 1.5 | GO:0042166 | acetylcholine binding(GO:0042166) |
| 0.7 | 1.4 | GO:0015018 | galactosylgalactosylxylosylprotein 3-beta-glucuronosyltransferase activity(GO:0015018) |
| 0.7 | 2.8 | GO:0015220 | choline transmembrane transporter activity(GO:0015220) |
| 0.7 | 2.1 | GO:0030297 | transmembrane receptor protein tyrosine kinase activator activity(GO:0030297) |
| 0.7 | 2.1 | GO:0005167 | neurotrophin TRK receptor binding(GO:0005167) |
| 0.7 | 2.1 | GO:0000702 | oxidized base lesion DNA N-glycosylase activity(GO:0000702) |
| 0.7 | 7.5 | GO:0048018 | receptor agonist activity(GO:0048018) |
| 0.7 | 2.7 | GO:0043842 | Kdo transferase activity(GO:0043842) |
| 0.7 | 5.4 | GO:0004767 | sphingomyelin phosphodiesterase activity(GO:0004767) |
| 0.7 | 1.3 | GO:0038191 | neuropilin binding(GO:0038191) |
| 0.7 | 2.0 | GO:1990188 | euchromatin binding(GO:1990188) |
| 0.6 | 2.6 | GO:0016286 | small conductance calcium-activated potassium channel activity(GO:0016286) |
| 0.6 | 3.1 | GO:0048273 | mitogen-activated protein kinase p38 binding(GO:0048273) |
| 0.6 | 1.9 | GO:0004741 | [pyruvate dehydrogenase (lipoamide)] phosphatase activity(GO:0004741) |
| 0.6 | 2.4 | GO:0052834 | inositol monophosphate 1-phosphatase activity(GO:0008934) inositol monophosphate 3-phosphatase activity(GO:0052832) inositol monophosphate 4-phosphatase activity(GO:0052833) inositol monophosphate phosphatase activity(GO:0052834) |
| 0.6 | 3.0 | GO:0046935 | 1-phosphatidylinositol-3-kinase regulator activity(GO:0046935) |
| 0.6 | 3.6 | GO:0032027 | myosin light chain binding(GO:0032027) |
| 0.6 | 4.1 | GO:0002162 | dystroglycan binding(GO:0002162) |
| 0.6 | 16.0 | GO:0005245 | voltage-gated calcium channel activity(GO:0005245) |
| 0.6 | 1.8 | GO:0005219 | ryanodine-sensitive calcium-release channel activity(GO:0005219) |
| 0.6 | 2.4 | GO:0015280 | ligand-gated sodium channel activity(GO:0015280) |
| 0.6 | 1.7 | GO:0008147 | structural constituent of bone(GO:0008147) |
| 0.6 | 4.6 | GO:0008889 | glycerophosphodiester phosphodiesterase activity(GO:0008889) |
| 0.6 | 1.1 | GO:0005173 | stem cell factor receptor binding(GO:0005173) |
| 0.6 | 7.2 | GO:0051428 | peptide hormone receptor binding(GO:0051428) |
| 0.6 | 2.8 | GO:0008195 | phosphatidate phosphatase activity(GO:0008195) |
| 0.6 | 4.4 | GO:0031957 | very long-chain fatty acid-CoA ligase activity(GO:0031957) |
| 0.5 | 7.7 | GO:0030275 | LRR domain binding(GO:0030275) |
| 0.5 | 18.1 | GO:0015459 | potassium channel regulator activity(GO:0015459) |
| 0.5 | 13.6 | GO:0043015 | gamma-tubulin binding(GO:0043015) |
| 0.5 | 2.7 | GO:0003847 | 1-alkyl-2-acetylglycerophosphocholine esterase activity(GO:0003847) |
| 0.5 | 1.6 | GO:0015141 | succinate transmembrane transporter activity(GO:0015141) C4-dicarboxylate transmembrane transporter activity(GO:0015556) |
| 0.5 | 9.4 | GO:0031489 | myosin V binding(GO:0031489) |
| 0.5 | 8.4 | GO:0004889 | acetylcholine-activated cation-selective channel activity(GO:0004889) |
| 0.5 | 2.1 | GO:0004969 | histamine receptor activity(GO:0004969) |
| 0.5 | 11.5 | GO:0005540 | hyaluronic acid binding(GO:0005540) |
| 0.5 | 13.5 | GO:0005251 | delayed rectifier potassium channel activity(GO:0005251) |
| 0.5 | 3.6 | GO:0008504 | monoamine transmembrane transporter activity(GO:0008504) |
| 0.5 | 24.2 | GO:0050840 | extracellular matrix binding(GO:0050840) |
| 0.5 | 6.6 | GO:0035255 | ionotropic glutamate receptor binding(GO:0035255) |
| 0.5 | 17.2 | GO:0005262 | calcium channel activity(GO:0005262) |
| 0.5 | 1.5 | GO:0036435 | K48-linked polyubiquitin binding(GO:0036435) |
| 0.5 | 2.0 | GO:0019145 | aminobutyraldehyde dehydrogenase activity(GO:0019145) 4-trimethylammoniobutyraldehyde dehydrogenase activity(GO:0047105) |
| 0.5 | 1.5 | GO:0004833 | tryptophan 2,3-dioxygenase activity(GO:0004833) |
| 0.5 | 2.9 | GO:0001102 | RNA polymerase II activating transcription factor binding(GO:0001102) |
| 0.5 | 0.5 | GO:0051378 | serotonin binding(GO:0051378) |
| 0.5 | 2.9 | GO:0015198 | oligopeptide transporter activity(GO:0015198) |
| 0.5 | 1.4 | GO:0019166 | trans-2-enoyl-CoA reductase (NADPH) activity(GO:0019166) |
| 0.5 | 1.9 | GO:0015375 | glycine:sodium symporter activity(GO:0015375) |
| 0.5 | 1.4 | GO:0008184 | glycogen phosphorylase activity(GO:0008184) |
| 0.5 | 2.4 | GO:0046912 | transferase activity, transferring acyl groups, acyl groups converted into alkyl on transfer(GO:0046912) |
| 0.5 | 1.9 | GO:0004594 | pantothenate kinase activity(GO:0004594) |
| 0.5 | 8.1 | GO:0003785 | actin monomer binding(GO:0003785) |
| 0.5 | 0.9 | GO:0008427 | calcium-dependent protein kinase inhibitor activity(GO:0008427) |
| 0.5 | 0.9 | GO:0005030 | neurotrophin receptor activity(GO:0005030) |
| 0.5 | 9.5 | GO:0005246 | calcium channel regulator activity(GO:0005246) |
| 0.5 | 0.5 | GO:0010521 | telomerase inhibitor activity(GO:0010521) |
| 0.5 | 1.4 | GO:0035515 | oxidative RNA demethylase activity(GO:0035515) |
| 0.5 | 5.6 | GO:0008191 | metalloendopeptidase inhibitor activity(GO:0008191) |
| 0.5 | 1.4 | GO:0005250 | A-type (transient outward) potassium channel activity(GO:0005250) |
| 0.5 | 18.8 | GO:0004027 | alcohol sulfotransferase activity(GO:0004027) |
| 0.5 | 1.8 | GO:0017151 | DEAD/H-box RNA helicase binding(GO:0017151) |
| 0.5 | 4.1 | GO:0004000 | adenosine deaminase activity(GO:0004000) |
| 0.5 | 30.3 | GO:0004860 | protein kinase inhibitor activity(GO:0004860) |
| 0.5 | 1.8 | GO:0031420 | alkali metal ion binding(GO:0031420) |
| 0.4 | 1.7 | GO:1904288 | BAT3 complex binding(GO:1904288) |
| 0.4 | 6.6 | GO:0000993 | RNA polymerase II core binding(GO:0000993) |
| 0.4 | 0.4 | GO:0050656 | 3'-phosphoadenosine 5'-phosphosulfate binding(GO:0050656) |
| 0.4 | 2.6 | GO:0016717 | oxidoreductase activity, acting on paired donors, with oxidation of a pair of donors resulting in the reduction of molecular oxygen to two molecules of water(GO:0016717) |
| 0.4 | 5.6 | GO:0008601 | protein phosphatase type 2A regulator activity(GO:0008601) |
| 0.4 | 7.3 | GO:0005112 | Notch binding(GO:0005112) |
| 0.4 | 2.5 | GO:0097157 | pre-mRNA intronic binding(GO:0097157) |
| 0.4 | 2.0 | GO:0016174 | NAD(P)H oxidase activity(GO:0016174) |
| 0.4 | 1.2 | GO:0016647 | oxidoreductase activity, acting on the CH-NH group of donors, oxygen as acceptor(GO:0016647) |
| 0.4 | 4.5 | GO:0070182 | DNA polymerase binding(GO:0070182) |
| 0.4 | 3.2 | GO:0015269 | calcium-activated potassium channel activity(GO:0015269) |
| 0.4 | 6.5 | GO:0008327 | methyl-CpG binding(GO:0008327) |
| 0.4 | 5.1 | GO:0005545 | 1-phosphatidylinositol binding(GO:0005545) |
| 0.4 | 3.6 | GO:0004383 | guanylate cyclase activity(GO:0004383) |
| 0.4 | 1.2 | GO:0031893 | vasopressin receptor binding(GO:0031893) |
| 0.4 | 5.4 | GO:0017056 | structural constituent of nuclear pore(GO:0017056) |
| 0.4 | 6.6 | GO:0005229 | intracellular calcium activated chloride channel activity(GO:0005229) |
| 0.4 | 0.8 | GO:0030159 | receptor signaling complex scaffold activity(GO:0030159) |
| 0.4 | 0.4 | GO:0030621 | U4 snRNA binding(GO:0030621) |
| 0.4 | 1.5 | GO:0008486 | diphosphoinositol-polyphosphate diphosphatase activity(GO:0008486) |
| 0.4 | 1.1 | GO:0035259 | glucocorticoid receptor binding(GO:0035259) |
| 0.4 | 0.4 | GO:0043125 | ErbB-3 class receptor binding(GO:0043125) |
| 0.4 | 5.2 | GO:0005242 | inward rectifier potassium channel activity(GO:0005242) |
| 0.4 | 1.5 | GO:0031694 | alpha-2A adrenergic receptor binding(GO:0031694) |
| 0.4 | 2.2 | GO:0030368 | interleukin-17 receptor activity(GO:0030368) |
| 0.4 | 7.0 | GO:0017075 | syntaxin-1 binding(GO:0017075) |
| 0.4 | 9.1 | GO:0015347 | sodium-independent organic anion transmembrane transporter activity(GO:0015347) |
| 0.4 | 1.1 | GO:0003846 | 2-acylglycerol O-acyltransferase activity(GO:0003846) |
| 0.4 | 1.1 | GO:0016015 | morphogen activity(GO:0016015) |
| 0.4 | 1.4 | GO:0005078 | MAP-kinase scaffold activity(GO:0005078) |
| 0.4 | 1.4 | GO:0017162 | aryl hydrocarbon receptor binding(GO:0017162) |
| 0.4 | 2.1 | GO:0008517 | folic acid transporter activity(GO:0008517) |
| 0.3 | 0.7 | GO:0031748 | D1 dopamine receptor binding(GO:0031748) |
| 0.3 | 1.4 | GO:0070579 | methylcytosine dioxygenase activity(GO:0070579) |
| 0.3 | 1.0 | GO:0004946 | bombesin receptor activity(GO:0004946) |
| 0.3 | 1.4 | GO:0033265 | choline binding(GO:0033265) |
| 0.3 | 22.1 | GO:0000981 | RNA polymerase II transcription factor activity, sequence-specific DNA binding(GO:0000981) |
| 0.3 | 0.7 | GO:0034040 | lipid-transporting ATPase activity(GO:0034040) |
| 0.3 | 1.0 | GO:0034739 | histone deacetylase activity (H4-K16 specific)(GO:0034739) |
| 0.3 | 6.1 | GO:0005184 | neuropeptide hormone activity(GO:0005184) |
| 0.3 | 3.7 | GO:0004865 | protein serine/threonine phosphatase inhibitor activity(GO:0004865) |
| 0.3 | 1.7 | GO:0008526 | phosphatidylinositol transporter activity(GO:0008526) |
| 0.3 | 1.0 | GO:0098821 | BMP receptor activity(GO:0098821) |
| 0.3 | 0.7 | GO:0003886 | DNA (cytosine-5-)-methyltransferase activity(GO:0003886) DNA (cytosine-5-)-methyltransferase activity, acting on CpG substrates(GO:0051718) |
| 0.3 | 1.0 | GO:0035473 | lipase binding(GO:0035473) |
| 0.3 | 3.6 | GO:0097602 | cullin family protein binding(GO:0097602) |
| 0.3 | 1.3 | GO:0015562 | efflux transmembrane transporter activity(GO:0015562) |
| 0.3 | 2.6 | GO:0022889 | L-serine transmembrane transporter activity(GO:0015194) serine transmembrane transporter activity(GO:0022889) |
| 0.3 | 7.4 | GO:0008013 | beta-catenin binding(GO:0008013) |
| 0.3 | 3.1 | GO:0015643 | toxic substance binding(GO:0015643) |
| 0.3 | 0.9 | GO:0004967 | glucagon receptor activity(GO:0004967) |
| 0.3 | 0.9 | GO:0008179 | adenylate cyclase binding(GO:0008179) |
| 0.3 | 5.4 | GO:0030332 | cyclin binding(GO:0030332) |
| 0.3 | 1.5 | GO:0000268 | peroxisome targeting sequence binding(GO:0000268) |
| 0.3 | 6.8 | GO:0005104 | fibroblast growth factor receptor binding(GO:0005104) |
| 0.3 | 2.1 | GO:0001222 | transcription corepressor binding(GO:0001222) |
| 0.3 | 0.6 | GO:0055131 | C3HC4-type RING finger domain binding(GO:0055131) |
| 0.3 | 4.1 | GO:0042800 | histone methyltransferase activity (H3-K4 specific)(GO:0042800) |
| 0.3 | 0.6 | GO:0002151 | G-quadruplex RNA binding(GO:0002151) |
| 0.3 | 0.3 | GO:0008301 | DNA binding, bending(GO:0008301) |
| 0.3 | 1.1 | GO:0030229 | very-low-density lipoprotein particle receptor activity(GO:0030229) |
| 0.3 | 7.4 | GO:0051018 | protein kinase A binding(GO:0051018) |
| 0.3 | 1.4 | GO:0046790 | virion binding(GO:0046790) |
| 0.3 | 3.8 | GO:0071855 | neuropeptide receptor binding(GO:0071855) |
| 0.3 | 1.9 | GO:0016670 | oxidoreductase activity, acting on a sulfur group of donors, oxygen as acceptor(GO:0016670) |
| 0.3 | 0.5 | GO:0000900 | translation repressor activity, nucleic acid binding(GO:0000900) |
| 0.3 | 0.5 | GO:0071532 | ankyrin repeat binding(GO:0071532) |
| 0.3 | 5.3 | GO:0032452 | histone demethylase activity(GO:0032452) |
| 0.3 | 0.3 | GO:0019798 | procollagen-proline dioxygenase activity(GO:0019798) |
| 0.3 | 0.3 | GO:0010857 | calcium-dependent protein kinase activity(GO:0010857) |
| 0.3 | 4.4 | GO:0005527 | macrolide binding(GO:0005527) FK506 binding(GO:0005528) |
| 0.3 | 1.0 | GO:0008093 | cytoskeletal adaptor activity(GO:0008093) |
| 0.3 | 3.1 | GO:0008484 | sulfuric ester hydrolase activity(GO:0008484) |
| 0.3 | 0.8 | GO:0030144 | alpha-1,6-mannosylglycoprotein 6-beta-N-acetylglucosaminyltransferase activity(GO:0030144) |
| 0.3 | 4.3 | GO:0042813 | Wnt-activated receptor activity(GO:0042813) |
| 0.2 | 0.2 | GO:0070878 | primary miRNA binding(GO:0070878) |
| 0.2 | 0.7 | GO:0035241 | protein-arginine omega-N monomethyltransferase activity(GO:0035241) |
| 0.2 | 47.1 | GO:0015631 | tubulin binding(GO:0015631) |
| 0.2 | 6.5 | GO:0001540 | beta-amyloid binding(GO:0001540) |
| 0.2 | 0.5 | GO:0070051 | fibrinogen binding(GO:0070051) |
| 0.2 | 4.3 | GO:0004119 | calmodulin-dependent cyclic-nucleotide phosphodiesterase activity(GO:0004117) cGMP-stimulated cyclic-nucleotide phosphodiesterase activity(GO:0004118) cGMP-inhibited cyclic-nucleotide phosphodiesterase activity(GO:0004119) photoreceptor cyclic-nucleotide phosphodiesterase activity(GO:0004120) 7,8-dihydro-D-neopterin 2',3'-cyclic phosphate phosphodiesterase activity(GO:0044688) inositol phosphosphingolipid phospholipase activity(GO:0052712) inositol phosphorylceramide phospholipase activity(GO:0052713) mannosyl-inositol phosphorylceramide phospholipase activity(GO:0052714) mannosyl-diinositol phosphorylceramide phospholipase activity(GO:0052715) |
| 0.2 | 1.2 | GO:0051185 | coenzyme transporter activity(GO:0051185) |
| 0.2 | 0.2 | GO:0031711 | bradykinin receptor binding(GO:0031711) |
| 0.2 | 1.9 | GO:0005452 | inorganic anion exchanger activity(GO:0005452) |
| 0.2 | 1.2 | GO:0015379 | potassium:chloride symporter activity(GO:0015379) potassium ion symporter activity(GO:0022820) |
| 0.2 | 0.7 | GO:0035033 | histone deacetylase regulator activity(GO:0035033) |
| 0.2 | 1.2 | GO:0005000 | vasopressin receptor activity(GO:0005000) |
| 0.2 | 0.7 | GO:0004814 | arginine-tRNA ligase activity(GO:0004814) |
| 0.2 | 1.2 | GO:0004111 | creatine kinase activity(GO:0004111) |
| 0.2 | 0.7 | GO:0003917 | DNA topoisomerase type I activity(GO:0003917) |
| 0.2 | 0.2 | GO:0004115 | 3',5'-cyclic-AMP phosphodiesterase activity(GO:0004115) |
| 0.2 | 0.9 | GO:0016715 | oxidoreductase activity, acting on paired donors, with incorporation or reduction of molecular oxygen, reduced ascorbate as one donor, and incorporation of one atom of oxygen(GO:0016715) |
| 0.2 | 0.9 | GO:0098518 | polynucleotide phosphatase activity(GO:0098518) |
| 0.2 | 0.7 | GO:0046965 | retinoid X receptor binding(GO:0046965) |
| 0.2 | 0.9 | GO:0000403 | Y-form DNA binding(GO:0000403) |
| 0.2 | 0.9 | GO:0031849 | olfactory receptor binding(GO:0031849) |
| 0.2 | 1.1 | GO:0004563 | beta-N-acetylhexosaminidase activity(GO:0004563) |
| 0.2 | 3.0 | GO:0015026 | coreceptor activity(GO:0015026) |
| 0.2 | 6.3 | GO:0030374 | ligand-dependent nuclear receptor transcription coactivator activity(GO:0030374) |
| 0.2 | 0.4 | GO:0018566 | 2,3-dihydroxy DDT 1,2-dioxygenase activity(GO:0018542) phenanthrene dioxygenase activity(GO:0018555) 2,2',3-trihydroxybiphenyl dioxygenase activity(GO:0018556) 1,2-dihydroxyfluorene 1,1-alpha-dioxygenase activity(GO:0018557) 5,6-dihydroxy-3-methyl-2-oxo-1,2-dihydroquinoline dioxygenase activity(GO:0018558) 1,1-dichloro-2-(dihydroxy-4-chlorophenyl)-(4-chlorophenyl)ethene 1,2-dioxygenase activity(GO:0018559) protocatechuate 3,4-dioxygenase type II activity(GO:0018560) 2'-aminobiphenyl-2,3-diol 1,2-dioxygenase activity(GO:0018561) 3,4-dihydroxyfluorene 4,4-alpha-dioxygenase activity(GO:0018562) 2,3-dihydroxy-ethylbenzene 1,2-dioxygenase activity(GO:0018563) carbazole 1,9a-dioxygenase activity(GO:0018564) dihydroxydibenzothiophene dioxygenase activity(GO:0018565) 1,2-dihydroxynaphthalene-6-sulfonate 1,8a-dioxygenase activity(GO:0018566) styrene dioxygenase activity(GO:0018567) 3,4-dihydroxyphenanthrene dioxygenase activity(GO:0018568) hydroquinone 1,2-dioxygenase activity(GO:0018569) p-cumate 2,3-dioxygenase activity(GO:0018570) 2,3-dihydroxy-p-cumate dioxygenase activity(GO:0018571) 3,5-dichlorocatechol 1,2-dioxygenase activity(GO:0018572) 2-aminophenol 1,6-dioxygenase activity(GO:0018573) 2,6-dichloro-p-hydroquinone 1,2-dioxygenase activity(GO:0018574) chlorocatechol 1,2-dioxygenase activity(GO:0018575) catechol dioxygenase activity(GO:0019114) dihydroxyfluorene dioxygenase activity(GO:0019117) 5-aminosalicylate dioxygenase activity(GO:0034543) 3-hydroxy-2-naphthoate 2,3-dioxygenase activity(GO:0034803) benzo(a)pyrene 11,12-dioxygenase activity(GO:0034806) benzo(a)pyrene 4,5-dioxygenase activity(GO:0034808) 4,5-dihydroxybenzo(a)pyrene dioxygenase activity(GO:0034810) benzo(a)pyrene 9,10-dioxygenase activity(GO:0034811) 9,10-dihydroxybenzo(a)pyrene dioxygenase activity(GO:0034812) benzo(a)pyrene 7,8-dioxygenase activity(GO:0034813) 7,8-dihydroxy benzo(a)pyrene dioxygenase activity(GO:0034814) 1,2-dihydroxy-5,6,7,8-tetrahydronaphthalene extradiol dioxygenase activity(GO:0034827) 2-mercaptobenzothiazole dioxygenase activity(GO:0034834) pyridine-3,4-diol dioxygenase activity(GO:0034895) pyrene dioxygenase activity(GO:0034920) 4,5-dihydroxypyrene dioxygenase activity(GO:0034922) phenanthrene-4-carboxylate dioxygenase activity(GO:0034934) tetrachlorobenzene dioxygenase activity(GO:0034935) 4,6-dichloro-3-methylcatechol 1,2-dioxygenase activity(GO:0034936) 2,3-dihydroxydiphenyl ether dioxygenase activity(GO:0034955) diphenyl ether 1,2-dioxygenase activity(GO:0034956) arachidonate 8(S)-lipoxygenase activity(GO:0036403) 4-hydroxycatechol 1,2-dioxygenase activity(GO:0047074) |
| 0.2 | 0.6 | GO:0008900 | hydrogen:potassium-exchanging ATPase activity(GO:0008900) |
| 0.2 | 3.7 | GO:0017134 | fibroblast growth factor binding(GO:0017134) |
| 0.2 | 0.6 | GO:1904680 | peptide-transporting ATPase activity(GO:0015440) peptide transmembrane transporter activity(GO:1904680) |
| 0.2 | 0.6 | GO:0050220 | prostaglandin-E synthase activity(GO:0050220) |
| 0.2 | 4.9 | GO:0008188 | neuropeptide receptor activity(GO:0008188) |
| 0.2 | 0.4 | GO:0004667 | prostaglandin-D synthase activity(GO:0004667) |
| 0.2 | 1.4 | GO:0102337 | fatty acid elongase activity(GO:0009922) 3-oxo-arachidoyl-CoA synthase activity(GO:0102336) 3-oxo-cerotoyl-CoA synthase activity(GO:0102337) 3-oxo-lignoceronyl-CoA synthase activity(GO:0102338) |
| 0.2 | 0.6 | GO:0045504 | dynein heavy chain binding(GO:0045504) |
| 0.2 | 1.0 | GO:0102391 | decanoate--CoA ligase activity(GO:0102391) |
| 0.2 | 1.1 | GO:0048256 | flap endonuclease activity(GO:0048256) |
| 0.2 | 0.6 | GO:0030943 | mitochondrion targeting sequence binding(GO:0030943) |
| 0.2 | 0.9 | GO:0042923 | neuropeptide binding(GO:0042923) |
| 0.2 | 0.4 | GO:0051380 | norepinephrine binding(GO:0051380) |
| 0.2 | 0.2 | GO:0005087 | Ran guanyl-nucleotide exchange factor activity(GO:0005087) |
| 0.2 | 0.4 | GO:0031698 | beta-2 adrenergic receptor binding(GO:0031698) |
| 0.2 | 4.6 | GO:0005109 | frizzled binding(GO:0005109) |
| 0.2 | 4.4 | GO:0032947 | protein complex scaffold(GO:0032947) |
| 0.2 | 1.4 | GO:0001055 | RNA polymerase II activity(GO:0001055) |
| 0.2 | 0.4 | GO:0008073 | ornithine decarboxylase inhibitor activity(GO:0008073) |
| 0.2 | 0.5 | GO:0005134 | interleukin-2 receptor binding(GO:0005134) |
| 0.2 | 1.0 | GO:0035497 | cAMP response element binding(GO:0035497) |
| 0.2 | 0.5 | GO:0004126 | cytidine deaminase activity(GO:0004126) |
| 0.2 | 0.3 | GO:0042731 | PH domain binding(GO:0042731) |
| 0.2 | 2.9 | GO:0005086 | ARF guanyl-nucleotide exchange factor activity(GO:0005086) |
| 0.2 | 0.8 | GO:0033691 | sialic acid binding(GO:0033691) |
| 0.2 | 2.8 | GO:0003746 | translation elongation factor activity(GO:0003746) |
| 0.2 | 22.7 | GO:0003729 | mRNA binding(GO:0003729) |
| 0.2 | 0.3 | GO:0097016 | L27 domain binding(GO:0097016) |
| 0.2 | 36.6 | GO:0001071 | nucleic acid binding transcription factor activity(GO:0001071) transcription factor activity, sequence-specific DNA binding(GO:0003700) |
| 0.2 | 0.8 | GO:0004565 | beta-galactosidase activity(GO:0004565) |
| 0.2 | 1.1 | GO:0035613 | RNA stem-loop binding(GO:0035613) |
| 0.2 | 3.1 | GO:0001786 | phosphatidylserine binding(GO:0001786) |
| 0.2 | 0.6 | GO:0086006 | voltage-gated sodium channel activity involved in cardiac muscle cell action potential(GO:0086006) |
| 0.2 | 1.4 | GO:0001223 | transcription coactivator binding(GO:0001223) |
| 0.2 | 0.2 | GO:0050816 | phosphothreonine binding(GO:0050816) |
| 0.2 | 0.2 | GO:0043398 | HLH domain binding(GO:0043398) |
| 0.2 | 0.3 | GO:0035014 | phosphatidylinositol 3-kinase regulator activity(GO:0035014) |
| 0.2 | 1.4 | GO:0031210 | phosphatidylcholine binding(GO:0031210) |
| 0.2 | 1.2 | GO:0001206 | transcriptional repressor activity, RNA polymerase II distal enhancer sequence-specific binding(GO:0001206) |
| 0.2 | 0.3 | GO:0042392 | sphingosine-1-phosphate phosphatase activity(GO:0042392) |
| 0.2 | 0.6 | GO:0004337 | geranyltranstransferase activity(GO:0004337) |
| 0.2 | 0.5 | GO:0015093 | ferrous iron transmembrane transporter activity(GO:0015093) |
| 0.2 | 0.6 | GO:0045545 | syndecan binding(GO:0045545) |
| 0.1 | 21.1 | GO:0003682 | chromatin binding(GO:0003682) |
| 0.1 | 0.4 | GO:0008597 | calcium-dependent protein serine/threonine phosphatase regulator activity(GO:0008597) |
| 0.1 | 0.9 | GO:0033130 | acetylcholine receptor binding(GO:0033130) |
| 0.1 | 0.3 | GO:0005128 | erythropoietin receptor binding(GO:0005128) |
| 0.1 | 0.1 | GO:0005290 | L-histidine transmembrane transporter activity(GO:0005290) |
| 0.1 | 1.5 | GO:0035254 | glutamate receptor binding(GO:0035254) |
| 0.1 | 0.3 | GO:0008240 | tripeptidyl-peptidase activity(GO:0008240) |
| 0.1 | 1.2 | GO:0055106 | ubiquitin-protein transferase regulator activity(GO:0055106) |
| 0.1 | 0.3 | GO:0016880 | acid-ammonia (or amide) ligase activity(GO:0016880) |
| 0.1 | 3.1 | GO:0008483 | transaminase activity(GO:0008483) |
| 0.1 | 0.3 | GO:0048531 | beta-1,3-galactosyltransferase activity(GO:0048531) |
| 0.1 | 2.1 | GO:0005249 | voltage-gated potassium channel activity(GO:0005249) |
| 0.1 | 0.5 | GO:0004488 | methylenetetrahydrofolate dehydrogenase (NADP+) activity(GO:0004488) |
| 0.1 | 0.5 | GO:0008745 | N-acetylmuramoyl-L-alanine amidase activity(GO:0008745) peptidoglycan receptor activity(GO:0016019) |
| 0.1 | 0.4 | GO:0019797 | procollagen-proline 3-dioxygenase activity(GO:0019797) |
| 0.1 | 1.0 | GO:0000983 | transcription factor activity, RNA polymerase II core promoter sequence-specific(GO:0000983) |
| 0.1 | 1.2 | GO:0004176 | ATP-dependent peptidase activity(GO:0004176) |
| 0.1 | 0.1 | GO:0045322 | unmethylated CpG binding(GO:0045322) |
| 0.1 | 0.4 | GO:0005131 | growth hormone receptor binding(GO:0005131) |
| 0.1 | 0.6 | GO:0016901 | oxidoreductase activity, acting on the CH-OH group of donors, quinone or similar compound as acceptor(GO:0016901) |
| 0.1 | 0.1 | GO:0070840 | dynein complex binding(GO:0070840) |
| 0.1 | 0.7 | GO:0017099 | very-long-chain-acyl-CoA dehydrogenase activity(GO:0017099) |
| 0.1 | 0.4 | GO:0030021 | extracellular matrix structural constituent conferring compression resistance(GO:0030021) structural constituent of tooth enamel(GO:0030345) |
| 0.1 | 0.6 | GO:0003958 | NADPH-hemoprotein reductase activity(GO:0003958) |
| 0.1 | 2.2 | GO:0003950 | NAD+ ADP-ribosyltransferase activity(GO:0003950) |
| 0.1 | 0.1 | GO:0032138 | single base insertion or deletion binding(GO:0032138) |
| 0.1 | 22.4 | GO:0001077 | transcriptional activator activity, RNA polymerase II core promoter proximal region sequence-specific binding(GO:0001077) |
| 0.1 | 0.5 | GO:0004582 | dolichyl-phosphate beta-D-mannosyltransferase activity(GO:0004582) |
| 0.1 | 1.2 | GO:0004707 | MAP kinase activity(GO:0004707) |
| 0.1 | 0.3 | GO:0004793 | threonine aldolase activity(GO:0004793) L-allo-threonine aldolase activity(GO:0008732) |
| 0.1 | 3.7 | GO:0005261 | cation channel activity(GO:0005261) |
| 0.1 | 0.3 | GO:0003831 | beta-N-acetylglucosaminylglycopeptide beta-1,4-galactosyltransferase activity(GO:0003831) |
| 0.1 | 0.6 | GO:0016813 | hydrolase activity, acting on carbon-nitrogen (but not peptide) bonds, in linear amidines(GO:0016813) |
| 0.1 | 0.3 | GO:0016716 | oxidoreductase activity, acting on paired donors, with incorporation or reduction of molecular oxygen, another compound as one donor, and incorporation of one atom of oxygen(GO:0016716) |
| 0.1 | 0.8 | GO:0000701 | purine-specific mismatch base pair DNA N-glycosylase activity(GO:0000701) |
| 0.1 | 0.3 | GO:0018479 | benzaldehyde dehydrogenase (NAD+) activity(GO:0018479) |
| 0.1 | 0.1 | GO:0005119 | smoothened binding(GO:0005119) |
| 0.1 | 1.3 | GO:0015035 | protein disulfide oxidoreductase activity(GO:0015035) |
| 0.1 | 0.3 | GO:0033192 | calcium-dependent protein serine/threonine phosphatase activity(GO:0004723) calmodulin-dependent protein phosphatase activity(GO:0033192) |
| 0.1 | 0.2 | GO:0003976 | UDP-N-acetylglucosamine-lysosomal-enzyme N-acetylglucosaminephosphotransferase activity(GO:0003976) |
| 0.1 | 38.4 | GO:0005509 | calcium ion binding(GO:0005509) |
| 0.1 | 2.2 | GO:0044212 | transcription regulatory region DNA binding(GO:0044212) |
| 0.1 | 0.1 | GO:0005283 | sodium:amino acid symporter activity(GO:0005283) |
| 0.1 | 0.1 | GO:0050693 | LBD domain binding(GO:0050693) |
| 0.1 | 0.3 | GO:0035035 | histone acetyltransferase binding(GO:0035035) |
| 0.1 | 0.3 | GO:0001135 | transcription factor activity, RNA polymerase II transcription factor recruiting(GO:0001135) |
| 0.1 | 0.2 | GO:1990226 | histone methyltransferase binding(GO:1990226) |
| 0.1 | 0.2 | GO:0008469 | histone-arginine N-methyltransferase activity(GO:0008469) |
| 0.1 | 0.2 | GO:0061665 | SUMO ligase activity(GO:0061665) |
| 0.1 | 0.1 | GO:0050815 | phosphoserine binding(GO:0050815) |
| 0.1 | 0.3 | GO:0034235 | GPI anchor binding(GO:0034235) |
| 0.1 | 0.4 | GO:0005338 | nucleotide-sugar transmembrane transporter activity(GO:0005338) |
| 0.1 | 1.1 | GO:0019894 | kinesin binding(GO:0019894) |
| 0.1 | 0.1 | GO:0045503 | dynein light chain binding(GO:0045503) |
| 0.1 | 0.1 | GO:0002094 | polyprenyltransferase activity(GO:0002094) |
| 0.1 | 0.1 | GO:0005146 | leukemia inhibitory factor receptor binding(GO:0005146) |
| 0.1 | 0.5 | GO:0050750 | low-density lipoprotein particle receptor binding(GO:0050750) |
| 0.1 | 0.2 | GO:0005148 | prolactin receptor binding(GO:0005148) |
| 0.1 | 0.3 | GO:0004332 | fructose-bisphosphate aldolase activity(GO:0004332) |
| 0.1 | 0.5 | GO:0008113 | peptide-methionine (S)-S-oxide reductase activity(GO:0008113) |
| 0.1 | 2.0 | GO:0005504 | fatty acid binding(GO:0005504) |
| 0.1 | 0.1 | GO:0089720 | caspase binding(GO:0089720) |
| 0.1 | 0.5 | GO:0004535 | poly(A)-specific ribonuclease activity(GO:0004535) |
| 0.1 | 0.4 | GO:0001054 | RNA polymerase I activity(GO:0001054) |
| 0.1 | 0.1 | GO:0017089 | glycolipid transporter activity(GO:0017089) |
| 0.1 | 0.5 | GO:0003689 | DNA clamp loader activity(GO:0003689) protein-DNA loading ATPase activity(GO:0033170) |
| 0.1 | 1.5 | GO:0019706 | protein-cysteine S-palmitoyltransferase activity(GO:0019706) |
| 0.1 | 0.1 | GO:0032357 | oxidized DNA binding(GO:0032356) oxidized purine DNA binding(GO:0032357) |
| 0.1 | 0.3 | GO:0017070 | U6 snRNA binding(GO:0017070) |
| 0.1 | 0.5 | GO:0098599 | palmitoyl-(protein) hydrolase activity(GO:0008474) palmitoyl hydrolase activity(GO:0098599) |
| 0.1 | 0.2 | GO:0000171 | ribonuclease MRP activity(GO:0000171) |
| 0.1 | 0.2 | GO:0051575 | 5'-deoxyribose-5-phosphate lyase activity(GO:0051575) |
| 0.1 | 0.2 | GO:0017150 | tRNA dihydrouridine synthase activity(GO:0017150) |
| 0.1 | 0.1 | GO:0047498 | calcium-dependent phospholipase A2 activity(GO:0047498) |
| 0.1 | 0.6 | GO:0070628 | proteasome binding(GO:0070628) |
| 0.1 | 0.2 | GO:0031730 | CCR5 chemokine receptor binding(GO:0031730) |
| 0.1 | 0.1 | GO:0000340 | RNA 7-methylguanosine cap binding(GO:0000340) |
| 0.1 | 0.2 | GO:0070742 | C2H2 zinc finger domain binding(GO:0070742) |
| 0.0 | 0.1 | GO:0001849 | complement component C1q binding(GO:0001849) |
| 0.0 | 0.0 | GO:0004676 | 3-phosphoinositide-dependent protein kinase activity(GO:0004676) |
| 0.0 | 0.1 | GO:0043262 | adenosine-diphosphatase activity(GO:0043262) |
| 0.0 | 0.1 | GO:0030158 | protein xylosyltransferase activity(GO:0030158) |
| 0.0 | 0.1 | GO:0015377 | cation:chloride symporter activity(GO:0015377) |
| 0.0 | 0.1 | GO:0016520 | growth hormone-releasing hormone receptor activity(GO:0016520) |
| 0.0 | 0.2 | GO:0004169 | dolichyl-phosphate-mannose-protein mannosyltransferase activity(GO:0004169) |
| 0.0 | 0.2 | GO:0051959 | dynein light intermediate chain binding(GO:0051959) |
| 0.0 | 0.1 | GO:0005275 | amine transmembrane transporter activity(GO:0005275) |
| 0.0 | 0.3 | GO:0030331 | estrogen receptor binding(GO:0030331) |
| 0.0 | 0.1 | GO:0005502 | 11-cis retinal binding(GO:0005502) |
| 0.0 | 0.5 | GO:0008353 | RNA polymerase II carboxy-terminal domain kinase activity(GO:0008353) |
| 0.0 | 0.5 | GO:0052634 | sulfonate dioxygenase activity(GO:0000907) 2,4-dichlorophenoxyacetate alpha-ketoglutarate dioxygenase activity(GO:0018602) hypophosphite dioxygenase activity(GO:0034792) gibberellin 2-beta-dioxygenase activity(GO:0045543) C-19 gibberellin 2-beta-dioxygenase activity(GO:0052634) C-20 gibberellin 2-beta-dioxygenase activity(GO:0052635) |
| 0.0 | 0.1 | GO:0002046 | opsin binding(GO:0002046) |
| 0.0 | 0.2 | GO:0004300 | enoyl-CoA hydratase activity(GO:0004300) |
| 0.0 | 0.0 | GO:0051377 | mannose-ethanolamine phosphotransferase activity(GO:0051377) |
| 0.0 | 0.2 | GO:0034979 | NAD-dependent protein deacetylase activity(GO:0034979) |
| 0.0 | 0.2 | GO:0000064 | L-ornithine transmembrane transporter activity(GO:0000064) |
| 0.0 | 1.4 | GO:0044824 | integrase activity(GO:0008907) T/G mismatch-specific endonuclease activity(GO:0043765) retroviral integrase activity(GO:0044823) retroviral 3' processing activity(GO:0044824) |
| 0.0 | 0.1 | GO:0000386 | second spliceosomal transesterification activity(GO:0000386) |
| 0.0 | 0.1 | GO:0008384 | IkappaB kinase activity(GO:0008384) |
| 0.0 | 0.1 | GO:0004035 | alkaline phosphatase activity(GO:0004035) |
| 0.0 | 19.6 | GO:0043565 | sequence-specific DNA binding(GO:0043565) |
| 0.0 | 0.1 | GO:0004605 | phosphatidate cytidylyltransferase activity(GO:0004605) |
| 0.0 | 0.0 | GO:0004144 | diacylglycerol O-acyltransferase activity(GO:0004144) |
| 0.0 | 0.6 | GO:0016702 | oxidoreductase activity, acting on single donors with incorporation of molecular oxygen, incorporation of two atoms of oxygen(GO:0016702) |
| 0.0 | 0.0 | GO:0004629 | phospholipase C activity(GO:0004629) |
| 0.0 | 0.1 | GO:0050567 | glutaminyl-tRNA synthase (glutamine-hydrolyzing) activity(GO:0050567) |
| 0.0 | 0.1 | GO:0043175 | RNA polymerase core enzyme binding(GO:0043175) |
| 0.0 | 0.2 | GO:0046977 | TAP binding(GO:0046977) |
| 0.0 | 0.1 | GO:0015321 | sodium-dependent phosphate transmembrane transporter activity(GO:0015321) |
| 0.0 | 0.4 | GO:0004864 | protein phosphatase inhibitor activity(GO:0004864) |
| 0.0 | 0.2 | GO:0001056 | RNA polymerase III activity(GO:0001056) |
| 0.0 | 0.1 | GO:0043120 | tumor necrosis factor binding(GO:0043120) |
| 0.0 | 0.0 | GO:0046975 | histone methyltransferase activity (H3-K36 specific)(GO:0046975) |
| 0.0 | 0.2 | GO:0003707 | steroid hormone receptor activity(GO:0003707) |
| 0.0 | 0.1 | GO:0004652 | polynucleotide adenylyltransferase activity(GO:0004652) |
| 0.0 | 0.5 | GO:0031369 | translation initiation factor binding(GO:0031369) |
| 0.0 | 0.1 | GO:0042284 | sphingolipid delta-4 desaturase activity(GO:0042284) |
| 0.0 | 0.1 | GO:0004370 | glycerol kinase activity(GO:0004370) |
| 0.0 | 0.1 | GO:0016884 | carbon-nitrogen ligase activity, with glutamine as amido-N-donor(GO:0016884) |
| 0.0 | 0.0 | GO:0050252 | retinol O-fatty-acyltransferase activity(GO:0050252) |
| 0.0 | 0.0 | GO:0043734 | DNA-N1-methyladenine dioxygenase activity(GO:0043734) |
| 0.0 | 0.3 | GO:0004298 | threonine-type endopeptidase activity(GO:0004298) threonine-type peptidase activity(GO:0070003) |
| 0.0 | 0.1 | GO:0034821 | pinocarveol dehydrogenase activity(GO:0018446) chloral hydrate dehydrogenase activity(GO:0018447) hydroxymethylmethylsilanediol oxidase activity(GO:0018448) 1-phenylethanol dehydrogenase activity(GO:0018449) myrtenol dehydrogenase activity(GO:0018450) cis-1,2-dihydroxy-1,2-dihydro-8-carboxynaphthalene dehydrogenase activity(GO:0034522) 3-hydroxy-4-methyloctanoyl-CoA dehydrogenase activity(GO:0034582) 2-hydroxy-4-isopropenylcyclohexane-1-carboxyl-CoA dehydrogenase activity(GO:0034778) cis-9,10-dihydroanthracene-9,10-diol dehydrogenase activity(GO:0034817) citronellol dehydrogenase activity(GO:0034821) naphthyl-2-hydroxymethyl-succinyl-CoA dehydrogenase activity(GO:0034847) 2,4,4-trimethyl-1-pentanol dehydrogenase activity(GO:0034863) 2,4,4-trimethyl-3-hydroxypentanoyl-CoA dehydrogenase activity(GO:0034868) 1-hydroxy-4,4-dimethylpentan-3-one dehydrogenase activity(GO:0034871) endosulfan diol dehydrogenase activity(GO:0034891) endosulfan hydroxyether dehydrogenase activity(GO:0034901) 3-hydroxy-2-methylhexanoyl-CoA dehydrogenase activity(GO:0034918) 3-hydroxy-2,6-dimethyl-5-methylene-heptanoyl-CoA dehydrogenase activity(GO:0034944) versicolorin reductase activity(GO:0042469) ketoreductase activity(GO:0045703) |
| 0.0 | 0.0 | GO:0008475 | procollagen-lysine 5-dioxygenase activity(GO:0008475) |
| 0.0 | 0.1 | GO:0022858 | L-alanine transmembrane transporter activity(GO:0015180) alanine transmembrane transporter activity(GO:0022858) |
| 0.0 | 0.3 | GO:0003954 | NADH dehydrogenase activity(GO:0003954) |
| 0.0 | 0.1 | GO:0004523 | RNA-DNA hybrid ribonuclease activity(GO:0004523) |
| 0.0 | 0.0 | GO:0033558 | histone deacetylase activity(GO:0004407) protein deacetylase activity(GO:0033558) |
| 0.0 | 0.0 | GO:0017116 | single-stranded DNA-dependent ATP-dependent DNA helicase activity(GO:0017116) single-stranded DNA-dependent ATPase activity(GO:0043142) |
| 0.0 | 0.0 | GO:1990050 | phosphatidic acid transporter activity(GO:1990050) |
Gene overrepresentation in curated gene sets: canonical pathways category:
| Log-likelihood per target | Total log-likelihood | Term | Description |
|---|---|---|---|
| 1.2 | 19.0 | PID SYNDECAN 3 PATHWAY | Syndecan-3-mediated signaling events |
| 1.2 | 31.3 | PID LIS1 PATHWAY | Lissencephaly gene (LIS1) in neuronal migration and development |
| 1.0 | 27.7 | ST GRANULE CELL SURVIVAL PATHWAY | Granule Cell Survival Pathway is a specific case of more general PAC1 Receptor Pathway. |
| 0.9 | 40.5 | PID LKB1 PATHWAY | LKB1 signaling events |
| 0.8 | 6.6 | PID REELIN PATHWAY | Reelin signaling pathway |
| 0.8 | 24.7 | ST WNT BETA CATENIN PATHWAY | Wnt/beta-catenin Pathway |
| 0.8 | 17.5 | SIG REGULATION OF THE ACTIN CYTOSKELETON BY RHO GTPASES | Genes related to regulation of the actin cytoskeleton |
| 0.7 | 16.7 | PID NETRIN PATHWAY | Netrin-mediated signaling events |
| 0.7 | 24.1 | PID AURORA B PATHWAY | Aurora B signaling |
| 0.7 | 13.1 | PID HEDGEHOG 2PATHWAY | Signaling events mediated by the Hedgehog family |
| 0.7 | 11.5 | PID NEPHRIN NEPH1 PATHWAY | Nephrin/Neph1 signaling in the kidney podocyte |
| 0.6 | 8.0 | PID ERBB NETWORK PATHWAY | ErbB receptor signaling network |
| 0.6 | 35.8 | PID BETA CATENIN NUC PATHWAY | Regulation of nuclear beta catenin signaling and target gene transcription |
| 0.6 | 26.7 | PID NOTCH PATHWAY | Notch signaling pathway |
| 0.5 | 10.9 | PID CDC42 REG PATHWAY | Regulation of CDC42 activity |
| 0.5 | 22.4 | PID CDC42 PATHWAY | CDC42 signaling events |
| 0.5 | 7.4 | PID AR NONGENOMIC PATHWAY | Nongenotropic Androgen signaling |
| 0.5 | 12.0 | PID NCADHERIN PATHWAY | N-cadherin signaling events |
| 0.4 | 3.2 | PID EPHB FWD PATHWAY | EPHB forward signaling |
| 0.4 | 11.9 | PID HNF3A PATHWAY | FOXA1 transcription factor network |
| 0.3 | 0.9 | PID PI3K PLC TRK PATHWAY | Trk receptor signaling mediated by PI3K and PLC-gamma |
| 0.3 | 4.7 | PID RAC1 REG PATHWAY | Regulation of RAC1 activity |
| 0.2 | 4.0 | PID GLYPICAN 1PATHWAY | Glypican 1 network |
| 0.2 | 4.5 | PID EPHRINB REV PATHWAY | Ephrin B reverse signaling |
| 0.2 | 4.6 | PID EPHA FWDPATHWAY | EPHA forward signaling |
| 0.2 | 1.4 | PID MAPK TRK PATHWAY | Trk receptor signaling mediated by the MAPK pathway |
| 0.2 | 2.8 | ST G ALPHA I PATHWAY | G alpha i Pathway |
| 0.2 | 2.5 | PID LPA4 PATHWAY | LPA4-mediated signaling events |
| 0.2 | 0.6 | PID CXCR3 PATHWAY | CXCR3-mediated signaling events |
| 0.2 | 2.6 | PID RET PATHWAY | Signaling events regulated by Ret tyrosine kinase |
| 0.2 | 0.6 | PID IFNG PATHWAY | IFN-gamma pathway |
| 0.2 | 0.2 | PID TRAIL PATHWAY | TRAIL signaling pathway |
| 0.2 | 0.2 | ST B CELL ANTIGEN RECEPTOR | B Cell Antigen Receptor |
| 0.2 | 0.3 | PID MET PATHWAY | Signaling events mediated by Hepatocyte Growth Factor Receptor (c-Met) |
| 0.1 | 0.4 | PID BETA CATENIN DEG PATHWAY | Degradation of beta catenin |
| 0.1 | 4.6 | PID TRKR PATHWAY | Neurotrophic factor-mediated Trk receptor signaling |
| 0.1 | 1.3 | ST DIFFERENTIATION PATHWAY IN PC12 CELLS | Differentiation Pathway in PC12 Cells; this is a specific case of PAC1 Receptor Pathway. |
| 0.1 | 3.2 | PID WNT SIGNALING PATHWAY | Wnt signaling network |
| 0.1 | 0.6 | ST ADRENERGIC | Adrenergic Pathway |
| 0.1 | 2.1 | PID ARF 3PATHWAY | Arf1 pathway |
| 0.1 | 12.0 | NABA ECM AFFILIATED | Genes encoding proteins affiliated structurally or functionally to extracellular matrix proteins |
| 0.1 | 0.3 | PID PS1 PATHWAY | Presenilin action in Notch and Wnt signaling |
| 0.1 | 0.1 | PID ARF6 DOWNSTREAM PATHWAY | Arf6 downstream pathway |
| 0.1 | 0.4 | ST INTERFERON GAMMA PATHWAY | Interferon gamma pathway. |
| 0.1 | 0.4 | PID SMAD2 3PATHWAY | Regulation of cytoplasmic and nuclear SMAD2/3 signaling |
| 0.1 | 0.1 | PID RANBP2 PATHWAY | Sumoylation by RanBP2 regulates transcriptional repression |
| 0.1 | 9.5 | NABA ECM GLYCOPROTEINS | Genes encoding structural ECM glycoproteins |
| 0.1 | 2.0 | PID ARF6 TRAFFICKING PATHWAY | Arf6 trafficking events |
| 0.0 | 0.5 | PID ERBB4 PATHWAY | ErbB4 signaling events |
| 0.0 | 1.1 | PID BMP PATHWAY | BMP receptor signaling |
| 0.0 | 0.1 | SA G1 AND S PHASES | Cdk2, 4, and 6 bind cyclin D in G1, while cdk2/cyclin E promotes the G1/S transition. |
| 0.0 | 0.9 | PID ATR PATHWAY | ATR signaling pathway |
| 0.0 | 0.2 | ST IL 13 PATHWAY | Interleukin 13 (IL-13) Pathway |
| 0.0 | 0.0 | PID IL2 STAT5 PATHWAY | IL2 signaling events mediated by STAT5 |
| 0.0 | 0.2 | ST WNT CA2 CYCLIC GMP PATHWAY | Wnt/Ca2+/cyclic GMP signaling. |
| 0.0 | 0.0 | ST STAT3 PATHWAY | STAT3 Pathway |
| 0.0 | 0.0 | PID TCPTP PATHWAY | Signaling events mediated by TCPTP |
| 0.0 | 0.1 | SA PTEN PATHWAY | PTEN is a tumor suppressor that dephosphorylates the lipid messenger phosphatidylinositol triphosphate. |
Gene overrepresentation in curated gene sets: REACTOME pathways category:
| Log-likelihood per target | Total log-likelihood | Term | Description |
|---|---|---|---|
| 3.4 | 47.5 | REACTOME CRMPS IN SEMA3A SIGNALING | Genes involved in CRMPs in Sema3A signaling |
| 2.4 | 23.7 | REACTOME ACTIVATION OF THE AP1 FAMILY OF TRANSCRIPTION FACTORS | Genes involved in Activation of the AP-1 family of transcription factors |
| 2.3 | 35.0 | REACTOME UNBLOCKING OF NMDA RECEPTOR GLUTAMATE BINDING AND ACTIVATION | Genes involved in Unblocking of NMDA receptor, glutamate binding and activation |
| 2.3 | 20.8 | REACTOME ROLE OF SECOND MESSENGERS IN NETRIN1 SIGNALING | Genes involved in Role of second messengers in netrin-1 signaling |
| 2.3 | 29.7 | REACTOME SYNTHESIS SECRETION AND INACTIVATION OF GIP | Genes involved in Synthesis, Secretion, and Inactivation of Glucose-dependent Insulinotropic Polypeptide (GIP) |
| 2.2 | 52.4 | REACTOME MYOGENESIS | Genes involved in Myogenesis |
| 1.9 | 29.7 | REACTOME POST CHAPERONIN TUBULIN FOLDING PATHWAY | Genes involved in Post-chaperonin tubulin folding pathway |
| 1.9 | 5.6 | REACTOME ACETYLCHOLINE NEUROTRANSMITTER RELEASE CYCLE | Genes involved in Acetylcholine Neurotransmitter Release Cycle |
| 1.8 | 21.9 | REACTOME GABA A RECEPTOR ACTIVATION | Genes involved in GABA A receptor activation |
| 1.6 | 1.6 | REACTOME PLC BETA MEDIATED EVENTS | Genes involved in PLC beta mediated events |
| 1.5 | 26.2 | REACTOME NEPHRIN INTERACTIONS | Genes involved in Nephrin interactions |
| 1.5 | 6.1 | REACTOME DSCAM INTERACTIONS | Genes involved in DSCAM interactions |
| 1.5 | 16.1 | REACTOME IONOTROPIC ACTIVITY OF KAINATE RECEPTORS | Genes involved in Ionotropic activity of Kainate Receptors |
| 1.4 | 24.5 | REACTOME GABA SYNTHESIS RELEASE REUPTAKE AND DEGRADATION | Genes involved in GABA synthesis, release, reuptake and degradation |
| 1.4 | 1.4 | REACTOME OLFACTORY SIGNALING PATHWAY | Genes involved in Olfactory Signaling Pathway |
| 1.3 | 29.5 | REACTOME NETRIN1 SIGNALING | Genes involved in Netrin-1 signaling |
| 1.3 | 18.2 | REACTOME CLASS C 3 METABOTROPIC GLUTAMATE PHEROMONE RECEPTORS | Genes involved in Class C/3 (Metabotropic glutamate/pheromone receptors) |
| 1.2 | 15.7 | REACTOME OTHER SEMAPHORIN INTERACTIONS | Genes involved in Other semaphorin interactions |
| 1.1 | 23.1 | REACTOME SIGNALING BY ROBO RECEPTOR | Genes involved in Signaling by Robo receptor |
| 1.0 | 14.3 | REACTOME N GLYCAN ANTENNAE ELONGATION | Genes involved in N-Glycan antennae elongation |
| 1.0 | 24.4 | REACTOME ACTIVATED NOTCH1 TRANSMITS SIGNAL TO THE NUCLEUS | Genes involved in Activated NOTCH1 Transmits Signal to the Nucleus |
| 1.0 | 17.6 | REACTOME ADHERENS JUNCTIONS INTERACTIONS | Genes involved in Adherens junctions interactions |
| 1.0 | 9.7 | REACTOME CYTOSOLIC SULFONATION OF SMALL MOLECULES | Genes involved in Cytosolic sulfonation of small molecules |
| 1.0 | 18.4 | REACTOME DARPP 32 EVENTS | Genes involved in DARPP-32 events |
| 1.0 | 7.7 | REACTOME LIGAND GATED ION CHANNEL TRANSPORT | Genes involved in Ligand-gated ion channel transport |
| 0.9 | 10.4 | REACTOME SEROTONIN RECEPTORS | Genes involved in Serotonin receptors |
| 0.9 | 0.9 | REACTOME CONVERSION FROM APC C CDC20 TO APC C CDH1 IN LATE ANAPHASE | Genes involved in Conversion from APC/C:Cdc20 to APC/C:Cdh1 in late anaphase |
| 0.9 | 9.6 | REACTOME HIGHLY CALCIUM PERMEABLE POSTSYNAPTIC NICOTINIC ACETYLCHOLINE RECEPTORS | Genes involved in Highly calcium permeable postsynaptic nicotinic acetylcholine receptors |
| 0.8 | 15.4 | REACTOME RNA POL III TRANSCRIPTION TERMINATION | Genes involved in RNA Polymerase III Transcription Termination |
| 0.8 | 7.0 | REACTOME DOWNREGULATION OF ERBB2 ERBB3 SIGNALING | Genes involved in Downregulation of ERBB2:ERBB3 signaling |
| 0.7 | 3.0 | REACTOME BINDING AND ENTRY OF HIV VIRION | Genes involved in Binding and entry of HIV virion |
| 0.7 | 31.7 | REACTOME VOLTAGE GATED POTASSIUM CHANNELS | Genes involved in Voltage gated Potassium channels |
| 0.7 | 2.8 | REACTOME DOPAMINE NEUROTRANSMITTER RELEASE CYCLE | Genes involved in Dopamine Neurotransmitter Release Cycle |
| 0.7 | 8.2 | REACTOME CS DS DEGRADATION | Genes involved in CS/DS degradation |
| 0.6 | 0.6 | REACTOME CREB PHOSPHORYLATION THROUGH THE ACTIVATION OF CAMKII | Genes involved in CREB phosphorylation through the activation of CaMKII |
| 0.6 | 10.7 | REACTOME INTERACTION BETWEEN L1 AND ANKYRINS | Genes involved in Interaction between L1 and Ankyrins |
| 0.6 | 2.5 | REACTOME FGFR1 LIGAND BINDING AND ACTIVATION | Genes involved in FGFR1 ligand binding and activation |
| 0.6 | 11.1 | REACTOME A TETRASACCHARIDE LINKER SEQUENCE IS REQUIRED FOR GAG SYNTHESIS | Genes involved in A tetrasaccharide linker sequence is required for GAG synthesis |
| 0.6 | 7.7 | REACTOME NCAM SIGNALING FOR NEURITE OUT GROWTH | Genes involved in NCAM signaling for neurite out-growth |
| 0.6 | 10.6 | REACTOME HS GAG BIOSYNTHESIS | Genes involved in HS-GAG biosynthesis |
| 0.6 | 2.9 | REACTOME SPRY REGULATION OF FGF SIGNALING | Genes involved in Spry regulation of FGF signaling |
| 0.6 | 0.6 | REACTOME INHIBITION OF INSULIN SECRETION BY ADRENALINE NORADRENALINE | Genes involved in Inhibition of Insulin Secretion by Adrenaline/Noradrenaline |
| 0.4 | 3.3 | REACTOME TRANSPORT OF ORGANIC ANIONS | Genes involved in Transport of organic anions |
| 0.4 | 7.7 | REACTOME TRAFFICKING OF AMPA RECEPTORS | Genes involved in Trafficking of AMPA receptors |
| 0.4 | 2.8 | REACTOME G PROTEIN ACTIVATION | Genes involved in G-protein activation |
| 0.4 | 5.8 | REACTOME PRE NOTCH PROCESSING IN GOLGI | Genes involved in Pre-NOTCH Processing in Golgi |
| 0.4 | 16.3 | REACTOME AMINO ACID AND OLIGOPEPTIDE SLC TRANSPORTERS | Genes involved in Amino acid and oligopeptide SLC transporters |
| 0.3 | 3.4 | REACTOME ALPHA LINOLENIC ACID ALA METABOLISM | Genes involved in alpha-linolenic acid (ALA) metabolism |
| 0.3 | 12.7 | REACTOME L1CAM INTERACTIONS | Genes involved in L1CAM interactions |
| 0.3 | 3.5 | REACTOME ACTIVATION OF NMDA RECEPTOR UPON GLUTAMATE BINDING AND POSTSYNAPTIC EVENTS | Genes involved in Activation of NMDA receptor upon glutamate binding and postsynaptic events |
| 0.3 | 2.5 | REACTOME G ALPHA Z SIGNALLING EVENTS | Genes involved in G alpha (z) signalling events |
| 0.3 | 3.2 | REACTOME INHIBITION OF VOLTAGE GATED CA2 CHANNELS VIA GBETA GAMMA SUBUNITS | Genes involved in Inhibition of voltage gated Ca2+ channels via Gbeta/gamma subunits |
| 0.3 | 3.4 | REACTOME TANDEM PORE DOMAIN POTASSIUM CHANNELS | Genes involved in Tandem pore domain potassium channels |
| 0.3 | 3.3 | REACTOME VITAMIN B5 PANTOTHENATE METABOLISM | Genes involved in Vitamin B5 (pantothenate) metabolism |
| 0.3 | 5.0 | REACTOME BRANCHED CHAIN AMINO ACID CATABOLISM | Genes involved in Branched-chain amino acid catabolism |
| 0.3 | 0.3 | REACTOME REMOVAL OF THE FLAP INTERMEDIATE FROM THE C STRAND | Genes involved in Removal of the Flap Intermediate from the C-strand |
| 0.3 | 3.9 | REACTOME REGULATION OF GENE EXPRESSION IN BETA CELLS | Genes involved in Regulation of gene expression in beta cells |
| 0.3 | 1.3 | REACTOME ERKS ARE INACTIVATED | Genes involved in ERKs are inactivated |
| 0.2 | 0.7 | REACTOME SIGNALLING TO P38 VIA RIT AND RIN | Genes involved in Signalling to p38 via RIT and RIN |
| 0.2 | 4.6 | REACTOME SIGNALING BY HIPPO | Genes involved in Signaling by Hippo |
| 0.2 | 3.4 | REACTOME INSULIN SYNTHESIS AND PROCESSING | Genes involved in Insulin Synthesis and Processing |
| 0.2 | 1.1 | REACTOME ROLE OF DCC IN REGULATING APOPTOSIS | Genes involved in Role of DCC in regulating apoptosis |
| 0.2 | 2.0 | REACTOME TRYPTOPHAN CATABOLISM | Genes involved in Tryptophan catabolism |
| 0.2 | 1.8 | REACTOME AKT PHOSPHORYLATES TARGETS IN THE CYTOSOL | Genes involved in AKT phosphorylates targets in the cytosol |
| 0.2 | 0.6 | REACTOME REGULATED PROTEOLYSIS OF P75NTR | Genes involved in Regulated proteolysis of p75NTR |
| 0.2 | 1.9 | REACTOME RECRUITMENT OF NUMA TO MITOTIC CENTROSOMES | Genes involved in Recruitment of NuMA to mitotic centrosomes |
| 0.2 | 4.9 | REACTOME TRANSMISSION ACROSS CHEMICAL SYNAPSES | Genes involved in Transmission across Chemical Synapses |
| 0.2 | 0.6 | REACTOME RETROGRADE NEUROTROPHIN SIGNALLING | Genes involved in Retrograde neurotrophin signalling |
| 0.2 | 31.4 | REACTOME PEPTIDE LIGAND BINDING RECEPTORS | Genes involved in Peptide ligand-binding receptors |
| 0.2 | 0.4 | REACTOME INFLUENZA VIRAL RNA TRANSCRIPTION AND REPLICATION | Genes involved in Influenza Viral RNA Transcription and Replication |
| 0.2 | 0.2 | REACTOME TRIGLYCERIDE BIOSYNTHESIS | Genes involved in Triglyceride Biosynthesis |
| 0.2 | 1.2 | REACTOME NA CL DEPENDENT NEUROTRANSMITTER TRANSPORTERS | Genes involved in Na+/Cl- dependent neurotransmitter transporters |
| 0.2 | 4.3 | REACTOME NITRIC OXIDE STIMULATES GUANYLATE CYCLASE | Genes involved in Nitric oxide stimulates guanylate cyclase |
| 0.2 | 2.5 | REACTOME EFFECTS OF PIP2 HYDROLYSIS | Genes involved in Effects of PIP2 hydrolysis |
| 0.2 | 1.6 | REACTOME REGULATION OF INSULIN SECRETION BY ACETYLCHOLINE | Genes involved in Regulation of Insulin Secretion by Acetylcholine |
| 0.2 | 2.4 | REACTOME POTASSIUM CHANNELS | Genes involved in Potassium Channels |
| 0.2 | 1.2 | REACTOME P38MAPK EVENTS | Genes involved in p38MAPK events |
| 0.2 | 2.5 | REACTOME ABCA TRANSPORTERS IN LIPID HOMEOSTASIS | Genes involved in ABCA transporters in lipid homeostasis |
| 0.2 | 7.4 | REACTOME G ALPHA I SIGNALLING EVENTS | Genes involved in G alpha (i) signalling events |
| 0.2 | 3.3 | REACTOME CHOLESTEROL BIOSYNTHESIS | Genes involved in Cholesterol biosynthesis |
| 0.2 | 0.5 | REACTOME BILE ACID AND BILE SALT METABOLISM | Genes involved in Bile acid and bile salt metabolism |
| 0.2 | 1.6 | REACTOME RAP1 SIGNALLING | Genes involved in Rap1 signalling |
| 0.2 | 4.0 | REACTOME REGULATION OF GLUCOKINASE BY GLUCOKINASE REGULATORY PROTEIN | Genes involved in Regulation of Glucokinase by Glucokinase Regulatory Protein |
| 0.2 | 1.1 | REACTOME CREATION OF C4 AND C2 ACTIVATORS | Genes involved in Creation of C4 and C2 activators |
| 0.2 | 0.8 | REACTOME ABACAVIR TRANSPORT AND METABOLISM | Genes involved in Abacavir transport and metabolism |
| 0.1 | 1.3 | REACTOME EGFR DOWNREGULATION | Genes involved in EGFR downregulation |
| 0.1 | 1.5 | REACTOME ABC FAMILY PROTEINS MEDIATED TRANSPORT | Genes involved in ABC-family proteins mediated transport |
| 0.1 | 0.3 | REACTOME NOREPINEPHRINE NEUROTRANSMITTER RELEASE CYCLE | Genes involved in Norepinephrine Neurotransmitter Release Cycle |
| 0.1 | 0.1 | REACTOME NFKB ACTIVATION THROUGH FADD RIP1 PATHWAY MEDIATED BY CASPASE 8 AND10 | Genes involved in NF-kB activation through FADD/RIP-1 pathway mediated by caspase-8 and -10 |
| 0.1 | 9.1 | REACTOME CLASS B 2 SECRETIN FAMILY RECEPTORS | Genes involved in Class B/2 (Secretin family receptors) |
| 0.1 | 0.4 | REACTOME INITIAL TRIGGERING OF COMPLEMENT | Genes involved in Initial triggering of complement |
| 0.1 | 0.1 | REACTOME NEF MEDIATED DOWNREGULATION OF MHC CLASS I COMPLEX CELL SURFACE EXPRESSION | Genes involved in Nef mediated downregulation of MHC class I complex cell surface expression |
| 0.1 | 0.6 | REACTOME REGULATION OF BETA CELL DEVELOPMENT | Genes involved in Regulation of beta-cell development |
| 0.1 | 0.9 | REACTOME VIRAL MESSENGER RNA SYNTHESIS | Genes involved in Viral Messenger RNA Synthesis |
| 0.1 | 0.2 | REACTOME SOS MEDIATED SIGNALLING | Genes involved in SOS-mediated signalling |
| 0.1 | 0.4 | REACTOME REGULATION OF KIT SIGNALING | Genes involved in Regulation of KIT signaling |
| 0.1 | 0.1 | REACTOME FGFR4 LIGAND BINDING AND ACTIVATION | Genes involved in FGFR4 ligand binding and activation |
| 0.1 | 1.2 | REACTOME SYNTHESIS OF SUBSTRATES IN N GLYCAN BIOSYTHESIS | Genes involved in Synthesis of substrates in N-glycan biosythesis |
| 0.1 | 0.8 | REACTOME SYNTHESIS OF PIPS AT THE LATE ENDOSOME MEMBRANE | Genes involved in Synthesis of PIPs at the late endosome membrane |
| 0.1 | 1.6 | REACTOME SIGNALING BY BMP | Genes involved in Signaling by BMP |
| 0.1 | 0.6 | REACTOME COPI MEDIATED TRANSPORT | Genes involved in COPI Mediated Transport |
| 0.1 | 0.3 | REACTOME REGULATION OF INSULIN SECRETION | Genes involved in Regulation of Insulin Secretion |
| 0.1 | 0.5 | REACTOME CTNNB1 PHOSPHORYLATION CASCADE | Genes involved in Beta-catenin phosphorylation cascade |
| 0.1 | 0.1 | REACTOME MRNA DECAY BY 3 TO 5 EXORIBONUCLEASE | Genes involved in mRNA Decay by 3' to 5' Exoribonuclease |
| 0.0 | 0.8 | REACTOME ENDOSOMAL SORTING COMPLEX REQUIRED FOR TRANSPORT ESCRT | Genes involved in Endosomal Sorting Complex Required For Transport (ESCRT) |
| 0.0 | 0.8 | REACTOME TRANSPORT OF VITAMINS NUCLEOSIDES AND RELATED MOLECULES | Genes involved in Transport of vitamins, nucleosides, and related molecules |
| 0.0 | 0.5 | REACTOME DESTABILIZATION OF MRNA BY KSRP | Genes involved in Destabilization of mRNA by KSRP |
| 0.0 | 0.7 | REACTOME RNA POL I TRANSCRIPTION INITIATION | Genes involved in RNA Polymerase I Transcription Initiation |
| 0.0 | 0.4 | REACTOME SIGNALING BY FGFR3 MUTANTS | Genes involved in Signaling by FGFR3 mutants |
| 0.0 | 0.8 | REACTOME DEGRADATION OF THE EXTRACELLULAR MATRIX | Genes involved in Degradation of the extracellular matrix |
| 0.0 | 0.2 | REACTOME TRANSPORT OF MATURE MRNA DERIVED FROM AN INTRONLESS TRANSCRIPT | Genes involved in Transport of Mature mRNA Derived from an Intronless Transcript |
| 0.0 | 0.1 | REACTOME SEMA3A PLEXIN REPULSION SIGNALING BY INHIBITING INTEGRIN ADHESION | Genes involved in SEMA3A-Plexin repulsion signaling by inhibiting Integrin adhesion |
| 0.0 | 0.6 | REACTOME CYTOCHROME P450 ARRANGED BY SUBSTRATE TYPE | Genes involved in Cytochrome P450 - arranged by substrate type |
| 0.0 | 0.1 | REACTOME SEMA3A PAK DEPENDENT AXON REPULSION | Genes involved in Sema3A PAK dependent Axon repulsion |
| 0.0 | 0.2 | REACTOME ORGANIC CATION ANION ZWITTERION TRANSPORT | Genes involved in Organic cation/anion/zwitterion transport |
| 0.0 | 0.1 | REACTOME IRAK1 RECRUITS IKK COMPLEX | Genes involved in IRAK1 recruits IKK complex |