Project
ENCODE: H3K4me1 ChIP-Seq of primary human cells
Navigation
Downloads

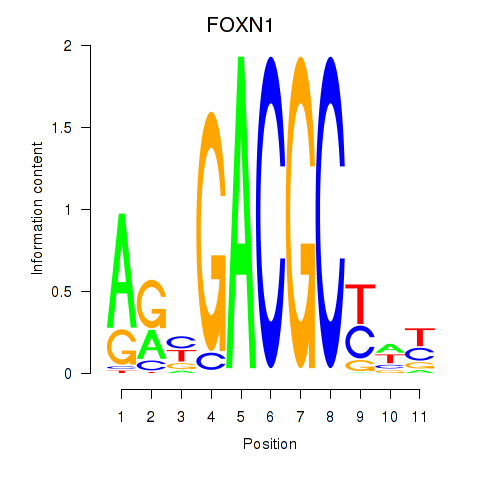
Results for FOXN1
Z-value: 4.65
Motif logo
Transcription factors associated with FOXN1
| Gene Symbol | Gene ID | Gene Info |
|---|---|---|
|
FOXN1
|
ENSG00000109101.3 | forkhead box N1 |
Correlations of motif activity and signal intensity at CREs associated with the motif's TFs:
This plot shows correlation between observed signal intensity of a CRE associated with the transcription factor across all samples and activity of the motif.
For each TF, only the top 5 correlated CREs are shown.
| CRE | Gene | Distance | Association probability | Pearson corr. coef. | P-value | Plot |
|---|---|---|---|---|---|---|
| chr17_26837102_26837253 | FOXN1 | 3899 | 0.121284 | 0.38 | 3.1e-01 | Click! |
| chr17_26846701_26846852 | FOXN1 | 4183 | 0.113017 | 0.36 | 3.4e-01 | Click! |
| chr17_26832603_26832754 | FOXN1 | 583 | 0.592674 | 0.34 | 3.8e-01 | Click! |
| chr17_26837711_26837862 | FOXN1 | 4508 | 0.114688 | 0.30 | 4.3e-01 | Click! |
| chr17_26832783_26832934 | FOXN1 | 403 | 0.733010 | 0.29 | 4.4e-01 | Click! |
Activity of the FOXN1 motif across conditions
Conditions sorted by the z-value of the FOXN1 motif activity
Move your cursor over a bar to see sample name and corresponding Z-value.
Top target CREs of the motif:
| Cis Regulatory Element (CRE) | Target Score | Top associated gene | Gene Info | Distance of CRE to TSS | CRE/Gene association probability |
|---|---|---|---|---|---|
| chr9_102584698_102584849 | 1.76 |
NR4A3 |
nuclear receptor subfamily 4, group A, member 3 |
636 |
0.8 |
| chr15_91362346_91362739 | 1.74 |
CTD-3094K11.1 |
|
20412 |
0.12 |
| chr17_800175_800326 | 1.65 |
RP11-676J12.7 |
Uncharacterized protein |
12622 |
0.15 |
| chr17_43226129_43226446 | 1.64 |
HEXIM1 |
hexamethylene bis-acetamide inducible 1 |
1603 |
0.22 |
| chr21_34961114_34961265 | 1.63 |
DONSON |
downstream neighbor of SON |
175 |
0.93 |
| chr6_3157097_3157483 | 1.47 |
TUBB2A |
tubulin, beta 2A class IIa |
470 |
0.75 |
| chr1_160231794_160231945 | 1.40 |
DCAF8 |
DDB1 and CUL4 associated factor 8 |
277 |
0.53 |
| chr7_66205180_66205331 | 1.30 |
RP11-792A8.4 |
|
117 |
0.71 |
| chr6_4135230_4135381 | 1.19 |
RP3-400B16.4 |
|
352 |
0.51 |
| chr2_237993953_237994237 | 1.18 |
COPS8 |
COP9 signalosome subunit 8 |
140 |
0.76 |
| chr17_61501159_61501310 | 1.16 |
RP11-269G24.3 |
|
7216 |
0.13 |
| chr17_74575257_74575550 | 1.14 |
ST6GALNAC2 |
ST6 (alpha-N-acetyl-neuraminyl-2,3-beta-galactosyl-1,3)-N-acetylgalactosaminide alpha-2,6-sialyltransferase 2 |
5972 |
0.09 |
| chr8_121823593_121823797 | 1.13 |
SNTB1 |
syntrophin, beta 1 (dystrophin-associated protein A1, 59kDa, basic component 1) |
688 |
0.48 |
| chr3_43333762_43334073 | 1.12 |
SNRK |
SNF related kinase |
5839 |
0.2 |
| chr3_124774161_124774336 | 1.12 |
HEG1 |
heart development protein with EGF-like domains 1 |
554 |
0.75 |
| chr21_44835236_44835488 | 1.08 |
SIK1 |
salt-inducible kinase 1 |
11646 |
0.28 |
| chr21_44465151_44465302 | 1.07 |
CBS |
cystathionine-beta-synthase |
13825 |
0.18 |
| chr15_101458785_101459009 | 1.07 |
RP11-66B24.4 |
|
149 |
0.84 |
| chr20_4741559_4741710 | 1.05 |
PRNT |
prion protein (testis specific) |
20320 |
0.18 |
| chr11_65315197_65315463 | 1.04 |
LTBP3 |
latent transforming growth factor beta binding protein 3 |
294 |
0.79 |
| chr18_48404897_48405048 | 1.03 |
ME2 |
malic enzyme 2, NAD(+)-dependent, mitochondrial |
447 |
0.86 |
| chr15_53083415_53083566 | 1.03 |
ONECUT1 |
one cut homeobox 1 |
1281 |
0.59 |
| chr14_36975319_36975470 | 1.02 |
SFTA3 |
surfactant associated 3 |
7640 |
0.17 |
| chr10_124907717_124907868 | 1.01 |
HMX2 |
H6 family homeobox 2 |
154 |
0.95 |
| chr11_128391305_128391456 | 1.01 |
ETS1 |
v-ets avian erythroblastosis virus E26 oncogene homolog 1 |
716 |
0.72 |
| chr14_22697705_22698246 | 1.00 |
ENSG00000238634 |
. |
87088 |
0.08 |
| chr13_24153750_24153949 | 1.00 |
TNFRSF19 |
tumor necrosis factor receptor superfamily, member 19 |
330 |
0.93 |
| chr13_99621783_99621951 | 1.00 |
DOCK9 |
dedicator of cytokinesis 9 |
8377 |
0.25 |
| chr3_50640783_50640934 | 0.99 |
CISH |
cytokine inducible SH2-containing protein |
8345 |
0.14 |
| chr9_137000845_137000996 | 0.97 |
LL09NC01-251B2.3 |
|
26 |
0.81 |
| chr4_8207301_8207498 | 0.96 |
SH3TC1 |
SH3 domain and tetratricopeptide repeats 1 |
6301 |
0.24 |
| chr1_1676155_1676333 | 0.96 |
SLC35E2 |
solute carrier family 35, member E2 |
1114 |
0.38 |
| chr3_97541648_97541897 | 0.96 |
CRYBG3 |
Beta/gamma crystallin domain-containing protein 3; cDNA FLJ60082, weakly similar to Uro-adherence factor A |
888 |
0.66 |
| chr17_79360953_79361175 | 0.95 |
RP11-1055B8.6 |
Uncharacterized protein |
8211 |
0.12 |
| chr7_139337970_139338121 | 0.95 |
HIPK2 |
homeodomain interacting protein kinase 2 |
83796 |
0.09 |
| chr7_123389369_123389520 | 0.95 |
RP11-390E23.6 |
|
322 |
0.48 |
| chr2_218990600_218990775 | 0.94 |
CXCR2 |
chemokine (C-X-C motif) receptor 2 |
40 |
0.97 |
| chr16_2522994_2523145 | 0.93 |
NTN3 |
netrin 3 |
1569 |
0.15 |
| chr3_156534966_156535117 | 0.93 |
LEKR1 |
leucine, glutamate and lysine rich 1 |
9048 |
0.29 |
| chr21_42688413_42688564 | 0.92 |
FAM3B |
family with sequence similarity 3, member B |
173 |
0.96 |
| chr2_73430491_73430710 | 0.92 |
NOTO |
notochord homeobox |
1214 |
0.39 |
| chr11_1860503_1860654 | 0.92 |
TNNI2 |
troponin I type 2 (skeletal, fast) |
133 |
0.92 |
| chr17_45918180_45918331 | 0.90 |
SCRN2 |
secernin 2 |
284 |
0.83 |
| chr10_70715965_70716116 | 0.90 |
DDX21 |
DEAD (Asp-Glu-Ala-Asp) box helicase 21 |
156 |
0.94 |
| chr14_102228690_102228847 | 0.90 |
PPP2R5C |
protein phosphatase 2, regulatory subunit B', gamma |
497 |
0.78 |
| chr17_2285977_2286170 | 0.88 |
RP1-59D14.1 |
|
2068 |
0.18 |
| chr1_40405965_40406116 | 0.88 |
ENSG00000207356 |
. |
4630 |
0.16 |
| chr21_43955250_43955401 | 0.88 |
SLC37A1 |
solute carrier family 37 (glucose-6-phosphate transporter), member 1 |
20691 |
0.12 |
| chr5_25151608_25151759 | 0.88 |
ENSG00000199911 |
. |
240980 |
0.02 |
| chr17_18279794_18279945 | 0.88 |
EVPLL |
envoplakin-like |
1107 |
0.37 |
| chr11_61582951_61583102 | 0.88 |
FADS1 |
fatty acid desaturase 1 |
263 |
0.48 |
| chr1_51444191_51444397 | 0.88 |
CDKN2C |
cyclin-dependent kinase inhibitor 2C (p18, inhibits CDK4) |
8678 |
0.21 |
| chr16_28610469_28610859 | 0.87 |
SULT1A2 |
sulfotransferase family, cytosolic, 1A, phenol-preferring, member 2 |
2234 |
0.2 |
| chr15_37390143_37390314 | 0.87 |
MEIS2 |
Meis homeobox 2 |
275 |
0.88 |
| chr2_114513647_114513798 | 0.87 |
SLC35F5 |
solute carrier family 35, member F5 |
475 |
0.83 |
| chr9_99382070_99382259 | 0.87 |
CDC14B |
cell division cycle 14B |
52 |
0.98 |
| chr2_234156250_234156494 | 0.86 |
ATG16L1 |
autophagy related 16-like 1 (S. cerevisiae) |
3845 |
0.18 |
| chr10_105155577_105155899 | 0.86 |
USMG5 |
up-regulated during skeletal muscle growth 5 homolog (mouse) |
42 |
0.9 |
| chr14_95234863_95235014 | 0.86 |
GSC |
goosecoid homeobox |
1624 |
0.5 |
| chr17_38210368_38210547 | 0.85 |
MED24 |
mediator complex subunit 24 |
112 |
0.94 |
| chr1_27648374_27648659 | 0.85 |
TMEM222 |
transmembrane protein 222 |
135 |
0.93 |
| chr21_46326720_46326888 | 0.85 |
ITGB2 |
integrin, beta 2 (complement component 3 receptor 3 and 4 subunit) |
3741 |
0.14 |
| chr4_186346540_186346790 | 0.84 |
UFSP2 |
UFM1-specific peptidase 2 |
467 |
0.56 |
| chr11_44327750_44327904 | 0.84 |
ALX4 |
ALX homeobox 4 |
3889 |
0.35 |
| chr2_99386231_99386655 | 0.83 |
ENSG00000201070 |
. |
12430 |
0.21 |
| chr10_50322865_50323092 | 0.83 |
VSTM4 |
V-set and transmembrane domain containing 4 |
576 |
0.72 |
| chr2_31437595_31437746 | 0.83 |
CAPN14 |
calpain 14 |
2741 |
0.27 |
| chr14_55737756_55737907 | 0.83 |
FBXO34 |
F-box protein 34 |
190 |
0.96 |
| chr17_2951853_2952069 | 0.83 |
OR1D5 |
olfactory receptor, family 1, subfamily D, member 5 |
14940 |
0.19 |
| chr1_27440324_27440475 | 0.83 |
SLC9A1 |
solute carrier family 9, subfamily A (NHE1, cation proton antiporter 1), member 1 |
40574 |
0.14 |
| chr11_128496320_128496471 | 0.82 |
ETS1 |
v-ets avian erythroblastosis virus E26 oncogene homolog 1 |
38942 |
0.15 |
| chr16_50308613_50308764 | 0.82 |
ADCY7 |
adenylate cyclase 7 |
624 |
0.75 |
| chr21_34392559_34392759 | 0.82 |
OLIG2 |
oligodendrocyte lineage transcription factor 2 |
5494 |
0.22 |
| chr11_208375_208536 | 0.82 |
RIC8A |
RIC8 guanine nucleotide exchange factor A |
75 |
0.91 |
| chr14_107081949_107082270 | 0.82 |
IGHV4-59 |
immunoglobulin heavy variable 4-59 |
1616 |
0.09 |
| chr22_19962677_19962998 | 0.82 |
ENSG00000265087 |
. |
11561 |
0.11 |
| chr2_97628467_97628722 | 0.82 |
ENSG00000252845 |
. |
6042 |
0.16 |
| chr15_68112770_68112921 | 0.82 |
SKOR1 |
SKI family transcriptional corepressor 1 |
803 |
0.71 |
| chr3_9216538_9216718 | 0.81 |
SRGAP3-AS2 |
SRGAP3 antisense RNA 2 |
17549 |
0.2 |
| chrX_140270937_140271214 | 0.81 |
LDOC1 |
leucine zipper, down-regulated in cancer 1 |
235 |
0.93 |
| chrX_119621897_119622082 | 0.81 |
LAMP2 |
lysosomal-associated membrane protein 2 |
18769 |
0.2 |
| chr17_77755192_77755343 | 0.81 |
CBX2 |
chromobox homolog 2 |
3274 |
0.17 |
| chr16_28623430_28623856 | 0.81 |
SULT1A1 |
sulfotransferase family, cytosolic, 1A, phenol-preferring, member 1 |
2290 |
0.2 |
| chr6_109775900_109776051 | 0.80 |
MICAL1 |
microtubule associated monooxygenase, calponin and LIM domain containing 1 |
950 |
0.41 |
| chr2_131130075_131130226 | 0.80 |
PTPN18 |
protein tyrosine phosphatase, non-receptor type 18 (brain-derived) |
2488 |
0.23 |
| chr11_121315365_121315516 | 0.80 |
SORL1 |
sortilin-related receptor, L(DLR class) A repeats containing |
7472 |
0.25 |
| chr16_4783738_4784014 | 0.80 |
ANKS3 |
ankyrin repeat and sterile alpha motif domain containing 3 |
252 |
0.62 |
| chr2_157190038_157190421 | 0.80 |
NR4A2 |
nuclear receptor subfamily 4, group A, member 2 |
997 |
0.66 |
| chr4_154266363_154266729 | 0.79 |
MND1 |
meiotic nuclear divisions 1 homolog (S. cerevisiae) |
41 |
0.98 |
| chr12_59313350_59313562 | 0.79 |
LRIG3 |
leucine-rich repeats and immunoglobulin-like domains 3 |
129 |
0.94 |
| chr19_11159205_11159728 | 0.79 |
SMARCA4 |
SWI/SNF related, matrix associated, actin dependent regulator of chromatin, subfamily a, member 4 |
10045 |
0.14 |
| chr11_45102115_45102358 | 0.79 |
PRDM11 |
PR domain containing 11 |
13328 |
0.27 |
| chr1_165600943_165601210 | 0.79 |
MGST3 |
microsomal glutathione S-transferase 3 |
224 |
0.93 |
| chr11_46372788_46373189 | 0.78 |
DGKZ |
diacylglycerol kinase, zeta |
3850 |
0.17 |
| chr1_95391480_95391692 | 0.78 |
CNN3 |
calponin 3, acidic |
229 |
0.91 |
| chr19_18248422_18248644 | 0.77 |
AC007192.6 |
|
13968 |
0.11 |
| chr6_114180823_114180974 | 0.77 |
MARCKS |
myristoylated alanine-rich protein kinase C substrate |
2357 |
0.29 |
| chr3_55520600_55520901 | 0.77 |
WNT5A |
wingless-type MMTV integration site family, member 5A |
581 |
0.64 |
| chr12_123412300_123412568 | 0.77 |
ABCB9 |
ATP-binding cassette, sub-family B (MDR/TAP), member 9 |
16785 |
0.14 |
| chr12_104457934_104458118 | 0.77 |
GLT8D2 |
glycosyltransferase 8 domain containing 2 |
65 |
0.7 |
| chr13_95364593_95364805 | 0.76 |
SOX21 |
SRY (sex determining region Y)-box 21 |
310 |
0.91 |
| chr10_126409739_126410264 | 0.76 |
FAM53B-AS1 |
FAM53B antisense RNA 1 |
17248 |
0.16 |
| chr19_13262303_13262467 | 0.76 |
IER2 |
immediate early response 2 |
404 |
0.65 |
| chr19_7694936_7695265 | 0.76 |
PET100 |
PET100 homolog (S. cerevisiae) |
390 |
0.54 |
| chr2_103236396_103236730 | 0.76 |
SLC9A2 |
solute carrier family 9, subfamily A (NHE2, cation proton antiporter 2), member 2 |
397 |
0.9 |
| chr2_225265952_225266240 | 0.76 |
FAM124B |
family with sequence similarity 124B |
615 |
0.84 |
| chr2_74667234_74667385 | 0.76 |
RTKN |
rhotekin |
401 |
0.65 |
| chr6_91182704_91182871 | 0.76 |
ENSG00000252676 |
. |
26296 |
0.24 |
| chr22_42311261_42311449 | 0.76 |
SHISA8 |
shisa family member 8 |
785 |
0.45 |
| chr15_71185021_71185318 | 0.76 |
LRRC49 |
leucine rich repeat containing 49 |
2 |
0.52 |
| chr17_72739147_72739312 | 0.76 |
ENSG00000264624 |
. |
5523 |
0.1 |
| chr2_96813991_96814178 | 0.75 |
DUSP2 |
dual specificity phosphatase 2 |
2905 |
0.21 |
| chr8_26436806_26437089 | 0.75 |
DPYSL2 |
dihydropyrimidinase-like 2 |
1026 |
0.65 |
| chr11_75521610_75521761 | 0.75 |
RP11-535A19.2 |
|
928 |
0.39 |
| chr21_43484991_43485360 | 0.75 |
UMODL1 |
uromodulin-like 1 |
2107 |
0.33 |
| chr7_75623659_75623810 | 0.75 |
POR |
P450 (cytochrome) oxidoreductase |
12505 |
0.16 |
| chr4_8429504_8429738 | 0.75 |
ACOX3 |
acyl-CoA oxidase 3, pristanoyl |
567 |
0.74 |
| chr10_70661536_70661740 | 0.75 |
DDX50 |
DEAD (Asp-Glu-Ala-Asp) box polypeptide 50 |
604 |
0.68 |
| chr12_120540943_120541229 | 0.75 |
RAB35 |
RAB35, member RAS oncogene family |
4192 |
0.18 |
| chr2_202507689_202507877 | 0.74 |
TMEM237 |
transmembrane protein 237 |
116 |
0.96 |
| chr19_18700105_18700256 | 0.74 |
C19orf60 |
chromosome 19 open reading frame 60 |
232 |
0.84 |
| chr9_31590126_31590277 | 0.74 |
ENSG00000252313 |
. |
703355 |
0.0 |
| chr20_24797843_24797994 | 0.74 |
CST7 |
cystatin F (leukocystatin) |
131948 |
0.05 |
| chr1_206832161_206832323 | 0.74 |
ENSG00000252853 |
. |
23066 |
0.12 |
| chr14_86414082_86414233 | 0.73 |
FLRT2 |
fibronectin leucine rich transmembrane protein 2 |
417585 |
0.01 |
| chrX_20432142_20432293 | 0.73 |
ENSG00000252978 |
. |
38009 |
0.22 |
| chr12_7341730_7341934 | 0.73 |
PEX5 |
peroxisomal biogenesis factor 5 |
23 |
0.67 |
| chr6_163834276_163834427 | 0.73 |
QKI |
QKI, KH domain containing, RNA binding |
1324 |
0.62 |
| chrX_45709048_45709199 | 0.73 |
ENSG00000212347 |
. |
43291 |
0.19 |
| chr1_180123457_180123608 | 0.73 |
QSOX1 |
quiescin Q6 sulfhydryl oxidase 1 |
437 |
0.87 |
| chr8_97247125_97247276 | 0.73 |
KB-1043D8.6 |
|
455 |
0.53 |
| chr6_2764785_2765175 | 0.73 |
WRNIP1 |
Werner helicase interacting protein 1 |
668 |
0.72 |
| chr12_31742796_31743019 | 0.73 |
DENND5B-AS1 |
DENND5B antisense RNA 1 |
50 |
0.88 |
| chr2_101033502_101033667 | 0.72 |
CHST10 |
carbohydrate sulfotransferase 10 |
65 |
0.98 |
| chr9_91997865_91998016 | 0.72 |
SEMA4D |
sema domain, immunoglobulin domain (Ig), transmembrane domain (TM) and short cytoplasmic domain, (semaphorin) 4D |
18374 |
0.2 |
| chr15_45996900_45997071 | 0.72 |
SQRDL |
sulfide quinone reductase-like (yeast) |
22247 |
0.21 |
| chr16_89418745_89419012 | 0.72 |
ANKRD11 |
ankyrin repeat domain 11 |
23484 |
0.12 |
| chr2_87018214_87018524 | 0.72 |
CD8A |
CD8a molecule |
351 |
0.88 |
| chr1_231663729_231664017 | 0.72 |
RP11-295G20.2 |
|
128 |
0.86 |
| chr1_6055068_6055219 | 0.71 |
KCNAB2 |
potassium voltage-gated channel, shaker-related subfamily, beta member 2 |
2372 |
0.25 |
| chr6_135507007_135507309 | 0.71 |
MYB |
v-myb avian myeloblastosis viral oncogene homolog |
2 |
0.98 |
| chr17_79895408_79895582 | 0.71 |
PYCR1 |
pyrroline-5-carboxylate reductase 1 |
43 |
0.91 |
| chr7_66146609_66146762 | 0.71 |
RP4-756H11.3 |
|
27112 |
0.16 |
| chr19_41699673_41699824 | 0.71 |
CYP2S1 |
cytochrome P450, family 2, subfamily S, polypeptide 1 |
596 |
0.62 |
| chr20_19948941_19949092 | 0.71 |
NAA20 |
N(alpha)-acetyltransferase 20, NatB catalytic subunit |
48744 |
0.14 |
| chr12_96337401_96337713 | 0.70 |
AMDHD1 |
amidohydrolase domain containing 1 |
486 |
0.59 |
| chr20_54934282_54934433 | 0.70 |
FAM210B |
family with sequence similarity 210, member B |
192 |
0.94 |
| chr10_22540636_22540794 | 0.70 |
EBLN1 |
endogenous Bornavirus-like nucleoprotein 1 |
41765 |
0.14 |
| chr19_50837512_50837663 | 0.70 |
KCNC3 |
potassium voltage-gated channel, Shaw-related subfamily, member 3 |
815 |
0.44 |
| chr17_42907747_42907965 | 0.70 |
GJC1 |
gap junction protein, gamma 1, 45kDa |
257 |
0.87 |
| chr5_1316168_1316416 | 0.70 |
ENSG00000263670 |
. |
6800 |
0.18 |
| chr3_16554171_16554353 | 0.70 |
RFTN1 |
raftlin, lipid raft linker 1 |
149 |
0.97 |
| chr18_74794512_74794972 | 0.69 |
MBP |
myelin basic protein |
22475 |
0.26 |
| chr12_75874791_75874942 | 0.69 |
GLIPR1 |
GLI pathogenesis-related 1 |
118 |
0.96 |
| chr1_43398456_43398646 | 0.69 |
SLC2A1 |
solute carrier family 2 (facilitated glucose transporter), member 1 |
1755 |
0.36 |
| chr4_140099443_140099664 | 0.69 |
ELF2 |
E74-like factor 2 (ets domain transcription factor) |
1181 |
0.4 |
| chr1_233750021_233750172 | 0.69 |
KCNK1 |
potassium channel, subfamily K, member 1 |
346 |
0.91 |
| chr12_8185648_8185799 | 0.69 |
FOXJ2 |
forkhead box J2 |
233 |
0.92 |
| chr1_54519584_54519762 | 0.69 |
ENSG00000264208 |
. |
79 |
0.54 |
| chr7_2549413_2549701 | 0.69 |
LFNG |
LFNG O-fucosylpeptide 3-beta-N-acetylglucosaminyltransferase |
2606 |
0.23 |
| chr20_61434081_61434232 | 0.69 |
OGFR |
opioid growth factor receptor |
2031 |
0.19 |
| chr1_52083477_52083692 | 0.68 |
OSBPL9 |
oxysterol binding protein-like 9 |
803 |
0.68 |
| chr2_111490410_111490604 | 0.68 |
ACOXL |
acyl-CoA oxidase-like |
75 |
0.98 |
| chr16_638518_638677 | 0.68 |
RAB40C |
RAB40C, member RAS oncogene family |
760 |
0.38 |
| chr6_38607899_38608192 | 0.68 |
BTBD9 |
BTB (POZ) domain containing 9 |
121 |
0.97 |
| chr10_131769782_131769953 | 0.68 |
EBF3 |
early B-cell factor 3 |
7762 |
0.31 |
| chr13_103940769_103940920 | 0.68 |
SLC10A2 |
solute carrier family 10 (sodium/bile acid cotransporter), member 2 |
221648 |
0.02 |
| chr12_109913998_109914427 | 0.67 |
KCTD10 |
potassium channel tetramerization domain containing 10 |
893 |
0.4 |
| chr17_74024551_74024731 | 0.67 |
EVPL |
envoplakin |
1108 |
0.35 |
| chr7_99541464_99541767 | 0.67 |
ENSG00000199711 |
. |
7382 |
0.09 |
| chr7_2934081_2934232 | 0.67 |
CARD11 |
caspase recruitment domain family, member 11 |
35538 |
0.16 |
| chr21_36260768_36260938 | 0.67 |
RUNX1 |
runt-related transcription factor 1 |
134 |
0.98 |
| chr6_168106428_168106653 | 0.67 |
AL009178.1 |
Uncharacterized protein; cDNA FLJ43200 fis, clone FEBRA2007793 |
89670 |
0.08 |
| chr7_134001891_134002042 | 0.67 |
SLC35B4 |
solute carrier family 35 (UDP-xylose/UDP-N-acetylglucosamine transporter), member B4 |
163 |
0.97 |
| chr16_29638484_29638656 | 0.67 |
ENSG00000266758 |
. |
27984 |
0.11 |
| chr3_123602766_123602927 | 0.67 |
MYLK |
myosin light chain kinase |
303 |
0.92 |
| chr15_58775122_58775281 | 0.67 |
ALDH1A2 |
aldehyde dehydrogenase 1 family, member A2 |
9089 |
0.18 |
| chr5_10634330_10634552 | 0.67 |
ANKRD33B-AS1 |
ANKRD33B antisense RNA 1 |
6104 |
0.26 |
| chr19_51870353_51870504 | 0.66 |
ETFB |
electron-transfer-flavoprotein, beta polypeptide |
756 |
0.28 |
| chr14_77843660_77843811 | 0.66 |
SAMD15 |
sterile alpha motif domain containing 15 |
259 |
0.5 |
| chr22_17579646_17580102 | 0.66 |
IL17RA |
interleukin 17 receptor A |
14025 |
0.15 |
| chr19_53360374_53360525 | 0.66 |
ZNF28 |
zinc finger protein 28 |
404 |
0.47 |
| chr13_24040755_24040906 | 0.66 |
SACS |
spastic ataxia of Charlevoix-Saguenay (sacsin) |
32989 |
0.22 |
| chr2_182522184_182522355 | 0.66 |
CERKL |
ceramide kinase-like |
435 |
0.84 |
| chr15_91105896_91106326 | 0.66 |
CRTC3 |
CREB regulated transcription coactivator 3 |
30834 |
0.14 |
| chr9_92449499_92449650 | 0.65 |
GADD45G |
growth arrest and DNA-damage-inducible, gamma |
229621 |
0.02 |
| chr12_121163902_121164053 | 0.65 |
ACADS |
acyl-CoA dehydrogenase, C-2 to C-3 short chain |
313 |
0.79 |
| chr9_4793446_4793597 | 0.65 |
RCL1 |
RNA terminal phosphate cyclase-like 1 |
541 |
0.77 |
| chr22_20791658_20791836 | 0.65 |
SCARF2 |
scavenger receptor class F, member 2 |
365 |
0.78 |
| chr2_109647371_109647603 | 0.65 |
EDAR |
ectodysplasin A receptor |
41659 |
0.19 |
| chr9_140168647_140168925 | 0.65 |
TOR4A |
torsin family 4, member A |
3415 |
0.09 |
| chr5_10734581_10734780 | 0.64 |
CTD-2154B17.4 |
|
26497 |
0.19 |
| chr6_88300020_88300171 | 0.64 |
ORC3 |
origin recognition complex, subunit 3 |
232 |
0.65 |
| chr3_187692256_187692598 | 0.64 |
LPP |
LIM domain containing preferred translocation partner in lipoma |
178645 |
0.03 |
| chr7_4764841_4764992 | 0.64 |
FOXK1 |
forkhead box K1 |
15574 |
0.18 |
| chr5_42951353_42951504 | 0.64 |
SEPP1 |
selenoprotein P, plasma, 1 |
63934 |
0.09 |
| chr3_142682236_142682387 | 0.64 |
PAQR9 |
progestin and adipoQ receptor family member IX |
133 |
0.82 |
| chr21_44597112_44597263 | 0.64 |
CRYAA |
crystallin, alpha A |
6921 |
0.17 |
| chr20_50098243_50098394 | 0.64 |
ENSG00000266761 |
. |
28804 |
0.21 |
| chr10_1088538_1088689 | 0.64 |
ENSG00000238924 |
. |
318 |
0.83 |
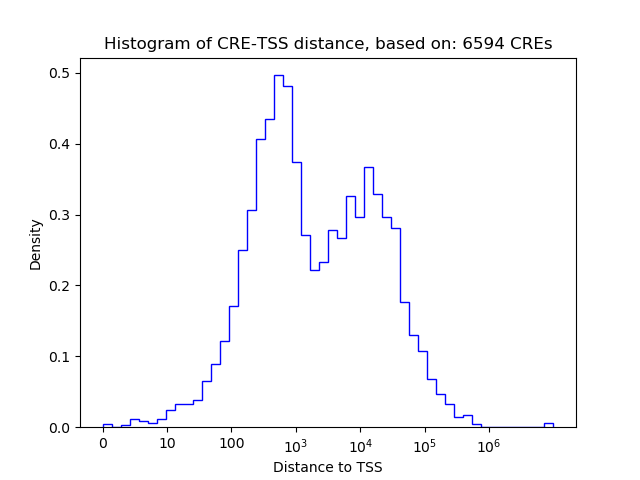
Histogram of CRE-TSS distances for CREs targeted by :
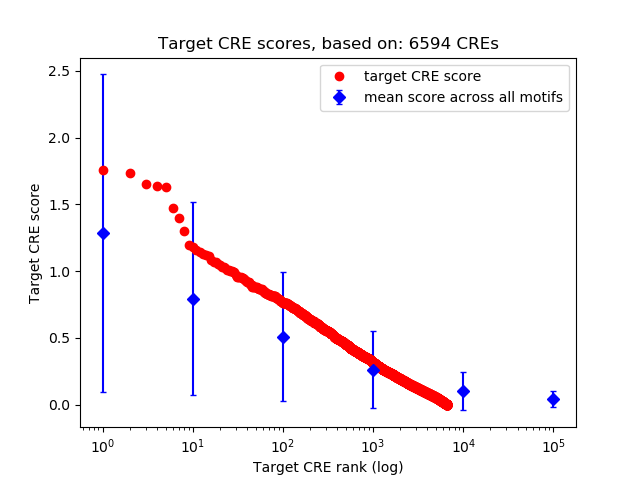
Rank distribution of CRE target scores:
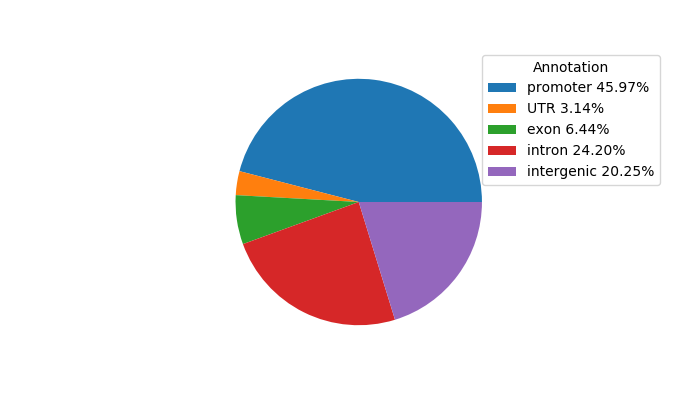
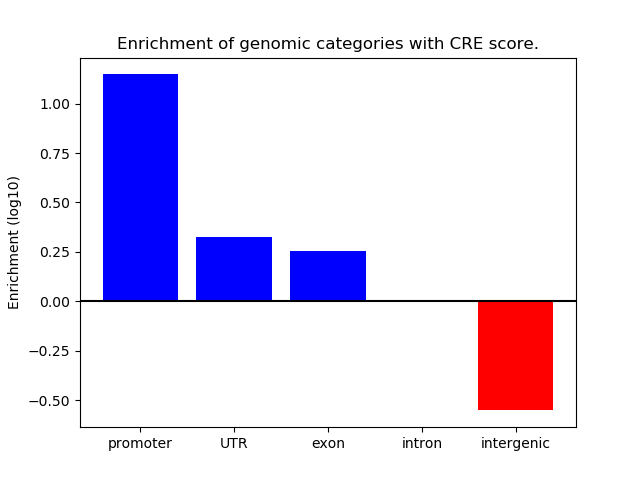
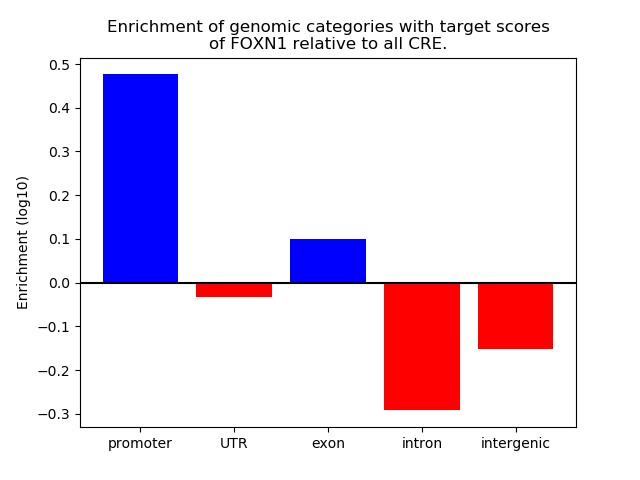
Distribution of target CREs across different genomic regions:
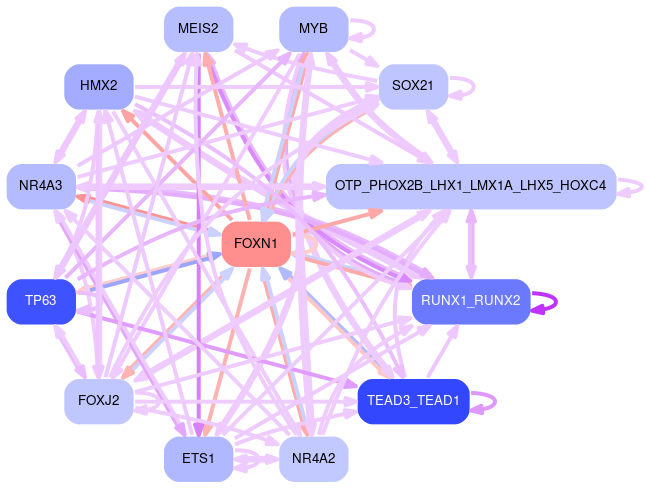
Network of associatons between targets according to the STRING database.

Gene Ontology Analysis
Gene overrepresentation in biological process category:
| Log-likelihood per target | Total log-likelihood | Term | Description |
|---|---|---|---|
| 0.4 | 1.1 | GO:0021542 | dentate gyrus development(GO:0021542) |
| 0.3 | 1.3 | GO:0048752 | semicircular canal morphogenesis(GO:0048752) |
| 0.3 | 0.9 | GO:0060686 | negative regulation of prostatic bud formation(GO:0060686) |
| 0.3 | 0.3 | GO:0001661 | conditioned taste aversion(GO:0001661) |
| 0.3 | 0.8 | GO:0060236 | regulation of mitotic spindle organization(GO:0060236) |
| 0.2 | 0.7 | GO:0035520 | monoubiquitinated protein deubiquitination(GO:0035520) |
| 0.2 | 0.7 | GO:0035426 | extracellular matrix-cell signaling(GO:0035426) |
| 0.2 | 0.6 | GO:0060084 | synaptic transmission involved in micturition(GO:0060084) |
| 0.2 | 0.4 | GO:0007500 | mesodermal cell fate determination(GO:0007500) |
| 0.2 | 0.8 | GO:0071542 | dopaminergic neuron differentiation(GO:0071542) |
| 0.2 | 0.6 | GO:0006651 | diacylglycerol biosynthetic process(GO:0006651) |
| 0.2 | 0.6 | GO:0002689 | negative regulation of leukocyte chemotaxis(GO:0002689) |
| 0.2 | 0.8 | GO:0030854 | positive regulation of granulocyte differentiation(GO:0030854) |
| 0.2 | 0.6 | GO:0010842 | retina layer formation(GO:0010842) |
| 0.2 | 0.5 | GO:0006772 | thiamine metabolic process(GO:0006772) |
| 0.2 | 0.5 | GO:0001302 | replicative cell aging(GO:0001302) |
| 0.2 | 0.3 | GO:0061154 | endothelial tube morphogenesis(GO:0061154) |
| 0.2 | 0.9 | GO:0030174 | regulation of DNA-dependent DNA replication initiation(GO:0030174) |
| 0.2 | 0.5 | GO:0051451 | myoblast migration(GO:0051451) |
| 0.2 | 0.5 | GO:0019605 | butyrate metabolic process(GO:0019605) |
| 0.2 | 0.2 | GO:0031536 | positive regulation of exit from mitosis(GO:0031536) |
| 0.2 | 0.3 | GO:1901722 | regulation of cell proliferation involved in kidney development(GO:1901722) |
| 0.2 | 0.5 | GO:0046548 | retinal rod cell development(GO:0046548) |
| 0.2 | 0.8 | GO:0050667 | homocysteine metabolic process(GO:0050667) |
| 0.2 | 0.9 | GO:0015781 | pyrimidine nucleotide-sugar transport(GO:0015781) |
| 0.2 | 0.5 | GO:0045835 | negative regulation of meiotic nuclear division(GO:0045835) |
| 0.1 | 0.6 | GO:0016241 | regulation of macroautophagy(GO:0016241) |
| 0.1 | 0.4 | GO:0006384 | transcription initiation from RNA polymerase III promoter(GO:0006384) |
| 0.1 | 0.1 | GO:0044818 | mitotic G2/M transition checkpoint(GO:0044818) |
| 0.1 | 0.4 | GO:0031665 | negative regulation of lipopolysaccharide-mediated signaling pathway(GO:0031665) |
| 0.1 | 0.6 | GO:0042483 | negative regulation of odontogenesis(GO:0042483) |
| 0.1 | 0.6 | GO:1903960 | negative regulation of plasma membrane long-chain fatty acid transport(GO:0010748) negative regulation of anion transmembrane transport(GO:1903960) negative regulation of fatty acid transport(GO:2000192) |
| 0.1 | 0.6 | GO:0021571 | rhombomere 5 development(GO:0021571) |
| 0.1 | 0.4 | GO:0021530 | spinal cord oligodendrocyte cell differentiation(GO:0021529) spinal cord oligodendrocyte cell fate specification(GO:0021530) oligodendrocyte cell fate specification(GO:0021778) glial cell fate specification(GO:0021780) |
| 0.1 | 1.0 | GO:0006198 | cAMP catabolic process(GO:0006198) |
| 0.1 | 0.7 | GO:0006561 | proline biosynthetic process(GO:0006561) |
| 0.1 | 0.4 | GO:0003310 | pancreatic A cell differentiation(GO:0003310) |
| 0.1 | 0.4 | GO:0001672 | regulation of chromatin assembly or disassembly(GO:0001672) |
| 0.1 | 0.5 | GO:0046952 | ketone body catabolic process(GO:0046952) |
| 0.1 | 0.4 | GO:0006295 | nucleotide-excision repair, DNA incision, 3'-to lesion(GO:0006295) |
| 0.1 | 1.0 | GO:0006108 | malate metabolic process(GO:0006108) |
| 0.1 | 0.4 | GO:0051571 | positive regulation of histone H3-K4 methylation(GO:0051571) |
| 0.1 | 0.3 | GO:0060430 | lung saccule development(GO:0060430) Type II pneumocyte differentiation(GO:0060510) |
| 0.1 | 0.5 | GO:0048496 | maintenance of organ identity(GO:0048496) |
| 0.1 | 0.4 | GO:0045767 | obsolete regulation of anti-apoptosis(GO:0045767) |
| 0.1 | 0.6 | GO:0051016 | barbed-end actin filament capping(GO:0051016) |
| 0.1 | 1.2 | GO:0016558 | protein import into peroxisome matrix(GO:0016558) |
| 0.1 | 0.5 | GO:0032905 | transforming growth factor beta1 production(GO:0032905) regulation of transforming growth factor beta1 production(GO:0032908) |
| 0.1 | 1.0 | GO:0033687 | osteoblast proliferation(GO:0033687) |
| 0.1 | 0.5 | GO:0090322 | regulation of superoxide metabolic process(GO:0090322) |
| 0.1 | 0.6 | GO:0070245 | positive regulation of thymocyte apoptotic process(GO:0070245) |
| 0.1 | 0.3 | GO:0043653 | mitochondrial fragmentation involved in apoptotic process(GO:0043653) |
| 0.1 | 0.3 | GO:0042668 | auditory receptor cell fate determination(GO:0042668) |
| 0.1 | 0.5 | GO:0032957 | inositol trisphosphate metabolic process(GO:0032957) |
| 0.1 | 0.3 | GO:0019372 | lipoxygenase pathway(GO:0019372) |
| 0.1 | 0.3 | GO:0045541 | negative regulation of cholesterol biosynthetic process(GO:0045541) negative regulation of cholesterol metabolic process(GO:0090206) |
| 0.1 | 0.2 | GO:0061316 | negative regulation of heart induction by canonical Wnt signaling pathway(GO:0003136) negative regulation of cardioblast cell fate specification(GO:0009997) cardioblast cell fate commitment(GO:0042684) cardioblast cell fate specification(GO:0042685) regulation of cardioblast cell fate specification(GO:0042686) negative regulation of cardioblast differentiation(GO:0051892) cardiac cell fate specification(GO:0060912) canonical Wnt signaling pathway involved in heart development(GO:0061316) negative regulation of heart induction(GO:1901320) negative regulation of cardiocyte differentiation(GO:1905208) regulation of cardiac cell fate specification(GO:2000043) negative regulation of cardiac cell fate specification(GO:2000044) |
| 0.1 | 0.2 | GO:0010507 | negative regulation of autophagy(GO:0010507) |
| 0.1 | 0.2 | GO:0031664 | regulation of lipopolysaccharide-mediated signaling pathway(GO:0031664) |
| 0.1 | 0.1 | GO:0002019 | regulation of renal output by angiotensin(GO:0002019) |
| 0.1 | 0.3 | GO:0032060 | bleb assembly(GO:0032060) |
| 0.1 | 0.4 | GO:0018206 | peptidyl-methionine modification(GO:0018206) |
| 0.1 | 0.3 | GO:0070634 | transepithelial ammonium transport(GO:0070634) |
| 0.1 | 1.3 | GO:0046697 | decidualization(GO:0046697) |
| 0.1 | 0.4 | GO:0019367 | fatty acid elongation, saturated fatty acid(GO:0019367) |
| 0.1 | 0.5 | GO:0051967 | negative regulation of synaptic transmission, glutamatergic(GO:0051967) |
| 0.1 | 0.5 | GO:0070670 | response to interleukin-4(GO:0070670) |
| 0.1 | 0.2 | GO:0032802 | low-density lipoprotein particle receptor catabolic process(GO:0032802) |
| 0.1 | 0.2 | GO:0048541 | Peyer's patch development(GO:0048541) |
| 0.1 | 0.3 | GO:0051182 | coenzyme transport(GO:0051182) |
| 0.1 | 0.5 | GO:0032206 | positive regulation of telomere maintenance(GO:0032206) |
| 0.1 | 0.4 | GO:0048569 | post-embryonic organ development(GO:0048569) |
| 0.1 | 0.2 | GO:0060750 | epithelial cell proliferation involved in mammary gland duct elongation(GO:0060750) |
| 0.1 | 0.3 | GO:0017121 | phospholipid scrambling(GO:0017121) |
| 0.1 | 0.2 | GO:0021569 | rhombomere 3 development(GO:0021569) |
| 0.1 | 0.4 | GO:0006548 | histidine catabolic process(GO:0006548) imidazole-containing compound catabolic process(GO:0052805) |
| 0.1 | 0.4 | GO:0043276 | anoikis(GO:0043276) |
| 0.1 | 0.7 | GO:0007616 | long-term memory(GO:0007616) |
| 0.1 | 0.4 | GO:0050651 | dermatan sulfate proteoglycan biosynthetic process(GO:0050651) |
| 0.1 | 0.3 | GO:0032071 | regulation of endodeoxyribonuclease activity(GO:0032071) |
| 0.1 | 0.3 | GO:0034063 | stress granule assembly(GO:0034063) |
| 0.1 | 0.2 | GO:0019985 | translesion synthesis(GO:0019985) |
| 0.1 | 0.2 | GO:1901984 | negative regulation of histone acetylation(GO:0035067) negative regulation of protein acetylation(GO:1901984) negative regulation of peptidyl-lysine acetylation(GO:2000757) |
| 0.1 | 0.3 | GO:0051124 | synaptic growth at neuromuscular junction(GO:0051124) |
| 0.1 | 0.5 | GO:0006287 | base-excision repair, gap-filling(GO:0006287) |
| 0.1 | 0.2 | GO:0002093 | auditory receptor cell morphogenesis(GO:0002093) auditory receptor cell stereocilium organization(GO:0060088) |
| 0.1 | 0.1 | GO:0090224 | regulation of spindle organization(GO:0090224) |
| 0.1 | 0.2 | GO:0006591 | ornithine metabolic process(GO:0006591) |
| 0.1 | 0.4 | GO:0051481 | negative regulation of cytosolic calcium ion concentration(GO:0051481) |
| 0.1 | 0.2 | GO:0042713 | sperm ejaculation(GO:0042713) |
| 0.1 | 0.1 | GO:0071503 | response to heparin(GO:0071503) |
| 0.1 | 0.7 | GO:0042119 | neutrophil activation(GO:0042119) |
| 0.1 | 0.2 | GO:0048478 | replication fork protection(GO:0048478) |
| 0.1 | 0.5 | GO:0014049 | positive regulation of glutamate secretion(GO:0014049) |
| 0.1 | 0.2 | GO:0090084 | negative regulation of inclusion body assembly(GO:0090084) |
| 0.1 | 1.0 | GO:0045739 | positive regulation of DNA repair(GO:0045739) |
| 0.1 | 0.6 | GO:0008635 | activation of cysteine-type endopeptidase activity involved in apoptotic process by cytochrome c(GO:0008635) |
| 0.1 | 1.4 | GO:0031572 | G2 DNA damage checkpoint(GO:0031572) |
| 0.1 | 0.5 | GO:0006013 | mannose metabolic process(GO:0006013) |
| 0.1 | 0.4 | GO:0032464 | positive regulation of protein homooligomerization(GO:0032464) |
| 0.1 | 0.5 | GO:0046033 | AMP metabolic process(GO:0046033) |
| 0.1 | 0.3 | GO:0001967 | suckling behavior(GO:0001967) |
| 0.1 | 0.5 | GO:0000012 | single strand break repair(GO:0000012) |
| 0.1 | 0.2 | GO:0072385 | minus-end-directed organelle transport along microtubule(GO:0072385) |
| 0.1 | 0.5 | GO:0031017 | exocrine pancreas development(GO:0031017) |
| 0.1 | 1.0 | GO:0042771 | intrinsic apoptotic signaling pathway in response to DNA damage by p53 class mediator(GO:0042771) |
| 0.1 | 0.8 | GO:0048873 | homeostasis of number of cells within a tissue(GO:0048873) |
| 0.1 | 0.3 | GO:0046477 | glycosylceramide catabolic process(GO:0046477) |
| 0.1 | 0.2 | GO:0006420 | arginyl-tRNA aminoacylation(GO:0006420) |
| 0.1 | 0.8 | GO:0033540 | fatty acid beta-oxidation using acyl-CoA oxidase(GO:0033540) |
| 0.1 | 0.2 | GO:0007181 | transforming growth factor beta receptor complex assembly(GO:0007181) |
| 0.1 | 0.1 | GO:0019276 | UDP-N-acetylgalactosamine metabolic process(GO:0019276) |
| 0.1 | 1.3 | GO:0006400 | tRNA modification(GO:0006400) |
| 0.1 | 0.6 | GO:0003084 | positive regulation of systemic arterial blood pressure(GO:0003084) |
| 0.1 | 0.2 | GO:0043096 | adenine salvage(GO:0006168) purine nucleobase salvage(GO:0043096) adenine metabolic process(GO:0046083) adenine biosynthetic process(GO:0046084) |
| 0.1 | 0.1 | GO:0048149 | behavioral response to ethanol(GO:0048149) |
| 0.1 | 0.1 | GO:0046100 | hypoxanthine metabolic process(GO:0046100) |
| 0.1 | 0.1 | GO:0060789 | hair follicle placode formation(GO:0060789) |
| 0.1 | 0.5 | GO:0032306 | regulation of icosanoid secretion(GO:0032303) positive regulation of icosanoid secretion(GO:0032305) regulation of prostaglandin secretion(GO:0032306) positive regulation of prostaglandin secretion(GO:0032308) prostaglandin secretion(GO:0032310) |
| 0.1 | 0.1 | GO:0050847 | progesterone receptor signaling pathway(GO:0050847) |
| 0.1 | 0.3 | GO:0007210 | serotonin receptor signaling pathway(GO:0007210) |
| 0.1 | 0.2 | GO:0070837 | dehydroascorbic acid transport(GO:0070837) |
| 0.1 | 0.2 | GO:0070141 | response to UV-A(GO:0070141) |
| 0.1 | 0.1 | GO:0042420 | dopamine catabolic process(GO:0042420) |
| 0.1 | 0.2 | GO:0002541 | activation of plasma proteins involved in acute inflammatory response(GO:0002541) |
| 0.1 | 0.3 | GO:0018027 | peptidyl-lysine dimethylation(GO:0018027) |
| 0.1 | 0.2 | GO:0018094 | protein polyglycylation(GO:0018094) |
| 0.1 | 0.2 | GO:0050686 | negative regulation of mRNA processing(GO:0050686) negative regulation of mRNA metabolic process(GO:1903312) |
| 0.1 | 0.6 | GO:0051568 | histone H3-K4 methylation(GO:0051568) |
| 0.1 | 0.1 | GO:0071436 | sodium ion export(GO:0071436) |
| 0.1 | 0.4 | GO:0019369 | arachidonic acid metabolic process(GO:0019369) |
| 0.1 | 0.1 | GO:0046007 | negative regulation of activated T cell proliferation(GO:0046007) |
| 0.1 | 0.2 | GO:0001553 | luteinization(GO:0001553) |
| 0.1 | 0.1 | GO:0006549 | isoleucine metabolic process(GO:0006549) |
| 0.1 | 0.2 | GO:2001012 | mesenchymal cell differentiation involved in kidney development(GO:0072161) metanephric mesenchymal cell differentiation(GO:0072162) mesenchymal cell differentiation involved in renal system development(GO:2001012) |
| 0.1 | 0.1 | GO:0006927 | obsolete transformed cell apoptotic process(GO:0006927) |
| 0.1 | 0.8 | GO:0006607 | NLS-bearing protein import into nucleus(GO:0006607) |
| 0.1 | 0.8 | GO:0006044 | N-acetylglucosamine metabolic process(GO:0006044) |
| 0.1 | 0.1 | GO:0032352 | positive regulation of hormone metabolic process(GO:0032352) positive regulation of hormone biosynthetic process(GO:0046886) |
| 0.1 | 1.7 | GO:0042147 | retrograde transport, endosome to Golgi(GO:0042147) |
| 0.1 | 0.1 | GO:0010216 | maintenance of DNA methylation(GO:0010216) |
| 0.1 | 0.1 | GO:0070471 | uterine smooth muscle contraction(GO:0070471) regulation of uterine smooth muscle contraction(GO:0070472) positive regulation of uterine smooth muscle contraction(GO:0070474) |
| 0.1 | 0.1 | GO:0031529 | ruffle organization(GO:0031529) |
| 0.1 | 0.6 | GO:0060135 | maternal process involved in female pregnancy(GO:0060135) |
| 0.1 | 0.2 | GO:0032328 | alanine transport(GO:0032328) |
| 0.1 | 0.2 | GO:0002282 | microglial cell activation involved in immune response(GO:0002282) |
| 0.1 | 0.1 | GO:0002467 | germinal center formation(GO:0002467) |
| 0.1 | 0.2 | GO:0010915 | regulation of very-low-density lipoprotein particle clearance(GO:0010915) negative regulation of very-low-density lipoprotein particle clearance(GO:0010916) |
| 0.1 | 0.1 | GO:0034371 | chylomicron remodeling(GO:0034371) |
| 0.1 | 0.2 | GO:0071243 | cellular response to arsenic-containing substance(GO:0071243) |
| 0.1 | 0.1 | GO:0010447 | response to acidic pH(GO:0010447) |
| 0.1 | 0.2 | GO:0006534 | cysteine metabolic process(GO:0006534) |
| 0.1 | 0.4 | GO:0060396 | growth hormone receptor signaling pathway(GO:0060396) cellular response to growth hormone stimulus(GO:0071378) |
| 0.1 | 0.2 | GO:0030091 | protein repair(GO:0030091) |
| 0.1 | 0.2 | GO:0051387 | negative regulation of neurotrophin TRK receptor signaling pathway(GO:0051387) |
| 0.1 | 0.4 | GO:0001829 | trophectodermal cell differentiation(GO:0001829) |
| 0.1 | 0.2 | GO:0008054 | negative regulation of cyclin-dependent protein serine/threonine kinase by cyclin degradation(GO:0008054) |
| 0.1 | 0.3 | GO:0006776 | vitamin A metabolic process(GO:0006776) |
| 0.1 | 0.2 | GO:0034638 | phosphatidylcholine catabolic process(GO:0034638) |
| 0.1 | 0.1 | GO:0001774 | microglial cell activation(GO:0001774) |
| 0.1 | 0.3 | GO:0046716 | muscle cell cellular homeostasis(GO:0046716) |
| 0.1 | 0.4 | GO:0072665 | protein targeting to lysosome(GO:0006622) protein targeting to vacuole(GO:0006623) protein localization to lysosome(GO:0061462) protein localization to vacuole(GO:0072665) establishment of protein localization to vacuole(GO:0072666) |
| 0.1 | 0.4 | GO:0031115 | negative regulation of microtubule polymerization(GO:0031115) |
| 0.1 | 0.1 | GO:0034625 | fatty acid elongation, monounsaturated fatty acid(GO:0034625) |
| 0.1 | 0.2 | GO:0048548 | regulation of pinocytosis(GO:0048548) |
| 0.1 | 0.3 | GO:0016264 | gap junction assembly(GO:0016264) |
| 0.1 | 0.4 | GO:0043954 | cellular component maintenance(GO:0043954) |
| 0.1 | 0.4 | GO:0048013 | ephrin receptor signaling pathway(GO:0048013) |
| 0.1 | 0.2 | GO:0017183 | peptidyl-diphthamide metabolic process(GO:0017182) peptidyl-diphthamide biosynthetic process from peptidyl-histidine(GO:0017183) |
| 0.1 | 0.2 | GO:0008588 | release of cytoplasmic sequestered NF-kappaB(GO:0008588) |
| 0.0 | 0.8 | GO:0050850 | positive regulation of calcium-mediated signaling(GO:0050850) |
| 0.0 | 0.1 | GO:0070672 | response to interleukin-15(GO:0070672) |
| 0.0 | 0.3 | GO:0006538 | glutamate catabolic process(GO:0006538) |
| 0.0 | 0.6 | GO:0034502 | protein localization to chromosome(GO:0034502) |
| 0.0 | 1.0 | GO:0033209 | tumor necrosis factor-mediated signaling pathway(GO:0033209) |
| 0.0 | 0.1 | GO:0045589 | regulation of regulatory T cell differentiation(GO:0045589) |
| 0.0 | 0.1 | GO:0060662 | tube lumen cavitation(GO:0060605) salivary gland cavitation(GO:0060662) |
| 0.0 | 0.3 | GO:0006516 | glycoprotein catabolic process(GO:0006516) |
| 0.0 | 0.1 | GO:0031620 | regulation of fever generation(GO:0031620) positive regulation of fever generation(GO:0031622) |
| 0.0 | 0.9 | GO:0015986 | energy coupled proton transport, down electrochemical gradient(GO:0015985) ATP synthesis coupled proton transport(GO:0015986) |
| 0.0 | 0.0 | GO:0060836 | lymphatic endothelial cell differentiation(GO:0060836) |
| 0.0 | 0.5 | GO:0045648 | positive regulation of erythrocyte differentiation(GO:0045648) |
| 0.0 | 0.2 | GO:0006107 | oxaloacetate metabolic process(GO:0006107) |
| 0.0 | 0.3 | GO:0071391 | cellular response to estrogen stimulus(GO:0071391) |
| 0.0 | 0.1 | GO:0043578 | nuclear matrix organization(GO:0043578) nuclear matrix anchoring at nuclear membrane(GO:0090292) |
| 0.0 | 0.2 | GO:0006122 | mitochondrial electron transport, ubiquinol to cytochrome c(GO:0006122) |
| 0.0 | 0.1 | GO:0051665 | membrane raft localization(GO:0051665) |
| 0.0 | 0.1 | GO:0032203 | telomere formation via telomerase(GO:0032203) |
| 0.0 | 0.1 | GO:0010957 | negative regulation of calcidiol 1-monooxygenase activity(GO:0010956) negative regulation of vitamin D biosynthetic process(GO:0010957) negative regulation of vitamin metabolic process(GO:0046137) |
| 0.0 | 0.6 | GO:0003009 | skeletal muscle contraction(GO:0003009) |
| 0.0 | 0.0 | GO:0051489 | regulation of filopodium assembly(GO:0051489) |
| 0.0 | 0.3 | GO:0042769 | DNA damage response, detection of DNA damage(GO:0042769) |
| 0.0 | 0.5 | GO:0003407 | neural retina development(GO:0003407) |
| 0.0 | 1.1 | GO:0000289 | nuclear-transcribed mRNA poly(A) tail shortening(GO:0000289) |
| 0.0 | 0.0 | GO:0051138 | NK T cell differentiation(GO:0001865) regulation of NK T cell differentiation(GO:0051136) positive regulation of NK T cell differentiation(GO:0051138) |
| 0.0 | 0.4 | GO:0060765 | regulation of androgen receptor signaling pathway(GO:0060765) |
| 0.0 | 0.0 | GO:0051957 | positive regulation of amino acid transport(GO:0051957) |
| 0.0 | 0.1 | GO:0071028 | RNA surveillance(GO:0071025) nuclear RNA surveillance(GO:0071027) nuclear mRNA surveillance(GO:0071028) |
| 0.0 | 0.2 | GO:0046835 | carbohydrate phosphorylation(GO:0046835) |
| 0.0 | 0.2 | GO:0070120 | ciliary neurotrophic factor-mediated signaling pathway(GO:0070120) |
| 0.0 | 0.5 | GO:0051923 | sulfation(GO:0051923) |
| 0.0 | 0.6 | GO:0016601 | Rac protein signal transduction(GO:0016601) |
| 0.0 | 0.0 | GO:0036037 | CD8-positive, alpha-beta T cell activation(GO:0036037) CD8-positive, alpha-beta T cell differentiation(GO:0043374) |
| 0.0 | 0.0 | GO:0090598 | male genitalia morphogenesis(GO:0048808) male anatomical structure morphogenesis(GO:0090598) |
| 0.0 | 0.0 | GO:0040016 | embryonic cleavage(GO:0040016) |
| 0.0 | 0.1 | GO:0001560 | regulation of cell growth by extracellular stimulus(GO:0001560) |
| 0.0 | 0.1 | GO:0060136 | embryonic process involved in female pregnancy(GO:0060136) |
| 0.0 | 0.2 | GO:0061088 | regulation of sequestering of zinc ion(GO:0061088) |
| 0.0 | 0.2 | GO:0008218 | bioluminescence(GO:0008218) |
| 0.0 | 0.1 | GO:0050765 | negative regulation of phagocytosis(GO:0050765) |
| 0.0 | 0.1 | GO:0031145 | anaphase-promoting complex-dependent catabolic process(GO:0031145) |
| 0.0 | 0.3 | GO:0045749 | obsolete negative regulation of S phase of mitotic cell cycle(GO:0045749) |
| 0.0 | 0.2 | GO:0002634 | regulation of germinal center formation(GO:0002634) |
| 0.0 | 0.2 | GO:0045075 | interleukin-12 biosynthetic process(GO:0042090) regulation of interleukin-12 biosynthetic process(GO:0045075) |
| 0.0 | 0.1 | GO:0050857 | positive regulation of antigen receptor-mediated signaling pathway(GO:0050857) |
| 0.0 | 0.1 | GO:0045654 | positive regulation of megakaryocyte differentiation(GO:0045654) positive regulation of hematopoietic progenitor cell differentiation(GO:1901534) |
| 0.0 | 0.2 | GO:0000183 | chromatin silencing at rDNA(GO:0000183) |
| 0.0 | 0.1 | GO:0033091 | positive regulation of immature T cell proliferation(GO:0033091) |
| 0.0 | 0.8 | GO:0030101 | natural killer cell activation(GO:0030101) |
| 0.0 | 0.4 | GO:0043586 | tongue development(GO:0043586) |
| 0.0 | 0.1 | GO:0032415 | regulation of sodium:proton antiporter activity(GO:0032415) regulation of sodium ion transmembrane transport(GO:1902305) regulation of sodium ion transmembrane transporter activity(GO:2000649) |
| 0.0 | 0.5 | GO:0042474 | middle ear morphogenesis(GO:0042474) |
| 0.0 | 0.1 | GO:0071480 | cellular response to gamma radiation(GO:0071480) |
| 0.0 | 0.8 | GO:0007632 | visual behavior(GO:0007632) |
| 0.0 | 0.5 | GO:0007076 | mitotic chromosome condensation(GO:0007076) |
| 0.0 | 0.0 | GO:0071157 | negative regulation of cell cycle arrest(GO:0071157) |
| 0.0 | 0.1 | GO:0018343 | protein farnesylation(GO:0018343) |
| 0.0 | 0.1 | GO:0007638 | mechanosensory behavior(GO:0007638) |
| 0.0 | 0.2 | GO:0043568 | positive regulation of insulin-like growth factor receptor signaling pathway(GO:0043568) |
| 0.0 | 0.2 | GO:0000185 | activation of MAPKKK activity(GO:0000185) |
| 0.0 | 0.1 | GO:0046323 | glucose import(GO:0046323) |
| 0.0 | 0.2 | GO:0031269 | pseudopodium assembly(GO:0031269) regulation of pseudopodium assembly(GO:0031272) positive regulation of pseudopodium assembly(GO:0031274) |
| 0.0 | 0.0 | GO:0021797 | forebrain anterior/posterior pattern specification(GO:0021797) |
| 0.0 | 1.1 | GO:0000184 | nuclear-transcribed mRNA catabolic process, nonsense-mediated decay(GO:0000184) |
| 0.0 | 0.0 | GO:0048537 | mucosal-associated lymphoid tissue development(GO:0048537) |
| 0.0 | 0.2 | GO:0002295 | T-helper cell lineage commitment(GO:0002295) CD4-positive, alpha-beta T cell lineage commitment(GO:0043373) memory T cell differentiation(GO:0043379) regulation of memory T cell differentiation(GO:0043380) positive regulation of memory T cell differentiation(GO:0043382) T-helper 17 type immune response(GO:0072538) T-helper 17 cell differentiation(GO:0072539) T-helper 17 cell lineage commitment(GO:0072540) regulation of T-helper 17 type immune response(GO:2000316) positive regulation of T-helper 17 type immune response(GO:2000318) regulation of T-helper 17 cell differentiation(GO:2000319) positive regulation of T-helper 17 cell differentiation(GO:2000321) regulation of T-helper 17 cell lineage commitment(GO:2000328) positive regulation of T-helper 17 cell lineage commitment(GO:2000330) |
| 0.0 | 0.1 | GO:0001961 | positive regulation of cytokine-mediated signaling pathway(GO:0001961) |
| 0.0 | 0.1 | GO:0040037 | negative regulation of fibroblast growth factor receptor signaling pathway(GO:0040037) |
| 0.0 | 0.2 | GO:0045071 | negative regulation of viral genome replication(GO:0045071) |
| 0.0 | 0.2 | GO:0048268 | clathrin coat assembly(GO:0048268) |
| 0.0 | 0.2 | GO:0035024 | negative regulation of Rho protein signal transduction(GO:0035024) |
| 0.0 | 0.2 | GO:0006422 | aspartyl-tRNA aminoacylation(GO:0006422) |
| 0.0 | 0.2 | GO:0019884 | antigen processing and presentation of exogenous antigen(GO:0019884) |
| 0.0 | 0.3 | GO:0010830 | regulation of myotube differentiation(GO:0010830) |
| 0.0 | 0.1 | GO:0002430 | complement receptor mediated signaling pathway(GO:0002430) |
| 0.0 | 0.2 | GO:0006999 | nuclear pore organization(GO:0006999) |
| 0.0 | 0.5 | GO:0006085 | acetyl-CoA biosynthetic process(GO:0006085) |
| 0.0 | 0.2 | GO:0007216 | G-protein coupled glutamate receptor signaling pathway(GO:0007216) |
| 0.0 | 0.2 | GO:0061077 | chaperone-mediated protein folding(GO:0061077) |
| 0.0 | 0.1 | GO:0031943 | regulation of glucocorticoid metabolic process(GO:0031943) |
| 0.0 | 0.0 | GO:0042362 | fat-soluble vitamin biosynthetic process(GO:0042362) |
| 0.0 | 0.3 | GO:0043508 | negative regulation of JUN kinase activity(GO:0043508) |
| 0.0 | 0.7 | GO:0006699 | bile acid biosynthetic process(GO:0006699) |
| 0.0 | 0.1 | GO:0072498 | embryonic skeletal joint morphogenesis(GO:0060272) embryonic skeletal joint development(GO:0072498) |
| 0.0 | 0.1 | GO:0015868 | purine ribonucleotide transport(GO:0015868) |
| 0.0 | 0.0 | GO:0060013 | righting reflex(GO:0060013) |
| 0.0 | 0.1 | GO:0048664 | neuron fate determination(GO:0048664) |
| 0.0 | 0.1 | GO:0046968 | peptide antigen transport(GO:0046968) |
| 0.0 | 0.1 | GO:0006562 | proline catabolic process(GO:0006562) |
| 0.0 | 0.2 | GO:0042104 | positive regulation of activated T cell proliferation(GO:0042104) regulation of activated T cell proliferation(GO:0046006) |
| 0.0 | 0.0 | GO:0010159 | specification of organ position(GO:0010159) |
| 0.0 | 0.5 | GO:0051324 | prophase(GO:0051324) |
| 0.0 | 0.1 | GO:1903054 | regulation of extracellular matrix disassembly(GO:0010715) negative regulation of extracellular matrix disassembly(GO:0010716) regulation of extracellular matrix organization(GO:1903053) negative regulation of extracellular matrix organization(GO:1903054) |
| 0.0 | 0.0 | GO:0046643 | regulation of gamma-delta T cell activation(GO:0046643) positive regulation of gamma-delta T cell activation(GO:0046645) |
| 0.0 | 0.1 | GO:0042533 | tumor necrosis factor biosynthetic process(GO:0042533) regulation of tumor necrosis factor biosynthetic process(GO:0042534) |
| 0.0 | 0.0 | GO:0045988 | negative regulation of striated muscle contraction(GO:0045988) |
| 0.0 | 0.1 | GO:0032713 | negative regulation of interleukin-4 production(GO:0032713) |
| 0.0 | 0.2 | GO:0045663 | positive regulation of myoblast differentiation(GO:0045663) |
| 0.0 | 0.5 | GO:1905037 | autophagosome assembly(GO:0000045) autophagosome organization(GO:1905037) |
| 0.0 | 0.2 | GO:0034587 | piRNA metabolic process(GO:0034587) |
| 0.0 | 0.3 | GO:0033169 | histone H3-K9 demethylation(GO:0033169) |
| 0.0 | 1.0 | GO:0006636 | unsaturated fatty acid biosynthetic process(GO:0006636) |
| 0.0 | 0.1 | GO:0002281 | macrophage activation involved in immune response(GO:0002281) |
| 0.0 | 0.1 | GO:0009756 | carbohydrate mediated signaling(GO:0009756) |
| 0.0 | 0.2 | GO:0045655 | regulation of monocyte differentiation(GO:0045655) |
| 0.0 | 0.1 | GO:0021984 | adenohypophysis development(GO:0021984) |
| 0.0 | 0.3 | GO:0015074 | DNA integration(GO:0015074) |
| 0.0 | 0.5 | GO:0050999 | regulation of nitric-oxide synthase activity(GO:0050999) |
| 0.0 | 0.2 | GO:0015871 | choline transport(GO:0015871) |
| 0.0 | 1.4 | GO:0051084 | 'de novo' posttranslational protein folding(GO:0051084) |
| 0.0 | 0.0 | GO:0021681 | cerebellar granular layer development(GO:0021681) cerebellar granular layer morphogenesis(GO:0021683) cerebellar granular layer formation(GO:0021684) cerebellar granule cell differentiation(GO:0021707) |
| 0.0 | 0.1 | GO:0045059 | positive thymic T cell selection(GO:0045059) |
| 0.0 | 0.1 | GO:0001743 | optic placode formation(GO:0001743) |
| 0.0 | 0.1 | GO:0019987 | obsolete negative regulation of anti-apoptosis(GO:0019987) |
| 0.0 | 0.2 | GO:0007141 | male meiosis I(GO:0007141) |
| 0.0 | 0.1 | GO:0019042 | viral latency(GO:0019042) |
| 0.0 | 0.5 | GO:0045814 | negative regulation of gene expression, epigenetic(GO:0045814) |
| 0.0 | 0.1 | GO:0061318 | renal filtration cell differentiation(GO:0061318) glomerular epithelium development(GO:0072010) glomerular visceral epithelial cell differentiation(GO:0072112) glomerular epithelial cell differentiation(GO:0072311) |
| 0.0 | 0.1 | GO:0006273 | lagging strand elongation(GO:0006273) |
| 0.0 | 0.1 | GO:0060052 | neurofilament cytoskeleton organization(GO:0060052) |
| 0.0 | 0.1 | GO:0035092 | sperm chromatin condensation(GO:0035092) |
| 0.0 | 0.2 | GO:0030903 | notochord development(GO:0030903) |
| 0.0 | 0.0 | GO:0061140 | lung secretory cell differentiation(GO:0061140) |
| 0.0 | 0.1 | GO:0032770 | positive regulation of monooxygenase activity(GO:0032770) |
| 0.0 | 0.7 | GO:0000288 | nuclear-transcribed mRNA catabolic process, deadenylation-dependent decay(GO:0000288) |
| 0.0 | 0.3 | GO:0045736 | negative regulation of cyclin-dependent protein serine/threonine kinase activity(GO:0045736) negative regulation of cyclin-dependent protein kinase activity(GO:1904030) |
| 0.0 | 0.2 | GO:0006030 | chitin metabolic process(GO:0006030) chitin catabolic process(GO:0006032) amino sugar catabolic process(GO:0046348) glucosamine-containing compound catabolic process(GO:1901072) |
| 0.0 | 0.1 | GO:0006701 | progesterone biosynthetic process(GO:0006701) |
| 0.0 | 0.4 | GO:0048536 | spleen development(GO:0048536) |
| 0.0 | 0.2 | GO:0048339 | paraxial mesoderm development(GO:0048339) |
| 0.0 | 0.9 | GO:0006885 | regulation of pH(GO:0006885) |
| 0.0 | 0.4 | GO:0016180 | snRNA processing(GO:0016180) |
| 0.0 | 0.1 | GO:0043615 | astrocyte cell migration(GO:0043615) |
| 0.0 | 0.1 | GO:0006883 | cellular sodium ion homeostasis(GO:0006883) |
| 0.0 | 0.1 | GO:0009221 | pyrimidine deoxyribonucleotide biosynthetic process(GO:0009221) |
| 0.0 | 0.1 | GO:0001945 | lymph vessel development(GO:0001945) |
| 0.0 | 0.1 | GO:1903504 | positive regulation of spindle checkpoint(GO:0090232) regulation of mitotic cell cycle spindle assembly checkpoint(GO:0090266) positive regulation of mitotic cell cycle spindle assembly checkpoint(GO:0090267) positive regulation of cell cycle checkpoint(GO:1901978) regulation of mitotic spindle checkpoint(GO:1903504) |
| 0.0 | 0.1 | GO:0021819 | cerebral cortex radial glia guided migration(GO:0021801) layer formation in cerebral cortex(GO:0021819) telencephalon glial cell migration(GO:0022030) |
| 0.0 | 0.1 | GO:0050910 | detection of mechanical stimulus involved in sensory perception of sound(GO:0050910) |
| 0.0 | 0.1 | GO:0016236 | macroautophagy(GO:0016236) |
| 0.0 | 0.7 | GO:0034138 | toll-like receptor 3 signaling pathway(GO:0034138) |
| 0.0 | 0.2 | GO:0070570 | regulation of axon regeneration(GO:0048679) regulation of neuron projection regeneration(GO:0070570) |
| 0.0 | 0.2 | GO:0050435 | beta-amyloid metabolic process(GO:0050435) |
| 0.0 | 0.5 | GO:0060334 | regulation of response to interferon-gamma(GO:0060330) regulation of interferon-gamma-mediated signaling pathway(GO:0060334) |
| 0.0 | 0.5 | GO:0046834 | lipid phosphorylation(GO:0046834) |
| 0.0 | 0.0 | GO:0000212 | meiotic spindle organization(GO:0000212) |
| 0.0 | 0.7 | GO:1901185 | negative regulation of epidermal growth factor receptor signaling pathway(GO:0042059) negative regulation of ERBB signaling pathway(GO:1901185) |
| 0.0 | 0.2 | GO:0035335 | peptidyl-tyrosine dephosphorylation(GO:0035335) |
| 0.0 | 0.3 | GO:0006904 | vesicle docking involved in exocytosis(GO:0006904) |
| 0.0 | 0.1 | GO:0060134 | prepulse inhibition(GO:0060134) |
| 0.0 | 0.1 | GO:0032025 | response to cobalt ion(GO:0032025) |
| 0.0 | 0.1 | GO:0006528 | asparagine metabolic process(GO:0006528) |
| 0.0 | 0.1 | GO:0001832 | blastocyst growth(GO:0001832) |
| 0.0 | 0.1 | GO:0009113 | purine nucleobase biosynthetic process(GO:0009113) |
| 0.0 | 0.1 | GO:0032786 | positive regulation of DNA-templated transcription, elongation(GO:0032786) |
| 0.0 | 0.1 | GO:0006003 | fructose 2,6-bisphosphate metabolic process(GO:0006003) |
| 0.0 | 0.1 | GO:0008053 | mitochondrial fusion(GO:0008053) |
| 0.0 | 0.1 | GO:0035414 | negative regulation of catenin import into nucleus(GO:0035414) |
| 0.0 | 0.2 | GO:0043278 | response to isoquinoline alkaloid(GO:0014072) response to morphine(GO:0043278) |
| 0.0 | 0.2 | GO:0046685 | response to arsenic-containing substance(GO:0046685) |
| 0.0 | 0.1 | GO:0042159 | lipoprotein catabolic process(GO:0042159) |
| 0.0 | 0.1 | GO:0051547 | regulation of keratinocyte migration(GO:0051547) positive regulation of keratinocyte migration(GO:0051549) |
| 0.0 | 0.1 | GO:0015816 | glycine transport(GO:0015816) |
| 0.0 | 0.0 | GO:0030223 | neutrophil differentiation(GO:0030223) |
| 0.0 | 0.3 | GO:0001706 | endoderm formation(GO:0001706) |
| 0.0 | 0.1 | GO:0016080 | synaptic vesicle targeting(GO:0016080) |
| 0.0 | 0.4 | GO:0060415 | muscle tissue morphogenesis(GO:0060415) |
| 0.0 | 0.1 | GO:0035025 | positive regulation of Rho protein signal transduction(GO:0035025) |
| 0.0 | 0.1 | GO:0000076 | DNA replication checkpoint(GO:0000076) |
| 0.0 | 0.1 | GO:0006991 | response to sterol depletion(GO:0006991) |
| 0.0 | 0.2 | GO:0043248 | proteasome assembly(GO:0043248) |
| 0.0 | 0.1 | GO:0071428 | rRNA-containing ribonucleoprotein complex export from nucleus(GO:0071428) |
| 0.0 | 0.1 | GO:0035455 | response to interferon-alpha(GO:0035455) |
| 0.0 | 0.1 | GO:0019695 | choline metabolic process(GO:0019695) |
| 0.0 | 1.3 | GO:0006521 | regulation of cellular amino acid metabolic process(GO:0006521) |
| 0.0 | 0.3 | GO:0042461 | photoreceptor cell development(GO:0042461) eye photoreceptor cell development(GO:0042462) |
| 0.0 | 0.3 | GO:0042551 | neuron maturation(GO:0042551) |
| 0.0 | 0.1 | GO:0042772 | DNA damage response, signal transduction resulting in transcription(GO:0042772) |
| 0.0 | 0.1 | GO:0002238 | response to molecule of fungal origin(GO:0002238) |
| 0.0 | 0.2 | GO:0007172 | signal complex assembly(GO:0007172) |
| 0.0 | 0.1 | GO:0071479 | cellular response to ionizing radiation(GO:0071479) |
| 0.0 | 0.1 | GO:0015872 | dopamine transport(GO:0015872) |
| 0.0 | 0.0 | GO:0010389 | regulation of G2/M transition of mitotic cell cycle(GO:0010389) regulation of cell cycle G2/M phase transition(GO:1902749) |
| 0.0 | 0.1 | GO:0007191 | adenylate cyclase-activating dopamine receptor signaling pathway(GO:0007191) |
| 0.0 | 0.1 | GO:0048617 | embryonic foregut morphogenesis(GO:0048617) |
| 0.0 | 0.1 | GO:0009405 | pathogenesis(GO:0009405) |
| 0.0 | 0.4 | GO:0030032 | lamellipodium assembly(GO:0030032) |
| 0.0 | 0.1 | GO:0060670 | branching involved in labyrinthine layer morphogenesis(GO:0060670) |
| 0.0 | 0.2 | GO:0007140 | male meiosis(GO:0007140) |
| 0.0 | 0.2 | GO:0006491 | N-glycan processing(GO:0006491) |
| 0.0 | 0.5 | GO:0007498 | mesoderm development(GO:0007498) |
| 0.0 | 0.3 | GO:0001707 | mesoderm formation(GO:0001707) |
| 0.0 | 0.3 | GO:0060716 | labyrinthine layer blood vessel development(GO:0060716) |
| 0.0 | 0.3 | GO:0045494 | photoreceptor cell maintenance(GO:0045494) |
| 0.0 | 0.4 | GO:0006541 | glutamine metabolic process(GO:0006541) |
| 0.0 | 0.1 | GO:0007144 | female meiosis I(GO:0007144) |
| 0.0 | 0.2 | GO:0071445 | obsolete cellular response to protein stimulus(GO:0071445) |
| 0.0 | 0.2 | GO:0000052 | citrulline metabolic process(GO:0000052) |
| 0.0 | 3.3 | GO:0007249 | I-kappaB kinase/NF-kappaB signaling(GO:0007249) |
| 0.0 | 0.2 | GO:0001569 | patterning of blood vessels(GO:0001569) |
| 0.0 | 0.1 | GO:0008356 | asymmetric cell division(GO:0008356) |
| 0.0 | 0.1 | GO:0007143 | female meiotic division(GO:0007143) |
| 0.0 | 0.0 | GO:0060218 | hematopoietic stem cell differentiation(GO:0060218) |
| 0.0 | 0.0 | GO:0044332 | Wnt signaling pathway involved in dorsal/ventral axis specification(GO:0044332) regulation of Wnt signaling pathway involved in dorsal/ventral axis specification(GO:2000053) negative regulation of Wnt signaling pathway involved in dorsal/ventral axis specification(GO:2000054) |
| 0.0 | 0.1 | GO:0002507 | tolerance induction(GO:0002507) |
| 0.0 | 0.6 | GO:0007205 | protein kinase C-activating G-protein coupled receptor signaling pathway(GO:0007205) |
| 0.0 | 0.1 | GO:0043649 | dicarboxylic acid catabolic process(GO:0043649) |
| 0.0 | 0.1 | GO:0048854 | forebrain morphogenesis(GO:0048853) brain morphogenesis(GO:0048854) |
| 0.0 | 0.1 | GO:0034260 | negative regulation of GTPase activity(GO:0034260) |
| 0.0 | 0.2 | GO:0007184 | SMAD protein import into nucleus(GO:0007184) |
| 0.0 | 0.3 | GO:0010633 | negative regulation of epithelial cell migration(GO:0010633) |
| 0.0 | 0.3 | GO:0000380 | alternative mRNA splicing, via spliceosome(GO:0000380) |
| 0.0 | 0.0 | GO:0035588 | adenosine receptor signaling pathway(GO:0001973) G-protein coupled purinergic receptor signaling pathway(GO:0035588) |
| 0.0 | 0.2 | GO:0010257 | NADH dehydrogenase complex assembly(GO:0010257) mitochondrial respiratory chain complex I assembly(GO:0032981) mitochondrial respiratory chain complex I biogenesis(GO:0097031) |
| 0.0 | 0.1 | GO:0032836 | glomerular basement membrane development(GO:0032836) |
| 0.0 | 0.1 | GO:0071322 | cellular response to carbohydrate stimulus(GO:0071322) |
| 0.0 | 0.1 | GO:0060441 | epithelial tube branching involved in lung morphogenesis(GO:0060441) |
| 0.0 | 0.4 | GO:1902600 | hydrogen ion transmembrane transport(GO:1902600) |
| 0.0 | 0.3 | GO:0035249 | synaptic transmission, glutamatergic(GO:0035249) |
| 0.0 | 0.0 | GO:0034720 | histone H3-K4 demethylation(GO:0034720) |
| 0.0 | 1.3 | GO:0045454 | cell redox homeostasis(GO:0045454) |
| 0.0 | 0.1 | GO:0006002 | fructose 6-phosphate metabolic process(GO:0006002) |
| 0.0 | 0.1 | GO:0070875 | positive regulation of glycogen metabolic process(GO:0070875) |
| 0.0 | 0.0 | GO:0001821 | histamine secretion(GO:0001821) |
| 0.0 | 0.4 | GO:0048477 | oogenesis(GO:0048477) |
| 0.0 | 0.3 | GO:0001824 | blastocyst development(GO:0001824) |
| 0.0 | 0.0 | GO:0060123 | regulation of growth hormone secretion(GO:0060123) |
| 0.0 | 0.1 | GO:0051457 | maintenance of protein location in nucleus(GO:0051457) |
| 0.0 | 0.2 | GO:0032456 | endocytic recycling(GO:0032456) |
| 0.0 | 0.1 | GO:0032648 | regulation of interferon-beta production(GO:0032648) |
| 0.0 | 0.0 | GO:0032715 | negative regulation of interleukin-6 production(GO:0032715) |
| 0.0 | 0.1 | GO:0032627 | interleukin-23 production(GO:0032627) regulation of interleukin-23 production(GO:0032667) |
| 0.0 | 0.2 | GO:0030316 | osteoclast differentiation(GO:0030316) |
| 0.0 | 0.1 | GO:0015801 | aromatic amino acid transport(GO:0015801) |
| 0.0 | 0.0 | GO:0042268 | regulation of cytolysis(GO:0042268) |
| 0.0 | 0.1 | GO:0022401 | desensitization of G-protein coupled receptor protein signaling pathway(GO:0002029) negative adaptation of signaling pathway(GO:0022401) adaptation of signaling pathway(GO:0023058) |
| 0.0 | 0.1 | GO:0032506 | cytokinetic process(GO:0032506) |
| 0.0 | 0.2 | GO:0006305 | DNA alkylation(GO:0006305) DNA methylation(GO:0006306) |
| 0.0 | 0.6 | GO:0010977 | negative regulation of neuron projection development(GO:0010977) negative regulation of cell projection organization(GO:0031345) |
| 0.0 | 0.0 | GO:0030948 | negative regulation of vascular endothelial growth factor receptor signaling pathway(GO:0030948) |
| 0.0 | 0.1 | GO:0042482 | positive regulation of odontogenesis(GO:0042482) positive regulation of tooth mineralization(GO:0070172) |
| 0.0 | 0.1 | GO:0043949 | regulation of cAMP-mediated signaling(GO:0043949) |
| 0.0 | 0.2 | GO:0031146 | SCF-dependent proteasomal ubiquitin-dependent protein catabolic process(GO:0031146) |
| 0.0 | 0.0 | GO:0015015 | heparan sulfate proteoglycan biosynthetic process, enzymatic modification(GO:0015015) |
| 0.0 | 0.0 | GO:0010107 | potassium ion import(GO:0010107) |
| 0.0 | 0.2 | GO:0045745 | positive regulation of G-protein coupled receptor protein signaling pathway(GO:0045745) |
| 0.0 | 0.3 | GO:0016998 | cell wall macromolecule catabolic process(GO:0016998) cell wall macromolecule metabolic process(GO:0044036) cell wall organization or biogenesis(GO:0071554) |
| 0.0 | 0.6 | GO:0000245 | spliceosomal complex assembly(GO:0000245) |
| 0.0 | 0.6 | GO:0006401 | RNA catabolic process(GO:0006401) |
| 0.0 | 0.1 | GO:0051044 | positive regulation of membrane protein ectodomain proteolysis(GO:0051044) |
| 0.0 | 0.0 | GO:0071318 | cellular response to ATP(GO:0071318) |
| 0.0 | 0.1 | GO:0034629 | cellular protein complex localization(GO:0034629) |
| 0.0 | 0.0 | GO:1901374 | acetylcholine transport(GO:0015870) acetate ester transport(GO:1901374) |
| 0.0 | 0.0 | GO:0010837 | regulation of keratinocyte proliferation(GO:0010837) |
| 0.0 | 0.1 | GO:0045880 | positive regulation of smoothened signaling pathway(GO:0045880) |
| 0.0 | 0.0 | GO:0032516 | positive regulation of phosphoprotein phosphatase activity(GO:0032516) |
| 0.0 | 0.5 | GO:0007193 | adenylate cyclase-inhibiting G-protein coupled receptor signaling pathway(GO:0007193) |
| 0.0 | 0.0 | GO:0000733 | DNA strand renaturation(GO:0000733) |
| 0.0 | 0.2 | GO:0002792 | negative regulation of peptide secretion(GO:0002792) |
| 0.0 | 0.7 | GO:0007422 | peripheral nervous system development(GO:0007422) |
| 0.0 | 0.2 | GO:0006702 | androgen biosynthetic process(GO:0006702) |
| 0.0 | 0.1 | GO:0015886 | heme transport(GO:0015886) |
| 0.0 | 0.0 | GO:0039656 | modulation by virus of host gene expression(GO:0039656) |
| 0.0 | 0.0 | GO:0042116 | macrophage activation(GO:0042116) |
| 0.0 | 0.0 | GO:0015803 | branched-chain amino acid transport(GO:0015803) leucine transport(GO:0015820) |
| 0.0 | 0.1 | GO:0032486 | Rap protein signal transduction(GO:0032486) |
| 0.0 | 0.0 | GO:0071371 | cellular response to gonadotropin stimulus(GO:0071371) |
| 0.0 | 0.0 | GO:0098810 | neurotransmitter reuptake(GO:0098810) |
| 0.0 | 0.4 | GO:0019233 | sensory perception of pain(GO:0019233) |
| 0.0 | 0.1 | GO:0007080 | mitotic metaphase plate congression(GO:0007080) |
| 0.0 | 0.0 | GO:0060708 | spongiotrophoblast differentiation(GO:0060708) |
| 0.0 | 0.1 | GO:1900619 | acetylcholine metabolic process(GO:0008291) acetate ester metabolic process(GO:1900619) |
| 0.0 | 0.2 | GO:0019059 | obsolete initiation of viral infection(GO:0019059) |
| 0.0 | 0.1 | GO:0097384 | cellular lipid biosynthetic process(GO:0097384) |
| 0.0 | 0.0 | GO:0006270 | DNA replication initiation(GO:0006270) |
| 0.0 | 0.1 | GO:0090205 | positive regulation of cholesterol metabolic process(GO:0090205) |
| 0.0 | 0.0 | GO:0010614 | negative regulation of cardiac muscle hypertrophy(GO:0010614) |
| 0.0 | 0.7 | GO:0006826 | iron ion transport(GO:0006826) |
| 0.0 | 0.2 | GO:0016226 | iron-sulfur cluster assembly(GO:0016226) metallo-sulfur cluster assembly(GO:0031163) |
| 0.0 | 0.0 | GO:0045885 | obsolete positive regulation of survival gene product expression(GO:0045885) |
| 0.0 | 1.2 | GO:0007126 | meiotic nuclear division(GO:0007126) |
| 0.0 | 0.0 | GO:0060839 | endothelial cell fate commitment(GO:0060839) |
| 0.0 | 0.2 | GO:0006750 | glutathione biosynthetic process(GO:0006750) |
| 0.0 | 0.0 | GO:0019227 | neuronal action potential propagation(GO:0019227) action potential propagation(GO:0098870) |
| 0.0 | 0.1 | GO:0060216 | definitive hemopoiesis(GO:0060216) |
| 0.0 | 0.2 | GO:0000083 | regulation of transcription involved in G1/S transition of mitotic cell cycle(GO:0000083) |
| 0.0 | 4.2 | GO:0016567 | protein ubiquitination(GO:0016567) |
| 0.0 | 0.1 | GO:0010165 | response to X-ray(GO:0010165) |
| 0.0 | 0.0 | GO:0010800 | positive regulation of peptidyl-threonine phosphorylation(GO:0010800) |
| 0.0 | 0.1 | GO:0030041 | actin filament polymerization(GO:0030041) |
| 0.0 | 0.1 | GO:0031340 | positive regulation of vesicle fusion(GO:0031340) |
| 0.0 | 0.0 | GO:0042726 | flavin-containing compound metabolic process(GO:0042726) |
| 0.0 | 0.0 | GO:0055015 | ventricular cardiac muscle cell development(GO:0055015) |
| 0.0 | 0.5 | GO:0000216 | obsolete M/G1 transition of mitotic cell cycle(GO:0000216) |
| 0.0 | 0.0 | GO:0031117 | positive regulation of microtubule depolymerization(GO:0031117) |
| 0.0 | 2.1 | GO:0006417 | regulation of translation(GO:0006417) |
| 0.0 | 0.0 | GO:0044803 | multi-organism membrane organization(GO:0044803) |
| 0.0 | 0.1 | GO:0032007 | negative regulation of TOR signaling(GO:0032007) |
| 0.0 | 0.1 | GO:0040015 | negative regulation of multicellular organism growth(GO:0040015) |
| 0.0 | 0.1 | GO:0019933 | cAMP-mediated signaling(GO:0019933) |
| 0.0 | 0.4 | GO:0018149 | peptide cross-linking(GO:0018149) |
| 0.0 | 0.8 | GO:0071166 | ribonucleoprotein complex localization(GO:0071166) |
| 0.0 | 0.0 | GO:0045351 | type I interferon biosynthetic process(GO:0045351) |
| 0.0 | 0.1 | GO:0032784 | regulation of DNA-templated transcription, elongation(GO:0032784) |
| 0.0 | 0.0 | GO:0022617 | extracellular matrix disassembly(GO:0022617) |
| 0.0 | 0.0 | GO:0032099 | negative regulation of appetite(GO:0032099) |
| 0.0 | 0.3 | GO:0006413 | translational initiation(GO:0006413) |
| 0.0 | 0.2 | GO:0035384 | thioester biosynthetic process(GO:0035384) acyl-CoA biosynthetic process(GO:0071616) |
| 0.0 | 0.1 | GO:0042102 | positive regulation of T cell proliferation(GO:0042102) |
| 0.0 | 0.2 | GO:0006386 | transcription elongation from RNA polymerase III promoter(GO:0006385) termination of RNA polymerase III transcription(GO:0006386) |
| 0.0 | 0.1 | GO:0022027 | interkinetic nuclear migration(GO:0022027) |
| 0.0 | 0.5 | GO:0007259 | JAK-STAT cascade(GO:0007259) STAT cascade(GO:0097696) |
| 0.0 | 0.2 | GO:0043484 | regulation of RNA splicing(GO:0043484) |
| 0.0 | 0.1 | GO:0042036 | negative regulation of cytokine biosynthetic process(GO:0042036) |
| 0.0 | 0.3 | GO:0007214 | gamma-aminobutyric acid signaling pathway(GO:0007214) |
| 0.0 | 0.0 | GO:0090022 | regulation of neutrophil chemotaxis(GO:0090022) regulation of neutrophil migration(GO:1902622) |
| 0.0 | 0.0 | GO:0002523 | leukocyte migration involved in inflammatory response(GO:0002523) |
| 0.0 | 0.1 | GO:0006378 | mRNA polyadenylation(GO:0006378) |
| 0.0 | 0.2 | GO:0030865 | cortical cytoskeleton organization(GO:0030865) cortical actin cytoskeleton organization(GO:0030866) |
| 0.0 | 0.1 | GO:0007628 | adult walking behavior(GO:0007628) walking behavior(GO:0090659) |
| 0.0 | 0.2 | GO:0016079 | synaptic vesicle exocytosis(GO:0016079) |
| 0.0 | 0.1 | GO:0051092 | positive regulation of NF-kappaB transcription factor activity(GO:0051092) |
| 0.0 | 1.3 | GO:0007266 | Rho protein signal transduction(GO:0007266) |
| 0.0 | 0.1 | GO:0045063 | T-helper 1 cell differentiation(GO:0045063) |
| 0.0 | 1.6 | GO:0042254 | ribosome biogenesis(GO:0042254) |
| 0.0 | 0.1 | GO:0019852 | L-ascorbic acid metabolic process(GO:0019852) |
| 0.0 | 0.1 | GO:0008344 | adult locomotory behavior(GO:0008344) |
| 0.0 | 0.1 | GO:0045214 | sarcomere organization(GO:0045214) |
| 0.0 | 0.1 | GO:1990266 | neutrophil chemotaxis(GO:0030593) neutrophil migration(GO:1990266) |
| 0.0 | 0.3 | GO:0036503 | ER-associated ubiquitin-dependent protein catabolic process(GO:0030433) ERAD pathway(GO:0036503) |
| 0.0 | 0.0 | GO:0007512 | adult heart development(GO:0007512) |
| 0.0 | 0.1 | GO:0002456 | T cell mediated immunity(GO:0002456) |
| 0.0 | 0.3 | GO:0048015 | phosphatidylinositol-mediated signaling(GO:0048015) inositol lipid-mediated signaling(GO:0048017) |
| 0.0 | 0.0 | GO:0030259 | lipid glycosylation(GO:0030259) |
| 0.0 | 0.1 | GO:0007185 | transmembrane receptor protein tyrosine phosphatase signaling pathway(GO:0007185) |
| 0.0 | 0.1 | GO:0021549 | cerebellum development(GO:0021549) |
| 0.0 | 0.1 | GO:0006551 | leucine metabolic process(GO:0006551) |
| 0.0 | 0.1 | GO:0031670 | cellular response to nutrient(GO:0031670) |
| 0.0 | 0.1 | GO:0007217 | tachykinin receptor signaling pathway(GO:0007217) |
| 0.0 | 0.0 | GO:0001955 | blood vessel maturation(GO:0001955) |
| 0.0 | 0.0 | GO:0046543 | development of secondary female sexual characteristics(GO:0046543) |
| 0.0 | 1.4 | GO:0006470 | protein dephosphorylation(GO:0006470) |
| 0.0 | 0.0 | GO:0019228 | neuronal action potential(GO:0019228) |
| 0.0 | 0.0 | GO:0051852 | disruption by host of symbiont cells(GO:0051852) killing by host of symbiont cells(GO:0051873) |
| 0.0 | 1.0 | GO:0000279 | M phase(GO:0000279) |
| 0.0 | 0.1 | GO:0032402 | melanosome transport(GO:0032402) |
| 0.0 | 0.0 | GO:0045898 | regulation of RNA polymerase II transcriptional preinitiation complex assembly(GO:0045898) |
| 0.0 | 0.0 | GO:0002883 | hypersensitivity(GO:0002524) regulation of acute inflammatory response to antigenic stimulus(GO:0002864) positive regulation of acute inflammatory response to antigenic stimulus(GO:0002866) regulation of hypersensitivity(GO:0002883) positive regulation of hypersensitivity(GO:0002885) |
| 0.0 | 0.3 | GO:0016338 | calcium-independent cell-cell adhesion via plasma membrane cell-adhesion molecules(GO:0016338) |
| 0.0 | 0.0 | GO:0003215 | cardiac right ventricle morphogenesis(GO:0003215) |
| 0.0 | 0.7 | GO:0008033 | tRNA processing(GO:0008033) |
| 0.0 | 0.0 | GO:0019348 | polyprenol metabolic process(GO:0016093) dolichol metabolic process(GO:0019348) |
| 0.0 | 0.1 | GO:0045646 | regulation of erythrocyte differentiation(GO:0045646) |
| 0.0 | 0.0 | GO:0051014 | actin filament severing(GO:0051014) |
| 0.0 | 0.0 | GO:0032781 | positive regulation of ATPase activity(GO:0032781) |
| 0.0 | 0.0 | GO:0060317 | cardiac epithelial to mesenchymal transition(GO:0060317) |
| 0.0 | 0.0 | GO:0032020 | ISG15-protein conjugation(GO:0032020) |
| 0.0 | 0.5 | GO:0009062 | fatty acid catabolic process(GO:0009062) |
| 0.0 | 0.0 | GO:0001543 | ovarian follicle rupture(GO:0001543) |
| 0.0 | 0.0 | GO:0006610 | ribosomal protein import into nucleus(GO:0006610) |
| 0.0 | 0.1 | GO:0031293 | membrane protein intracellular domain proteolysis(GO:0031293) |
| 0.0 | 0.1 | GO:0002418 | immune response to tumor cell(GO:0002418) |
| 0.0 | 0.0 | GO:0006862 | nucleotide transport(GO:0006862) |
| 0.0 | 0.3 | GO:0009060 | aerobic respiration(GO:0009060) |
| 0.0 | 0.2 | GO:0071377 | cellular response to glucagon stimulus(GO:0071377) |
| 0.0 | 0.1 | GO:0032008 | positive regulation of TOR signaling(GO:0032008) |
| 0.0 | 0.0 | GO:0060235 | lens induction in camera-type eye(GO:0060235) |
| 0.0 | 0.0 | GO:0006154 | adenosine catabolic process(GO:0006154) |
| 0.0 | 0.0 | GO:0006907 | pinocytosis(GO:0006907) |
| 0.0 | 0.1 | GO:0048730 | epidermis morphogenesis(GO:0048730) |
| 0.0 | 0.0 | GO:0043501 | skeletal muscle adaptation(GO:0043501) |
| 0.0 | 0.0 | GO:0000729 | DNA double-strand break processing(GO:0000729) DNA double-strand break processing involved in repair via single-strand annealing(GO:0010792) double-strand break repair via single-strand annealing(GO:0045002) |
| 0.0 | 0.0 | GO:0006268 | DNA unwinding involved in DNA replication(GO:0006268) |
| 0.0 | 0.0 | GO:0030252 | growth hormone secretion(GO:0030252) |
| 0.0 | 0.1 | GO:0009067 | aspartate family amino acid biosynthetic process(GO:0009067) |
| 0.0 | 0.2 | GO:0016254 | preassembly of GPI anchor in ER membrane(GO:0016254) |
| 0.0 | 0.0 | GO:0070254 | mucus secretion(GO:0070254) |
| 0.0 | 0.3 | GO:0019722 | calcium-mediated signaling(GO:0019722) |
| 0.0 | 0.0 | GO:0001921 | positive regulation of receptor recycling(GO:0001921) |
| 0.0 | 0.1 | GO:0036075 | endochondral ossification(GO:0001958) replacement ossification(GO:0036075) |
| 0.0 | 0.0 | GO:0042416 | dopamine biosynthetic process(GO:0042416) |
| 0.0 | 0.0 | GO:0042732 | D-xylose metabolic process(GO:0042732) |
| 0.0 | 0.0 | GO:0021869 | forebrain ventricular zone progenitor cell division(GO:0021869) |
| 0.0 | 0.1 | GO:0048240 | sperm capacitation(GO:0048240) |
| 0.0 | 0.0 | GO:0015917 | aminophospholipid transport(GO:0015917) |
| 0.0 | 0.0 | GO:0099565 | regulation of postsynaptic membrane potential(GO:0060078) chemical synaptic transmission, postsynaptic(GO:0099565) |
| 0.0 | 0.1 | GO:0031047 | gene silencing by RNA(GO:0031047) |
| 0.0 | 0.0 | GO:0071277 | cellular response to calcium ion(GO:0071277) |
| 0.0 | 0.0 | GO:1901522 | positive regulation of transcription from RNA polymerase II promoter involved in cellular response to chemical stimulus(GO:1901522) |
| 0.0 | 0.4 | GO:0048011 | neurotrophin signaling pathway(GO:0038179) neurotrophin TRK receptor signaling pathway(GO:0048011) |
| 0.0 | 0.1 | GO:0000060 | protein import into nucleus, translocation(GO:0000060) |
| 0.0 | 0.3 | GO:0010827 | regulation of glucose transport(GO:0010827) |
| 0.0 | 0.0 | GO:0046618 | drug export(GO:0046618) |
| 0.0 | 0.0 | GO:0031061 | negative regulation of histone methylation(GO:0031061) |
| 0.0 | 0.0 | GO:0001974 | blood vessel remodeling(GO:0001974) |
| 0.0 | 0.1 | GO:0051899 | membrane depolarization(GO:0051899) |
| 0.0 | 0.4 | GO:0030832 | regulation of actin filament length(GO:0030832) |
| 0.0 | 0.0 | GO:0060706 | cell differentiation involved in embryonic placenta development(GO:0060706) |
| 0.0 | 0.0 | GO:0048286 | lung alveolus development(GO:0048286) |
| 0.0 | 0.1 | GO:0070189 | kynurenine metabolic process(GO:0070189) |
| 0.0 | 0.0 | GO:0006734 | NADH metabolic process(GO:0006734) |
| 0.0 | 0.1 | GO:0006857 | oligopeptide transport(GO:0006857) |
| 0.0 | 0.0 | GO:0015919 | peroxisomal membrane transport(GO:0015919) |
| 0.0 | 0.1 | GO:0010863 | activation of phospholipase C activity(GO:0007202) positive regulation of phospholipase C activity(GO:0010863) regulation of phospholipase C activity(GO:1900274) |
| 0.0 | 0.0 | GO:0018125 | peptidyl-cysteine methylation(GO:0018125) |
| 0.0 | 0.0 | GO:0035587 | purinergic receptor signaling pathway(GO:0035587) |
| 0.0 | 0.0 | GO:0010039 | response to iron ion(GO:0010039) |
| 0.0 | 0.0 | GO:0051597 | response to methylmercury(GO:0051597) |
| 0.0 | 0.1 | GO:0035116 | embryonic hindlimb morphogenesis(GO:0035116) |
| 0.0 | 0.0 | GO:0006691 | leukotriene metabolic process(GO:0006691) |
| 0.0 | 0.0 | GO:0051461 | corticotropin secretion(GO:0051458) regulation of corticotropin secretion(GO:0051459) positive regulation of corticotropin secretion(GO:0051461) |
| 0.0 | 0.0 | GO:0032924 | activin receptor signaling pathway(GO:0032924) |
| 0.0 | 0.1 | GO:0033574 | response to testosterone(GO:0033574) |
| 0.0 | 0.0 | GO:0045945 | positive regulation of transcription from RNA polymerase III promoter(GO:0045945) |
| 0.0 | 0.0 | GO:0000244 | spliceosomal tri-snRNP complex assembly(GO:0000244) |
| 0.0 | 0.1 | GO:0006084 | acetyl-CoA metabolic process(GO:0006084) |
| 0.0 | 0.6 | GO:0000086 | G2/M transition of mitotic cell cycle(GO:0000086) cell cycle G2/M phase transition(GO:0044839) |
| 0.0 | 0.0 | GO:0006498 | N-terminal protein lipidation(GO:0006498) |
| 0.0 | 0.0 | GO:0043631 | RNA polyadenylation(GO:0043631) |
| 0.0 | 0.1 | GO:0042572 | retinol metabolic process(GO:0042572) |
| 0.0 | 0.0 | GO:0001919 | regulation of receptor recycling(GO:0001919) |
| 0.0 | 0.1 | GO:0031532 | actin cytoskeleton reorganization(GO:0031532) |
| 0.0 | 0.0 | GO:0002331 | pre-B cell allelic exclusion(GO:0002331) |
| 0.0 | 0.1 | GO:0070536 | protein K63-linked deubiquitination(GO:0070536) |
| 0.0 | 0.1 | GO:0080171 | lysosome organization(GO:0007040) lytic vacuole organization(GO:0080171) |
| 0.0 | 0.1 | GO:0030510 | regulation of BMP signaling pathway(GO:0030510) |
| 0.0 | 0.1 | GO:0007032 | endosome organization(GO:0007032) |
Gene overrepresentation in cellular component category:
| Log-likelihood per target | Total log-likelihood | Term | Description |
|---|---|---|---|
| 0.3 | 0.9 | GO:0042629 | mast cell granule(GO:0042629) |
| 0.2 | 0.5 | GO:0001940 | male pronucleus(GO:0001940) |
| 0.1 | 0.7 | GO:0031088 | platelet dense granule membrane(GO:0031088) |
| 0.1 | 0.4 | GO:0032009 | early phagosome(GO:0032009) |
| 0.1 | 0.9 | GO:0005861 | troponin complex(GO:0005861) |
| 0.1 | 0.3 | GO:0008537 | proteasome activator complex(GO:0008537) |
| 0.1 | 0.8 | GO:0042598 | obsolete vesicular fraction(GO:0042598) |
| 0.1 | 0.5 | GO:0071437 | invadopodium(GO:0071437) |
| 0.1 | 0.6 | GO:0034451 | centriolar satellite(GO:0034451) |
| 0.1 | 0.8 | GO:0005664 | origin recognition complex(GO:0000808) nuclear origin of replication recognition complex(GO:0005664) |
| 0.1 | 0.8 | GO:0000109 | nucleotide-excision repair complex(GO:0000109) |
| 0.1 | 0.6 | GO:0030681 | nucleolar ribonuclease P complex(GO:0005655) ribonuclease P complex(GO:0030677) multimeric ribonuclease P complex(GO:0030681) |
| 0.1 | 0.9 | GO:0071203 | WASH complex(GO:0071203) |
| 0.1 | 0.6 | GO:0008274 | gamma-tubulin large complex(GO:0000931) gamma-tubulin ring complex(GO:0008274) |
| 0.1 | 0.2 | GO:0070852 | cell body fiber(GO:0070852) |
| 0.1 | 0.2 | GO:0031932 | TORC2 complex(GO:0031932) |
| 0.1 | 0.4 | GO:0044224 | juxtaparanode region of axon(GO:0044224) |
| 0.1 | 0.4 | GO:0070775 | H3 histone acetyltransferase complex(GO:0070775) MOZ/MORF histone acetyltransferase complex(GO:0070776) |
| 0.1 | 2.1 | GO:0031907 | peroxisomal matrix(GO:0005782) microbody lumen(GO:0031907) |
| 0.1 | 0.2 | GO:0043240 | Fanconi anaemia nuclear complex(GO:0043240) |
| 0.1 | 0.3 | GO:0005827 | polar microtubule(GO:0005827) |
| 0.1 | 0.9 | GO:0042101 | T cell receptor complex(GO:0042101) |
| 0.1 | 0.4 | GO:0030992 | intraciliary transport particle B(GO:0030992) |
| 0.1 | 0.5 | GO:0008290 | F-actin capping protein complex(GO:0008290) |
| 0.1 | 1.3 | GO:0000159 | protein phosphatase type 2A complex(GO:0000159) |
| 0.1 | 0.7 | GO:0008180 | COP9 signalosome(GO:0008180) |
| 0.1 | 0.2 | GO:0005945 | 6-phosphofructokinase complex(GO:0005945) |
| 0.1 | 0.1 | GO:0031933 | telomeric heterochromatin(GO:0031933) |
| 0.1 | 0.3 | GO:0005719 | nuclear euchromatin(GO:0005719) |
| 0.1 | 0.8 | GO:0014704 | intercalated disc(GO:0014704) cell-cell contact zone(GO:0044291) |
| 0.1 | 0.5 | GO:0002102 | podosome(GO:0002102) |
| 0.1 | 0.8 | GO:0032300 | mismatch repair complex(GO:0032300) |
| 0.1 | 0.5 | GO:0090576 | RNA polymerase III transcription factor complex(GO:0090576) |
| 0.1 | 0.3 | GO:0031265 | CD95 death-inducing signaling complex(GO:0031265) |
| 0.1 | 0.4 | GO:0071565 | nBAF complex(GO:0071565) |
| 0.1 | 0.8 | GO:0005942 | phosphatidylinositol 3-kinase complex(GO:0005942) |
| 0.1 | 0.5 | GO:0048188 | Set1C/COMPASS complex(GO:0048188) |
| 0.1 | 1.0 | GO:0080008 | Cul4-RING E3 ubiquitin ligase complex(GO:0080008) |
| 0.1 | 0.2 | GO:0031428 | box C/D snoRNP complex(GO:0031428) |
| 0.1 | 0.2 | GO:0071986 | Ragulator complex(GO:0071986) |
| 0.1 | 0.1 | GO:0031264 | death-inducing signaling complex(GO:0031264) |
| 0.1 | 0.1 | GO:0000791 | euchromatin(GO:0000791) |
| 0.1 | 0.2 | GO:0034045 | pre-autophagosomal structure membrane(GO:0034045) |
| 0.1 | 0.2 | GO:0034673 | inhibin-betaglycan-ActRII complex(GO:0034673) |
| 0.1 | 0.2 | GO:0045323 | interleukin-1 receptor complex(GO:0045323) |
| 0.1 | 0.1 | GO:0000778 | condensed nuclear chromosome kinetochore(GO:0000778) |
| 0.1 | 0.5 | GO:0000783 | telomere cap complex(GO:0000782) nuclear telomere cap complex(GO:0000783) |
| 0.1 | 0.6 | GO:0045263 | proton-transporting ATP synthase complex, coupling factor F(o)(GO:0045263) |
| 0.1 | 0.4 | GO:0051233 | spindle midzone(GO:0051233) |
| 0.0 | 1.0 | GO:0031201 | SNARE complex(GO:0031201) |
| 0.0 | 0.2 | GO:0005828 | kinetochore microtubule(GO:0005828) |
| 0.0 | 0.1 | GO:0034992 | microtubule organizing center attachment site(GO:0034992) LINC complex(GO:0034993) |
| 0.0 | 0.0 | GO:0005839 | proteasome core complex(GO:0005839) |
| 0.0 | 0.2 | GO:0031301 | integral component of organelle membrane(GO:0031301) |
| 0.0 | 0.9 | GO:0008023 | transcription elongation factor complex(GO:0008023) |
| 0.0 | 0.2 | GO:0000015 | phosphopyruvate hydratase complex(GO:0000015) |
| 0.0 | 0.1 | GO:0005766 | primary lysosome(GO:0005766) azurophil granule(GO:0042582) |
| 0.0 | 0.2 | GO:0031262 | Ndc80 complex(GO:0031262) |
| 0.0 | 0.3 | GO:0005683 | U7 snRNP(GO:0005683) |
| 0.0 | 0.1 | GO:0030008 | TRAPP complex(GO:0030008) |
| 0.0 | 0.2 | GO:0071817 | MMXD complex(GO:0071817) |
| 0.0 | 0.9 | GO:0042612 | MHC class I protein complex(GO:0042612) |
| 0.0 | 0.4 | GO:0061200 | clathrin-sculpted gamma-aminobutyric acid transport vesicle(GO:0061200) clathrin-sculpted gamma-aminobutyric acid transport vesicle membrane(GO:0061202) |
| 0.0 | 0.0 | GO:0000800 | lateral element(GO:0000800) |
| 0.0 | 0.1 | GO:0000176 | nuclear exosome (RNase complex)(GO:0000176) |
| 0.0 | 0.3 | GO:0030877 | beta-catenin destruction complex(GO:0030877) |
| 0.0 | 0.2 | GO:0045275 | mitochondrial respiratory chain complex III(GO:0005750) respiratory chain complex III(GO:0045275) |
| 0.0 | 0.2 | GO:0030688 | preribosome, small subunit precursor(GO:0030688) |
| 0.0 | 1.3 | GO:0016592 | mediator complex(GO:0016592) |
| 0.0 | 0.1 | GO:0005832 | chaperonin-containing T-complex(GO:0005832) |
| 0.0 | 0.4 | GO:0033177 | proton-transporting two-sector ATPase complex, proton-transporting domain(GO:0033177) |
| 0.0 | 0.0 | GO:0060200 | clathrin-sculpted acetylcholine transport vesicle(GO:0060200) clathrin-sculpted acetylcholine transport vesicle membrane(GO:0060201) |
| 0.0 | 0.1 | GO:0031904 | endosome lumen(GO:0031904) |
| 0.0 | 0.2 | GO:0005883 | neurofilament(GO:0005883) |
| 0.0 | 0.1 | GO:0070531 | BRCA1-A complex(GO:0070531) |
| 0.0 | 0.4 | GO:0030126 | COPI vesicle coat(GO:0030126) |
| 0.0 | 0.3 | GO:0019861 | obsolete flagellum(GO:0019861) |
| 0.0 | 0.2 | GO:0045334 | clathrin-coated endocytic vesicle(GO:0045334) |
| 0.0 | 0.4 | GO:0031105 | septin complex(GO:0031105) septin cytoskeleton(GO:0032156) |
| 0.0 | 0.7 | GO:0005844 | polysome(GO:0005844) |
| 0.0 | 0.1 | GO:0072669 | tRNA-splicing ligase complex(GO:0072669) |
| 0.0 | 0.4 | GO:0032391 | photoreceptor connecting cilium(GO:0032391) |
| 0.0 | 0.4 | GO:0034362 | low-density lipoprotein particle(GO:0034362) |
| 0.0 | 0.5 | GO:0090665 | dystrophin-associated glycoprotein complex(GO:0016010) glycoprotein complex(GO:0090665) |
| 0.0 | 0.2 | GO:0045120 | pronucleus(GO:0045120) |
| 0.0 | 0.7 | GO:0000299 | obsolete integral to membrane of membrane fraction(GO:0000299) |
| 0.0 | 0.1 | GO:0031313 | extrinsic component of vacuolar membrane(GO:0000306) extrinsic component of endosome membrane(GO:0031313) |
| 0.0 | 0.0 | GO:0032045 | guanyl-nucleotide exchange factor complex(GO:0032045) |
| 0.0 | 0.2 | GO:0019773 | proteasome core complex, alpha-subunit complex(GO:0019773) |
| 0.0 | 0.2 | GO:0000796 | condensin complex(GO:0000796) |
| 0.0 | 0.1 | GO:0002141 | stereocilia coupling link(GO:0002139) stereocilia ankle link(GO:0002141) stereocilia ankle link complex(GO:0002142) |
| 0.0 | 0.2 | GO:0045261 | proton-transporting ATP synthase complex, catalytic core F(1)(GO:0045261) |
| 0.0 | 0.3 | GO:0032839 | dendrite cytoplasm(GO:0032839) |
| 0.0 | 0.2 | GO:0005869 | dynactin complex(GO:0005869) |
| 0.0 | 0.4 | GO:0010494 | cytoplasmic stress granule(GO:0010494) |
| 0.0 | 0.2 | GO:0000242 | pericentriolar material(GO:0000242) |
| 0.0 | 0.1 | GO:0042587 | glycogen granule(GO:0042587) |
| 0.0 | 0.2 | GO:0005915 | zonula adherens(GO:0005915) |
| 0.0 | 0.4 | GO:0032039 | integrator complex(GO:0032039) |
| 0.0 | 0.3 | GO:0016281 | eukaryotic translation initiation factor 4F complex(GO:0016281) |
| 0.0 | 0.1 | GO:0043218 | compact myelin(GO:0043218) |
| 0.0 | 0.1 | GO:0042405 | nuclear inclusion body(GO:0042405) |
| 0.0 | 0.9 | GO:0005626 | obsolete insoluble fraction(GO:0005626) |
| 0.0 | 0.2 | GO:0005677 | chromatin silencing complex(GO:0005677) |
| 0.0 | 0.2 | GO:0008091 | spectrin(GO:0008091) |
| 0.0 | 0.4 | GO:0005852 | eukaryotic translation initiation factor 3 complex(GO:0005852) |
| 0.0 | 0.2 | GO:0031463 | Cul3-RING ubiquitin ligase complex(GO:0031463) |
| 0.0 | 0.1 | GO:0070188 | obsolete Stn1-Ten1 complex(GO:0070188) |
| 0.0 | 0.2 | GO:0005845 | mRNA cap binding complex(GO:0005845) RNA cap binding complex(GO:0034518) |
| 0.0 | 0.2 | GO:0042382 | paraspeckles(GO:0042382) |
| 0.0 | 0.3 | GO:0030057 | desmosome(GO:0030057) |
| 0.0 | 0.2 | GO:0043034 | costamere(GO:0043034) |
| 0.0 | 0.6 | GO:0030496 | midbody(GO:0030496) |
| 0.0 | 0.1 | GO:0070552 | BRISC complex(GO:0070552) |
| 0.0 | 0.4 | GO:0031519 | PcG protein complex(GO:0031519) |
| 0.0 | 0.1 | GO:0030663 | COPI-coated vesicle membrane(GO:0030663) |
| 0.0 | 0.1 | GO:0005896 | interleukin-6 receptor complex(GO:0005896) |
| 0.0 | 0.2 | GO:0033116 | endoplasmic reticulum-Golgi intermediate compartment membrane(GO:0033116) |
| 0.0 | 0.5 | GO:0097610 | cell division site(GO:0032153) cleavage furrow(GO:0032154) cell division site part(GO:0032155) cell surface furrow(GO:0097610) |
| 0.0 | 0.4 | GO:0005881 | cytoplasmic microtubule(GO:0005881) |
| 0.0 | 0.2 | GO:0005876 | spindle microtubule(GO:0005876) |
| 0.0 | 0.2 | GO:0031233 | intrinsic component of external side of plasma membrane(GO:0031233) |
| 0.0 | 0.4 | GO:0032420 | stereocilium(GO:0032420) |
| 0.0 | 0.1 | GO:0000940 | condensed chromosome outer kinetochore(GO:0000940) |
| 0.0 | 0.1 | GO:0030127 | COPII vesicle coat(GO:0030127) |
| 0.0 | 0.6 | GO:1903293 | protein serine/threonine phosphatase complex(GO:0008287) phosphatase complex(GO:1903293) |
| 0.0 | 0.1 | GO:0032444 | activin responsive factor complex(GO:0032444) |
| 0.0 | 0.2 | GO:0008278 | cohesin complex(GO:0008278) |
| 0.0 | 0.3 | GO:0043186 | P granule(GO:0043186) pole plasm(GO:0045495) germ plasm(GO:0060293) |
| 0.0 | 0.4 | GO:0030864 | cortical actin cytoskeleton(GO:0030864) |
| 0.0 | 1.1 | GO:0016605 | PML body(GO:0016605) |
| 0.0 | 0.0 | GO:0032838 | cell projection cytoplasm(GO:0032838) |
| 0.0 | 0.1 | GO:0014731 | spectrin-associated cytoskeleton(GO:0014731) |
| 0.0 | 0.1 | GO:0048500 | signal recognition particle, endoplasmic reticulum targeting(GO:0005786) signal recognition particle(GO:0048500) |
| 0.0 | 0.7 | GO:0036064 | ciliary basal body(GO:0036064) |
| 0.0 | 1.0 | GO:0000922 | spindle pole(GO:0000922) |
| 0.0 | 0.2 | GO:0033180 | proton-transporting V-type ATPase, V1 domain(GO:0033180) |
| 0.0 | 0.1 | GO:0030061 | mitochondrial crista(GO:0030061) |
| 0.0 | 1.6 | GO:0005777 | peroxisome(GO:0005777) microbody(GO:0042579) |
| 0.0 | 0.3 | GO:0000178 | exosome (RNase complex)(GO:0000178) |
| 0.0 | 2.3 | GO:0000151 | ubiquitin ligase complex(GO:0000151) |
| 0.0 | 0.1 | GO:0017071 | intracellular cyclic nucleotide activated cation channel complex(GO:0017071) |
| 0.0 | 0.0 | GO:0005899 | insulin receptor complex(GO:0005899) |
| 0.0 | 0.2 | GO:0043209 | myelin sheath(GO:0043209) |
| 0.0 | 1.2 | GO:0016363 | nuclear matrix(GO:0016363) |
| 0.0 | 0.3 | GO:0043073 | germ cell nucleus(GO:0043073) |
| 0.0 | 0.3 | GO:0005720 | nuclear heterochromatin(GO:0005720) |
| 0.0 | 2.2 | GO:0016607 | nuclear speck(GO:0016607) |
| 0.0 | 0.0 | GO:0009331 | glycerol-3-phosphate dehydrogenase complex(GO:0009331) |
| 0.0 | 0.3 | GO:0016328 | lateral plasma membrane(GO:0016328) |
| 0.0 | 0.0 | GO:0032588 | trans-Golgi network membrane(GO:0032588) |
| 0.0 | 0.3 | GO:0005795 | Golgi stack(GO:0005795) |
| 0.0 | 0.5 | GO:0097223 | acrosomal vesicle(GO:0001669) sperm part(GO:0097223) |
| 0.0 | 0.1 | GO:0005594 | collagen type IX trimer(GO:0005594) |
| 0.0 | 0.9 | GO:0031901 | early endosome membrane(GO:0031901) |
| 0.0 | 0.1 | GO:0016580 | Sin3 complex(GO:0016580) Sin3-type complex(GO:0070822) |
| 0.0 | 0.1 | GO:0098984 | asymmetric synapse(GO:0032279) neuron to neuron synapse(GO:0098984) |
| 0.0 | 0.1 | GO:0005672 | transcription factor TFIIA complex(GO:0005672) |
| 0.0 | 0.6 | GO:0005791 | rough endoplasmic reticulum(GO:0005791) |
| 0.0 | 1.3 | GO:0031227 | intrinsic component of endoplasmic reticulum membrane(GO:0031227) |
| 0.0 | 0.9 | GO:0031228 | intrinsic component of Golgi membrane(GO:0031228) |
| 0.0 | 0.1 | GO:0032585 | multivesicular body membrane(GO:0032585) |
| 0.0 | 0.0 | GO:0043190 | ATP-binding cassette (ABC) transporter complex(GO:0043190) |
| 0.0 | 5.2 | GO:0005625 | obsolete soluble fraction(GO:0005625) |
| 0.0 | 0.1 | GO:0042627 | chylomicron(GO:0042627) |
| 0.0 | 0.5 | GO:0030175 | filopodium(GO:0030175) |
| 0.0 | 0.2 | GO:0005875 | microtubule associated complex(GO:0005875) |
| 0.0 | 0.2 | GO:0005771 | multivesicular body(GO:0005771) |
| 0.0 | 0.6 | GO:0005834 | heterotrimeric G-protein complex(GO:0005834) |
| 0.0 | 0.4 | GO:0031514 | motile cilium(GO:0031514) |
| 0.0 | 0.2 | GO:0043202 | lysosomal lumen(GO:0043202) |
| 0.0 | 0.1 | GO:0030118 | clathrin coat(GO:0030118) |
| 0.0 | 0.0 | GO:0008385 | IkappaB kinase complex(GO:0008385) |
| 0.0 | 0.3 | GO:0030530 | obsolete heterogeneous nuclear ribonucleoprotein complex(GO:0030530) |
| 0.0 | 0.6 | GO:0022627 | cytosolic small ribosomal subunit(GO:0022627) |
| 0.0 | 0.1 | GO:0005721 | pericentric heterochromatin(GO:0005721) |
| 0.0 | 0.0 | GO:0044462 | external encapsulating structure(GO:0030312) external encapsulating structure part(GO:0044462) |
| 0.0 | 0.1 | GO:0005776 | autophagosome(GO:0005776) |
| 0.0 | 0.2 | GO:0005640 | nuclear outer membrane(GO:0005640) |
| 0.0 | 0.1 | GO:0031143 | pseudopodium(GO:0031143) |
| 0.0 | 0.3 | GO:0005922 | connexon complex(GO:0005922) |
| 0.0 | 0.2 | GO:0005819 | spindle(GO:0005819) |
| 0.0 | 0.1 | GO:0035631 | CD40 receptor complex(GO:0035631) |
| 0.0 | 13.5 | GO:0005730 | nucleolus(GO:0005730) |
| 0.0 | 0.1 | GO:0005797 | Golgi medial cisterna(GO:0005797) |
| 0.0 | 0.1 | GO:0005811 | lipid particle(GO:0005811) |
| 0.0 | 0.0 | GO:0000930 | gamma-tubulin complex(GO:0000930) |
| 0.0 | 0.2 | GO:0035770 | ribonucleoprotein granule(GO:0035770) cytoplasmic ribonucleoprotein granule(GO:0036464) |
| 0.0 | 0.3 | GO:0005892 | acetylcholine-gated channel complex(GO:0005892) |
| 0.0 | 0.2 | GO:0030914 | STAGA complex(GO:0030914) |
| 0.0 | 3.6 | GO:0005759 | mitochondrial matrix(GO:0005759) |
| 0.0 | 0.0 | GO:0000300 | obsolete peripheral to membrane of membrane fraction(GO:0000300) |
| 0.0 | 5.0 | GO:0000139 | Golgi membrane(GO:0000139) |
| 0.0 | 0.0 | GO:0032299 | ribonuclease H2 complex(GO:0032299) |
| 0.0 | 0.4 | GO:0030119 | AP-type membrane coat adaptor complex(GO:0030119) |
| 0.0 | 0.0 | GO:0042272 | nuclear RNA export factor complex(GO:0042272) |
| 0.0 | 0.1 | GO:1902562 | H4/H2A histone acetyltransferase complex(GO:0043189) H4 histone acetyltransferase complex(GO:1902562) |
| 0.0 | 2.0 | GO:0005874 | microtubule(GO:0005874) |
| 0.0 | 0.1 | GO:0031528 | microvillus membrane(GO:0031528) |
| 0.0 | 0.0 | GO:0008282 | ATP-sensitive potassium channel complex(GO:0008282) |
| 0.0 | 0.0 | GO:0044298 | neuronal cell body membrane(GO:0032809) cell body membrane(GO:0044298) |
| 0.0 | 0.1 | GO:0005851 | eukaryotic translation initiation factor 2B complex(GO:0005851) |
| 0.0 | 0.2 | GO:0005605 | basal lamina(GO:0005605) |
| 0.0 | 8.8 | GO:0005739 | mitochondrion(GO:0005739) |
| 0.0 | 0.2 | GO:0000307 | cyclin-dependent protein kinase holoenzyme complex(GO:0000307) |
| 0.0 | 1.0 | GO:0098852 | lysosomal membrane(GO:0005765) lytic vacuole membrane(GO:0098852) |
| 0.0 | 2.2 | GO:0005667 | transcription factor complex(GO:0005667) |
| 0.0 | 0.1 | GO:0032590 | dendrite membrane(GO:0032590) |
| 0.0 | 42.8 | GO:0005634 | nucleus(GO:0005634) |
| 0.0 | 0.0 | GO:0042622 | photoreceptor outer segment membrane(GO:0042622) |
| 0.0 | 0.1 | GO:0001891 | phagocytic cup(GO:0001891) |
| 0.0 | 0.1 | GO:0005587 | collagen type IV trimer(GO:0005587) |
| 0.0 | 0.1 | GO:0045335 | phagocytic vesicle(GO:0045335) |
| 0.0 | 0.1 | GO:0022624 | proteasome accessory complex(GO:0022624) |
| 0.0 | 0.8 | GO:0044440 | endosomal part(GO:0044440) |
| 0.0 | 0.3 | GO:0030139 | endocytic vesicle(GO:0030139) |
| 0.0 | 0.3 | GO:0030426 | growth cone(GO:0030426) |
Gene overrepresentation in molecular function category:
| Log-likelihood per target | Total log-likelihood | Term | Description |
|---|---|---|---|
| 0.3 | 1.0 | GO:0000268 | peroxisome targeting sequence binding(GO:0000268) |
| 0.3 | 0.9 | GO:0019958 | C-X-C chemokine binding(GO:0019958) interleukin-8 binding(GO:0019959) |
| 0.3 | 0.8 | GO:0030172 | troponin C binding(GO:0030172) |
| 0.3 | 1.4 | GO:0003997 | acyl-CoA oxidase activity(GO:0003997) |
| 0.2 | 1.0 | GO:0004470 | malic enzyme activity(GO:0004470) |
| 0.2 | 1.2 | GO:0016717 | oxidoreductase activity, acting on paired donors, with oxidation of a pair of donors resulting in the reduction of molecular oxygen to two molecules of water(GO:0016717) |
| 0.2 | 0.9 | GO:0031014 | troponin T binding(GO:0031014) |
| 0.2 | 0.7 | GO:0004735 | pyrroline-5-carboxylate reductase activity(GO:0004735) |
| 0.2 | 0.6 | GO:0016972 | thiol oxidase activity(GO:0016972) |
| 0.2 | 0.6 | GO:0004687 | myosin light chain kinase activity(GO:0004687) |
| 0.2 | 1.3 | GO:0004887 | thyroid hormone receptor activity(GO:0004887) |
| 0.2 | 0.5 | GO:0047894 | flavonol 3-sulfotransferase activity(GO:0047894) |
| 0.2 | 1.0 | GO:0001965 | G-protein alpha-subunit binding(GO:0001965) |
| 0.2 | 0.5 | GO:0032139 | dinucleotide insertion or deletion binding(GO:0032139) |
| 0.2 | 0.9 | GO:0015165 | pyrimidine nucleotide-sugar transmembrane transporter activity(GO:0015165) |
| 0.1 | 0.6 | GO:0004157 | dihydropyrimidinase activity(GO:0004157) |
| 0.1 | 0.6 | GO:0005148 | prolactin receptor binding(GO:0005148) |
| 0.1 | 0.6 | GO:0005432 | calcium:sodium antiporter activity(GO:0005432) |
| 0.1 | 0.3 | GO:0030899 | calcium-dependent ATPase activity(GO:0030899) |
| 0.1 | 0.4 | GO:0035005 | 1-phosphatidylinositol-4-phosphate 3-kinase activity(GO:0035005) |
| 0.1 | 0.4 | GO:0070326 | very-low-density lipoprotein particle receptor binding(GO:0070326) |
| 0.1 | 0.6 | GO:0008296 | 3'-5'-exodeoxyribonuclease activity(GO:0008296) |
| 0.1 | 0.4 | GO:0001601 | peptide YY receptor activity(GO:0001601) |
| 0.1 | 0.8 | GO:0001640 | adenylate cyclase inhibiting G-protein coupled glutamate receptor activity(GO:0001640) G-protein coupled glutamate receptor activity(GO:0098988) |
| 0.1 | 0.5 | GO:0051425 | PTB domain binding(GO:0051425) |
| 0.1 | 0.4 | GO:0000403 | Y-form DNA binding(GO:0000403) |
| 0.1 | 0.4 | GO:0030343 | vitamin D3 25-hydroxylase activity(GO:0030343) vitamin D 25-hydroxylase activity(GO:0070643) |
| 0.1 | 0.1 | GO:0016361 | activin receptor activity, type I(GO:0016361) activin-activated receptor activity(GO:0017002) |
| 0.1 | 0.3 | GO:0016842 | amidine-lyase activity(GO:0016842) |
| 0.1 | 0.7 | GO:0043237 | laminin-1 binding(GO:0043237) |
| 0.1 | 0.6 | GO:0008266 | poly(U) RNA binding(GO:0008266) |
| 0.1 | 0.4 | GO:0016886 | ligase activity, forming phosphoric ester bonds(GO:0016886) |
| 0.1 | 0.7 | GO:0004726 | non-membrane spanning protein tyrosine phosphatase activity(GO:0004726) |
| 0.1 | 0.6 | GO:0016778 | diphosphotransferase activity(GO:0016778) |
| 0.1 | 0.4 | GO:0005534 | galactose binding(GO:0005534) |
| 0.1 | 0.5 | GO:0034452 | dynactin binding(GO:0034452) |
| 0.1 | 0.3 | GO:0001758 | retinal dehydrogenase activity(GO:0001758) |
| 0.1 | 0.3 | GO:0070215 | obsolete MDM2 binding(GO:0070215) |
| 0.1 | 0.4 | GO:0055103 | ligase regulator activity(GO:0055103) ubiquitin-protein transferase regulator activity(GO:0055106) |
| 0.1 | 0.6 | GO:0042800 | histone methyltransferase activity (H3-K4 specific)(GO:0042800) |
| 0.1 | 1.0 | GO:0004385 | guanylate kinase activity(GO:0004385) |
| 0.1 | 0.1 | GO:0016941 | natriuretic peptide receptor activity(GO:0016941) |
| 0.1 | 0.3 | GO:0017128 | phospholipid scramblase activity(GO:0017128) |
| 0.1 | 0.8 | GO:0015385 | sodium:proton antiporter activity(GO:0015385) |
| 0.1 | 0.2 | GO:0016362 | activin receptor activity, type II(GO:0016362) |
| 0.1 | 0.4 | GO:0003886 | DNA (cytosine-5-)-methyltransferase activity(GO:0003886) |
| 0.1 | 0.4 | GO:0008510 | sodium:bicarbonate symporter activity(GO:0008510) |
| 0.1 | 0.4 | GO:0070700 | BMP receptor binding(GO:0070700) |
| 0.1 | 0.3 | GO:0004351 | glutamate decarboxylase activity(GO:0004351) |
| 0.1 | 0.3 | GO:0035252 | UDP-xylosyltransferase activity(GO:0035252) xylosyltransferase activity(GO:0042285) |
| 0.1 | 0.3 | GO:0004465 | lipoprotein lipase activity(GO:0004465) |
| 0.1 | 0.3 | GO:0047623 | AMP deaminase activity(GO:0003876) adenosine-phosphate deaminase activity(GO:0047623) |
| 0.1 | 0.7 | GO:0017166 | vinculin binding(GO:0017166) |
| 0.1 | 0.2 | GO:0004104 | cholinesterase activity(GO:0004104) |
| 0.1 | 0.2 | GO:0008321 | Ral guanyl-nucleotide exchange factor activity(GO:0008321) |
| 0.1 | 0.4 | GO:0031685 | adenosine receptor binding(GO:0031685) |
| 0.1 | 0.2 | GO:0004060 | arylamine N-acetyltransferase activity(GO:0004060) |
| 0.1 | 0.4 | GO:0052743 | inositol tetrakisphosphate phosphatase activity(GO:0052743) |
| 0.1 | 0.2 | GO:0005294 | neutral L-amino acid secondary active transmembrane transporter activity(GO:0005294) |
| 0.1 | 1.2 | GO:0051721 | protein phosphatase 2A binding(GO:0051721) |
| 0.1 | 0.3 | GO:0019911 | structural constituent of myelin sheath(GO:0019911) |
| 0.1 | 0.2 | GO:0002060 | nucleobase binding(GO:0002054) purine nucleobase binding(GO:0002060) |
| 0.1 | 0.3 | GO:0005030 | neurotrophin receptor activity(GO:0005030) |
| 0.1 | 0.2 | GO:0004814 | arginine-tRNA ligase activity(GO:0004814) |
| 0.1 | 1.4 | GO:0004004 | ATP-dependent RNA helicase activity(GO:0004004) |
| 0.1 | 0.5 | GO:0001784 | phosphotyrosine binding(GO:0001784) |
| 0.1 | 1.2 | GO:0004115 | 3',5'-cyclic-AMP phosphodiesterase activity(GO:0004115) |
| 0.1 | 0.4 | GO:0030306 | ADP-ribosylation factor binding(GO:0030306) |
| 0.1 | 0.3 | GO:0030911 | TPR domain binding(GO:0030911) |
| 0.1 | 1.0 | GO:0000062 | fatty-acyl-CoA binding(GO:0000062) |
| 0.1 | 0.5 | GO:0051378 | serotonin binding(GO:0051378) |
| 0.1 | 0.2 | GO:0042978 | ornithine decarboxylase activator activity(GO:0042978) |
| 0.1 | 0.3 | GO:0004301 | epoxide hydrolase activity(GO:0004301) |
| 0.1 | 0.3 | GO:0001228 | transcription factor activity, RNA polymerase II core promoter proximal region sequence-specific binding(GO:0000982) transcriptional activator activity, RNA polymerase II core promoter proximal region sequence-specific binding(GO:0001077) transcriptional activator activity, RNA polymerase II transcription regulatory region sequence-specific binding(GO:0001228) |
| 0.1 | 0.3 | GO:0001515 | opioid peptide activity(GO:0001515) |
| 0.1 | 0.3 | GO:0004985 | opioid receptor activity(GO:0004985) |
| 0.1 | 0.8 | GO:0045295 | gamma-catenin binding(GO:0045295) |
| 0.1 | 0.3 | GO:0016520 | growth hormone-releasing hormone receptor activity(GO:0016520) |
| 0.1 | 0.3 | GO:0004791 | thioredoxin-disulfide reductase activity(GO:0004791) |
| 0.1 | 0.8 | GO:0005031 | tumor necrosis factor-activated receptor activity(GO:0005031) |
| 0.1 | 0.1 | GO:0016803 | ether hydrolase activity(GO:0016803) |
| 0.1 | 0.2 | GO:0003872 | 6-phosphofructokinase activity(GO:0003872) |
| 0.1 | 0.2 | GO:0033300 | dehydroascorbic acid transporter activity(GO:0033300) |
| 0.1 | 0.7 | GO:0042288 | MHC class I protein binding(GO:0042288) |
| 0.1 | 0.4 | GO:0004709 | MAP kinase kinase kinase activity(GO:0004709) |
| 0.1 | 0.3 | GO:0031821 | G-protein coupled serotonin receptor binding(GO:0031821) |
| 0.1 | 0.8 | GO:0032393 | MHC class I receptor activity(GO:0032393) |
| 0.1 | 0.2 | GO:0008073 | ornithine decarboxylase inhibitor activity(GO:0008073) ornithine decarboxylase regulator activity(GO:0042979) |
| 0.1 | 0.3 | GO:0042153 | obsolete RPTP-like protein binding(GO:0042153) |
| 0.1 | 0.2 | GO:0070735 | protein-glycine ligase activity(GO:0070735) |
| 0.1 | 0.1 | GO:0031418 | L-ascorbic acid binding(GO:0031418) |
| 0.1 | 0.6 | GO:0004526 | ribonuclease P activity(GO:0004526) |
| 0.1 | 0.3 | GO:0008330 | protein tyrosine/threonine phosphatase activity(GO:0008330) |
| 0.1 | 1.0 | GO:0042809 | vitamin D receptor binding(GO:0042809) |
| 0.1 | 0.3 | GO:0035014 | phosphatidylinositol 3-kinase regulator activity(GO:0035014) |
| 0.1 | 0.8 | GO:0004016 | adenylate cyclase activity(GO:0004016) |
| 0.1 | 0.3 | GO:0048156 | tau protein binding(GO:0048156) |
| 0.1 | 0.2 | GO:0016812 | hydrolase activity, acting on carbon-nitrogen (but not peptide) bonds, in cyclic amides(GO:0016812) |
| 0.1 | 0.1 | GO:0031177 | phosphopantetheine binding(GO:0031177) |
| 0.1 | 0.2 | GO:0022889 | L-serine transmembrane transporter activity(GO:0015194) serine transmembrane transporter activity(GO:0022889) |
| 0.1 | 0.5 | GO:0016944 | obsolete RNA polymerase II transcription elongation factor activity(GO:0016944) |
| 0.1 | 0.1 | GO:0005451 | monovalent cation:proton antiporter activity(GO:0005451) |
| 0.1 | 0.2 | GO:0004999 | vasoactive intestinal polypeptide receptor activity(GO:0004999) |
| 0.1 | 0.2 | GO:0003680 | AT DNA binding(GO:0003680) |
| 0.1 | 0.3 | GO:0008020 | G-protein coupled photoreceptor activity(GO:0008020) |
| 0.1 | 0.7 | GO:0008601 | protein phosphatase type 2A regulator activity(GO:0008601) |
| 0.1 | 0.7 | GO:0016805 | dipeptidase activity(GO:0016805) |
| 0.1 | 0.2 | GO:0004740 | pyruvate dehydrogenase (acetyl-transferring) kinase activity(GO:0004740) |
| 0.1 | 0.2 | GO:0080031 | methyl indole-3-acetate esterase activity(GO:0080030) methyl salicylate esterase activity(GO:0080031) methyl jasmonate esterase activity(GO:0080032) |
| 0.1 | 0.4 | GO:0005388 | calcium-transporting ATPase activity(GO:0005388) |
| 0.1 | 0.2 | GO:0019237 | centromeric DNA binding(GO:0019237) |
| 0.1 | 1.6 | GO:0003704 | obsolete specific RNA polymerase II transcription factor activity(GO:0003704) |
| 0.1 | 0.4 | GO:0003688 | DNA replication origin binding(GO:0003688) |
| 0.1 | 0.5 | GO:0030374 | ligand-dependent nuclear receptor transcription coactivator activity(GO:0030374) |
| 0.1 | 0.2 | GO:0008475 | procollagen-lysine 5-dioxygenase activity(GO:0008475) |
| 0.1 | 0.7 | GO:0004198 | calcium-dependent cysteine-type endopeptidase activity(GO:0004198) |
| 0.1 | 2.3 | GO:0004722 | protein serine/threonine phosphatase activity(GO:0004722) |
| 0.1 | 0.2 | GO:0004427 | inorganic diphosphatase activity(GO:0004427) |
| 0.1 | 0.2 | GO:0008898 | S-adenosylmethionine-homocysteine S-methyltransferase activity(GO:0008898) |
| 0.1 | 0.5 | GO:0015924 | mannosyl-oligosaccharide mannosidase activity(GO:0015924) |
| 0.1 | 0.6 | GO:0017069 | snRNA binding(GO:0017069) |
| 0.1 | 0.2 | GO:0004719 | protein-L-isoaspartate (D-aspartate) O-methyltransferase activity(GO:0004719) |
| 0.1 | 0.3 | GO:0004994 | somatostatin receptor activity(GO:0004994) |
| 0.1 | 0.2 | GO:0046975 | histone methyltransferase activity (H3-K36 specific)(GO:0046975) |
| 0.1 | 0.3 | GO:0001517 | N-acetylglucosamine 6-O-sulfotransferase activity(GO:0001517) |
| 0.0 | 0.3 | GO:0070087 | chromo shadow domain binding(GO:0070087) |
| 0.0 | 0.4 | GO:0005149 | interleukin-1 receptor binding(GO:0005149) |
| 0.0 | 0.6 | GO:0070403 | NAD+ binding(GO:0070403) |
| 0.0 | 0.1 | GO:0016774 | phosphotransferase activity, carboxyl group as acceptor(GO:0016774) |
| 0.0 | 2.5 | GO:0004197 | cysteine-type endopeptidase activity(GO:0004197) |
| 0.0 | 0.4 | GO:0016861 | intramolecular oxidoreductase activity, interconverting aldoses and ketoses(GO:0016861) |
| 0.0 | 0.2 | GO:0004064 | arylesterase activity(GO:0004064) |
| 0.0 | 0.8 | GO:0042813 | Wnt-activated receptor activity(GO:0042813) |
| 0.0 | 0.4 | GO:0070628 | proteasome binding(GO:0070628) |
| 0.0 | 0.3 | GO:0004499 | N,N-dimethylaniline monooxygenase activity(GO:0004499) |
| 0.0 | 0.3 | GO:0016857 | racemase and epimerase activity, acting on carbohydrates and derivatives(GO:0016857) |
| 0.0 | 0.3 | GO:0080025 | phosphatidylinositol-3,5-bisphosphate binding(GO:0080025) |
| 0.0 | 0.7 | GO:0043621 | protein self-association(GO:0043621) |
| 0.0 | 0.1 | GO:0005042 | netrin receptor activity(GO:0005042) |
| 0.0 | 0.2 | GO:0003847 | 1-alkyl-2-acetylglycerophosphocholine esterase activity(GO:0003847) |
| 0.0 | 0.0 | GO:0003829 | beta-1,3-galactosyl-O-glycosyl-glycoprotein beta-1,6-N-acetylglucosaminyltransferase activity(GO:0003829) |
| 0.0 | 0.2 | GO:0004904 | interferon receptor activity(GO:0004904) |
| 0.0 | 0.6 | GO:0005546 | phosphatidylinositol-4,5-bisphosphate binding(GO:0005546) |
| 0.0 | 0.1 | GO:0008109 | N-acetyllactosaminide beta-1,6-N-acetylglucosaminyltransferase activity(GO:0008109) |
| 0.0 | 0.2 | GO:0004634 | phosphopyruvate hydratase activity(GO:0004634) |
| 0.0 | 0.1 | GO:0033765 | steroid dehydrogenase activity, acting on the CH-CH group of donors(GO:0033765) |
| 0.0 | 0.1 | GO:0004738 | pyruvate dehydrogenase activity(GO:0004738) pyruvate dehydrogenase (acetyl-transferring) activity(GO:0004739) |
| 0.0 | 0.4 | GO:0003709 | obsolete RNA polymerase III transcription factor activity(GO:0003709) |
| 0.0 | 0.1 | GO:0004966 | galanin receptor activity(GO:0004966) |
| 0.0 | 0.1 | GO:0010485 | H4 histone acetyltransferase activity(GO:0010485) |
| 0.0 | 0.7 | GO:0005547 | phosphatidylinositol-3,4,5-trisphosphate binding(GO:0005547) |
| 0.0 | 0.1 | GO:0050682 | AF-2 domain binding(GO:0050682) |
| 0.0 | 0.3 | GO:0008503 | benzodiazepine receptor activity(GO:0008503) |
| 0.0 | 0.1 | GO:0033829 | O-fucosylpeptide 3-beta-N-acetylglucosaminyltransferase activity(GO:0033829) |
| 0.0 | 0.3 | GO:0030507 | spectrin binding(GO:0030507) |
| 0.0 | 0.2 | GO:0008967 | phosphoglycolate phosphatase activity(GO:0008967) |
| 0.0 | 0.9 | GO:0005484 | SNAP receptor activity(GO:0005484) |
| 0.0 | 0.1 | GO:0050265 | RNA uridylyltransferase activity(GO:0050265) |
| 0.0 | 0.2 | GO:0001085 | RNA polymerase II transcription factor binding(GO:0001085) |
| 0.0 | 0.2 | GO:0008379 | thioredoxin peroxidase activity(GO:0008379) |
| 0.0 | 0.2 | GO:0004897 | ciliary neurotrophic factor receptor activity(GO:0004897) |
| 0.0 | 0.3 | GO:0030676 | Rac guanyl-nucleotide exchange factor activity(GO:0030676) |
| 0.0 | 0.2 | GO:0016907 | G-protein coupled acetylcholine receptor activity(GO:0016907) |
| 0.0 | 0.7 | GO:0003730 | mRNA 3'-UTR binding(GO:0003730) |
| 0.0 | 0.2 | GO:0003986 | acetyl-CoA hydrolase activity(GO:0003986) |
| 0.0 | 0.7 | GO:0016790 | thiolester hydrolase activity(GO:0016790) |
| 0.0 | 0.0 | GO:0008607 | phosphorylase kinase regulator activity(GO:0008607) |
| 0.0 | 0.1 | GO:0030375 | thyroid hormone receptor coactivator activity(GO:0030375) |
| 0.0 | 0.5 | GO:0004143 | diacylglycerol kinase activity(GO:0004143) |
| 0.0 | 0.1 | GO:0003987 | acetate-CoA ligase activity(GO:0003987) |
| 0.0 | 0.6 | GO:0001076 | transcription factor activity, RNA polymerase II transcription factor binding(GO:0001076) RNA polymerase II transcription cofactor activity(GO:0001104) |
| 0.0 | 0.1 | GO:0005275 | amine transmembrane transporter activity(GO:0005275) |
| 0.0 | 0.2 | GO:0004815 | aspartate-tRNA ligase activity(GO:0004815) |
| 0.0 | 0.3 | GO:0030332 | cyclin binding(GO:0030332) |
| 0.0 | 0.1 | GO:0004875 | complement receptor activity(GO:0004875) |
| 0.0 | 0.1 | GO:0035255 | ionotropic glutamate receptor binding(GO:0035255) |
| 0.0 | 0.7 | GO:0004435 | phosphatidylinositol phospholipase C activity(GO:0004435) |
| 0.0 | 0.1 | GO:0005138 | interleukin-6 receptor binding(GO:0005138) |
| 0.0 | 0.0 | GO:0009008 | DNA-methyltransferase activity(GO:0009008) |
| 0.0 | 0.3 | GO:0003993 | acid phosphatase activity(GO:0003993) |
| 0.0 | 0.2 | GO:0042043 | neurexin family protein binding(GO:0042043) |
| 0.0 | 0.4 | GO:0046875 | ephrin receptor binding(GO:0046875) |
| 0.0 | 0.1 | GO:0005220 | inositol 1,4,5-trisphosphate-sensitive calcium-release channel activity(GO:0005220) |
| 0.0 | 0.1 | GO:0008454 | alpha-1,3-mannosylglycoprotein 4-beta-N-acetylglucosaminyltransferase activity(GO:0008454) |
| 0.0 | 0.3 | GO:0008121 | ubiquinol-cytochrome-c reductase activity(GO:0008121) oxidoreductase activity, acting on diphenols and related substances as donors(GO:0016679) oxidoreductase activity, acting on diphenols and related substances as donors, cytochrome as acceptor(GO:0016681) |
| 0.0 | 0.1 | GO:0032266 | phosphatidylinositol-3-phosphate binding(GO:0032266) |
| 0.0 | 0.2 | GO:0046974 | histone methyltransferase activity (H3-K9 specific)(GO:0046974) |
| 0.0 | 0.1 | GO:0030229 | very-low-density lipoprotein particle receptor activity(GO:0030229) |
| 0.0 | 0.5 | GO:0046933 | proton-transporting ATP synthase activity, rotational mechanism(GO:0046933) |
| 0.0 | 0.1 | GO:0043398 | HLH domain binding(GO:0043398) |
| 0.0 | 0.8 | GO:0030528 | obsolete transcription regulator activity(GO:0030528) |
| 0.0 | 0.2 | GO:0015220 | choline transmembrane transporter activity(GO:0015220) |
| 0.0 | 0.3 | GO:0008499 | UDP-galactose:beta-N-acetylglucosamine beta-1,3-galactosyltransferase activity(GO:0008499) |
| 0.0 | 0.3 | GO:0042166 | acetylcholine binding(GO:0042166) |
| 0.0 | 0.1 | GO:0004775 | succinate-CoA ligase (ADP-forming) activity(GO:0004775) |
| 0.0 | 0.1 | GO:0016417 | S-acyltransferase activity(GO:0016417) |
| 0.0 | 0.1 | GO:0047631 | ADP-ribose diphosphatase activity(GO:0047631) |
| 0.0 | 0.1 | GO:0016286 | small conductance calcium-activated potassium channel activity(GO:0016286) |
| 0.0 | 0.8 | GO:0004364 | glutathione transferase activity(GO:0004364) |
| 0.0 | 0.3 | GO:0051879 | Hsp90 protein binding(GO:0051879) |
| 0.0 | 0.1 | GO:0004993 | G-protein coupled serotonin receptor activity(GO:0004993) serotonin receptor activity(GO:0099589) |
| 0.0 | 0.2 | GO:0008432 | JUN kinase binding(GO:0008432) |
| 0.0 | 0.2 | GO:0004826 | phenylalanine-tRNA ligase activity(GO:0004826) |
| 0.0 | 0.0 | GO:0015349 | thyroid hormone transmembrane transporter activity(GO:0015349) |
| 0.0 | 1.0 | GO:0004879 | RNA polymerase II transcription factor activity, ligand-activated sequence-specific DNA binding(GO:0004879) transcription factor activity, direct ligand regulated sequence-specific DNA binding(GO:0098531) |
| 0.0 | 0.7 | GO:0000049 | tRNA binding(GO:0000049) |
| 0.0 | 0.5 | GO:0042162 | telomeric DNA binding(GO:0042162) |
| 0.0 | 0.2 | GO:0004568 | chitinase activity(GO:0004568) |
| 0.0 | 0.0 | GO:0004800 | thyroxine 5'-deiodinase activity(GO:0004800) |
| 0.0 | 0.2 | GO:0005110 | frizzled-2 binding(GO:0005110) |
| 0.0 | 0.7 | GO:0019212 | phosphatase inhibitor activity(GO:0019212) |
| 0.0 | 0.1 | GO:0031404 | chloride ion binding(GO:0031404) |
| 0.0 | 1.7 | GO:0016782 | transferase activity, transferring sulfur-containing groups(GO:0016782) |
| 0.0 | 0.4 | GO:0004065 | arylsulfatase activity(GO:0004065) |
| 0.0 | 0.1 | GO:0070577 | lysine-acetylated histone binding(GO:0070577) |
| 0.0 | 0.3 | GO:0043208 | glycosphingolipid binding(GO:0043208) |
| 0.0 | 0.2 | GO:0070567 | cytidylyltransferase activity(GO:0070567) |
| 0.0 | 0.1 | GO:0008172 | S-methyltransferase activity(GO:0008172) |
| 0.0 | 0.8 | GO:0016831 | carboxy-lyase activity(GO:0016831) |
| 0.0 | 0.1 | GO:0070513 | death domain binding(GO:0070513) |
| 0.0 | 0.6 | GO:0051059 | NF-kappaB binding(GO:0051059) |
| 0.0 | 0.4 | GO:0008519 | ammonium transmembrane transporter activity(GO:0008519) |
| 0.0 | 0.1 | GO:0019888 | protein phosphatase regulator activity(GO:0019888) |
| 0.0 | 0.1 | GO:0003896 | DNA primase activity(GO:0003896) |
| 0.0 | 0.1 | GO:0015038 | glutathione disulfide oxidoreductase activity(GO:0015038) |
| 0.0 | 0.1 | GO:0047184 | 1-acylglycerophosphocholine O-acyltransferase activity(GO:0047184) |
| 0.0 | 0.8 | GO:0008375 | acetylglucosaminyltransferase activity(GO:0008375) |
| 0.0 | 1.2 | GO:0030170 | pyridoxal phosphate binding(GO:0030170) |
| 0.0 | 0.2 | GO:0044390 | ubiquitin conjugating enzyme binding(GO:0031624) ubiquitin-like protein conjugating enzyme binding(GO:0044390) |
| 0.0 | 0.1 | GO:0043422 | protein kinase B binding(GO:0043422) |
| 0.0 | 0.1 | GO:0004706 | JUN kinase kinase kinase activity(GO:0004706) |
| 0.0 | 0.7 | GO:0015459 | potassium channel regulator activity(GO:0015459) |
| 0.0 | 0.1 | GO:0048020 | CCR chemokine receptor binding(GO:0048020) |
| 0.0 | 0.4 | GO:0051184 | cofactor transporter activity(GO:0051184) |
| 0.0 | 0.3 | GO:0000175 | 3'-5'-exoribonuclease activity(GO:0000175) |
| 0.0 | 0.2 | GO:0031491 | nucleosome binding(GO:0031491) |
| 0.0 | 0.1 | GO:0008483 | transaminase activity(GO:0008483) |
| 0.0 | 1.1 | GO:0003697 | single-stranded DNA binding(GO:0003697) |
| 0.0 | 0.1 | GO:0004677 | DNA-dependent protein kinase activity(GO:0004677) |
| 0.0 | 0.2 | GO:0030274 | LIM domain binding(GO:0030274) |
| 0.0 | 0.3 | GO:0031593 | polyubiquitin binding(GO:0031593) |
| 0.0 | 0.1 | GO:0005087 | Ran guanyl-nucleotide exchange factor activity(GO:0005087) |
| 0.0 | 0.1 | GO:0052650 | NADP-retinol dehydrogenase activity(GO:0052650) |
| 0.0 | 0.3 | GO:0030276 | clathrin binding(GO:0030276) |
| 0.0 | 0.1 | GO:0030346 | protein phosphatase 2B binding(GO:0030346) |
| 0.0 | 0.1 | GO:0004045 | aminoacyl-tRNA hydrolase activity(GO:0004045) |
| 0.0 | 0.3 | GO:0003906 | DNA-(apurinic or apyrimidinic site) lyase activity(GO:0003906) |
| 0.0 | 0.6 | GO:0016709 | oxidoreductase activity, acting on paired donors, with incorporation or reduction of molecular oxygen, NAD(P)H as one donor, and incorporation of one atom of oxygen(GO:0016709) |
| 0.0 | 0.1 | GO:0019211 | phosphatase activator activity(GO:0019211) |
| 0.0 | 0.1 | GO:0035259 | glucocorticoid receptor binding(GO:0035259) |
| 0.0 | 0.9 | GO:0003682 | chromatin binding(GO:0003682) |
| 0.0 | 0.1 | GO:0016623 | oxidoreductase activity, acting on the aldehyde or oxo group of donors, oxygen as acceptor(GO:0016623) |
| 0.0 | 0.2 | GO:0008175 | tRNA methyltransferase activity(GO:0008175) |
| 0.0 | 0.2 | GO:0005522 | profilin binding(GO:0005522) |
| 0.0 | 0.2 | GO:0005123 | death receptor binding(GO:0005123) |
| 0.0 | 0.1 | GO:0019136 | deoxynucleoside kinase activity(GO:0019136) |
| 0.0 | 0.9 | GO:0016763 | transferase activity, transferring pentosyl groups(GO:0016763) |
| 0.0 | 0.1 | GO:0043274 | phospholipase binding(GO:0043274) |
| 0.0 | 2.2 | GO:0016566 | obsolete specific transcriptional repressor activity(GO:0016566) |
| 0.0 | 0.1 | GO:0008853 | exodeoxyribonuclease III activity(GO:0008853) |
| 0.0 | 0.5 | GO:0005242 | inward rectifier potassium channel activity(GO:0005242) |
| 0.0 | 0.0 | GO:0043176 | amine binding(GO:0043176) |
| 0.0 | 0.2 | GO:0042826 | histone deacetylase binding(GO:0042826) |
| 0.0 | 0.2 | GO:0017049 | GTP-Rho binding(GO:0017049) |
| 0.0 | 0.2 | GO:0050733 | RS domain binding(GO:0050733) |
| 0.0 | 0.1 | GO:0050811 | GABA receptor binding(GO:0050811) |
| 0.0 | 0.1 | GO:0034190 | apolipoprotein receptor binding(GO:0034190) |
| 0.0 | 0.1 | GO:0004127 | cytidylate kinase activity(GO:0004127) |
| 0.0 | 0.1 | GO:0005176 | ErbB-2 class receptor binding(GO:0005176) |
| 0.0 | 0.1 | GO:0045118 | azole transporter activity(GO:0045118) azole transmembrane transporter activity(GO:1901474) |
| 0.0 | 0.6 | GO:0010843 | obsolete promoter binding(GO:0010843) |
| 0.0 | 0.2 | GO:0015464 | acetylcholine receptor activity(GO:0015464) |
| 0.0 | 0.2 | GO:0019864 | IgG binding(GO:0019864) |
| 0.0 | 0.1 | GO:0003917 | DNA topoisomerase type I activity(GO:0003917) |
| 0.0 | 0.1 | GO:0017112 | Rab guanyl-nucleotide exchange factor activity(GO:0017112) |
| 0.0 | 0.6 | GO:0005158 | insulin receptor binding(GO:0005158) |
| 0.0 | 0.1 | GO:0004528 | phosphodiesterase I activity(GO:0004528) |
| 0.0 | 0.6 | GO:0019003 | GDP binding(GO:0019003) |
| 0.0 | 0.2 | GO:0030515 | snoRNA binding(GO:0030515) |
| 0.0 | 0.1 | GO:0070492 | oligosaccharide binding(GO:0070492) |
| 0.0 | 0.2 | GO:0042301 | phosphate ion binding(GO:0042301) |
| 0.0 | 0.4 | GO:0048487 | beta-tubulin binding(GO:0048487) |
| 0.0 | 0.1 | GO:0050998 | nitric-oxide synthase binding(GO:0050998) |
| 0.0 | 0.1 | GO:0005143 | interleukin-12 receptor binding(GO:0005143) |
| 0.0 | 0.2 | GO:0035381 | extracellular ATP-gated cation channel activity(GO:0004931) ATP-gated ion channel activity(GO:0035381) |
| 0.0 | 0.3 | GO:0033549 | MAP kinase phosphatase activity(GO:0033549) |
| 0.0 | 1.0 | GO:0005070 | SH3/SH2 adaptor activity(GO:0005070) |
| 0.0 | 0.0 | GO:0000405 | bubble DNA binding(GO:0000405) |
| 0.0 | 0.1 | GO:0017056 | structural constituent of nuclear pore(GO:0017056) |
| 0.0 | 0.0 | GO:0008301 | DNA binding, bending(GO:0008301) |
| 0.0 | 0.0 | GO:0030548 | acetylcholine receptor regulator activity(GO:0030548) neurotransmitter receptor regulator activity(GO:0099602) |
| 0.0 | 0.1 | GO:0009922 | fatty acid elongase activity(GO:0009922) |
| 0.0 | 0.4 | GO:0004012 | phospholipid-translocating ATPase activity(GO:0004012) |
| 0.0 | 0.2 | GO:0004859 | phospholipase inhibitor activity(GO:0004859) |
| 0.0 | 0.1 | GO:0005346 | purine ribonucleotide transmembrane transporter activity(GO:0005346) |
| 0.0 | 0.2 | GO:0003785 | actin monomer binding(GO:0003785) |
| 0.0 | 0.1 | GO:0004652 | polynucleotide adenylyltransferase activity(GO:0004652) |
| 0.0 | 1.2 | GO:0003690 | double-stranded DNA binding(GO:0003690) |
| 0.0 | 0.1 | GO:0000293 | ferric-chelate reductase activity(GO:0000293) |
| 0.0 | 0.1 | GO:0015142 | citrate transmembrane transporter activity(GO:0015137) tricarboxylic acid transmembrane transporter activity(GO:0015142) |
| 0.0 | 0.1 | GO:0004028 | 3-chloroallyl aldehyde dehydrogenase activity(GO:0004028) |
| 0.0 | 0.1 | GO:0016165 | linoleate 13S-lipoxygenase activity(GO:0016165) |
| 0.0 | 0.1 | GO:0000900 | translation repressor activity, nucleic acid binding(GO:0000900) |
| 0.0 | 0.2 | GO:0016868 | intramolecular transferase activity, phosphotransferases(GO:0016868) |
| 0.0 | 0.1 | GO:0008443 | phosphofructokinase activity(GO:0008443) |
| 0.0 | 0.2 | GO:0003711 | obsolete transcription elongation regulator activity(GO:0003711) |
| 0.0 | 0.1 | GO:0004430 | 1-phosphatidylinositol 4-kinase activity(GO:0004430) |
| 0.0 | 2.1 | GO:0000287 | magnesium ion binding(GO:0000287) |
| 0.0 | 0.1 | GO:0004532 | exoribonuclease activity(GO:0004532) |
| 0.0 | 0.2 | GO:0008430 | selenium binding(GO:0008430) |
| 0.0 | 0.1 | GO:0047555 | 3',5'-cyclic-GMP phosphodiesterase activity(GO:0047555) |
| 0.0 | 0.2 | GO:0003899 | DNA-directed RNA polymerase activity(GO:0003899) RNA polymerase activity(GO:0034062) |
| 0.0 | 0.1 | GO:0008242 | omega peptidase activity(GO:0008242) |
| 0.0 | 0.1 | GO:0001530 | lipopolysaccharide binding(GO:0001530) |
| 0.0 | 1.0 | GO:0003743 | translation initiation factor activity(GO:0003743) |
| 0.0 | 0.1 | GO:0008526 | phosphatidylinositol transporter activity(GO:0008526) |
| 0.0 | 0.1 | GO:0004340 | glucokinase activity(GO:0004340) |
| 0.0 | 1.7 | GO:0017124 | SH3 domain binding(GO:0017124) |
| 0.0 | 0.1 | GO:0016724 | ferroxidase activity(GO:0004322) oxidoreductase activity, oxidizing metal ions, oxygen as acceptor(GO:0016724) |
| 0.0 | 0.1 | GO:0016309 | 1-phosphatidylinositol-5-phosphate 4-kinase activity(GO:0016309) |
| 0.0 | 0.2 | GO:0051018 | protein kinase A binding(GO:0051018) |
| 0.0 | 0.9 | GO:0016655 | oxidoreductase activity, acting on NAD(P)H, quinone or similar compound as acceptor(GO:0016655) |
| 0.0 | 0.6 | GO:0008028 | monocarboxylic acid transmembrane transporter activity(GO:0008028) |
| 0.0 | 0.4 | GO:0046332 | SMAD binding(GO:0046332) |
| 0.0 | 0.1 | GO:0008253 | 5'-nucleotidase activity(GO:0008253) |
| 0.0 | 0.1 | GO:0008469 | histone-arginine N-methyltransferase activity(GO:0008469) |
| 0.0 | 0.4 | GO:0004298 | threonine-type endopeptidase activity(GO:0004298) threonine-type peptidase activity(GO:0070003) |
| 0.0 | 0.0 | GO:0043140 | ATP-dependent 3'-5' DNA helicase activity(GO:0043140) |
| 0.0 | 0.4 | GO:0002020 | protease binding(GO:0002020) |
| 0.0 | 0.2 | GO:0070888 | E-box binding(GO:0070888) |
| 0.0 | 0.1 | GO:0008131 | primary amine oxidase activity(GO:0008131) |
| 0.0 | 0.0 | GO:0008157 | protein phosphatase 1 binding(GO:0008157) |
| 0.0 | 0.1 | GO:0016715 | dopamine beta-monooxygenase activity(GO:0004500) oxidoreductase activity, acting on paired donors, with incorporation or reduction of molecular oxygen, reduced ascorbate as one donor, and incorporation of one atom of oxygen(GO:0016715) |
| 0.0 | 0.1 | GO:0030020 | extracellular matrix structural constituent conferring tensile strength(GO:0030020) |
| 0.0 | 0.0 | GO:0001849 | complement component C1q binding(GO:0001849) |
| 0.0 | 0.2 | GO:0017022 | myosin binding(GO:0017022) |
| 0.0 | 0.2 | GO:0008641 | small protein activating enzyme activity(GO:0008641) |
| 0.0 | 0.2 | GO:0015929 | hexosaminidase activity(GO:0015929) |
| 0.0 | 0.1 | GO:0035198 | miRNA binding(GO:0035198) |
| 0.0 | 0.5 | GO:0004812 | aminoacyl-tRNA ligase activity(GO:0004812) ligase activity, forming carbon-oxygen bonds(GO:0016875) ligase activity, forming aminoacyl-tRNA and related compounds(GO:0016876) |
| 0.0 | 1.8 | GO:0004222 | metalloendopeptidase activity(GO:0004222) |
| 0.0 | 0.1 | GO:0015925 | galactosidase activity(GO:0015925) |
| 0.0 | 0.1 | GO:0015643 | toxic substance binding(GO:0015643) |
| 0.0 | 0.3 | GO:0050699 | WW domain binding(GO:0050699) |
| 0.0 | 0.1 | GO:0016174 | NAD(P)H oxidase activity(GO:0016174) |
| 0.0 | 0.1 | GO:0008318 | protein prenyltransferase activity(GO:0008318) |
| 0.0 | 0.1 | GO:0004691 | cAMP-dependent protein kinase activity(GO:0004691) |
| 0.0 | 0.1 | GO:0004668 | protein-arginine deiminase activity(GO:0004668) |
| 0.0 | 0.1 | GO:0005000 | vasopressin receptor activity(GO:0005000) |
| 0.0 | 0.1 | GO:0004720 | protein-lysine 6-oxidase activity(GO:0004720) |
| 0.0 | 0.0 | GO:0008327 | methyl-CpG binding(GO:0008327) |
| 0.0 | 0.1 | GO:0034185 | apolipoprotein binding(GO:0034185) |
| 0.0 | 3.2 | GO:0004842 | ubiquitin-protein transferase activity(GO:0004842) |
| 0.0 | 0.5 | GO:0004540 | ribonuclease activity(GO:0004540) |
| 0.0 | 0.5 | GO:0003725 | double-stranded RNA binding(GO:0003725) |
| 0.0 | 0.2 | GO:0016878 | acid-thiol ligase activity(GO:0016878) |
| 0.0 | 0.1 | GO:0008174 | mRNA methyltransferase activity(GO:0008174) |
| 0.0 | 0.3 | GO:0017137 | Rab GTPase binding(GO:0017137) |
| 0.0 | 0.0 | GO:0016565 | obsolete general transcriptional repressor activity(GO:0016565) |
| 0.0 | 0.0 | GO:0016668 | oxidoreductase activity, acting on a sulfur group of donors, NAD(P) as acceptor(GO:0016668) |
| 0.0 | 0.1 | GO:0017025 | TBP-class protein binding(GO:0017025) |
| 0.0 | 0.1 | GO:0016813 | hydrolase activity, acting on carbon-nitrogen (but not peptide) bonds, in linear amidines(GO:0016813) |
| 0.0 | 0.1 | GO:0004983 | neuropeptide Y receptor activity(GO:0004983) |
| 0.0 | 0.1 | GO:0043548 | phosphatidylinositol 3-kinase binding(GO:0043548) |
| 0.0 | 0.0 | GO:0034648 | histone demethylase activity (H3-K4 specific)(GO:0032453) histone demethylase activity (H3-dimethyl-K4 specific)(GO:0034648) |
| 0.0 | 0.2 | GO:0004383 | guanylate cyclase activity(GO:0004383) |
| 0.0 | 0.1 | GO:0008139 | nuclear localization sequence binding(GO:0008139) |
| 0.0 | 0.3 | GO:0016765 | transferase activity, transferring alkyl or aryl (other than methyl) groups(GO:0016765) |
| 0.0 | 0.1 | GO:0004579 | dolichyl-diphosphooligosaccharide-protein glycotransferase activity(GO:0004579) |
| 0.0 | 0.1 | GO:0016303 | 1-phosphatidylinositol-3-kinase activity(GO:0016303) |
| 0.0 | 0.0 | GO:0016615 | malate dehydrogenase activity(GO:0016615) |
| 0.0 | 0.2 | GO:0005527 | macrolide binding(GO:0005527) FK506 binding(GO:0005528) |
| 0.0 | 0.0 | GO:0004300 | enoyl-CoA hydratase activity(GO:0004300) |
| 0.0 | 0.9 | GO:0005089 | Rho guanyl-nucleotide exchange factor activity(GO:0005089) |
| 0.0 | 0.1 | GO:0051219 | phosphoprotein binding(GO:0051219) |
| 0.0 | 0.3 | GO:0008144 | drug binding(GO:0008144) |
| 0.0 | 4.3 | GO:0005525 | GTP binding(GO:0005525) |
| 0.0 | 0.0 | GO:0070016 | armadillo repeat domain binding(GO:0070016) |
| 0.0 | 0.2 | GO:0019787 | ubiquitin-like protein transferase activity(GO:0019787) |
| 0.0 | 10.7 | GO:0003700 | transcription factor activity, sequence-specific DNA binding(GO:0003700) |
| 0.0 | 0.3 | GO:0008373 | sialyltransferase activity(GO:0008373) |
| 0.0 | 3.0 | GO:0030695 | GTPase regulator activity(GO:0030695) |
| 0.0 | 0.0 | GO:0042975 | peroxisome proliferator activated receptor binding(GO:0042975) |
| 0.0 | 0.1 | GO:0004596 | peptide alpha-N-acetyltransferase activity(GO:0004596) |
| 0.0 | 0.0 | GO:0005548 | phospholipid transporter activity(GO:0005548) |
| 0.0 | 0.2 | GO:0005247 | voltage-gated chloride channel activity(GO:0005247) |
| 0.0 | 0.0 | GO:0070491 | repressing transcription factor binding(GO:0070491) |
| 0.0 | 0.1 | GO:0005521 | lamin binding(GO:0005521) |
| 0.0 | 0.0 | GO:0015018 | galactosylgalactosylxylosylprotein 3-beta-glucuronosyltransferase activity(GO:0015018) |
| 0.0 | 0.6 | GO:0016407 | acetyltransferase activity(GO:0016407) |
| 0.0 | 0.0 | GO:0001071 | nucleic acid binding transcription factor activity(GO:0001071) |
| 0.0 | 0.1 | GO:0019200 | carbohydrate kinase activity(GO:0019200) |
| 0.0 | 0.0 | GO:0031705 | bombesin receptor binding(GO:0031705) endothelin B receptor binding(GO:0031708) |
| 0.0 | 0.1 | GO:0016175 | superoxide-generating NADPH oxidase activity(GO:0016175) |
| 0.0 | 0.0 | GO:0047045 | testosterone 17-beta-dehydrogenase (NADP+) activity(GO:0047045) |
| 0.0 | 0.0 | GO:0016312 | inositol bisphosphate phosphatase activity(GO:0016312) |
| 0.0 | 0.2 | GO:0001540 | beta-amyloid binding(GO:0001540) |
| 0.0 | 0.2 | GO:0005003 | ephrin receptor activity(GO:0005003) |
| 0.0 | 0.1 | GO:0004033 | aldo-keto reductase (NADP) activity(GO:0004033) |
| 0.0 | 0.2 | GO:0005080 | protein kinase C binding(GO:0005080) |
| 0.0 | 0.4 | GO:0016811 | hydrolase activity, acting on carbon-nitrogen (but not peptide) bonds, in linear amides(GO:0016811) |
| 0.0 | 0.6 | GO:0005506 | iron ion binding(GO:0005506) |
| 0.0 | 0.0 | GO:0004694 | eukaryotic translation initiation factor 2alpha kinase activity(GO:0004694) |
| 0.0 | 0.2 | GO:0005487 | nucleocytoplasmic transporter activity(GO:0005487) |
| 0.0 | 0.1 | GO:0042169 | SH2 domain binding(GO:0042169) |
| 0.0 | 0.0 | GO:0031013 | troponin I binding(GO:0031013) |
| 0.0 | 0.1 | GO:0017046 | peptide hormone binding(GO:0017046) |
| 0.0 | 0.0 | GO:0032405 | MutLalpha complex binding(GO:0032405) |
| 0.0 | 0.1 | GO:0005112 | Notch binding(GO:0005112) |
| 0.0 | 0.3 | GO:0003729 | mRNA binding(GO:0003729) poly(A) RNA binding(GO:0044822) |
| 0.0 | 0.1 | GO:0030169 | low-density lipoprotein particle binding(GO:0030169) |
| 0.0 | 0.0 | GO:0016893 | endonuclease activity, active with either ribo- or deoxyribonucleic acids and producing 5'-phosphomonoesters(GO:0016893) |
| 0.0 | 0.1 | GO:0019903 | protein phosphatase binding(GO:0019903) |
| 0.0 | 0.0 | GO:0036002 | pre-mRNA binding(GO:0036002) |
| 0.0 | 0.0 | GO:0004367 | glycerol-3-phosphate dehydrogenase [NAD+] activity(GO:0004367) |
| 0.0 | 0.3 | GO:0016712 | oxidoreductase activity, acting on paired donors, with incorporation or reduction of molecular oxygen, reduced flavin or flavoprotein as one donor, and incorporation of one atom of oxygen(GO:0016712) aromatase activity(GO:0070330) |
| 0.0 | 0.0 | GO:0017108 | 5'-flap endonuclease activity(GO:0017108) |
| 0.0 | 0.3 | GO:0004869 | cysteine-type endopeptidase inhibitor activity(GO:0004869) |
| 0.0 | 0.0 | GO:0004949 | cannabinoid receptor activity(GO:0004949) |
| 0.0 | 0.0 | GO:0004000 | adenosine deaminase activity(GO:0004000) |
| 0.0 | 11.2 | GO:0003677 | DNA binding(GO:0003677) |
| 0.0 | 0.1 | GO:0031419 | cobalamin binding(GO:0031419) |
| 0.0 | 0.0 | GO:0008568 | microtubule-severing ATPase activity(GO:0008568) |
| 0.0 | 0.2 | GO:0016628 | oxidoreductase activity, acting on the CH-CH group of donors, NAD or NADP as acceptor(GO:0016628) |
| 0.0 | 0.0 | GO:0004607 | phosphatidylcholine-sterol O-acyltransferase activity(GO:0004607) |
| 0.0 | 0.1 | GO:0005328 | neurotransmitter:sodium symporter activity(GO:0005328) |
| 0.0 | 0.0 | GO:0004911 | interleukin-2 receptor activity(GO:0004911) |
| 0.0 | 0.0 | GO:0008159 | obsolete positive transcription elongation factor activity(GO:0008159) |
| 0.0 | 0.0 | GO:0070742 | C2H2 zinc finger domain binding(GO:0070742) |
| 0.0 | 0.0 | GO:0004995 | tachykinin receptor activity(GO:0004995) |
Gene overrepresentation in curated gene sets: canonical pathways category:
| Log-likelihood per target | Total log-likelihood | Term | Description |
|---|---|---|---|
| 0.1 | 0.1 | SIG BCR SIGNALING PATHWAY | Members of the BCR signaling pathway |
| 0.1 | 2.7 | PID IL2 PI3K PATHWAY | IL2 signaling events mediated by PI3K |
| 0.1 | 2.3 | SIG PIP3 SIGNALING IN B LYMPHOCYTES | Genes related to PIP3 signaling in B lymphocytes |
| 0.1 | 1.8 | PID IL8 CXCR2 PATHWAY | IL8- and CXCR2-mediated signaling events |
| 0.1 | 2.6 | PID PLK1 PATHWAY | PLK1 signaling events |
| 0.1 | 2.1 | SIG REGULATION OF THE ACTIN CYTOSKELETON BY RHO GTPASES | Genes related to regulation of the actin cytoskeleton |
| 0.1 | 1.1 | PID GLYPICAN 1PATHWAY | Glypican 1 network |
| 0.1 | 0.8 | PID P38 ALPHA BETA PATHWAY | Regulation of p38-alpha and p38-beta |
| 0.1 | 0.3 | PID S1P S1P1 PATHWAY | S1P1 pathway |
| 0.1 | 1.1 | SA CASPASE CASCADE | Apoptosis is mediated by caspases, cysteine proteases arranged in a proteolytic cascade. |
| 0.1 | 0.5 | ST INTERFERON GAMMA PATHWAY | Interferon gamma pathway. |
| 0.1 | 0.8 | PID LPA4 PATHWAY | LPA4-mediated signaling events |
| 0.1 | 1.9 | PID LYSOPHOSPHOLIPID PATHWAY | LPA receptor mediated events |
| 0.0 | 0.1 | PID CD8 TCR DOWNSTREAM PATHWAY | Downstream signaling in naïve CD8+ T cells |
| 0.0 | 1.2 | PID ERBB1 INTERNALIZATION PATHWAY | Internalization of ErbB1 |
| 0.0 | 0.9 | PID RET PATHWAY | Signaling events regulated by Ret tyrosine kinase |
| 0.0 | 1.1 | PID TAP63 PATHWAY | Validated transcriptional targets of TAp63 isoforms |
| 0.0 | 0.1 | SA FAS SIGNALING | The TNF-type receptor Fas induces apoptosis on ligand binding. |
| 0.0 | 0.0 | PID MAPK TRK PATHWAY | Trk receptor signaling mediated by the MAPK pathway |
| 0.0 | 0.4 | PID IL2 1PATHWAY | IL2-mediated signaling events |
| 0.0 | 1.9 | PID IL12 2PATHWAY | IL12-mediated signaling events |
| 0.0 | 0.7 | PID SYNDECAN 4 PATHWAY | Syndecan-4-mediated signaling events |
| 0.0 | 0.1 | PID BETA CATENIN DEG PATHWAY | Degradation of beta catenin |
| 0.0 | 0.2 | SIG CHEMOTAXIS | Genes related to chemotaxis |
| 0.0 | 0.4 | PID RANBP2 PATHWAY | Sumoylation by RanBP2 regulates transcriptional repression |
| 0.0 | 1.1 | PID FAK PATHWAY | Signaling events mediated by focal adhesion kinase |
| 0.0 | 0.0 | PID NFKAPPAB CANONICAL PATHWAY | Canonical NF-kappaB pathway |
| 0.0 | 0.4 | PID ANTHRAX PATHWAY | Cellular roles of Anthrax toxin |
| 0.0 | 1.6 | PID DELTA NP63 PATHWAY | Validated transcriptional targets of deltaNp63 isoforms |
| 0.0 | 0.1 | SA G2 AND M PHASES | Cdc25 activates the cdc2/cyclin B complex to induce the G2/M transition. |
| 0.0 | 1.2 | PID HES HEY PATHWAY | Notch-mediated HES/HEY network |
| 0.0 | 0.6 | PID ANGIOPOIETIN RECEPTOR PATHWAY | Angiopoietin receptor Tie2-mediated signaling |
| 0.0 | 0.8 | PID HDAC CLASSII PATHWAY | Signaling events mediated by HDAC Class II |
| 0.0 | 0.8 | PID CDC42 REG PATHWAY | Regulation of CDC42 activity |
| 0.0 | 0.6 | PID RAS PATHWAY | Regulation of Ras family activation |
| 0.0 | 0.1 | PID SMAD2 3PATHWAY | Regulation of cytoplasmic and nuclear SMAD2/3 signaling |
| 0.0 | 0.3 | PID ATR PATHWAY | ATR signaling pathway |
| 0.0 | 0.5 | PID TGFBR PATHWAY | TGF-beta receptor signaling |
| 0.0 | 0.3 | PID P38 MK2 PATHWAY | p38 signaling mediated by MAPKAP kinases |
| 0.0 | 1.5 | PID P73PATHWAY | p73 transcription factor network |
| 0.0 | 0.8 | PID AURORA B PATHWAY | Aurora B signaling |
| 0.0 | 0.3 | PID ECADHERIN KERATINOCYTE PATHWAY | E-cadherin signaling in keratinocytes |
| 0.0 | 0.2 | SA PROGRAMMED CELL DEATH | Programmed cell death, or apoptosis, eliminates damaged or unneeded cells. |
| 0.0 | 0.8 | PID TCR PATHWAY | TCR signaling in naïve CD4+ T cells |
| 0.0 | 0.7 | PID ERBB1 DOWNSTREAM PATHWAY | ErbB1 downstream signaling |
| 0.0 | 0.5 | PID HIF2PATHWAY | HIF-2-alpha transcription factor network |
| 0.0 | 0.1 | ST IL 13 PATHWAY | Interleukin 13 (IL-13) Pathway |
| 0.0 | 0.6 | PID CDC42 PATHWAY | CDC42 signaling events |
| 0.0 | 0.4 | PID CIRCADIAN PATHWAY | Circadian rhythm pathway |
| 0.0 | 0.1 | PID CERAMIDE PATHWAY | Ceramide signaling pathway |
| 0.0 | 0.5 | PID SMAD2 3NUCLEAR PATHWAY | Regulation of nuclear SMAD2/3 signaling |
| 0.0 | 0.9 | PID FANCONI PATHWAY | Fanconi anemia pathway |
| 0.0 | 0.1 | PID PDGFRA PATHWAY | PDGFR-alpha signaling pathway |
| 0.0 | 0.3 | PID INSULIN GLUCOSE PATHWAY | Insulin-mediated glucose transport |
| 0.0 | 0.1 | ST GRANULE CELL SURVIVAL PATHWAY | Granule Cell Survival Pathway is a specific case of more general PAC1 Receptor Pathway. |
| 0.0 | 0.3 | PID ATM PATHWAY | ATM pathway |
| 0.0 | 0.3 | PID ERB GENOMIC PATHWAY | Validated nuclear estrogen receptor beta network |
| 0.0 | 0.0 | PID WNT NONCANONICAL PATHWAY | Noncanonical Wnt signaling pathway |
| 0.0 | 0.8 | PID MYC REPRESS PATHWAY | Validated targets of C-MYC transcriptional repression |
| 0.0 | 0.2 | PID IFNG PATHWAY | IFN-gamma pathway |
| 0.0 | 0.3 | PID BCR 5PATHWAY | BCR signaling pathway |
| 0.0 | 0.6 | PID HNF3A PATHWAY | FOXA1 transcription factor network |
| 0.0 | 0.2 | PID LIS1 PATHWAY | Lissencephaly gene (LIS1) in neuronal migration and development |
| 0.0 | 0.7 | PID BMP PATHWAY | BMP receptor signaling |
| 0.0 | 0.3 | PID AJDISS 2PATHWAY | Posttranslational regulation of adherens junction stability and dissassembly |
| 0.0 | 0.6 | PID TELOMERASE PATHWAY | Regulation of Telomerase |
| 0.0 | 0.1 | PID ALK2 PATHWAY | ALK2 signaling events |
| 0.0 | 0.1 | PID TRAIL PATHWAY | TRAIL signaling pathway |
| 0.0 | 0.1 | PID NFKAPPAB ATYPICAL PATHWAY | Atypical NF-kappaB pathway |
| 0.0 | 0.3 | PID NCADHERIN PATHWAY | N-cadherin signaling events |
| 0.0 | 0.2 | PID EPHB FWD PATHWAY | EPHB forward signaling |
| 0.0 | 0.7 | PID P75 NTR PATHWAY | p75(NTR)-mediated signaling |
| 0.0 | 0.1 | PID NFAT TFPATHWAY | Calcineurin-regulated NFAT-dependent transcription in lymphocytes |
| 0.0 | 0.4 | PID E2F PATHWAY | E2F transcription factor network |
| 0.0 | 0.2 | SA MMP CYTOKINE CONNECTION | Cytokines can induce activation of matrix metalloproteinases, which degrade extracellular matrix. |
| 0.0 | 0.3 | PID CASPASE PATHWAY | Caspase cascade in apoptosis |
| 0.0 | 0.2 | PID VEGFR1 2 PATHWAY | Signaling events mediated by VEGFR1 and VEGFR2 |
| 0.0 | 0.9 | PID MYC ACTIV PATHWAY | Validated targets of C-MYC transcriptional activation |
| 0.0 | 0.0 | PID AVB3 OPN PATHWAY | Osteopontin-mediated events |
| 0.0 | 0.2 | PID FOXM1 PATHWAY | FOXM1 transcription factor network |
| 0.0 | 0.0 | ST GA13 PATHWAY | G alpha 13 Pathway |
| 0.0 | 0.1 | ST WNT CA2 CYCLIC GMP PATHWAY | Wnt/Ca2+/cyclic GMP signaling. |
| 0.0 | 0.1 | SA REG CASCADE OF CYCLIN EXPR | Expression of cyclins regulates progression through the cell cycle by activating cyclin-dependent kinases. |
| 0.0 | 0.2 | PID ALPHA SYNUCLEIN PATHWAY | Alpha-synuclein signaling |
| 0.0 | 0.1 | ST PHOSPHOINOSITIDE 3 KINASE PATHWAY | PI3K Pathway |
| 0.0 | 0.1 | PID MET PATHWAY | Signaling events mediated by Hepatocyte Growth Factor Receptor (c-Met) |
| 0.0 | 0.1 | ST T CELL SIGNAL TRANSDUCTION | T Cell Signal Transduction |
| 0.0 | 0.0 | PID HIV NEF PATHWAY | HIV-1 Nef: Negative effector of Fas and TNF-alpha |
| 0.0 | 0.0 | SA G1 AND S PHASES | Cdk2, 4, and 6 bind cyclin D in G1, while cdk2/cyclin E promotes the G1/S transition. |
| 0.0 | 0.1 | PID P38 MKK3 6PATHWAY | p38 MAPK signaling pathway |
| 0.0 | 0.1 | PID TCR CALCIUM PATHWAY | Calcium signaling in the CD4+ TCR pathway |
| 0.0 | 0.1 | PID GMCSF PATHWAY | GMCSF-mediated signaling events |
Gene overrepresentation in curated gene sets: REACTOME pathways category:
| Log-likelihood per target | Total log-likelihood | Term | Description |
|---|---|---|---|
| 0.1 | 0.3 | REACTOME PD1 SIGNALING | Genes involved in PD-1 signaling |
| 0.1 | 1.0 | REACTOME ALPHA LINOLENIC ACID ALA METABOLISM | Genes involved in alpha-linolenic acid (ALA) metabolism |
| 0.1 | 0.9 | REACTOME ADENYLATE CYCLASE ACTIVATING PATHWAY | Genes involved in Adenylate cyclase activating pathway |
| 0.1 | 1.1 | REACTOME SIGNAL REGULATORY PROTEIN SIRP FAMILY INTERACTIONS | Genes involved in Signal regulatory protein (SIRP) family interactions |
| 0.1 | 1.6 | REACTOME POST CHAPERONIN TUBULIN FOLDING PATHWAY | Genes involved in Post-chaperonin tubulin folding pathway |
| 0.1 | 0.6 | REACTOME REGULATION OF THE FANCONI ANEMIA PATHWAY | Genes involved in Regulation of the Fanconi anemia pathway |
| 0.1 | 0.9 | REACTOME THE NLRP3 INFLAMMASOME | Genes involved in The NLRP3 inflammasome |
| 0.1 | 0.5 | REACTOME SPRY REGULATION OF FGF SIGNALING | Genes involved in Spry regulation of FGF signaling |
| 0.1 | 0.1 | REACTOME APC C CDC20 MEDIATED DEGRADATION OF MITOTIC PROTEINS | Genes involved in APC/C:Cdc20 mediated degradation of mitotic proteins |
| 0.1 | 0.5 | REACTOME RNA POL III TRANSCRIPTION INITIATION FROM TYPE 2 PROMOTER | Genes involved in RNA Polymerase III Transcription Initiation From Type 2 Promoter |
| 0.1 | 0.8 | REACTOME SIGNAL ATTENUATION | Genes involved in Signal attenuation |
| 0.1 | 1.1 | REACTOME CTNNB1 PHOSPHORYLATION CASCADE | Genes involved in Beta-catenin phosphorylation cascade |
| 0.1 | 1.2 | REACTOME AMINO ACID SYNTHESIS AND INTERCONVERSION TRANSAMINATION | Genes involved in Amino acid synthesis and interconversion (transamination) |
| 0.1 | 0.8 | REACTOME TRAFFICKING AND PROCESSING OF ENDOSOMAL TLR | Genes involved in Trafficking and processing of endosomal TLR |
| 0.1 | 0.7 | REACTOME SYNTHESIS OF BILE ACIDS AND BILE SALTS VIA 24 HYDROXYCHOLESTEROL | Genes involved in Synthesis of bile acids and bile salts via 24-hydroxycholesterol |
| 0.1 | 0.1 | REACTOME NOREPINEPHRINE NEUROTRANSMITTER RELEASE CYCLE | Genes involved in Norepinephrine Neurotransmitter Release Cycle |
| 0.1 | 0.7 | REACTOME SIGNALING BY SCF KIT | Genes involved in Signaling by SCF-KIT |
| 0.1 | 0.7 | REACTOME EGFR DOWNREGULATION | Genes involved in EGFR downregulation |
| 0.1 | 0.6 | REACTOME IL 7 SIGNALING | Genes involved in Interleukin-7 signaling |
| 0.1 | 0.3 | REACTOME PACKAGING OF TELOMERE ENDS | Genes involved in Packaging Of Telomere Ends |
| 0.1 | 1.4 | REACTOME REGULATION OF BETA CELL DEVELOPMENT | Genes involved in Regulation of beta-cell development |
| 0.1 | 0.5 | REACTOME ROLE OF DCC IN REGULATING APOPTOSIS | Genes involved in Role of DCC in regulating apoptosis |
| 0.1 | 0.6 | REACTOME HIGHLY CALCIUM PERMEABLE POSTSYNAPTIC NICOTINIC ACETYLCHOLINE RECEPTORS | Genes involved in Highly calcium permeable postsynaptic nicotinic acetylcholine receptors |
| 0.1 | 0.3 | REACTOME REGULATION OF IFNG SIGNALING | Genes involved in Regulation of IFNG signaling |
| 0.1 | 0.6 | REACTOME PEROXISOMAL LIPID METABOLISM | Genes involved in Peroxisomal lipid metabolism |
| 0.1 | 0.9 | REACTOME DEADENYLATION OF MRNA | Genes involved in Deadenylation of mRNA |
| 0.1 | 0.2 | REACTOME NEGATIVE REGULATION OF THE PI3K AKT NETWORK | Genes involved in Negative regulation of the PI3K/AKT network |
| 0.1 | 1.0 | REACTOME DARPP 32 EVENTS | Genes involved in DARPP-32 events |
| 0.1 | 0.5 | REACTOME ANTIGEN ACTIVATES B CELL RECEPTOR LEADING TO GENERATION OF SECOND MESSENGERS | Genes involved in Antigen Activates B Cell Receptor Leading to Generation of Second Messengers |
| 0.1 | 0.3 | REACTOME ACTIVATION OF THE AP1 FAMILY OF TRANSCRIPTION FACTORS | Genes involved in Activation of the AP-1 family of transcription factors |
| 0.1 | 0.8 | REACTOME PLATELET CALCIUM HOMEOSTASIS | Genes involved in Platelet calcium homeostasis |
| 0.1 | 2.3 | REACTOME NUCLEAR RECEPTOR TRANSCRIPTION PATHWAY | Genes involved in Nuclear Receptor transcription pathway |
| 0.0 | 0.6 | REACTOME P38MAPK EVENTS | Genes involved in p38MAPK events |
| 0.0 | 0.5 | REACTOME SEROTONIN RECEPTORS | Genes involved in Serotonin receptors |
| 0.0 | 0.7 | REACTOME PROTEOLYTIC CLEAVAGE OF SNARE COMPLEX PROTEINS | Genes involved in Proteolytic cleavage of SNARE complex proteins |
| 0.0 | 0.7 | REACTOME FORMATION OF TRANSCRIPTION COUPLED NER TC NER REPAIR COMPLEX | Genes involved in Formation of transcription-coupled NER (TC-NER) repair complex |
| 0.0 | 1.0 | REACTOME NITRIC OXIDE STIMULATES GUANYLATE CYCLASE | Genes involved in Nitric oxide stimulates guanylate cyclase |
| 0.0 | 0.5 | REACTOME PURINE SALVAGE | Genes involved in Purine salvage |
| 0.0 | 0.4 | REACTOME REGULATION OF INSULIN SECRETION BY ACETYLCHOLINE | Genes involved in Regulation of Insulin Secretion by Acetylcholine |
| 0.0 | 0.4 | REACTOME ASSOCIATION OF LICENSING FACTORS WITH THE PRE REPLICATIVE COMPLEX | Genes involved in Association of licensing factors with the pre-replicative complex |
| 0.0 | 0.5 | REACTOME ACTIVATION OF RAC | Genes involved in Activation of Rac |
| 0.0 | 0.4 | REACTOME RECRUITMENT OF NUMA TO MITOTIC CENTROSOMES | Genes involved in Recruitment of NuMA to mitotic centrosomes |
| 0.0 | 0.8 | REACTOME RNA POL III TRANSCRIPTION TERMINATION | Genes involved in RNA Polymerase III Transcription Termination |
| 0.0 | 0.2 | REACTOME INFLAMMASOMES | Genes involved in Inflammasomes |
| 0.0 | 0.6 | REACTOME SIGNALING BY ROBO RECEPTOR | Genes involved in Signaling by Robo receptor |
| 0.0 | 0.5 | REACTOME CYTOSOLIC SULFONATION OF SMALL MOLECULES | Genes involved in Cytosolic sulfonation of small molecules |
| 0.0 | 1.0 | REACTOME RECYCLING PATHWAY OF L1 | Genes involved in Recycling pathway of L1 |
| 0.0 | 0.4 | REACTOME MRNA DECAY BY 3 TO 5 EXORIBONUCLEASE | Genes involved in mRNA Decay by 3' to 5' Exoribonuclease |
| 0.0 | 0.4 | REACTOME DOUBLE STRAND BREAK REPAIR | Genes involved in Double-Strand Break Repair |
| 0.0 | 0.3 | REACTOME CA DEPENDENT EVENTS | Genes involved in Ca-dependent events |
| 0.0 | 0.6 | REACTOME REGULATORY RNA PATHWAYS | Genes involved in Regulatory RNA pathways |
| 0.0 | 0.6 | REACTOME GROWTH HORMONE RECEPTOR SIGNALING | Genes involved in Growth hormone receptor signaling |
| 0.0 | 0.5 | REACTOME FORMATION OF ATP BY CHEMIOSMOTIC COUPLING | Genes involved in Formation of ATP by chemiosmotic coupling |
| 0.0 | 0.4 | REACTOME REGULATION OF PYRUVATE DEHYDROGENASE PDH COMPLEX | Genes involved in Regulation of pyruvate dehydrogenase (PDH) complex |
| 0.0 | 0.3 | REACTOME SLBP DEPENDENT PROCESSING OF REPLICATION DEPENDENT HISTONE PRE MRNAS | Genes involved in SLBP Dependent Processing of Replication-Dependent Histone Pre-mRNAs |
| 0.0 | 0.2 | REACTOME PYRUVATE METABOLISM | Genes involved in Pyruvate metabolism |
| 0.0 | 0.5 | REACTOME CLASS C 3 METABOTROPIC GLUTAMATE PHEROMONE RECEPTORS | Genes involved in Class C/3 (Metabotropic glutamate/pheromone receptors) |
| 0.0 | 0.7 | REACTOME MITOCHONDRIAL TRNA AMINOACYLATION | Genes involved in Mitochondrial tRNA aminoacylation |
| 0.0 | 0.6 | REACTOME GAP JUNCTION ASSEMBLY | Genes involved in Gap junction assembly |
| 0.0 | 0.2 | REACTOME CHYLOMICRON MEDIATED LIPID TRANSPORT | Genes involved in Chylomicron-mediated lipid transport |
| 0.0 | 0.4 | REACTOME THE ACTIVATION OF ARYLSULFATASES | Genes involved in The activation of arylsulfatases |
| 0.0 | 0.2 | REACTOME FORMATION OF THE HIV1 EARLY ELONGATION COMPLEX | Genes involved in Formation of the HIV-1 Early Elongation Complex |
| 0.0 | 1.0 | REACTOME TRANSPORT OF VITAMINS NUCLEOSIDES AND RELATED MOLECULES | Genes involved in Transport of vitamins, nucleosides, and related molecules |
| 0.0 | 0.0 | REACTOME OPSINS | Genes involved in Opsins |
| 0.0 | 0.7 | REACTOME SULFUR AMINO ACID METABOLISM | Genes involved in Sulfur amino acid metabolism |
| 0.0 | 0.4 | REACTOME N GLYCAN ANTENNAE ELONGATION | Genes involved in N-Glycan antennae elongation |
| 0.0 | 0.5 | REACTOME FATTY ACYL COA BIOSYNTHESIS | Genes involved in Fatty Acyl-CoA Biosynthesis |
| 0.0 | 0.2 | REACTOME APOPTOTIC CLEAVAGE OF CELL ADHESION PROTEINS | Genes involved in Apoptotic cleavage of cell adhesion proteins |
| 0.0 | 0.2 | REACTOME ANDROGEN BIOSYNTHESIS | Genes involved in Androgen biosynthesis |
| 0.0 | 1.8 | REACTOME IMMUNOREGULATORY INTERACTIONS BETWEEN A LYMPHOID AND A NON LYMPHOID CELL | Genes involved in Immunoregulatory interactions between a Lymphoid and a non-Lymphoid cell |
| 0.0 | 0.4 | REACTOME SIGNALING BY FGFR1 FUSION MUTANTS | Genes involved in Signaling by FGFR1 fusion mutants |
| 0.0 | 0.4 | REACTOME PRE NOTCH PROCESSING IN GOLGI | Genes involved in Pre-NOTCH Processing in Golgi |
| 0.0 | 0.2 | REACTOME PLC BETA MEDIATED EVENTS | Genes involved in PLC beta mediated events |
| 0.0 | 0.0 | REACTOME G ALPHA Z SIGNALLING EVENTS | Genes involved in G alpha (z) signalling events |
| 0.0 | 1.0 | REACTOME GLUCOSE TRANSPORT | Genes involved in Glucose transport |
| 0.0 | 0.4 | REACTOME ZINC TRANSPORTERS | Genes involved in Zinc transporters |
| 0.0 | 0.2 | REACTOME MTORC1 MEDIATED SIGNALLING | Genes involved in mTORC1-mediated signalling |
| 0.0 | 0.6 | REACTOME INTRINSIC PATHWAY FOR APOPTOSIS | Genes involved in Intrinsic Pathway for Apoptosis |
| 0.0 | 0.5 | REACTOME GLYCOLYSIS | Genes involved in Glycolysis |
| 0.0 | 0.6 | REACTOME SYNTHESIS OF PIPS AT THE PLASMA MEMBRANE | Genes involved in Synthesis of PIPs at the plasma membrane |
| 0.0 | 0.5 | REACTOME G1 PHASE | Genes involved in G1 Phase |
| 0.0 | 0.5 | REACTOME TRIGLYCERIDE BIOSYNTHESIS | Genes involved in Triglyceride Biosynthesis |
| 0.0 | 0.1 | REACTOME REGULATION OF IFNA SIGNALING | Genes involved in Regulation of IFNA signaling |
| 0.0 | 0.2 | REACTOME EXTENSION OF TELOMERES | Genes involved in Extension of Telomeres |
| 0.0 | 0.6 | REACTOME NUCLEAR SIGNALING BY ERBB4 | Genes involved in Nuclear signaling by ERBB4 |
| 0.0 | 1.2 | REACTOME FORMATION OF THE TERNARY COMPLEX AND SUBSEQUENTLY THE 43S COMPLEX | Genes involved in Formation of the ternary complex, and subsequently, the 43S complex |
| 0.0 | 0.1 | REACTOME INHIBITION OF REPLICATION INITIATION OF DAMAGED DNA BY RB1 E2F1 | Genes involved in Inhibition of replication initiation of damaged DNA by RB1/E2F1 |
| 0.0 | 6.8 | REACTOME GENERIC TRANSCRIPTION PATHWAY | Genes involved in Generic Transcription Pathway |
| 0.0 | 0.0 | REACTOME MRNA CAPPING | Genes involved in mRNA Capping |
| 0.0 | 0.3 | REACTOME SYNTHESIS SECRETION AND DEACYLATION OF GHRELIN | Genes involved in Synthesis, Secretion, and Deacylation of Ghrelin |
| 0.0 | 1.9 | REACTOME MEIOTIC RECOMBINATION | Genes involved in Meiotic Recombination |
| 0.0 | 0.1 | REACTOME SYNTHESIS SECRETION AND INACTIVATION OF GLP1 | Genes involved in Synthesis, Secretion, and Inactivation of Glucagon-like Peptide-1 (GLP-1) |
| 0.0 | 0.1 | REACTOME ACETYLCHOLINE NEUROTRANSMITTER RELEASE CYCLE | Genes involved in Acetylcholine Neurotransmitter Release Cycle |
| 0.0 | 0.1 | REACTOME TRAF6 MEDIATED IRF7 ACTIVATION IN TLR7 8 OR 9 SIGNALING | Genes involved in TRAF6 mediated IRF7 activation in TLR7/8 or 9 signaling |
| 0.0 | 0.2 | REACTOME SYNTHESIS OF PE | Genes involved in Synthesis of PE |
| 0.0 | 0.4 | REACTOME KERATAN SULFATE BIOSYNTHESIS | Genes involved in Keratan sulfate biosynthesis |
| 0.0 | 0.2 | REACTOME PURINE CATABOLISM | Genes involved in Purine catabolism |
| 0.0 | 0.7 | REACTOME G ALPHA1213 SIGNALLING EVENTS | Genes involved in G alpha (12/13) signalling events |
| 0.0 | 0.1 | REACTOME IL 6 SIGNALING | Genes involved in Interleukin-6 signaling |
| 0.0 | 1.4 | REACTOME RESPIRATORY ELECTRON TRANSPORT | Genes involved in Respiratory electron transport |
| 0.0 | 0.3 | REACTOME NEPHRIN INTERACTIONS | Genes involved in Nephrin interactions |
| 0.0 | 0.1 | REACTOME DSCAM INTERACTIONS | Genes involved in DSCAM interactions |
| 0.0 | 0.1 | REACTOME CTLA4 INHIBITORY SIGNALING | Genes involved in CTLA4 inhibitory signaling |
| 0.0 | 0.3 | REACTOME NA CL DEPENDENT NEUROTRANSMITTER TRANSPORTERS | Genes involved in Na+/Cl- dependent neurotransmitter transporters |
| 0.0 | 0.3 | REACTOME GABA A RECEPTOR ACTIVATION | Genes involved in GABA A receptor activation |
| 0.0 | 0.2 | REACTOME GLUCONEOGENESIS | Genes involved in Gluconeogenesis |
| 0.0 | 0.9 | REACTOME MUSCLE CONTRACTION | Genes involved in Muscle contraction |
| 0.0 | 0.0 | REACTOME ACTIVATION OF THE MRNA UPON BINDING OF THE CAP BINDING COMPLEX AND EIFS AND SUBSEQUENT BINDING TO 43S | Genes involved in Activation of the mRNA upon binding of the cap-binding complex and eIFs, and subsequent binding to 43S |
| 0.0 | 0.6 | REACTOME ASSOCIATION OF TRIC CCT WITH TARGET PROTEINS DURING BIOSYNTHESIS | Genes involved in Association of TriC/CCT with target proteins during biosynthesis |
| 0.0 | 0.4 | REACTOME GLUTATHIONE CONJUGATION | Genes involved in Glutathione conjugation |
| 0.0 | 0.3 | REACTOME TGF BETA RECEPTOR SIGNALING ACTIVATES SMADS | Genes involved in TGF-beta receptor signaling activates SMADs |
| 0.0 | 1.0 | REACTOME REGULATION OF ORNITHINE DECARBOXYLASE ODC | Genes involved in Regulation of ornithine decarboxylase (ODC) |
| 0.0 | 1.6 | REACTOME MITOTIC M M G1 PHASES | Genes involved in Mitotic M-M/G1 phases |
| 0.0 | 0.2 | REACTOME P2Y RECEPTORS | Genes involved in P2Y receptors |
| 0.0 | 0.1 | REACTOME FORMATION OF RNA POL II ELONGATION COMPLEX | Genes involved in Formation of RNA Pol II elongation complex |
| 0.0 | 1.9 | REACTOME SIGNALING BY RHO GTPASES | Genes involved in Signaling by Rho GTPases |
| 0.0 | 0.3 | REACTOME GABA SYNTHESIS RELEASE REUPTAKE AND DEGRADATION | Genes involved in GABA synthesis, release, reuptake and degradation |
| 0.0 | 0.1 | REACTOME NUCLEOTIDE BINDING DOMAIN LEUCINE RICH REPEAT CONTAINING RECEPTOR NLR SIGNALING PATHWAYS | Genes involved in Nucleotide-binding domain, leucine rich repeat containing receptor (NLR) signaling pathways |
| 0.0 | 0.0 | REACTOME INHIBITION OF INSULIN SECRETION BY ADRENALINE NORADRENALINE | Genes involved in Inhibition of Insulin Secretion by Adrenaline/Noradrenaline |
| 0.0 | 2.6 | REACTOME G ALPHA I SIGNALLING EVENTS | Genes involved in G alpha (i) signalling events |
| 0.0 | 0.2 | REACTOME PURINE METABOLISM | Genes involved in Purine metabolism |
| 0.0 | 0.1 | REACTOME IRAK2 MEDIATED ACTIVATION OF TAK1 COMPLEX UPON TLR7 8 OR 9 STIMULATION | Genes involved in IRAK2 mediated activation of TAK1 complex upon TLR7/8 or 9 stimulation |
| 0.0 | 0.6 | REACTOME MRNA 3 END PROCESSING | Genes involved in mRNA 3'-end processing |
| 0.0 | 0.1 | REACTOME SEMA4D INDUCED CELL MIGRATION AND GROWTH CONE COLLAPSE | Genes involved in Sema4D induced cell migration and growth-cone collapse |
| 0.0 | 0.1 | REACTOME UNWINDING OF DNA | Genes involved in Unwinding of DNA |
| 0.0 | 0.1 | REACTOME CYCLIN A B1 ASSOCIATED EVENTS DURING G2 M TRANSITION | Genes involved in Cyclin A/B1 associated events during G2/M transition |
| 0.0 | 0.1 | REACTOME DESTABILIZATION OF MRNA BY BRF1 | Genes involved in Destabilization of mRNA by Butyrate Response Factor 1 (BRF1) |
| 0.0 | 0.2 | REACTOME HYALURONAN UPTAKE AND DEGRADATION | Genes involved in Hyaluronan uptake and degradation |
| 0.0 | 0.3 | REACTOME CHOLESTEROL BIOSYNTHESIS | Genes involved in Cholesterol biosynthesis |
| 0.0 | 0.2 | REACTOME MITOCHONDRIAL FATTY ACID BETA OXIDATION | Genes involved in Mitochondrial Fatty Acid Beta-Oxidation |
| 0.0 | 0.2 | REACTOME IRAK1 RECRUITS IKK COMPLEX | Genes involved in IRAK1 recruits IKK complex |
| 0.0 | 0.4 | REACTOME GLYCOSPHINGOLIPID METABOLISM | Genes involved in Glycosphingolipid metabolism |
| 0.0 | 0.4 | REACTOME ANTIVIRAL MECHANISM BY IFN STIMULATED GENES | Genes involved in Antiviral mechanism by IFN-stimulated genes |
| 0.0 | 0.1 | REACTOME SEMA3A PAK DEPENDENT AXON REPULSION | Genes involved in Sema3A PAK dependent Axon repulsion |
| 0.0 | 0.2 | REACTOME SIGNALING BY BMP | Genes involved in Signaling by BMP |
| 0.0 | 0.4 | REACTOME TRANSCRIPTIONAL REGULATION OF WHITE ADIPOCYTE DIFFERENTIATION | Genes involved in Transcriptional Regulation of White Adipocyte Differentiation |
| 0.0 | 0.0 | REACTOME P53 DEPENDENT G1 DNA DAMAGE RESPONSE | Genes involved in p53-Dependent G1 DNA Damage Response |
| 0.0 | 0.1 | REACTOME IONOTROPIC ACTIVITY OF KAINATE RECEPTORS | Genes involved in Ionotropic activity of Kainate Receptors |
| 0.0 | 0.0 | REACTOME CIRCADIAN CLOCK | Genes involved in Circadian Clock |
| 0.0 | 0.5 | REACTOME ABC FAMILY PROTEINS MEDIATED TRANSPORT | Genes involved in ABC-family proteins mediated transport |
| 0.0 | 0.2 | REACTOME FANCONI ANEMIA PATHWAY | Genes involved in Fanconi Anemia pathway |
| 0.0 | 0.2 | REACTOME SYNTHESIS OF GLYCOSYLPHOSPHATIDYLINOSITOL GPI | Genes involved in Synthesis of glycosylphosphatidylinositol (GPI) |
| 0.0 | 0.3 | REACTOME INSULIN RECEPTOR RECYCLING | Genes involved in Insulin receptor recycling |
| 0.0 | 0.0 | REACTOME REGULATION OF SIGNALING BY CBL | Genes involved in Regulation of signaling by CBL |
| 0.0 | 0.3 | REACTOME ADHERENS JUNCTIONS INTERACTIONS | Genes involved in Adherens junctions interactions |
| 0.0 | 0.2 | REACTOME REGULATION OF AMPK ACTIVITY VIA LKB1 | Genes involved in Regulation of AMPK activity via LKB1 |
| 0.0 | 0.0 | REACTOME DESTABILIZATION OF MRNA BY KSRP | Genes involved in Destabilization of mRNA by KSRP |
| 0.0 | 0.3 | REACTOME TCR SIGNALING | Genes involved in TCR signaling |
| 0.0 | 0.1 | REACTOME SYNTHESIS OF PC | Genes involved in Synthesis of PC |
| 0.0 | 0.2 | REACTOME SYNTHESIS OF SUBSTRATES IN N GLYCAN BIOSYTHESIS | Genes involved in Synthesis of substrates in N-glycan biosythesis |
| 0.0 | 0.6 | REACTOME MITOCHONDRIAL PROTEIN IMPORT | Genes involved in Mitochondrial Protein Import |
| 0.0 | 0.1 | REACTOME LATENT INFECTION OF HOMO SAPIENS WITH MYCOBACTERIUM TUBERCULOSIS | Genes involved in Latent infection of Homo sapiens with Mycobacterium tuberculosis |
| 0.0 | 0.1 | REACTOME IL1 SIGNALING | Genes involved in Interleukin-1 signaling |
| 0.0 | 0.0 | REACTOME THE ROLE OF NEF IN HIV1 REPLICATION AND DISEASE PATHOGENESIS | Genes involved in The role of Nef in HIV-1 replication and disease pathogenesis |
| 0.0 | 0.1 | REACTOME VEGF LIGAND RECEPTOR INTERACTIONS | Genes involved in VEGF ligand-receptor interactions |
| 0.0 | 0.3 | REACTOME DOWNSTREAM SIGNALING EVENTS OF B CELL RECEPTOR BCR | Genes involved in Downstream Signaling Events Of B Cell Receptor (BCR) |
| 0.0 | 0.1 | REACTOME EXTRINSIC PATHWAY FOR APOPTOSIS | Genes involved in Extrinsic Pathway for Apoptosis |
| 0.0 | 0.2 | REACTOME NOTCH1 INTRACELLULAR DOMAIN REGULATES TRANSCRIPTION | Genes involved in NOTCH1 Intracellular Domain Regulates Transcription |
| 0.0 | 0.2 | REACTOME CHEMOKINE RECEPTORS BIND CHEMOKINES | Genes involved in Chemokine receptors bind chemokines |
| 0.0 | 0.6 | REACTOME MRNA SPLICING | Genes involved in mRNA Splicing |
| 0.0 | 0.1 | REACTOME BILE SALT AND ORGANIC ANION SLC TRANSPORTERS | Genes involved in Bile salt and organic anion SLC transporters |
| 0.0 | 0.2 | REACTOME BRANCHED CHAIN AMINO ACID CATABOLISM | Genes involved in Branched-chain amino acid catabolism |
| 0.0 | 0.4 | REACTOME FATTY ACID TRIACYLGLYCEROL AND KETONE BODY METABOLISM | Genes involved in Fatty acid, triacylglycerol, and ketone body metabolism |
| 0.0 | 0.3 | REACTOME NGF SIGNALLING VIA TRKA FROM THE PLASMA MEMBRANE | Genes involved in NGF signalling via TRKA from the plasma membrane |
| 0.0 | 0.0 | REACTOME SIGNALING BY CONSTITUTIVELY ACTIVE EGFR | Genes involved in Signaling by constitutively active EGFR |
| 0.0 | 0.2 | REACTOME GLUCAGON TYPE LIGAND RECEPTORS | Genes involved in Glucagon-type ligand receptors |
| 0.0 | 0.0 | REACTOME DESTABILIZATION OF MRNA BY AUF1 HNRNP D0 | Genes involved in Destabilization of mRNA by AUF1 (hnRNP D0) |
| 0.0 | 0.2 | REACTOME ACTIVATED NOTCH1 TRANSMITS SIGNAL TO THE NUCLEUS | Genes involved in Activated NOTCH1 Transmits Signal to the Nucleus |
| 0.0 | 0.1 | REACTOME GAMMA CARBOXYLATION TRANSPORT AND AMINO TERMINAL CLEAVAGE OF PROTEINS | Genes involved in Gamma-carboxylation, transport, and amino-terminal cleavage of proteins |
| 0.0 | 0.0 | REACTOME BINDING AND ENTRY OF HIV VIRION | Genes involved in Binding and entry of HIV virion |