Project
ENCODE: H3K4me1 ChIP-Seq of primary human cells
Navigation
Downloads

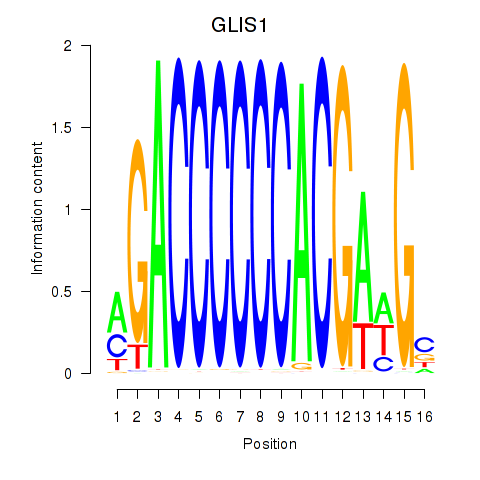
Results for GLIS1
Z-value: 0.32
Motif logo
Transcription factors associated with GLIS1
| Gene Symbol | Gene ID | Gene Info |
|---|---|---|
|
GLIS1
|
ENSG00000174332.3 | GLIS family zinc finger 1 |
Correlations of motif activity and signal intensity at CREs associated with the motif's TFs:
This plot shows correlation between observed signal intensity of a CRE associated with the transcription factor across all samples and activity of the motif.
For each TF, only the top 5 correlated CREs are shown.
| CRE | Gene | Distance | Association probability | Pearson corr. coef. | P-value | Plot |
|---|---|---|---|---|---|---|
| chr1_54203394_54203545 | GLIS1 | 3592 | 0.234475 | 0.65 | 5.7e-02 | Click! |
| chr1_54205166_54205365 | GLIS1 | 5388 | 0.206000 | 0.50 | 1.8e-01 | Click! |
| chr1_54205381_54205532 | GLIS1 | 5579 | 0.204295 | 0.45 | 2.2e-01 | Click! |
| chr1_54205618_54205769 | GLIS1 | 5816 | 0.202365 | 0.39 | 3.0e-01 | Click! |
| chr1_54205953_54206104 | GLIS1 | 6151 | 0.199934 | 0.36 | 3.4e-01 | Click! |
Activity of the GLIS1 motif across conditions
Conditions sorted by the z-value of the GLIS1 motif activity
Move your cursor over a bar to see sample name and corresponding Z-value.
Top target CREs of the motif:
| Cis Regulatory Element (CRE) | Target Score | Top associated gene | Gene Info | Distance of CRE to TSS | CRE/Gene association probability |
|---|---|---|---|---|---|
| chr1_59250297_59250448 | 0.22 |
JUN |
jun proto-oncogene |
587 |
0.78 |
| chr19_40696966_40697240 | 0.21 |
MAP3K10 |
mitogen-activated protein kinase kinase kinase 10 |
548 |
0.67 |
| chr19_7599100_7599268 | 0.21 |
PNPLA6 |
patatin-like phospholipase domain containing 6 |
56 |
0.94 |
| chr13_96295982_96296256 | 0.17 |
DZIP1 |
DAZ interacting zinc finger protein 1 |
602 |
0.78 |
| chr14_69100048_69100384 | 0.16 |
CTD-2325P2.4 |
|
5054 |
0.28 |
| chr15_74344266_74344417 | 0.14 |
ENSG00000244612 |
. |
20698 |
0.13 |
| chr19_839026_839330 | 0.14 |
PRTN3 |
proteinase 3 |
1785 |
0.16 |
| chr5_67066501_67066705 | 0.14 |
ENSG00000223149 |
. |
196670 |
0.03 |
| chr1_118156647_118156854 | 0.12 |
FAM46C |
family with sequence similarity 46, member C |
8194 |
0.22 |
| chr1_156126196_156126400 | 0.11 |
SEMA4A |
sema domain, immunoglobulin domain (Ig), transmembrane domain (TM) and short cytoplasmic domain, (semaphorin) 4A |
2136 |
0.19 |
| chr1_2365490_2365764 | 0.10 |
PLCH2 |
phospholipase C, eta 2 |
8208 |
0.11 |
| chr1_46508843_46508994 | 0.10 |
RP4-533D7.4 |
|
3572 |
0.28 |
| chr5_169929526_169929733 | 0.09 |
KCNIP1 |
Kv channel interacting protein 1 |
1411 |
0.47 |
| chr11_45201919_45202091 | 0.09 |
PRDM11 |
PR domain containing 11 |
1423 |
0.5 |
| chr19_52246715_52246979 | 0.08 |
FPR1 |
formyl peptide receptor 1 |
7217 |
0.11 |
| chr16_58059108_58059507 | 0.08 |
MMP15 |
matrix metallopeptidase 15 (membrane-inserted) |
163 |
0.93 |
| chr17_34137146_34137810 | 0.08 |
TAF15 |
TAF15 RNA polymerase II, TATA box binding protein (TBP)-associated factor, 68kDa |
985 |
0.36 |
| chr12_51581259_51581410 | 0.08 |
POU6F1 |
POU class 6 homeobox 1 |
9484 |
0.12 |
| chr2_43202367_43202849 | 0.07 |
ENSG00000207087 |
. |
116024 |
0.06 |
| chr8_56849415_56849601 | 0.07 |
LYN |
v-yes-1 Yamaguchi sarcoma viral related oncogene homolog |
3285 |
0.2 |
| chr13_29156883_29157128 | 0.07 |
POMP |
proteasome maturation protein |
76236 |
0.1 |
| chr20_48838016_48838310 | 0.07 |
CEBPB |
CCAAT/enhancer binding protein (C/EBP), beta |
30787 |
0.17 |
| chr7_73324002_73324153 | 0.07 |
WBSCR28 |
Williams-Beuren syndrome chromosome region 28 |
48588 |
0.11 |
| chr17_78911964_78912115 | 0.07 |
CTD-2561B21.4 |
|
3794 |
0.16 |
| chr1_54801806_54802163 | 0.06 |
RP5-997D24.3 |
|
50906 |
0.12 |
| chr1_181058475_181058626 | 0.06 |
IER5 |
immediate early response 5 |
912 |
0.64 |
| chr10_114134943_114135530 | 0.05 |
ACSL5 |
acyl-CoA synthetase long-chain family member 5 |
213 |
0.94 |
| chr9_127310878_127311243 | 0.05 |
NR5A1 |
nuclear receptor subfamily 5, group A, member 1 |
41351 |
0.13 |
| chr12_58290510_58290784 | 0.04 |
XRCC6BP1 |
XRCC6 binding protein 1 |
44713 |
0.08 |
| chr2_238840312_238840463 | 0.04 |
UBE2F |
ubiquitin-conjugating enzyme E2F (putative) |
35210 |
0.15 |
| chr9_37372023_37372174 | 0.04 |
ENSG00000206784 |
. |
49842 |
0.11 |
| chr19_50472092_50472265 | 0.03 |
SIGLEC16 |
sialic acid binding Ig-like lectin 16 (gene/pseudogene) |
679 |
0.47 |
| chr20_47729717_47729868 | 0.03 |
CSE1L |
CSE1 chromosome segregation 1-like (yeast) |
54791 |
0.11 |
| chr5_158381152_158381303 | 0.03 |
CTD-2363C16.1 |
|
28787 |
0.2 |
| chr2_235694990_235695141 | 0.03 |
SH3BP4 |
SH3-domain binding protein 4 |
165552 |
0.04 |
| chr15_43881589_43882101 | 0.03 |
PPIP5K1 |
diphosphoinositol pentakisphosphate kinase 1 |
295 |
0.82 |
| chr11_128553785_128553936 | 0.03 |
RP11-744N12.3 |
|
2463 |
0.25 |
| chr3_177017714_177017945 | 0.03 |
TBL1XR1 |
transducin (beta)-like 1 X-linked receptor 1 |
102568 |
0.08 |
| chr1_42342874_42343026 | 0.03 |
HIVEP3 |
human immunodeficiency virus type I enhancer binding protein 3 |
41219 |
0.2 |
| chr9_124224200_124224351 | 0.02 |
ENSG00000240299 |
. |
32522 |
0.16 |
| chr3_10215716_10215867 | 0.02 |
IRAK2 |
interleukin-1 receptor-associated kinase 2 |
9242 |
0.12 |
| chr20_61589916_61590067 | 0.02 |
SLC17A9 |
solute carrier family 17 (vesicular nucleotide transporter), member 9 |
5593 |
0.16 |
| chr4_961832_961983 | 0.02 |
DGKQ |
diacylglycerol kinase, theta 110kDa |
5203 |
0.14 |
| chr17_48912444_48912595 | 0.02 |
WFIKKN2 |
WAP, follistatin/kazal, immunoglobulin, kunitz and netrin domain containing 2 |
252 |
0.9 |
| chr20_52402321_52402472 | 0.02 |
ENSG00000238468 |
. |
117099 |
0.06 |
| chr1_234858071_234858911 | 0.02 |
IRF2BP2 |
interferon regulatory factor 2 binding protein 2 |
113220 |
0.06 |
| chr8_11627378_11627529 | 0.02 |
NEIL2 |
nei endonuclease VIII-like 2 (E. coli) |
205 |
0.92 |
| chr3_12353223_12353374 | 0.02 |
PPARG |
peroxisome proliferator-activated receptor gamma |
589 |
0.83 |
| chr1_247095569_247095794 | 0.01 |
AHCTF1 |
AT hook containing transcription factor 1 |
401 |
0.88 |
| chr9_134637736_134637927 | 0.01 |
ENSG00000212395 |
. |
20514 |
0.18 |
| chr17_3795255_3795551 | 0.01 |
CAMKK1 |
calcium/calmodulin-dependent protein kinase kinase 1, alpha |
934 |
0.52 |
| chr13_95247837_95248083 | 0.01 |
TGDS |
TDP-glucose 4,6-dehydratase |
551 |
0.78 |
| chr2_88202897_88203048 | 0.01 |
RGPD2 |
RANBP2-like and GRIP domain containing 2 |
77501 |
0.09 |
| chr16_24697345_24697496 | 0.01 |
TNRC6A |
trinucleotide repeat containing 6A |
43596 |
0.18 |
| chr22_50180752_50180903 | 0.01 |
BRD1 |
bromodomain containing 1 |
36026 |
0.14 |
| chr2_241759843_241760095 | 0.01 |
KIF1A |
kinesin family member 1A |
244 |
0.93 |
| chr5_1112895_1113092 | 0.01 |
SLC12A7 |
solute carrier family 12 (potassium/chloride transporter), member 7 |
843 |
0.61 |
| chr3_194117609_194117913 | 0.01 |
GP5 |
glycoprotein V (platelet) |
1322 |
0.41 |
| chr7_150945286_150945619 | 0.01 |
SMARCD3 |
SWI/SNF related, matrix associated, actin dependent regulator of chromatin, subfamily d, member 3 |
607 |
0.46 |
| chr15_71363288_71363439 | 0.01 |
THSD4 |
thrombospondin, type I, domain containing 4 |
25928 |
0.2 |
| chr6_108953236_108953600 | 0.01 |
FOXO3 |
forkhead box O3 |
24131 |
0.26 |
| chr7_144084416_144084567 | 0.01 |
NOBOX |
NOBOX oogenesis homeobox |
16295 |
0.14 |
| chr6_27834418_27834707 | 0.01 |
HIST1H1B |
histone cluster 1, H1b |
797 |
0.32 |
| chr12_112563698_112563849 | 0.00 |
TRAFD1 |
TRAF-type zinc finger domain containing 1 |
406 |
0.8 |
| chrX_143218129_143218280 | 0.00 |
UBE2NL |
ubiquitin-conjugating enzyme E2N-like |
251031 |
0.02 |
| chr15_74497974_74498125 | 0.00 |
STRA6 |
stimulated by retinoic acid 6 |
2346 |
0.18 |
| chr10_119990_120141 | 0.00 |
TUBB8 |
tubulin, beta 8 class VIII |
24561 |
0.22 |
| chr16_85978677_85978941 | 0.00 |
IRF8 |
interferon regulatory factor 8 |
30890 |
0.2 |
| chr17_1302197_1302348 | 0.00 |
YWHAE |
tyrosine 3-monooxygenase/tryptophan 5-monooxygenase activation protein, epsilon |
1203 |
0.45 |
| chr14_102783676_102783852 | 0.00 |
ZNF839 |
zinc finger protein 839 |
50 |
0.97 |
| chr3_50263500_50263973 | 0.00 |
GNAI2 |
guanine nucleotide binding protein (G protein), alpha inhibiting activity polypeptide 2 |
12 |
0.96 |
| chr19_638547_638698 | 0.00 |
FGF22 |
fibroblast growth factor 22 |
1273 |
0.25 |
| chr11_126417501_126417652 | 0.00 |
KIRREL3-AS1 |
KIRREL3 antisense RNA 1 |
3734 |
0.31 |
| chr12_26348309_26348460 | 0.00 |
SSPN |
sarcospan |
45 |
0.98 |
| chr7_50246335_50246555 | 0.00 |
AC020743.2 |
|
64026 |
0.12 |
| chr18_54877274_54877586 | 0.00 |
BOD1L2 |
biorientation of chromosomes in cell division 1-like 2 |
63137 |
0.12 |
| chr12_132312511_132312719 | 0.00 |
MMP17 |
matrix metallopeptidase 17 (membrane-inserted) |
323 |
0.87 |
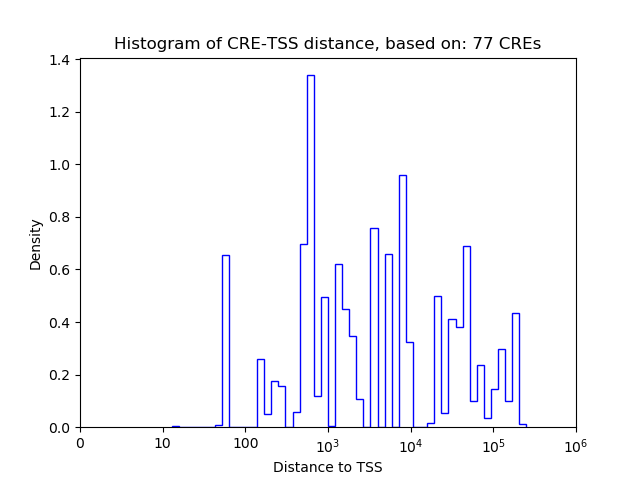
Histogram of CRE-TSS distances for CREs targeted by :
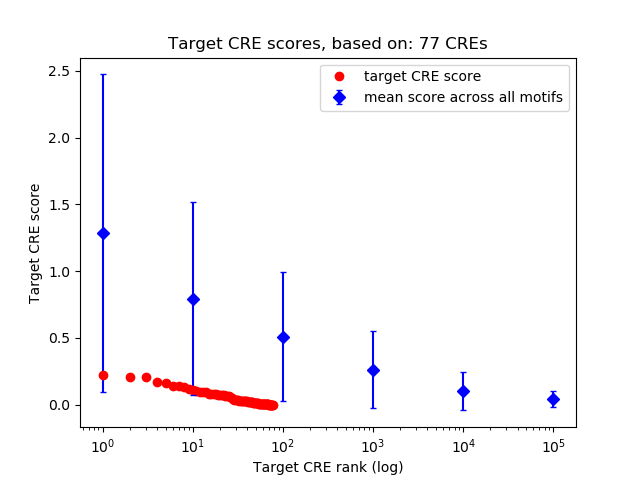
Rank distribution of CRE target scores:
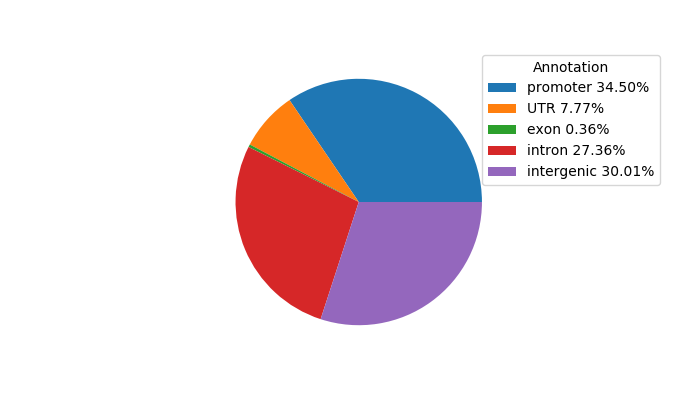
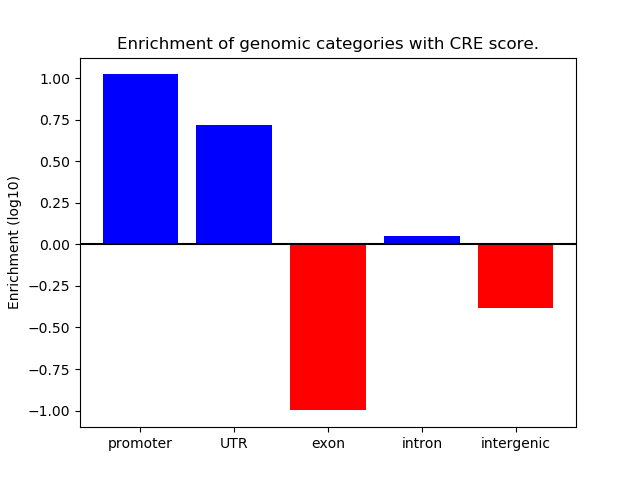
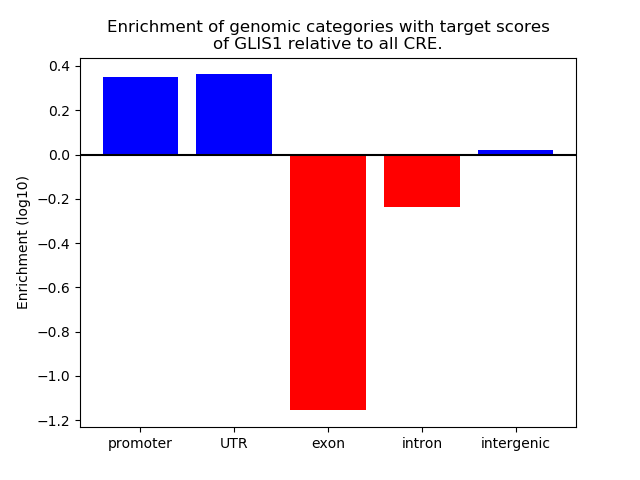
Distribution of target CREs across different genomic regions:
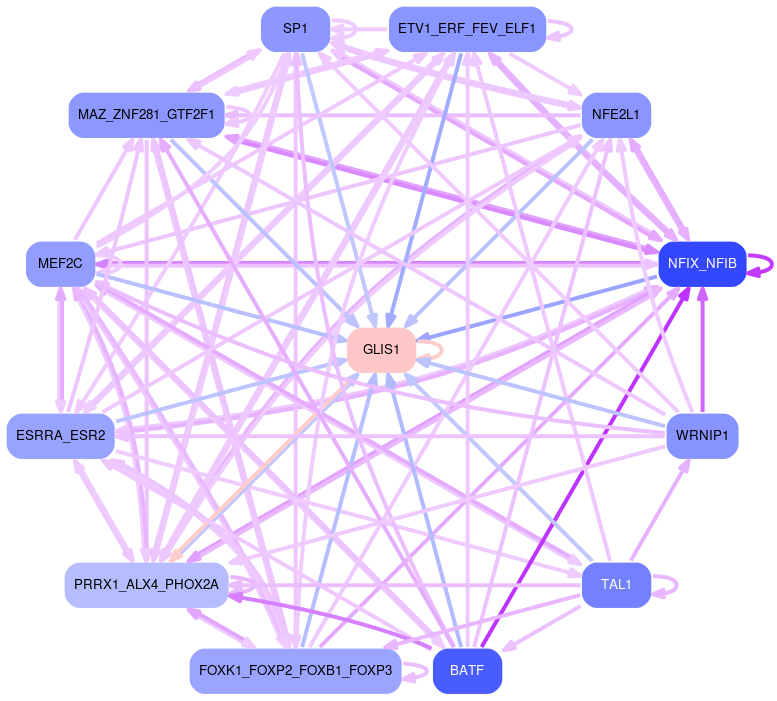
Network of associatons between targets according to the STRING database.

Gene Ontology Analysis
Gene overrepresentation in biological process category:
| Log-likelihood per target | Total log-likelihood | Term | Description |
|---|---|---|---|
| 0.0 | 0.2 | GO:0045657 | positive regulation of monocyte differentiation(GO:0045657) |
| 0.0 | 0.0 | GO:0010867 | positive regulation of triglyceride biosynthetic process(GO:0010867) |
Gene overrepresentation in molecular function category:
| Log-likelihood per target | Total log-likelihood | Term | Description |
|---|---|---|---|
| 0.0 | 0.1 | GO:0004706 | JUN kinase kinase kinase activity(GO:0004706) |
| 0.0 | 0.2 | GO:0004622 | lysophospholipase activity(GO:0004622) |
| 0.0 | 0.2 | GO:0070412 | R-SMAD binding(GO:0070412) |
Gene overrepresentation in curated gene sets: canonical pathways category:
| Log-likelihood per target | Total log-likelihood | Term | Description |
|---|---|---|---|
| 0.0 | 0.2 | PID TCR JNK PATHWAY | JNK signaling in the CD4+ TCR pathway |
Gene overrepresentation in curated gene sets: REACTOME pathways category:
| Log-likelihood per target | Total log-likelihood | Term | Description |
|---|---|---|---|
| 0.0 | 0.2 | REACTOME ACTIVATION OF THE AP1 FAMILY OF TRANSCRIPTION FACTORS | Genes involved in Activation of the AP-1 family of transcription factors |