Project
ENCODE: H3K4me1 ChIP-Seq of primary human cells
Navigation
Downloads
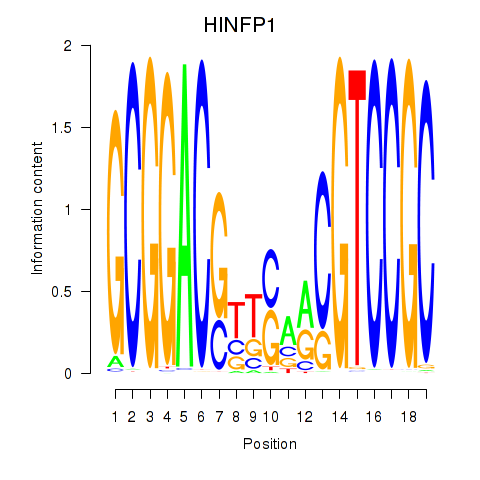
Results for HINFP1
Z-value: 0.23
Transcription factors associated with HINFP1
| Gene Symbol | Gene ID | Gene Info |
|---|
Activity of the HINFP1 motif across conditions
Conditions sorted by the z-value of the HINFP1 motif activity
Move your cursor over a bar to see sample name and corresponding Z-value.
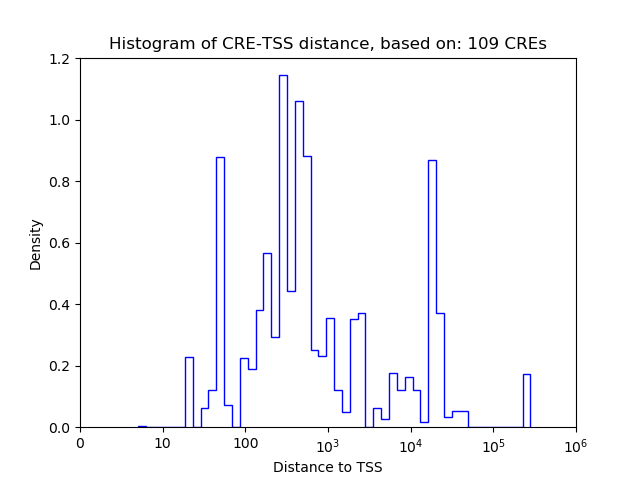
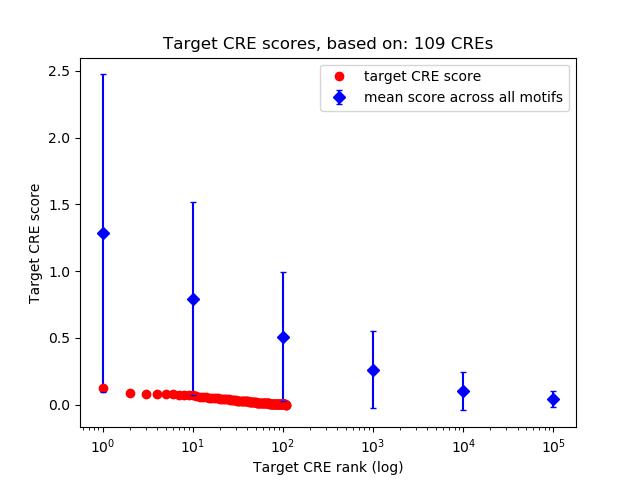
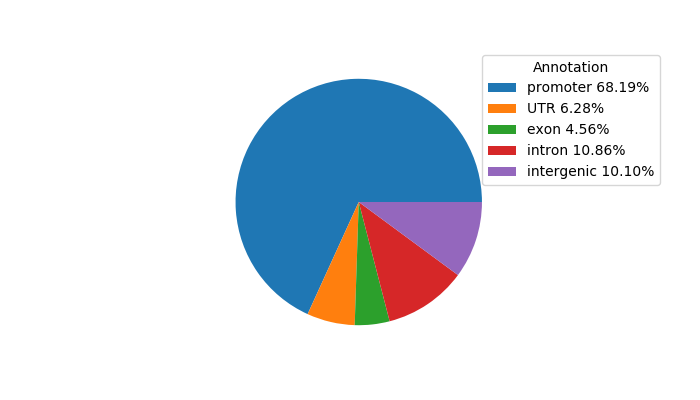
Top target CREs of the motif:
| Cis Regulatory Element (CRE) | Target Score | Top associated gene | Gene Info | Distance of CRE to TSS | CRE/Gene association probability |
|---|---|---|---|---|---|
| chr19_19174243_19174394 | 0.13 |
SLC25A42 |
solute carrier family 25, member 42 |
490 |
0.72 |
| chr8_41511463_41511684 | 0.09 |
NKX6-3 |
NK6 homeobox 3 |
2718 |
0.18 |
| chr19_4304476_4304627 | 0.08 |
FSD1 |
fibronectin type III and SPRY domain containing 1 |
46 |
0.94 |
| chr7_15726263_15726517 | 0.08 |
MEOX2 |
mesenchyme homeobox 2 |
47 |
0.98 |
| chr14_73704548_73704719 | 0.08 |
PAPLN |
papilin, proteoglycan-like sulfated glycoprotein |
428 |
0.79 |
| chrX_40034598_40034749 | 0.08 |
BCOR |
BCL6 corepressor |
1900 |
0.49 |
| chr3_12910192_12910522 | 0.08 |
AC034198.7 |
|
18199 |
0.14 |
| chr19_33765417_33765674 | 0.08 |
CTD-2540B15.11 |
|
25295 |
0.11 |
| chr4_154144370_154144521 | 0.07 |
TRIM2 |
tripartite motif containing 2 |
18827 |
0.19 |
| chr15_68112430_68112716 | 0.07 |
SKOR1 |
SKI family transcriptional corepressor 1 |
531 |
0.83 |
| chr6_167370368_167370519 | 0.06 |
RNASET2 |
ribonuclease T2 |
186 |
0.87 |
| chr7_101460826_101460977 | 0.06 |
CUX1 |
cut-like homeobox 1 |
19 |
0.98 |
| chr6_163834522_163834673 | 0.06 |
QKI |
QKI, KH domain containing, RNA binding |
1078 |
0.69 |
| chr16_718371_718640 | 0.05 |
RHOT2 |
ras homolog family member T2 |
296 |
0.66 |
| chr2_71693709_71693860 | 0.05 |
DYSF |
dysferlin |
48 |
0.98 |
| chr1_29448600_29448837 | 0.05 |
TMEM200B |
transmembrane protein 200B |
295 |
0.91 |
| chr10_49731313_49731514 | 0.05 |
ARHGAP22 |
Rho GTPase activating protein 22 |
868 |
0.65 |
| chr19_10654183_10654334 | 0.05 |
ATG4D |
autophagy related 4D, cysteine peptidase |
336 |
0.76 |
| chr2_30454407_30454726 | 0.05 |
LBH |
limb bud and heart development |
163 |
0.96 |
| chr7_155166439_155166623 | 0.05 |
BLACE |
B-cell acute lymphoblastic leukemia expressed |
5902 |
0.18 |
| chr2_11052081_11052232 | 0.05 |
KCNF1 |
potassium voltage-gated channel, subfamily F, member 1 |
93 |
0.98 |
| chr16_86968692_86968843 | 0.05 |
RP11-899L11.3 |
|
280754 |
0.01 |
| chr19_48996822_48997092 | 0.04 |
LMTK3 |
lemur tyrosine kinase 3 |
18104 |
0.09 |
| chr16_75033732_75033945 | 0.04 |
ZNRF1 |
zinc and ring finger 1, E3 ubiquitin protein ligase |
595 |
0.76 |
| chr11_76381975_76382126 | 0.04 |
LRRC32 |
leucine rich repeat containing 32 |
259 |
0.91 |
| chr13_25745444_25745788 | 0.04 |
AMER2 |
APC membrane recruitment protein 2 |
241 |
0.93 |
| chr1_110753630_110753781 | 0.04 |
KCNC4 |
potassium voltage-gated channel, Shaw-related subfamily, member 4 |
390 |
0.72 |
| chr1_228194389_228194540 | 0.04 |
WNT3A |
wingless-type MMTV integration site family, member 3A |
288 |
0.9 |
| chr1_62784603_62784939 | 0.04 |
KANK4 |
KN motif and ankyrin repeat domains 4 |
201 |
0.95 |
| chr8_55379558_55379709 | 0.03 |
SOX17 |
SRY (sex determining region Y)-box 17 |
9138 |
0.26 |
| chr6_100061828_100062580 | 0.03 |
PRDM13 |
PR domain containing 13 |
7598 |
0.19 |
| chr9_130965791_130965942 | 0.03 |
DNM1 |
dynamin 1 |
141 |
0.86 |
| chr1_9600228_9600966 | 0.03 |
SLC25A33 |
solute carrier family 25 (pyrimidine nucleotide carrier), member 33 |
1056 |
0.57 |
| chr2_173292406_173292557 | 0.03 |
ITGA6 |
integrin, alpha 6 |
36 |
0.95 |
| chr10_112403450_112403743 | 0.03 |
RBM20 |
RNA binding motif protein 20 |
559 |
0.6 |
| chr10_119135437_119135737 | 0.03 |
PDZD8 |
PDZ domain containing 8 |
609 |
0.77 |
| chr15_99646176_99646459 | 0.03 |
RP11-654A16.3 |
|
287 |
0.81 |
| chr15_31619464_31619615 | 0.03 |
KLF13 |
Kruppel-like factor 13 |
481 |
0.89 |
| chr2_178128811_178128962 | 0.03 |
AC079305.10 |
|
201 |
0.65 |
| chr19_41111618_41111808 | 0.03 |
ENSG00000266164 |
. |
1242 |
0.36 |
| chr4_183369356_183369507 | 0.02 |
TENM3 |
teneurin transmembrane protein 3 |
721 |
0.79 |
| chr18_11981846_11982049 | 0.02 |
IMPA2 |
inositol(myo)-1(or 4)-monophosphatase 2 |
278 |
0.9 |
| chr3_196696276_196696552 | 0.02 |
PIGZ |
phosphatidylinositol glycan anchor biosynthesis, class Z |
672 |
0.62 |
| chr21_36261605_36261866 | 0.02 |
RUNX1 |
runt-related transcription factor 1 |
299 |
0.95 |
| chr2_23886218_23886369 | 0.02 |
KLHL29 |
kelch-like family member 29 |
21031 |
0.26 |
| chr1_11724600_11724751 | 0.02 |
FBXO6 |
F-box protein 6 |
494 |
0.7 |
| chr1_207226735_207226886 | 0.02 |
PFKFB2 |
6-phosphofructo-2-kinase/fructose-2,6-biphosphatase 2 |
154 |
0.8 |
| chr1_207082970_207083121 | 0.02 |
IL24 |
interleukin 24 |
11867 |
0.14 |
| chr20_1875010_1875174 | 0.02 |
SIRPA |
signal-regulatory protein alpha |
62 |
0.98 |
| chr6_157801331_157801482 | 0.02 |
ZDHHC14 |
zinc finger, DHHC-type containing 14 |
759 |
0.74 |
| chr1_10458488_10458749 | 0.02 |
PGD |
phosphogluconate dehydrogenase |
31 |
0.96 |
| chr5_92956044_92956482 | 0.02 |
ENSG00000251725 |
. |
231 |
0.94 |
| chr8_146023905_146024105 | 0.02 |
ZNF517 |
zinc finger protein 517 |
256 |
0.85 |
| chr1_936066_936217 | 0.02 |
HES4 |
hes family bHLH transcription factor 4 |
589 |
0.53 |
| chr17_56234380_56234651 | 0.01 |
OR4D1 |
olfactory receptor, family 4, subfamily D, member 1 |
2021 |
0.25 |
| chr1_231297605_231297900 | 0.01 |
TRIM67 |
tripartite motif containing 67 |
106 |
0.97 |
| chr7_157486328_157486479 | 0.01 |
AC006003.3 |
|
46745 |
0.16 |
| chr2_130939540_130939691 | 0.01 |
MZT2B |
mitotic spindle organizing protein 2B |
114 |
0.8 |
| chr8_10191959_10192233 | 0.01 |
MSRA |
methionine sulfoxide reductase A |
33051 |
0.2 |
| chr17_12921001_12921175 | 0.01 |
ELAC2 |
elaC ribonuclease Z 2 |
88 |
0.97 |
| chr5_179223700_179223978 | 0.01 |
ENSG00000221394 |
. |
1507 |
0.23 |
| chr5_129239898_129240062 | 0.01 |
CHSY3 |
chondroitin sulfate synthase 3 |
185 |
0.93 |
| chr14_36002497_36002787 | 0.01 |
INSM2 |
insulinoma-associated 2 |
606 |
0.82 |
| chr16_1030754_1030971 | 0.01 |
AC009041.2 |
|
390 |
0.44 |
| chr6_159360341_159360710 | 0.01 |
ENSG00000223191 |
. |
12922 |
0.19 |
| chr16_4165609_4165795 | 0.01 |
ADCY9 |
adenylate cyclase 9 |
484 |
0.85 |
| chr19_50432907_50433192 | 0.01 |
NUP62 |
nucleoporin 62kDa |
48 |
0.67 |
| chr3_139654158_139654536 | 0.01 |
CLSTN2 |
calsyntenin 2 |
320 |
0.94 |
| chr2_238582144_238582414 | 0.01 |
LRRFIP1 |
leucine rich repeat (in FLII) interacting protein 1 |
18509 |
0.2 |
| chr21_32930676_32931085 | 0.01 |
TIAM1 |
T-cell lymphoma invasion and metastasis 1 |
410 |
0.65 |
| chrX_71131064_71131256 | 0.01 |
NHSL2 |
NHS-like 2 |
222 |
0.95 |
| chr17_17603799_17604090 | 0.01 |
RAI1 |
retinoic acid induced 1 |
18135 |
0.17 |
| chr16_30217757_30217917 | 0.01 |
RP11-347C12.3 |
Uncharacterized protein |
354 |
0.72 |
| chr13_28528810_28529001 | 0.01 |
ATP5EP2 |
ATP synthase, H+ transporting, mitochondrial F1 complex, epsilon subunit pseudogene 2 |
9562 |
0.14 |
| chrY_21154851_21155002 | 0.01 |
ENSG00000252766 |
. |
26047 |
0.25 |
| chr8_145550773_145550924 | 0.01 |
DGAT1 |
diacylglycerol O-acyltransferase 1 |
275 |
0.78 |
| chr6_18277677_18277884 | 0.01 |
ENSG00000199715 |
. |
4283 |
0.21 |
| chr2_129079674_129079825 | 0.01 |
HS6ST1 |
heparan sulfate 6-O-sulfotransferase 1 |
3598 |
0.29 |
| chr19_33773041_33773249 | 0.01 |
CTD-2540B15.11 |
|
17695 |
0.12 |
| chr17_15847824_15848196 | 0.01 |
ADORA2B |
adenosine A2b receptor |
221 |
0.94 |
| chr4_87812904_87813288 | 0.01 |
C4orf36 |
chromosome 4 open reading frame 36 |
452 |
0.86 |
| chrX_70150765_70150916 | 0.01 |
SLC7A3 |
solute carrier family 7 (cationic amino acid transporter, y+ system), member 3 |
106 |
0.97 |
| chr1_155051511_155051662 | 0.01 |
EFNA3 |
ephrin-A3 |
201 |
0.85 |
| chr1_93426537_93426688 | 0.01 |
FAM69A |
family with sequence similarity 69, member A |
445 |
0.74 |
| chr7_132260829_132261020 | 0.01 |
PLXNA4 |
plexin A4 |
305 |
0.94 |
| chr6_3850608_3850759 | 0.01 |
FAM50B |
family with sequence similarity 50, member B |
1061 |
0.56 |
| chr9_131419199_131419842 | 0.01 |
WDR34 |
WD repeat domain 34 |
454 |
0.72 |
| chr10_50606234_50606396 | 0.01 |
DRGX |
dorsal root ganglia homeobox |
2818 |
0.27 |
| chr17_54910262_54910635 | 0.01 |
C17orf67 |
chromosome 17 open reading frame 67 |
808 |
0.44 |
| chr11_6676804_6676955 | 0.01 |
DCHS1 |
dachsous cadherin-related 1 |
206 |
0.87 |
| chr12_125053352_125053581 | 0.01 |
NCOR2 |
nuclear receptor corepressor 2 |
1456 |
0.58 |
| chr7_22539874_22540117 | 0.01 |
STEAP1B |
STEAP family member 1B |
122 |
0.97 |
| chr15_65670506_65670816 | 0.01 |
IGDCC3 |
immunoglobulin superfamily, DCC subclass, member 3 |
283 |
0.9 |
| chr11_120894551_120894800 | 0.00 |
TBCEL |
tubulin folding cofactor E-like |
106 |
0.98 |
| chr11_63771531_63771682 | 0.00 |
OTUB1 |
OTU domain, ubiquitin aldehyde binding 1 |
17292 |
0.1 |
| chr17_16487655_16488110 | 0.00 |
ZNF287 |
zinc finger protein 287 |
15362 |
0.16 |
| chr5_159546835_159547068 | 0.00 |
PWWP2A |
PWWP domain containing 2A |
521 |
0.78 |
| chr22_50969265_50969416 | 0.00 |
TYMP |
thymidine phosphorylase |
855 |
0.28 |
| chr1_117113459_117113610 | 0.00 |
CD58 |
CD58 molecule |
114 |
0.96 |
| chr6_45631315_45631560 | 0.00 |
ENSG00000252738 |
. |
17596 |
0.29 |
| chrX_49033431_49033582 | 0.00 |
PLP2 |
proteolipid protein 2 (colonic epithelium-enriched) |
5233 |
0.09 |
| chr9_139501841_139501992 | 0.00 |
ENSG00000252440 |
. |
4949 |
0.12 |
| chr19_8477814_8477965 | 0.00 |
MARCH2 |
membrane-associated ring finger (C3HC4) 2, E3 ubiquitin protein ligase |
265 |
0.84 |
| chr2_202316811_202317113 | 0.00 |
STRADB |
STE20-related kinase adaptor beta |
443 |
0.6 |
| chr7_44835539_44835875 | 0.00 |
PPIA |
peptidylprolyl isomerase A (cyclophilin A) |
572 |
0.69 |
| chr19_12780803_12780979 | 0.00 |
WDR83 |
WD repeat domain 83 |
171 |
0.72 |
| chr1_210111505_210111656 | 0.00 |
SYT14 |
synaptotagmin XIV |
4 |
0.99 |
| chr1_1285139_1285398 | 0.00 |
DVL1 |
dishevelled segment polarity protein 1 |
538 |
0.51 |
| chr7_89783512_89783724 | 0.00 |
STEAP1 |
six transmembrane epithelial antigen of the prostate 1 |
71 |
0.97 |
Network of associatons between targets according to the STRING database.

Gene Ontology Analysis
Gene overrepresentation in biological process category:
| Log-likelihood per target | Total log-likelihood | Term | Description |
|---|---|---|---|
| 0.0 | 0.1 | GO:0001757 | somite specification(GO:0001757) |
| 0.0 | 0.1 | GO:0000301 | retrograde transport, vesicle recycling within Golgi(GO:0000301) |
| 0.0 | 0.0 | GO:0048669 | negative regulation of heart induction by canonical Wnt signaling pathway(GO:0003136) negative regulation of cardioblast cell fate specification(GO:0009997) cardioblast cell fate commitment(GO:0042684) cardioblast cell fate specification(GO:0042685) regulation of cardioblast cell fate specification(GO:0042686) collateral sprouting in absence of injury(GO:0048669) negative regulation of cardioblast differentiation(GO:0051892) cardiac cell fate specification(GO:0060912) negative regulation of heart induction(GO:1901320) negative regulation of cardiocyte differentiation(GO:1905208) regulation of cardiac cell fate specification(GO:2000043) negative regulation of cardiac cell fate specification(GO:2000044) |

