Project
ENCODE: ATAC-seq of different tissues during embryonic development
Navigation
Downloads

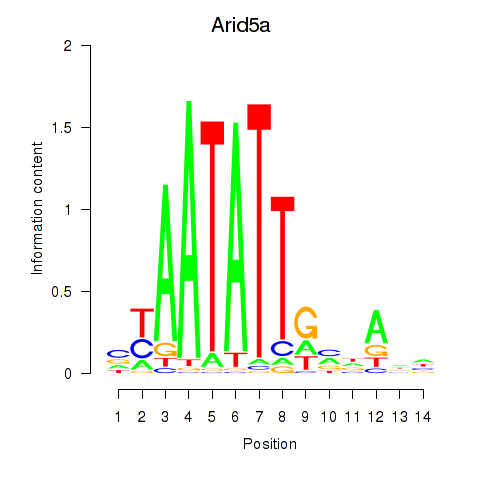
Results for Arid5a
Z-value: 1.11
Motif logo
Transcription factors associated with Arid5a
| Gene Symbol | Gene ID | Gene Info |
|---|---|---|
|
Arid5a
|
ENSMUSG00000037447.10 | AT rich interactive domain 5A (MRF1-like) |
Correlations of motif activity and signal intensity at CREs associated with the motif's TFs:
This plot shows correlation between observed signal intensity of a CRE associated with the transcription factor across all samples and activity of the motif.
For each TF, only the top 5 correlated CREs are shown.
| CRE | Gene | Distance | Association probability | Pearson corr. coef. | P-value | Plot |
|---|---|---|---|---|---|---|
| chr1_36304948_36305131 | Arid5a | 2694 | 0.196892 | -0.48 | 2.2e-04 | Click! |
| chr1_36304680_36304831 | Arid5a | 2978 | 0.185889 | -0.36 | 6.3e-03 | Click! |
| chr1_36323394_36323545 | Arid5a | 6442 | 0.132451 | -0.30 | 2.5e-02 | Click! |
| chr1_36303331_36303632 | Arid5a | 4252 | 0.159341 | -0.30 | 2.6e-02 | Click! |
| chr1_36324171_36324330 | Arid5a | 7223 | 0.129114 | -0.29 | 3.3e-02 | Click! |
Activity of the Arid5a motif across conditions
Conditions sorted by the z-value of the Arid5a motif activity
Move your cursor over a bar to see sample name and corresponding Z-value.
Top target CREs of the motif:
| Cis Regulatory Element (CRE) | Target Score | Top associated gene | Gene Info | Distance of CRE to TSS | CRE/Gene association probability |
|---|---|---|---|---|---|
| chr1_67221620_67221771 | 2.42 |
Gm15668 |
predicted gene 15668 |
27505 |
0.19 |
| chr10_78753316_78753475 | 2.31 |
Ccdc105 |
coiled-coil domain containing 105 |
330 |
0.82 |
| chr8_55034088_55034270 | 1.92 |
Gm45264 |
predicted gene 45264 |
5778 |
0.14 |
| chr7_105600032_105600389 | 1.69 |
Hpx |
hemopexin |
73 |
0.94 |
| chr7_44603776_44603927 | 1.66 |
Kcnc3 |
potassium voltage gated channel, Shaw-related subfamily, member 3 |
7758 |
0.08 |
| chr2_58755284_58755435 | 1.65 |
Upp2 |
uridine phosphorylase 2 |
147 |
0.96 |
| chr16_84920068_84920254 | 1.60 |
Gm49568 |
predicted gene, 49568 |
26329 |
0.14 |
| chr3_4796668_4797120 | 1.60 |
1110015O18Rik |
RIKEN cDNA 1110015O18 gene |
664 |
0.77 |
| chr8_71602133_71603459 | 1.59 |
Fam129c |
family with sequence similarity 129, member C |
445 |
0.63 |
| chr12_49951906_49952207 | 1.53 |
Gm7481 |
predicted gene 7481 |
110305 |
0.07 |
| chr18_22343488_22344114 | 1.53 |
Asxl3 |
additional sex combs like 3, transcriptional regulator |
445 |
0.91 |
| chr14_36969226_36969443 | 1.43 |
Ccser2 |
coiled-coil serine rich 2 |
557 |
0.79 |
| chr12_84198469_84198620 | 1.43 |
Gm31513 |
predicted gene, 31513 |
2575 |
0.16 |
| chr10_32301324_32301530 | 1.40 |
C030006N10Rik |
RIKEN cDNA C030006N10 gene |
21734 |
0.2 |
| chr10_22479940_22480092 | 1.38 |
Gm26585 |
predicted gene, 26585 |
26496 |
0.17 |
| chr13_69263758_69264115 | 1.36 |
Gm4812 |
predicted gene 4812 |
81719 |
0.09 |
| chr3_84034408_84034678 | 1.35 |
Tmem131l |
transmembrane 131 like |
5585 |
0.25 |
| chr13_104595017_104595179 | 1.33 |
2610204G07Rik |
RIKEN cDNA 2610204G07 gene |
89833 |
0.09 |
| chr4_49572335_49572486 | 1.28 |
Tmem246 |
transmembrane protein 246 |
21480 |
0.13 |
| chr8_84927654_84927805 | 1.26 |
Mast1 |
microtubule associated serine/threonine kinase 1 |
1046 |
0.24 |
| chr8_90669516_90669667 | 1.25 |
Gm45639 |
predicted gene 45639 |
5367 |
0.21 |
| chr11_35280959_35281110 | 1.24 |
Gm12123 |
predicted gene 12123 |
42636 |
0.16 |
| chr7_107693030_107693181 | 1.22 |
Ppfibp2 |
PTPRF interacting protein, binding protein 2 (liprin beta 2) |
27794 |
0.13 |
| chr3_57386534_57386685 | 1.22 |
Gm5276 |
predicted gene 5276 |
24221 |
0.18 |
| chr1_124652334_124652530 | 1.21 |
Gm28299 |
predicted gene 28299 |
36836 |
0.22 |
| chr1_19211898_19212189 | 1.19 |
Tfap2b |
transcription factor AP-2 beta |
11 |
0.98 |
| chr13_100026063_100026214 | 1.19 |
Mccc2 |
methylcrotonoyl-Coenzyme A carboxylase 2 (beta) |
10499 |
0.19 |
| chr12_14056141_14056292 | 1.17 |
Gm48480 |
predicted gene, 48480 |
25864 |
0.19 |
| chr11_88356603_88356961 | 1.13 |
Gm15893 |
predicted gene 15893 |
491 |
0.76 |
| chr9_10230307_10230458 | 1.12 |
Gm24496 |
predicted gene, 24496 |
60205 |
0.14 |
| chr7_38184556_38184765 | 1.10 |
1600014C10Rik |
RIKEN cDNA 1600014C10 gene |
762 |
0.52 |
| chr7_96555432_96555583 | 1.09 |
Tenm4 |
teneurin transmembrane protein 4 |
33109 |
0.2 |
| chr4_68595404_68595555 | 1.07 |
Brinp1 |
bone morphogenic protein/retinoic acid inducible neural specific 1 |
233879 |
0.02 |
| chr7_64741665_64742004 | 1.07 |
Apba2 |
amyloid beta (A4) precursor protein-binding, family A, member 2 |
2005 |
0.39 |
| chr8_64790589_64790740 | 1.05 |
Klhl2 |
kelch-like 2, Mayven |
9000 |
0.16 |
| chr8_114592030_114592212 | 1.03 |
Gm16116 |
predicted gene 16116 |
2779 |
0.29 |
| chr3_53207177_53207328 | 1.03 |
Lhfp |
lipoma HMGIC fusion partner |
22073 |
0.18 |
| chr13_81329913_81330086 | 1.03 |
Adgrv1 |
adhesion G protein-coupled receptor V1 |
12837 |
0.26 |
| chr8_17537632_17537783 | 1.01 |
Csmd1 |
CUB and Sushi multiple domains 1 |
2121 |
0.49 |
| chr10_87032765_87033054 | 0.99 |
Stab2 |
stabilin 2 |
24884 |
0.14 |
| chr10_20286388_20286827 | 0.98 |
Gm48249 |
predicted gene, 48249 |
19 |
0.96 |
| chr3_136677756_136677907 | 0.96 |
Ppp3ca |
protein phosphatase 3, catalytic subunit, alpha isoform |
7061 |
0.23 |
| chr8_98065388_98065708 | 0.96 |
Gm17997 |
predicted gene, 17997 |
131967 |
0.05 |
| chr10_63410259_63410415 | 0.95 |
Gm7530 |
predicted gene 7530 |
2662 |
0.19 |
| chr13_114460147_114460556 | 0.94 |
Fst |
follistatin |
1400 |
0.31 |
| chr8_123813265_123813430 | 0.93 |
Rab4a |
RAB4A, member RAS oncogene family |
7279 |
0.1 |
| chr5_101524000_101524342 | 0.90 |
Gm43103 |
predicted gene 43103 |
17842 |
0.24 |
| chr8_9934851_9935294 | 0.88 |
Gm10067 |
predicted gene 10067 |
15609 |
0.16 |
| chr13_75992746_75992897 | 0.87 |
Spata9 |
spermatogenesis associated 9 |
25074 |
0.1 |
| chr3_138263607_138263758 | 0.87 |
Adh1 |
alcohol dehydrogenase 1 (class I) |
2691 |
0.18 |
| chr17_75876974_75877125 | 0.87 |
Gm4710 |
predicted gene 4710 |
16026 |
0.25 |
| chr18_69834677_69834850 | 0.87 |
Gm50215 |
predicted gene, 50215 |
75961 |
0.1 |
| chr3_79818299_79818691 | 0.86 |
Gm26420 |
predicted gene, 26420 |
16438 |
0.17 |
| chr14_122607548_122607718 | 0.85 |
Gm49259 |
predicted gene, 49259 |
2480 |
0.27 |
| chr4_111553060_111553213 | 0.84 |
Agbl4 |
ATP/GTP binding protein-like 4 |
13559 |
0.27 |
| chr3_127626187_127626399 | 0.84 |
Neurog2 |
neurogenin 2 |
6842 |
0.13 |
| chr6_148338244_148338395 | 0.84 |
Rps4l |
ribosomal protein S4-like |
16337 |
0.15 |
| chr6_145918369_145918520 | 0.84 |
Sspn |
sarcospan |
13197 |
0.16 |
| chr11_64188058_64188518 | 0.84 |
Gm12290 |
predicted gene 12290 |
23715 |
0.24 |
| chr5_20583062_20583213 | 0.83 |
Gm3544 |
predicted gene 3544 |
5459 |
0.25 |
| chr5_111602149_111602572 | 0.82 |
Gm42489 |
predicted gene 42489 |
8744 |
0.21 |
| chr17_62784634_62784785 | 0.82 |
Efna5 |
ephrin A5 |
96435 |
0.09 |
| chr3_77831850_77832047 | 0.82 |
Gm37576 |
predicted gene, 37576 |
41205 |
0.19 |
| chr2_27981631_27981939 | 0.82 |
Col5a1 |
collagen, type V, alpha 1 |
35656 |
0.15 |
| chr9_102975978_102976271 | 0.81 |
Slco2a1 |
solute carrier organic anion transporter family, member 2a1 |
12588 |
0.17 |
| chr6_5198692_5198843 | 0.81 |
Pon1 |
paraoxonase 1 |
4821 |
0.21 |
| chr16_67061894_67062045 | 0.81 |
Cadm2 |
cell adhesion molecule 2 |
108635 |
0.07 |
| chr4_114780370_114780653 | 0.81 |
Gm12830 |
predicted gene 12830 |
41211 |
0.14 |
| chr7_3684248_3684455 | 0.78 |
Mboat7 |
membrane bound O-acyltransferase domain containing 7 |
177 |
0.85 |
| chr2_157801820_157801971 | 0.78 |
Ctnnbl1 |
catenin, beta like 1 |
12031 |
0.21 |
| chr13_81343337_81343488 | 0.77 |
Adgrv1 |
adhesion G protein-coupled receptor V1 |
97 |
0.98 |
| chr7_119251734_119252076 | 0.76 |
Gm4083 |
predicted gene 4083 |
49802 |
0.12 |
| chr5_90690248_90690399 | 0.75 |
Rassf6 |
Ras association (RalGDS/AF-6) domain family member 6 |
49666 |
0.09 |
| chr8_40869481_40869728 | 0.75 |
Slc7a2 |
solute carrier family 7 (cationic amino acid transporter, y+ system), member 2 |
5344 |
0.17 |
| chr10_30000963_30001114 | 0.74 |
Gm48215 |
predicted gene, 48215 |
394 |
0.88 |
| chr6_129333639_129333791 | 0.73 |
Clec2m |
C-type lectin domain family 2, member m |
1919 |
0.23 |
| chr3_123690157_123690344 | 0.73 |
Ndst3 |
N-deacetylase/N-sulfotransferase (heparan glucosaminyl) 3 |
30 |
0.97 |
| chr1_25107573_25107724 | 0.73 |
Gm29414 |
predicted gene 29414 |
80416 |
0.07 |
| chrX_57712548_57712699 | 0.72 |
Gm8107 |
predicted gene 8107 |
25932 |
0.14 |
| chr12_112221644_112222111 | 0.72 |
Gm20368 |
predicted gene, 20368 |
16724 |
0.17 |
| chr9_96924055_96924211 | 0.72 |
Gm8524 |
predicted gene 8524 |
18626 |
0.14 |
| chr1_91708999_91709150 | 0.72 |
Twist2 |
twist basic helix-loop-helix transcription factor 2 |
92387 |
0.06 |
| chr17_93409383_93409594 | 0.71 |
Gm50001 |
predicted gene, 50001 |
17790 |
0.24 |
| chr1_68047124_68047492 | 0.71 |
Gm15671 |
predicted gene 15671 |
23065 |
0.22 |
| chr1_23282966_23283129 | 0.71 |
Gm27028 |
predicted gene, 27028 |
8490 |
0.12 |
| chr10_22579573_22579724 | 0.71 |
Slc2a12 |
solute carrier family 2 (facilitated glucose transporter), member 12 |
65363 |
0.1 |
| chr15_51941440_51941591 | 0.71 |
Gm48923 |
predicted gene, 48923 |
44428 |
0.11 |
| chr1_20132404_20132557 | 0.70 |
Gm37315 |
predicted gene, 37315 |
66932 |
0.14 |
| chr6_101904608_101904759 | 0.70 |
Gm44177 |
predicted gene, 44177 |
8590 |
0.26 |
| chr13_18868291_18868517 | 0.70 |
Vps41 |
VPS41 HOPS complex subunit |
23541 |
0.19 |
| chr2_60863248_60863595 | 0.70 |
Rbms1 |
RNA binding motif, single stranded interacting protein 1 |
18017 |
0.26 |
| chr4_76144837_76144988 | 0.69 |
Ptprd |
protein tyrosine phosphatase, receptor type, D |
10769 |
0.31 |
| chr10_130469983_130470134 | 0.69 |
Gm18755 |
predicted gene, 18755 |
551 |
0.68 |
| chr1_179104589_179104740 | 0.69 |
Smyd3 |
SET and MYND domain containing 3 |
115319 |
0.07 |
| chr6_63964350_63964529 | 0.69 |
Gm44072 |
predicted gene, 44072 |
77118 |
0.11 |
| chr14_19977737_19977924 | 0.69 |
Gng2 |
guanine nucleotide binding protein (G protein), gamma 2 |
203 |
0.95 |
| chr8_73920568_73920719 | 0.68 |
Gm7948 |
predicted gene 7948 |
48950 |
0.19 |
| chr7_107699967_107700118 | 0.68 |
Ppfibp2 |
PTPRF interacting protein, binding protein 2 (liprin beta 2) |
34731 |
0.11 |
| chr12_13984177_13984402 | 0.68 |
Gm48479 |
predicted gene, 48479 |
28795 |
0.19 |
| chr6_15839943_15840094 | 0.66 |
Gm43990 |
predicted gene, 43990 |
3929 |
0.29 |
| chr8_70618980_70619268 | 0.65 |
Lrrc25 |
leucine rich repeat containing 25 |
2280 |
0.14 |
| chr3_34322517_34323142 | 0.65 |
Gm38505 |
predicted gene, 38505 |
28883 |
0.19 |
| chr3_126505619_126505770 | 0.65 |
Gm20568 |
predicted gene, 20568 |
57951 |
0.09 |
| chr10_46718374_46718662 | 0.65 |
Gm19994 |
predicted gene, 19994 |
48374 |
0.16 |
| chr5_89450856_89451007 | 0.64 |
Gc |
vitamin D binding protein |
6967 |
0.25 |
| chr12_29096469_29096838 | 0.63 |
4833405L11Rik |
RIKEN cDNA 4833405L11 gene |
10084 |
0.23 |
| chr13_81639716_81639899 | 0.63 |
Adgrv1 |
adhesion G protein-coupled receptor V1 |
6653 |
0.19 |
| chr17_22866359_22866541 | 0.63 |
Zfp945 |
zinc finger protein 945 |
655 |
0.63 |
| chr4_53120135_53120286 | 0.63 |
Abca1 |
ATP-binding cassette, sub-family A (ABC1), member 1 |
39685 |
0.15 |
| chr5_51868161_51868312 | 0.63 |
Gm43606 |
predicted gene 43606 |
9461 |
0.17 |
| chr7_29179376_29179536 | 0.62 |
Psmd8 |
proteasome (prosome, macropain) 26S subunit, non-ATPase, 8 |
435 |
0.62 |
| chr5_74242721_74242993 | 0.62 |
Gm42599 |
predicted gene 42599 |
6759 |
0.17 |
| chr9_10529630_10529781 | 0.62 |
Gm46103 |
predicted gene, 46103 |
53770 |
0.16 |
| chr9_63651656_63651889 | 0.62 |
Aagab |
alpha- and gamma-adaptin binding protein |
13119 |
0.19 |
| chr8_34456648_34456799 | 0.61 |
Gm45349 |
predicted gene 45349 |
16272 |
0.17 |
| chr1_174637558_174637709 | 0.60 |
Fmn2 |
formin 2 |
25084 |
0.24 |
| chr15_10202683_10202834 | 0.60 |
Prlr |
prolactin receptor |
10707 |
0.28 |
| chr3_86779786_86779937 | 0.60 |
Gm37876 |
predicted gene, 37876 |
1208 |
0.49 |
| chr14_22708470_22708671 | 0.60 |
Gm7473 |
predicted gene 7473 |
66674 |
0.13 |
| chr13_28552152_28552303 | 0.59 |
2610307P16Rik |
RIKEN cDNA 2610307P16 gene |
31119 |
0.19 |
| chr12_55983531_55983948 | 0.59 |
Gm5183 |
predicted gene 5183 |
66794 |
0.09 |
| chr1_20905491_20905707 | 0.59 |
Gm24171 |
predicted gene, 24171 |
9941 |
0.12 |
| chr13_107075011_107075174 | 0.59 |
Gm31452 |
predicted gene, 31452 |
11397 |
0.17 |
| chr2_35103638_35103965 | 0.59 |
AI182371 |
expressed sequence AI182371 |
2258 |
0.25 |
| chrX_10841412_10841563 | 0.59 |
Gm14473 |
predicted gene 14473 |
24146 |
0.22 |
| chr7_98935304_98935457 | 0.59 |
Gm23479 |
predicted gene, 23479 |
514 |
0.74 |
| chr2_65845289_65845528 | 0.59 |
Csrnp3 |
cysteine-serine-rich nuclear protein 3 |
359 |
0.89 |
| chr2_172934901_172935069 | 0.58 |
Bmp7 |
bone morphogenetic protein 7 |
5107 |
0.21 |
| chr5_145881304_145881464 | 0.58 |
Cyp3a11 |
cytochrome P450, family 3, subfamily a, polypeptide 11 |
1420 |
0.38 |
| chr4_129206921_129207085 | 0.58 |
Yars |
tyrosyl-tRNA synthetase |
2535 |
0.19 |
| chr9_74862086_74862680 | 0.58 |
Onecut1 |
one cut domain, family member 1 |
462 |
0.77 |
| chr3_127367544_127367695 | 0.58 |
Gm42969 |
predicted gene 42969 |
26087 |
0.13 |
| chr15_91180038_91180189 | 0.58 |
Abcd2 |
ATP-binding cassette, sub-family D (ALD), member 2 |
7928 |
0.21 |
| chr5_40294986_40295137 | 0.57 |
Gm2810 |
predicted pseudogene 2810 |
33377 |
0.24 |
| chr18_64182442_64182593 | 0.57 |
St8sia3os |
ST8 alpha-N-acetyl-neuraminide alpha-2,8-sialyltransferase 3, opposite strand |
13713 |
0.15 |
| chr5_108674685_108675069 | 0.57 |
Slc26a1 |
solute carrier family 26 (sulfate transporter), member 1 |
92 |
0.94 |
| chrX_77473650_77473824 | 0.57 |
Gm5937 |
predicted gene 5937 |
17151 |
0.21 |
| chr17_84422138_84422289 | 0.57 |
Thada |
thyroid adenoma associated |
13475 |
0.2 |
| chr7_99170033_99170322 | 0.57 |
Dgat2 |
diacylglycerol O-acyltransferase 2 |
71 |
0.96 |
| chr6_137100379_137100530 | 0.57 |
Rerg |
RAS-like, estrogen-regulated, growth-inhibitor |
39609 |
0.15 |
| chr5_88699513_88699664 | 0.56 |
Mob1b |
MOB kinase activator 1B |
21267 |
0.13 |
| chr6_17377488_17377690 | 0.56 |
Gm15581 |
predicted gene 15581 |
8015 |
0.19 |
| chr5_76528839_76528990 | 0.56 |
Exoc1 |
exocyst complex component 1 |
397 |
0.85 |
| chr8_102027364_102027515 | 0.56 |
Gm22223 |
predicted gene, 22223 |
487731 |
0.01 |
| chr5_39856661_39857212 | 0.56 |
Gm7816 |
predicted pseudogene 7816 |
58722 |
0.14 |
| chr1_166429081_166429243 | 0.56 |
Gm16418 |
predicted pseudogene 16418 |
2713 |
0.21 |
| chr5_105826866_105827017 | 0.56 |
Lrrc8d |
leucine rich repeat containing 8D |
2430 |
0.21 |
| chr12_27083107_27083496 | 0.56 |
Gm9866 |
predicted gene 9866 |
31694 |
0.24 |
| chr11_68274100_68274260 | 0.55 |
Gm12305 |
predicted gene 12305 |
3301 |
0.28 |
| chr8_45264500_45264652 | 0.55 |
F11 |
coagulation factor XI |
2545 |
0.25 |
| chr10_119721989_119722201 | 0.55 |
Grip1 |
glutamate receptor interacting protein 1 |
30041 |
0.16 |
| chr19_21409302_21409461 | 0.55 |
Gda |
guanine deaminase |
31478 |
0.2 |
| chr5_67539883_67540078 | 0.54 |
1700025A08Rik |
RIKEN cDNA 1700025A08 gene |
67846 |
0.07 |
| chr5_39126248_39126431 | 0.54 |
Gm42857 |
predicted gene 42857 |
123308 |
0.05 |
| chr15_54768397_54768584 | 0.54 |
Gm7577 |
predicted gene 7577 |
2977 |
0.3 |
| chr1_59174641_59174801 | 0.53 |
Mpp4 |
membrane protein, palmitoylated 4 (MAGUK p55 subfamily member 4) |
11332 |
0.13 |
| chr8_48731254_48731405 | 0.53 |
Tenm3 |
teneurin transmembrane protein 3 |
56639 |
0.15 |
| chr14_104567727_104567899 | 0.53 |
Gm22021 |
predicted gene, 22021 |
23281 |
0.16 |
| chr15_74175414_74175565 | 0.53 |
Gm15387 |
predicted gene 15387 |
81156 |
0.09 |
| chr2_4587704_4588084 | 0.53 |
Gm13179 |
predicted gene 13179 |
607 |
0.75 |
| chr16_78238212_78238715 | 0.53 |
Gm25916 |
predicted gene, 25916 |
1795 |
0.31 |
| chr15_22046957_22047266 | 0.52 |
Gm49187 |
predicted gene, 49187 |
88679 |
0.1 |
| chr11_113308657_113308808 | 0.52 |
4732490B19Rik |
RIKEN cDNA 4732490B19 gene |
99063 |
0.07 |
| chr2_162662555_162662859 | 0.52 |
9430021M05Rik |
RIKEN cDNA 9430021M05 gene |
1544 |
0.3 |
| chr1_50647049_50647200 | 0.52 |
Gm20118 |
predicted gene, 20118 |
114094 |
0.07 |
| chr16_72639633_72639784 | 0.52 |
Robo1 |
roundabout guidance receptor 1 |
23441 |
0.28 |
| chr8_104023095_104023520 | 0.51 |
Gm8748 |
predicted gene 8748 |
47842 |
0.12 |
| chr6_23272869_23273356 | 0.50 |
C130093G08Rik |
RIKEN cDNA C130093G08 gene |
21979 |
0.16 |
| chr17_11990784_11990935 | 0.50 |
Prkn |
parkin RBR E3 ubiquitin protein ligase |
39057 |
0.2 |
| chr7_108797287_108797500 | 0.50 |
Gm45232 |
predicted gene 45232 |
2390 |
0.19 |
| chr4_108074585_108074736 | 0.50 |
Scp2 |
sterol carrier protein 2, liver |
3241 |
0.18 |
| chr15_18190282_18190433 | 0.49 |
Gm8318 |
predicted gene 8318 |
26476 |
0.22 |
| chr4_141755113_141755264 | 0.49 |
Agmat |
agmatine ureohydrolase (agmatinase) |
8516 |
0.12 |
| chr4_150426480_150426643 | 0.49 |
Rere |
arginine glutamic acid dipeptide (RE) repeats |
20167 |
0.22 |
| chr8_20423824_20423975 | 0.49 |
2610005L07Rik |
RIKEN cDNA 2610005L07 gene |
915 |
0.61 |
| chr17_47981564_47981928 | 0.49 |
Gm14871 |
predicted gene 14871 |
21826 |
0.12 |
| chr4_84432234_84432385 | 0.49 |
Gm12421 |
predicted gene 12421 |
3185 |
0.36 |
| chr14_59883614_59883765 | 0.48 |
Gm9013 |
predicted gene 9013 |
156802 |
0.03 |
| chr2_63669522_63669680 | 0.48 |
Gm23503 |
predicted gene, 23503 |
237407 |
0.02 |
| chr10_21444559_21444841 | 0.48 |
Gm48386 |
predicted gene, 48386 |
936 |
0.49 |
| chr8_48322987_48323138 | 0.47 |
Tenm3 |
teneurin transmembrane protein 3 |
22963 |
0.23 |
| chr19_38356392_38356694 | 0.47 |
Gm50150 |
predicted gene, 50150 |
13929 |
0.14 |
| chr10_20954548_20954710 | 0.47 |
Ahi1 |
Abelson helper integration site 1 |
2004 |
0.38 |
| chrX_7322411_7322562 | 0.47 |
Clcn5 |
chloride channel, voltage-sensitive 5 |
3128 |
0.2 |
| chr12_101958652_101958891 | 0.46 |
Atxn3 |
ataxin 3 |
525 |
0.72 |
| chr13_69700758_69700909 | 0.46 |
Gm48819 |
predicted gene, 48819 |
3022 |
0.14 |
| chr14_98833753_98833964 | 0.45 |
Gm49018 |
predicted gene, 49018 |
87087 |
0.08 |
| chr3_158560332_158560585 | 0.45 |
Lrrc7 |
leucine rich repeat containing 7 |
878 |
0.73 |
| chr5_49329145_49329296 | 0.45 |
Kcnip4 |
Kv channel interacting protein 4 |
43561 |
0.13 |
| chr17_63979339_63979498 | 0.45 |
Fer |
fer (fms/fps related) protein kinase |
41446 |
0.2 |
| chr13_96985086_96985237 | 0.45 |
Gm48609 |
predicted gene, 48609 |
30138 |
0.12 |
| chr3_37917343_37917494 | 0.45 |
Gm20755 |
predicted gene, 20755 |
18605 |
0.15 |
| chr6_103431040_103431244 | 0.44 |
Chl1 |
cell adhesion molecule L1-like |
79444 |
0.09 |
| chr1_23335200_23335354 | 0.44 |
Gm20954 |
predicted gene, 20954 |
11322 |
0.15 |
| chr2_118451199_118451350 | 0.44 |
Eif2ak4 |
eukaryotic translation initiation factor 2 alpha kinase 4 |
5886 |
0.17 |
| chr15_36914867_36915038 | 0.44 |
Gm41300 |
predicted gene, 41300 |
16734 |
0.15 |
| chr5_109466914_109467109 | 0.44 |
Gm18555 |
predicted gene, 18555 |
6385 |
0.19 |
| chr2_66171763_66171914 | 0.43 |
Gm13618 |
predicted gene 13618 |
15998 |
0.16 |
| chr2_5590130_5590305 | 0.43 |
Gm13216 |
predicted gene 13216 |
13354 |
0.26 |
| chr16_93874975_93875126 | 0.43 |
Chaf1b |
chromatin assembly factor 1, subunit B (p60) |
8851 |
0.13 |
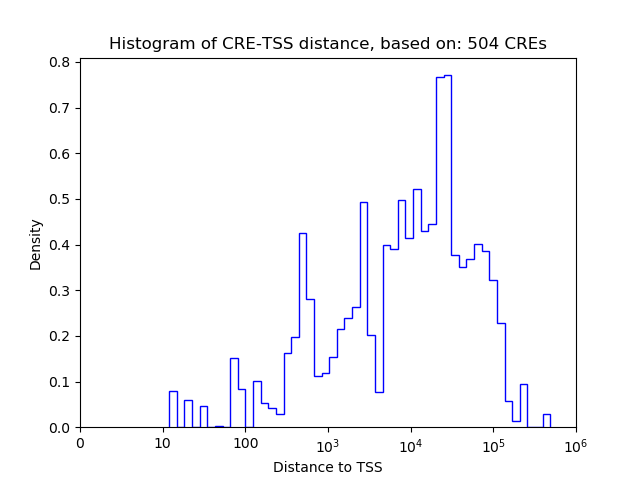
Histogram of CRE-TSS distances for CREs targeted by :
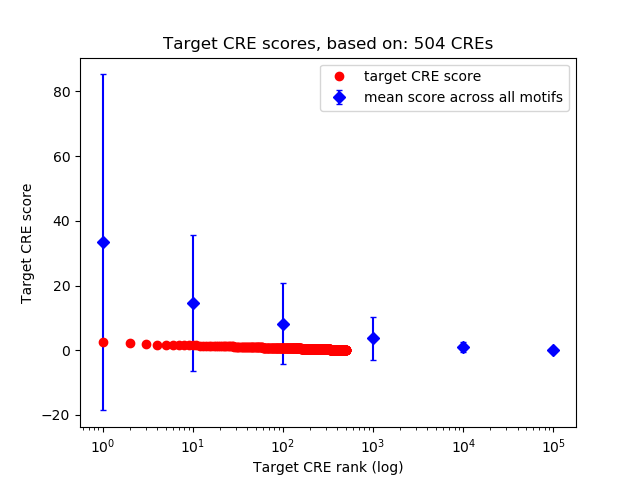
Rank distribution of CRE target scores:
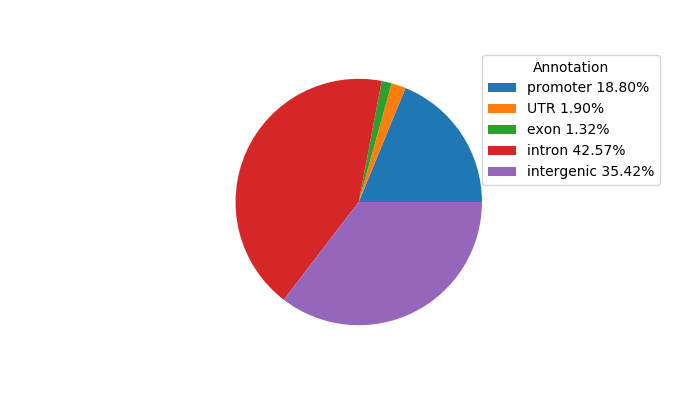
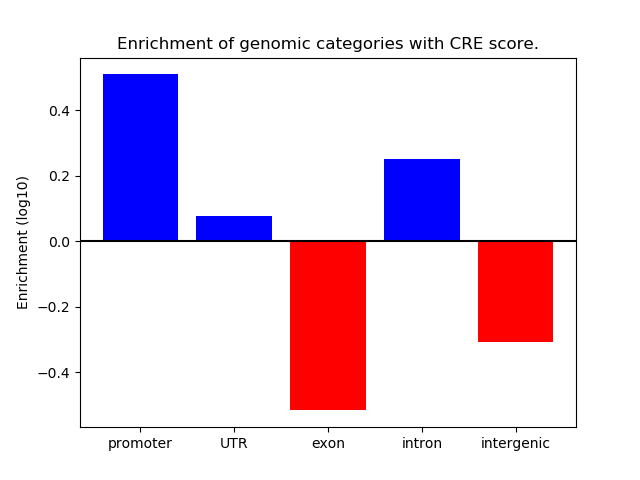
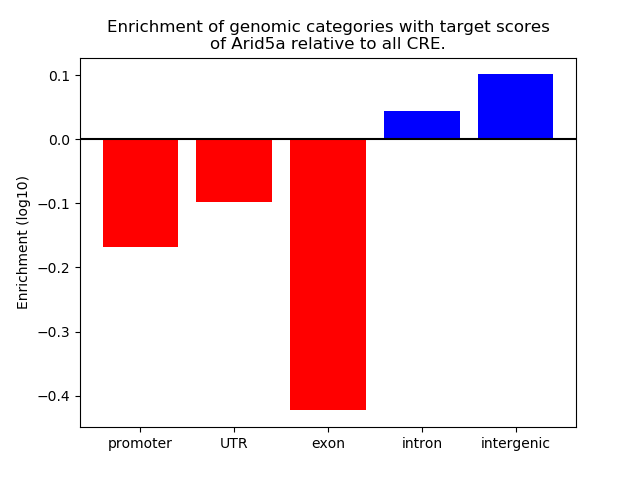
Distribution of target CREs across different genomic regions:
Network of associatons between targets according to the STRING database.

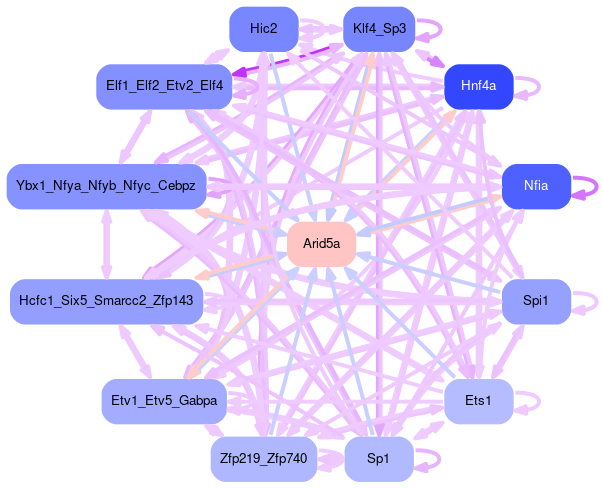
Gene Ontology Analysis
Gene overrepresentation in biological process category:
| Log-likelihood per target | Total log-likelihood | Term | Description |
|---|---|---|---|
| 0.4 | 1.6 | GO:0060332 | positive regulation of response to interferon-gamma(GO:0060332) positive regulation of interferon-gamma-mediated signaling pathway(GO:0060335) |
| 0.2 | 1.1 | GO:0048496 | maintenance of organ identity(GO:0048496) |
| 0.2 | 1.2 | GO:0097070 | ductus arteriosus closure(GO:0097070) |
| 0.1 | 0.3 | GO:0035609 | C-terminal protein deglutamylation(GO:0035609) |
| 0.1 | 0.5 | GO:0019532 | oxalate transport(GO:0019532) |
| 0.1 | 0.5 | GO:0035336 | long-chain fatty-acyl-CoA metabolic process(GO:0035336) |
| 0.1 | 0.3 | GO:0070100 | negative regulation of chemokine-mediated signaling pathway(GO:0070100) |
| 0.1 | 0.2 | GO:0032289 | central nervous system myelin formation(GO:0032289) |
| 0.1 | 0.2 | GO:0006068 | ethanol catabolic process(GO:0006068) |
| 0.1 | 0.2 | GO:0021529 | spinal cord oligodendrocyte cell differentiation(GO:0021529) spinal cord oligodendrocyte cell fate specification(GO:0021530) |
| 0.1 | 0.3 | GO:0090160 | Golgi to lysosome transport(GO:0090160) |
| 0.1 | 0.2 | GO:0071873 | response to norepinephrine(GO:0071873) |
| 0.1 | 0.2 | GO:0006001 | fructose catabolic process(GO:0006001) fructose catabolic process to hydroxyacetone phosphate and glyceraldehyde-3-phosphate(GO:0061624) glycolytic process through fructose-1-phosphate(GO:0061625) |
| 0.1 | 0.2 | GO:1901844 | regulation of cell communication by electrical coupling involved in cardiac conduction(GO:1901844) |
| 0.1 | 0.2 | GO:0090526 | regulation of gluconeogenesis involved in cellular glucose homeostasis(GO:0090526) |
| 0.1 | 0.2 | GO:0051919 | positive regulation of fibrinolysis(GO:0051919) |
| 0.1 | 0.2 | GO:0016344 | meiotic chromosome movement towards spindle pole(GO:0016344) |
| 0.0 | 0.1 | GO:0097118 | neuroligin clustering involved in postsynaptic membrane assembly(GO:0097118) |
| 0.0 | 0.1 | GO:2000860 | positive regulation of mineralocorticoid secretion(GO:2000857) positive regulation of aldosterone secretion(GO:2000860) |
| 0.0 | 0.1 | GO:0002337 | B-1a B cell differentiation(GO:0002337) |
| 0.0 | 0.1 | GO:0090258 | negative regulation of mitochondrial fission(GO:0090258) |
| 0.0 | 0.1 | GO:0006701 | progesterone biosynthetic process(GO:0006701) |
| 0.0 | 0.1 | GO:0060125 | negative regulation of growth hormone secretion(GO:0060125) |
| 0.0 | 0.5 | GO:0051601 | exocyst localization(GO:0051601) |
| 0.0 | 0.2 | GO:0010612 | regulation of cardiac muscle adaptation(GO:0010612) regulation of cardiac muscle hypertrophy in response to stress(GO:1903242) |
| 0.0 | 0.1 | GO:0001560 | regulation of cell growth by extracellular stimulus(GO:0001560) |
| 0.0 | 0.1 | GO:1900106 | hyaluranon cable assembly(GO:0036118) regulation of hyaluranon cable assembly(GO:1900104) positive regulation of hyaluranon cable assembly(GO:1900106) |
| 0.0 | 0.6 | GO:0021819 | layer formation in cerebral cortex(GO:0021819) |
| 0.0 | 0.1 | GO:0097680 | double-strand break repair via classical nonhomologous end joining(GO:0097680) |
| 0.0 | 0.1 | GO:0097296 | activation of cysteine-type endopeptidase activity involved in apoptotic signaling pathway(GO:0097296) |
| 0.0 | 0.1 | GO:0046098 | guanine metabolic process(GO:0046098) |
| 0.0 | 0.1 | GO:0021699 | cerebellar cortex maturation(GO:0021699) |
| 0.0 | 0.2 | GO:0038161 | prolactin signaling pathway(GO:0038161) |
| 0.0 | 0.2 | GO:0090315 | negative regulation of protein targeting to membrane(GO:0090315) |
| 0.0 | 0.2 | GO:0097264 | self proteolysis(GO:0097264) |
| 0.0 | 0.1 | GO:2000832 | negative regulation of steroid hormone secretion(GO:2000832) negative regulation of corticosteroid hormone secretion(GO:2000847) negative regulation of glucocorticoid secretion(GO:2000850) |
| 0.0 | 0.4 | GO:0000729 | DNA double-strand break processing(GO:0000729) |
| 0.0 | 0.1 | GO:1900147 | Schwann cell migration(GO:0036135) regulation of Schwann cell migration(GO:1900147) |
| 0.0 | 0.1 | GO:1903352 | ornithine transport(GO:0015822) L-ornithine transmembrane transport(GO:1903352) |
| 0.0 | 0.4 | GO:0043248 | proteasome assembly(GO:0043248) |
| 0.0 | 0.2 | GO:0097105 | presynaptic membrane assembly(GO:0097105) |
| 0.0 | 0.3 | GO:1904294 | positive regulation of ERAD pathway(GO:1904294) |
| 0.0 | 0.1 | GO:0038028 | insulin receptor signaling pathway via phosphatidylinositol 3-kinase(GO:0038028) |
| 0.0 | 0.2 | GO:1902035 | positive regulation of hematopoietic stem cell proliferation(GO:1902035) |
| 0.0 | 0.3 | GO:0051798 | positive regulation of hair follicle development(GO:0051798) |
| 0.0 | 0.1 | GO:0006438 | valyl-tRNA aminoacylation(GO:0006438) |
| 0.0 | 0.1 | GO:0055099 | response to high density lipoprotein particle(GO:0055099) |
| 0.0 | 0.1 | GO:0042126 | nitrate metabolic process(GO:0042126) |
| 0.0 | 0.1 | GO:1902774 | late endosome to lysosome transport(GO:1902774) |
| 0.0 | 0.1 | GO:0032058 | positive regulation of translational initiation in response to stress(GO:0032058) |
| 0.0 | 0.1 | GO:0045653 | negative regulation of megakaryocyte differentiation(GO:0045653) |
| 0.0 | 0.0 | GO:2000587 | regulation of platelet-derived growth factor receptor-beta signaling pathway(GO:2000586) negative regulation of platelet-derived growth factor receptor-beta signaling pathway(GO:2000587) |
| 0.0 | 0.1 | GO:0018242 | protein O-linked glycosylation via serine(GO:0018242) |
| 0.0 | 0.1 | GO:0019720 | Mo-molybdopterin cofactor biosynthetic process(GO:0006777) Mo-molybdopterin cofactor metabolic process(GO:0019720) molybdopterin cofactor biosynthetic process(GO:0032324) molybdopterin cofactor metabolic process(GO:0043545) prosthetic group metabolic process(GO:0051189) |
| 0.0 | 0.0 | GO:0061346 | non-canonical Wnt signaling pathway involved in heart development(GO:0061341) planar cell polarity pathway involved in heart morphogenesis(GO:0061346) |
| 0.0 | 0.1 | GO:0032819 | positive regulation of natural killer cell proliferation(GO:0032819) |
| 0.0 | 0.1 | GO:0042726 | flavin-containing compound metabolic process(GO:0042726) |
| 0.0 | 0.1 | GO:0035622 | intrahepatic bile duct development(GO:0035622) |
| 0.0 | 0.0 | GO:1902263 | apoptotic process involved in embryonic digit morphogenesis(GO:1902263) |
| 0.0 | 0.1 | GO:0032482 | Rab protein signal transduction(GO:0032482) |
| 0.0 | 0.2 | GO:0035845 | photoreceptor cell outer segment organization(GO:0035845) |
| 0.0 | 0.1 | GO:0033564 | anterior/posterior axon guidance(GO:0033564) |
| 0.0 | 0.1 | GO:0006207 | 'de novo' pyrimidine nucleobase biosynthetic process(GO:0006207) pyrimidine nucleobase biosynthetic process(GO:0019856) |
| 0.0 | 0.0 | GO:0010908 | regulation of heparan sulfate proteoglycan biosynthetic process(GO:0010908) positive regulation of heparan sulfate proteoglycan biosynthetic process(GO:0010909) positive regulation of proteoglycan biosynthetic process(GO:1902730) |
| 0.0 | 1.6 | GO:0009166 | nucleotide catabolic process(GO:0009166) |
| 0.0 | 0.1 | GO:0021912 | regulation of transcription from RNA polymerase II promoter involved in spinal cord motor neuron fate specification(GO:0021912) |
| 0.0 | 0.1 | GO:0000965 | mitochondrial RNA 3'-end processing(GO:0000965) |
| 0.0 | 0.1 | GO:0007621 | negative regulation of female receptivity(GO:0007621) |
| 0.0 | 0.1 | GO:0042795 | snRNA transcription from RNA polymerase II promoter(GO:0042795) |
| 0.0 | 0.1 | GO:0046271 | phenylpropanoid catabolic process(GO:0046271) |
| 0.0 | 0.0 | GO:0070948 | regulation of neutrophil mediated cytotoxicity(GO:0070948) regulation of neutrophil mediated killing of symbiont cell(GO:0070949) |
| 0.0 | 0.1 | GO:0048550 | negative regulation of pinocytosis(GO:0048550) |
| 0.0 | 0.1 | GO:0086042 | cardiac muscle cell-cardiac muscle cell adhesion(GO:0086042) |
| 0.0 | 0.1 | GO:2001168 | regulation of histone H2B ubiquitination(GO:2001166) positive regulation of histone H2B ubiquitination(GO:2001168) |
| 0.0 | 0.1 | GO:0021631 | optic nerve morphogenesis(GO:0021631) |
| 0.0 | 0.6 | GO:0001964 | startle response(GO:0001964) |
| 0.0 | 0.1 | GO:1901509 | regulation of endothelial tube morphogenesis(GO:1901509) |
| 0.0 | 0.1 | GO:0048852 | diencephalon morphogenesis(GO:0048852) |
| 0.0 | 0.2 | GO:0015936 | coenzyme A metabolic process(GO:0015936) |
| 0.0 | 0.1 | GO:0000350 | generation of catalytic spliceosome for second transesterification step(GO:0000350) |
| 0.0 | 0.1 | GO:0035337 | fatty-acyl-CoA metabolic process(GO:0035337) |
| 0.0 | 0.1 | GO:0061470 | T follicular helper cell differentiation(GO:0061470) |
| 0.0 | 0.2 | GO:0010875 | positive regulation of cholesterol efflux(GO:0010875) |
| 0.0 | 0.1 | GO:0042760 | very long-chain fatty acid catabolic process(GO:0042760) |
| 0.0 | 0.1 | GO:0071336 | regulation of hair follicle cell proliferation(GO:0071336) |
| 0.0 | 0.1 | GO:2000480 | negative regulation of cAMP-dependent protein kinase activity(GO:2000480) |
| 0.0 | 0.1 | GO:0006659 | phosphatidylserine biosynthetic process(GO:0006659) |
| 0.0 | 0.0 | GO:0009051 | pentose-phosphate shunt, oxidative branch(GO:0009051) |
| 0.0 | 0.0 | GO:0043137 | DNA replication, removal of RNA primer(GO:0043137) |
| 0.0 | 0.2 | GO:2001241 | positive regulation of extrinsic apoptotic signaling pathway in absence of ligand(GO:2001241) |
| 0.0 | 0.0 | GO:0099558 | maintenance of synapse structure(GO:0099558) |
| 0.0 | 0.0 | GO:0031296 | B cell costimulation(GO:0031296) |
| 0.0 | 0.1 | GO:0021797 | forebrain anterior/posterior pattern specification(GO:0021797) |
| 0.0 | 0.1 | GO:0051013 | microtubule severing(GO:0051013) |
| 0.0 | 0.1 | GO:0017121 | phospholipid scrambling(GO:0017121) |
| 0.0 | 0.0 | GO:0019042 | viral latency(GO:0019042) |
| 0.0 | 0.0 | GO:0046959 | habituation(GO:0046959) |
| 0.0 | 0.1 | GO:0071372 | cellular response to follicle-stimulating hormone stimulus(GO:0071372) |
| 0.0 | 0.0 | GO:0032788 | saturated monocarboxylic acid metabolic process(GO:0032788) unsaturated monocarboxylic acid metabolic process(GO:0032789) |
| 0.0 | 0.0 | GO:0002752 | cell surface pattern recognition receptor signaling pathway(GO:0002752) |
| 0.0 | 1.0 | GO:0001578 | microtubule bundle formation(GO:0001578) |
| 0.0 | 0.0 | GO:0060618 | nipple development(GO:0060618) |
| 0.0 | 0.0 | GO:1990034 | calcium ion export from cell(GO:1990034) |
| 0.0 | 0.1 | GO:0019530 | taurine metabolic process(GO:0019530) |
| 0.0 | 0.3 | GO:0006359 | regulation of transcription from RNA polymerase III promoter(GO:0006359) |
| 0.0 | 0.0 | GO:0060665 | regulation of branching involved in salivary gland morphogenesis by mesenchymal-epithelial signaling(GO:0060665) |
| 0.0 | 0.0 | GO:0070358 | actin polymerization-dependent cell motility(GO:0070358) |
| 0.0 | 0.1 | GO:0006297 | nucleotide-excision repair, DNA gap filling(GO:0006297) |
| 0.0 | 0.0 | GO:0009212 | dTTP biosynthetic process(GO:0006235) pyrimidine deoxyribonucleoside triphosphate metabolic process(GO:0009211) pyrimidine deoxyribonucleoside triphosphate biosynthetic process(GO:0009212) dTTP metabolic process(GO:0046075) |
| 0.0 | 0.2 | GO:2000651 | positive regulation of sodium ion transmembrane transporter activity(GO:2000651) |
| 0.0 | 0.1 | GO:0018076 | N-terminal peptidyl-lysine acetylation(GO:0018076) |
| 0.0 | 0.0 | GO:0035022 | positive regulation of Rac protein signal transduction(GO:0035022) |
| 0.0 | 0.1 | GO:0008228 | opsonization(GO:0008228) |
| 0.0 | 0.1 | GO:0008295 | spermidine biosynthetic process(GO:0008295) |
| 0.0 | 0.1 | GO:0071625 | vocalization behavior(GO:0071625) |
| 0.0 | 0.0 | GO:0000480 | endonucleolytic cleavage in 5'-ETS of tricistronic rRNA transcript (SSU-rRNA, 5.8S rRNA, LSU-rRNA)(GO:0000480) |
| 0.0 | 0.0 | GO:0019244 | lactate biosynthetic process from pyruvate(GO:0019244) lactate biosynthetic process(GO:0019249) |
| 0.0 | 0.6 | GO:0030512 | negative regulation of transforming growth factor beta receptor signaling pathway(GO:0030512) negative regulation of cellular response to transforming growth factor beta stimulus(GO:1903845) |
| 0.0 | 0.0 | GO:1904059 | regulation of locomotor rhythm(GO:1904059) |
| 0.0 | 0.0 | GO:0070268 | cornification(GO:0070268) |
| 0.0 | 0.1 | GO:0000237 | leptotene(GO:0000237) |
| 0.0 | 0.0 | GO:0098904 | regulation of AV node cell action potential(GO:0098904) |
| 0.0 | 0.8 | GO:0010923 | negative regulation of phosphatase activity(GO:0010923) |
| 0.0 | 0.1 | GO:0043129 | surfactant homeostasis(GO:0043129) |
| 0.0 | 0.1 | GO:0035428 | hexose transmembrane transport(GO:0035428) |
| 0.0 | 0.0 | GO:0010760 | negative regulation of macrophage chemotaxis(GO:0010760) |
| 0.0 | 0.0 | GO:1990169 | detoxification of copper ion(GO:0010273) stress response to copper ion(GO:1990169) |
| 0.0 | 0.0 | GO:2000173 | negative regulation of branching morphogenesis of a nerve(GO:2000173) |
| 0.0 | 0.0 | GO:0021798 | forebrain dorsal/ventral pattern formation(GO:0021798) |
| 0.0 | 0.1 | GO:0071985 | multivesicular body sorting pathway(GO:0071985) |
| 0.0 | 0.1 | GO:0010944 | negative regulation of transcription by competitive promoter binding(GO:0010944) |
| 0.0 | 0.0 | GO:1901660 | calcium ion export(GO:1901660) |
| 0.0 | 0.0 | GO:0003223 | ventricular compact myocardium morphogenesis(GO:0003223) |
| 0.0 | 0.0 | GO:0071799 | response to prostaglandin D(GO:0071798) cellular response to prostaglandin D stimulus(GO:0071799) |
| 0.0 | 0.0 | GO:0018343 | protein farnesylation(GO:0018343) |
| 0.0 | 0.0 | GO:0009106 | lipoate metabolic process(GO:0009106) |
| 0.0 | 0.1 | GO:0042359 | vitamin D metabolic process(GO:0042359) |
| 0.0 | 0.2 | GO:0006376 | mRNA splice site selection(GO:0006376) |
| 0.0 | 0.0 | GO:0002121 | inter-male aggressive behavior(GO:0002121) |
| 0.0 | 0.1 | GO:0061303 | cornea development in camera-type eye(GO:0061303) |
Gene overrepresentation in cellular component category:
| Log-likelihood per target | Total log-likelihood | Term | Description |
|---|---|---|---|
| 0.3 | 1.7 | GO:0045098 | type III intermediate filament(GO:0045098) |
| 0.3 | 1.2 | GO:1990696 | USH2 complex(GO:1990696) |
| 0.1 | 0.3 | GO:0020016 | ciliary pocket(GO:0020016) ciliary pocket membrane(GO:0020018) |
| 0.1 | 0.4 | GO:0008541 | proteasome regulatory particle, lid subcomplex(GO:0008541) |
| 0.1 | 0.2 | GO:1990761 | growth cone lamellipodium(GO:1990761) |
| 0.1 | 0.2 | GO:0031094 | platelet dense tubular network(GO:0031094) |
| 0.1 | 0.2 | GO:0005955 | calcineurin complex(GO:0005955) |
| 0.0 | 0.4 | GO:0031371 | ubiquitin conjugating enzyme complex(GO:0031371) |
| 0.0 | 0.1 | GO:0097513 | myosin II filament(GO:0097513) |
| 0.0 | 0.3 | GO:0042405 | nuclear inclusion body(GO:0042405) |
| 0.0 | 0.1 | GO:0097425 | smooth endoplasmic reticulum membrane(GO:0030868) smooth endoplasmic reticulum part(GO:0097425) |
| 0.0 | 0.5 | GO:0000145 | exocyst(GO:0000145) |
| 0.0 | 0.4 | GO:0043194 | axon initial segment(GO:0043194) |
| 0.0 | 0.1 | GO:0005958 | DNA-dependent protein kinase-DNA ligase 4 complex(GO:0005958) |
| 0.0 | 0.1 | GO:0032777 | Piccolo NuA4 histone acetyltransferase complex(GO:0032777) |
| 0.0 | 0.2 | GO:0090576 | RNA polymerase III transcription factor complex(GO:0090576) |
| 0.0 | 0.1 | GO:0071141 | SMAD protein complex(GO:0071141) |
| 0.0 | 0.2 | GO:0036057 | filtration diaphragm(GO:0036056) slit diaphragm(GO:0036057) |
| 0.0 | 0.0 | GO:0005579 | membrane attack complex(GO:0005579) |
| 0.0 | 0.2 | GO:0042382 | paraspeckles(GO:0042382) |
| 0.0 | 0.1 | GO:0033553 | rDNA heterochromatin(GO:0033553) |
| 0.0 | 0.1 | GO:0005833 | hemoglobin complex(GO:0005833) |
| 0.0 | 0.1 | GO:0097648 | G-protein coupled receptor dimeric complex(GO:0038037) G-protein coupled receptor complex(GO:0097648) |
| 0.0 | 0.1 | GO:0033186 | CAF-1 complex(GO:0033186) |
| 0.0 | 0.1 | GO:0034366 | spherical high-density lipoprotein particle(GO:0034366) |
| 0.0 | 0.3 | GO:0005665 | DNA-directed RNA polymerase II, core complex(GO:0005665) |
| 0.0 | 0.1 | GO:0033263 | CORVET complex(GO:0033263) |
| 0.0 | 0.1 | GO:0043625 | delta DNA polymerase complex(GO:0043625) |
| 0.0 | 0.1 | GO:0031315 | extrinsic component of mitochondrial outer membrane(GO:0031315) |
| 0.0 | 0.1 | GO:0032585 | multivesicular body membrane(GO:0032585) |
| 0.0 | 1.6 | GO:0072562 | blood microparticle(GO:0072562) |
| 0.0 | 0.0 | GO:0097504 | Gemini of coiled bodies(GO:0097504) |
| 0.0 | 0.0 | GO:0032299 | ribonuclease H2 complex(GO:0032299) |
| 0.0 | 0.0 | GO:0008282 | ATP-sensitive potassium channel complex(GO:0008282) |
| 0.0 | 0.2 | GO:0036038 | MKS complex(GO:0036038) |
| 0.0 | 0.1 | GO:0033588 | Elongator holoenzyme complex(GO:0033588) |
| 0.0 | 0.0 | GO:0043293 | apoptosome(GO:0043293) |
| 0.0 | 0.2 | GO:0030673 | axolemma(GO:0030673) |
| 0.0 | 0.0 | GO:1990851 | Wnt-Frizzled-LRP5/6 complex(GO:1990851) |
| 0.0 | 0.4 | GO:0005834 | heterotrimeric G-protein complex(GO:0005834) |
| 0.0 | 0.1 | GO:0089717 | spanning component of plasma membrane(GO:0044214) spanning component of membrane(GO:0089717) |
| 0.0 | 0.1 | GO:0000276 | mitochondrial proton-transporting ATP synthase complex, coupling factor F(o)(GO:0000276) |
| 0.0 | 0.1 | GO:0032593 | insulin-responsive compartment(GO:0032593) |
Gene overrepresentation in molecular function category:
| Log-likelihood per target | Total log-likelihood | Term | Description |
|---|---|---|---|
| 0.4 | 1.6 | GO:0015232 | heme transporter activity(GO:0015232) |
| 0.2 | 0.5 | GO:0050252 | retinol O-fatty-acyltransferase activity(GO:0050252) |
| 0.2 | 0.7 | GO:0015016 | [heparan sulfate]-glucosamine N-sulfotransferase activity(GO:0015016) |
| 0.1 | 1.3 | GO:0000983 | transcription factor activity, RNA polymerase II core promoter sequence-specific(GO:0000983) |
| 0.1 | 0.3 | GO:0046573 | lactonohydrolase activity(GO:0046573) acyl-L-homoserine-lactone lactonohydrolase activity(GO:0102007) |
| 0.1 | 0.2 | GO:0004024 | alcohol dehydrogenase activity, zinc-dependent(GO:0004024) |
| 0.1 | 0.4 | GO:0016421 | CoA carboxylase activity(GO:0016421) |
| 0.1 | 0.3 | GO:1990380 | Lys48-specific deubiquitinase activity(GO:1990380) |
| 0.1 | 0.7 | GO:0071617 | lysophospholipid acyltransferase activity(GO:0071617) |
| 0.1 | 0.7 | GO:0031681 | G-protein beta-subunit binding(GO:0031681) |
| 0.1 | 0.2 | GO:0033192 | calmodulin-dependent protein phosphatase activity(GO:0033192) |
| 0.0 | 0.1 | GO:0070699 | type II activin receptor binding(GO:0070699) |
| 0.0 | 0.2 | GO:0051425 | PTB domain binding(GO:0051425) |
| 0.0 | 0.1 | GO:0016743 | carboxyl- or carbamoyltransferase activity(GO:0016743) |
| 0.0 | 0.2 | GO:0004332 | fructose-bisphosphate aldolase activity(GO:0004332) |
| 0.0 | 0.4 | GO:0019531 | oxalate transmembrane transporter activity(GO:0019531) |
| 0.0 | 0.3 | GO:0050649 | testosterone 6-beta-hydroxylase activity(GO:0050649) |
| 0.0 | 0.1 | GO:0031721 | hemoglobin alpha binding(GO:0031721) |
| 0.0 | 0.0 | GO:0004723 | calcium-dependent protein serine/threonine phosphatase activity(GO:0004723) |
| 0.0 | 1.6 | GO:0016763 | transferase activity, transferring pentosyl groups(GO:0016763) |
| 0.0 | 0.1 | GO:0034186 | apolipoprotein A-I binding(GO:0034186) |
| 0.0 | 0.2 | GO:1990254 | keratin filament binding(GO:1990254) |
| 0.0 | 0.2 | GO:0008046 | axon guidance receptor activity(GO:0008046) |
| 0.0 | 0.1 | GO:0036042 | phosphatidylcholine transporter activity(GO:0008525) long-chain fatty acyl-CoA binding(GO:0036042) |
| 0.0 | 0.5 | GO:0017049 | GTP-Rho binding(GO:0017049) |
| 0.0 | 0.1 | GO:0098748 | clathrin adaptor activity(GO:0035615) endocytic adaptor activity(GO:0098748) |
| 0.0 | 0.2 | GO:0048495 | Roundabout binding(GO:0048495) |
| 0.0 | 0.1 | GO:0003910 | DNA ligase activity(GO:0003909) DNA ligase (ATP) activity(GO:0003910) |
| 0.0 | 0.1 | GO:0004832 | valine-tRNA ligase activity(GO:0004832) |
| 0.0 | 0.1 | GO:0031893 | vasopressin receptor binding(GO:0031893) |
| 0.0 | 0.2 | GO:0005499 | vitamin D binding(GO:0005499) |
| 0.0 | 0.1 | GO:0070883 | pre-miRNA binding(GO:0070883) |
| 0.0 | 0.3 | GO:0048185 | activin binding(GO:0048185) |
| 0.0 | 0.2 | GO:1990247 | N6-methyladenosine-containing RNA binding(GO:1990247) |
| 0.0 | 0.1 | GO:0000064 | L-ornithine transmembrane transporter activity(GO:0000064) |
| 0.0 | 0.1 | GO:0086080 | protein binding involved in heterotypic cell-cell adhesion(GO:0086080) |
| 0.0 | 0.1 | GO:0005042 | netrin receptor activity(GO:0005042) |
| 0.0 | 0.1 | GO:0010484 | H3 histone acetyltransferase activity(GO:0010484) |
| 0.0 | 0.1 | GO:0034191 | apolipoprotein A-I receptor binding(GO:0034191) |
| 0.0 | 0.1 | GO:0071074 | eukaryotic initiation factor eIF2 binding(GO:0071074) |
| 0.0 | 0.2 | GO:0030159 | receptor signaling complex scaffold activity(GO:0030159) |
| 0.0 | 0.2 | GO:0005041 | low-density lipoprotein receptor activity(GO:0005041) |
| 0.0 | 1.0 | GO:0017022 | myosin binding(GO:0017022) |
| 0.0 | 0.1 | GO:0004128 | cytochrome-b5 reductase activity, acting on NAD(P)H(GO:0004128) |
| 0.0 | 0.1 | GO:0005225 | volume-sensitive anion channel activity(GO:0005225) |
| 0.0 | 0.1 | GO:0070053 | thrombospondin receptor activity(GO:0070053) |
| 0.0 | 0.0 | GO:0030899 | calcium-dependent ATPase activity(GO:0030899) |
| 0.0 | 0.4 | GO:0001106 | RNA polymerase II transcription corepressor activity(GO:0001106) |
| 0.0 | 0.1 | GO:0070700 | BMP receptor binding(GO:0070700) |
| 0.0 | 0.4 | GO:0004181 | metallocarboxypeptidase activity(GO:0004181) |
| 0.0 | 0.0 | GO:0043919 | 4-hydroxybenzoate octaprenyltransferase activity(GO:0008412) protoheme IX farnesyltransferase activity(GO:0008495) (S)-2,3-di-O-geranylgeranylglyceryl phosphate synthase activity(GO:0043888) cadaverine aminopropyltransferase activity(GO:0043918) agmatine aminopropyltransferase activity(GO:0043919) 1,4-dihydroxy-2-naphthoate octaprenyltransferase activity(GO:0046428) trans-pentaprenyltranstransferase activity(GO:0048045) ATP dimethylallyltransferase activity(GO:0052622) ADP dimethylallyltransferase activity(GO:0052623) |
| 0.0 | 0.4 | GO:0001540 | beta-amyloid binding(GO:0001540) |
| 0.0 | 0.2 | GO:0045294 | alpha-catenin binding(GO:0045294) |
| 0.0 | 0.1 | GO:0004862 | cAMP-dependent protein kinase inhibitor activity(GO:0004862) |
| 0.0 | 0.2 | GO:0015245 | fatty acid transporter activity(GO:0015245) |
| 0.0 | 0.2 | GO:0071949 | FAD binding(GO:0071949) |
| 0.0 | 0.1 | GO:0030942 | endoplasmic reticulum signal peptide binding(GO:0030942) |
| 0.0 | 0.1 | GO:0004165 | dodecenoyl-CoA delta-isomerase activity(GO:0004165) |
| 0.0 | 0.1 | GO:0005247 | voltage-gated chloride channel activity(GO:0005247) |
| 0.0 | 0.2 | GO:0019789 | SUMO transferase activity(GO:0019789) |
| 0.0 | 0.1 | GO:0008467 | [heparan sulfate]-glucosamine 3-sulfotransferase 1 activity(GO:0008467) |
| 0.0 | 0.0 | GO:0000386 | second spliceosomal transesterification activity(GO:0000386) |
| 0.0 | 0.1 | GO:0070008 | serine-type exopeptidase activity(GO:0070008) |
| 0.0 | 0.1 | GO:0044606 | thiamine-pyrophosphatase activity(GO:0004787) UDP-2,3-diacylglucosamine hydrolase activity(GO:0008758) dATP pyrophosphohydrolase activity(GO:0008828) dihydroneopterin monophosphate phosphatase activity(GO:0019176) dihydroneopterin triphosphate pyrophosphohydrolase activity(GO:0019177) dTTP diphosphatase activity(GO:0036218) phosphocholine hydrolase activity(GO:0044606) |
| 0.0 | 0.1 | GO:0042500 | aspartic endopeptidase activity, intramembrane cleaving(GO:0042500) |
| 0.0 | 0.0 | GO:0005095 | GTPase inhibitor activity(GO:0005095) |
| 0.0 | 0.4 | GO:0061631 | ubiquitin conjugating enzyme activity(GO:0061631) ubiquitin-like protein conjugating enzyme activity(GO:0061650) |
| 0.0 | 0.0 | GO:0004459 | L-lactate dehydrogenase activity(GO:0004459) |
| 0.0 | 0.1 | GO:0043426 | MRF binding(GO:0043426) |
| 0.0 | 0.2 | GO:0017128 | phospholipid scramblase activity(GO:0017128) |
| 0.0 | 0.1 | GO:0030898 | actin-dependent ATPase activity(GO:0030898) |
| 0.0 | 0.1 | GO:0031849 | olfactory receptor binding(GO:0031849) |
| 0.0 | 0.1 | GO:0008568 | microtubule-severing ATPase activity(GO:0008568) |
| 0.0 | 0.0 | GO:0003829 | beta-1,3-galactosyl-O-glycosyl-glycoprotein beta-1,6-N-acetylglucosaminyltransferase activity(GO:0003829) |
| 0.0 | 0.0 | GO:0005332 | gamma-aminobutyric acid:sodium symporter activity(GO:0005332) |
| 0.0 | 0.0 | GO:0004346 | glucose-6-phosphatase activity(GO:0004346) sugar-terminal-phosphatase activity(GO:0050309) |
Gene overrepresentation in curated gene sets: canonical pathways category:
| Log-likelihood per target | Total log-likelihood | Term | Description |
|---|---|---|---|
| 0.0 | 0.5 | PID THROMBIN PAR4 PATHWAY | PAR4-mediated thrombin signaling events |
| 0.0 | 0.2 | PID RANBP2 PATHWAY | Sumoylation by RanBP2 regulates transcriptional repression |
| 0.0 | 0.1 | PID SMAD2 3PATHWAY | Regulation of cytoplasmic and nuclear SMAD2/3 signaling |
| 0.0 | 0.5 | PID FOXM1 PATHWAY | FOXM1 transcription factor network |
| 0.0 | 0.1 | PID ALK2 PATHWAY | ALK2 signaling events |
| 0.0 | 1.5 | NABA ECM AFFILIATED | Genes encoding proteins affiliated structurally or functionally to extracellular matrix proteins |
| 0.0 | 0.3 | PID TCR CALCIUM PATHWAY | Calcium signaling in the CD4+ TCR pathway |
| 0.0 | 0.5 | PID ARF6 TRAFFICKING PATHWAY | Arf6 trafficking events |
Gene overrepresentation in curated gene sets: REACTOME pathways category:
| Log-likelihood per target | Total log-likelihood | Term | Description |
|---|---|---|---|
| 0.1 | 1.6 | REACTOME PYRIMIDINE CATABOLISM | Genes involved in Pyrimidine catabolism |
| 0.0 | 0.7 | REACTOME ACYL CHAIN REMODELLING OF PI | Genes involved in Acyl chain remodelling of PI |
| 0.0 | 0.7 | REACTOME PROSTACYCLIN SIGNALLING THROUGH PROSTACYCLIN RECEPTOR | Genes involved in Prostacyclin signalling through prostacyclin receptor |
| 0.0 | 0.5 | REACTOME INSULIN SYNTHESIS AND PROCESSING | Genes involved in Insulin Synthesis and Processing |
| 0.0 | 0.8 | REACTOME HS GAG BIOSYNTHESIS | Genes involved in HS-GAG biosynthesis |
| 0.0 | 0.1 | REACTOME TRANSPORT OF ORGANIC ANIONS | Genes involved in Transport of organic anions |
| 0.0 | 0.5 | REACTOME REGULATION OF BETA CELL DEVELOPMENT | Genes involved in Regulation of beta-cell development |
| 0.0 | 0.6 | REACTOME TRIGLYCERIDE BIOSYNTHESIS | Genes involved in Triglyceride Biosynthesis |
| 0.0 | 0.2 | REACTOME THE NLRP3 INFLAMMASOME | Genes involved in The NLRP3 inflammasome |
| 0.0 | 0.1 | REACTOME RECYCLING OF BILE ACIDS AND SALTS | Genes involved in Recycling of bile acids and salts |
| 0.0 | 0.3 | REACTOME DARPP 32 EVENTS | Genes involved in DARPP-32 events |
| 0.0 | 0.1 | REACTOME HYALURONAN UPTAKE AND DEGRADATION | Genes involved in Hyaluronan uptake and degradation |
| 0.0 | 0.1 | REACTOME GAP JUNCTION DEGRADATION | Genes involved in Gap junction degradation |
| 0.0 | 0.1 | REACTOME CREATION OF C4 AND C2 ACTIVATORS | Genes involved in Creation of C4 and C2 activators |
| 0.0 | 0.1 | REACTOME PURINE CATABOLISM | Genes involved in Purine catabolism |
| 0.0 | 0.1 | REACTOME ALPHA LINOLENIC ACID ALA METABOLISM | Genes involved in alpha-linolenic acid (ALA) metabolism |
| 0.0 | 0.2 | REACTOME INTRINSIC PATHWAY | Genes involved in Intrinsic Pathway |
| 0.0 | 0.2 | REACTOME BRANCHED CHAIN AMINO ACID CATABOLISM | Genes involved in Branched-chain amino acid catabolism |
| 0.0 | 0.1 | REACTOME ETHANOL OXIDATION | Genes involved in Ethanol oxidation |
| 0.0 | 0.4 | REACTOME NETRIN1 SIGNALING | Genes involved in Netrin-1 signaling |
| 0.0 | 0.1 | REACTOME INTEGRATION OF PROVIRUS | Genes involved in Integration of provirus |
| 0.0 | 0.1 | REACTOME FACILITATIVE NA INDEPENDENT GLUCOSE TRANSPORTERS | Genes involved in Facilitative Na+-independent glucose transporters |