Project
ENCODE: ATAC-seq of different tissues during embryonic development
Navigation
Downloads

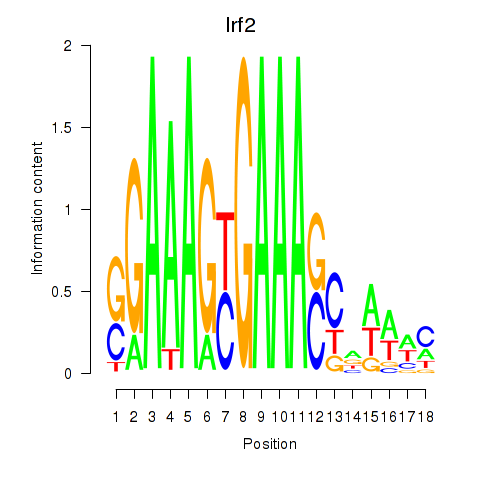
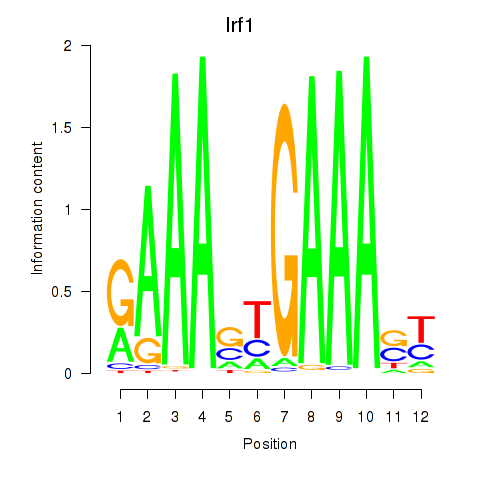
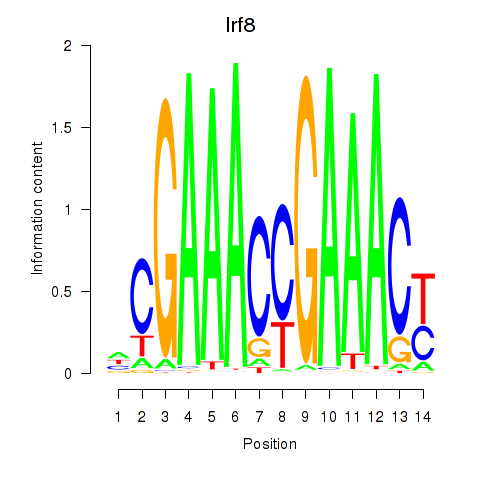
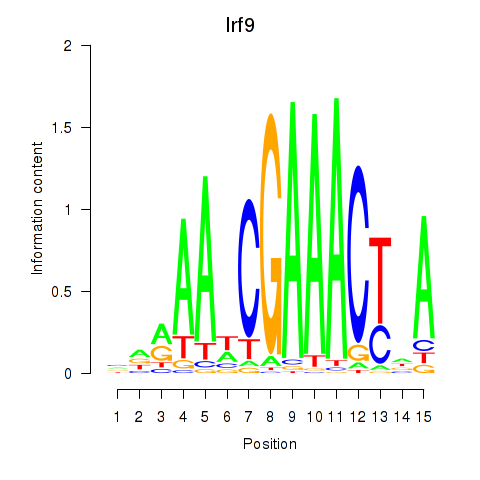
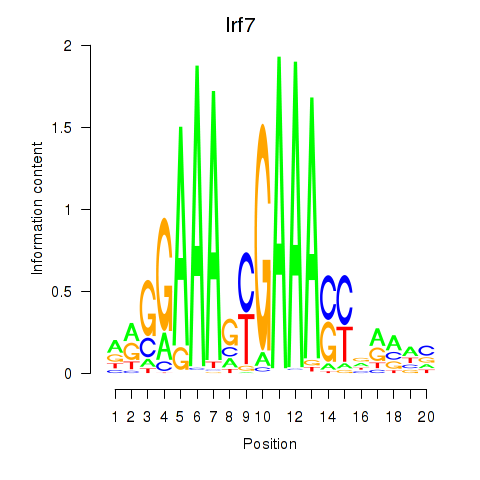
Results for Irf2_Irf1_Irf8_Irf9_Irf7
Z-value: 4.96
Motif logo
Transcription factors associated with Irf2_Irf1_Irf8_Irf9_Irf7
| Gene Symbol | Gene ID | Gene Info |
|---|---|---|
|
Irf2
|
ENSMUSG00000031627.7 | interferon regulatory factor 2 |
|
Irf1
|
ENSMUSG00000018899.10 | interferon regulatory factor 1 |
|
Irf8
|
ENSMUSG00000041515.3 | interferon regulatory factor 8 |
|
Irf9
|
ENSMUSG00000002325.8 | interferon regulatory factor 9 |
|
Irf7
|
ENSMUSG00000025498.8 | interferon regulatory factor 7 |
Correlations of motif activity and signal intensity at CREs associated with the motif's TFs:
This plot shows correlation between observed signal intensity of a CRE associated with the transcription factor across all samples and activity of the motif.
For each TF, only the top 5 correlated CREs are shown.
| CRE | Gene | Distance | Association probability | Pearson corr. coef. | P-value | Plot |
|---|---|---|---|---|---|---|
| chr11_53770582_53770785 | Irf1 | 174 | 0.899808 | 0.48 | 2.4e-04 | Click! |
| chr11_53769381_53769549 | Irf1 | 549 | 0.615884 | 0.46 | 3.5e-04 | Click! |
| chr11_53770151_53770543 | Irf1 | 130 | 0.924078 | 0.46 | 4.5e-04 | Click! |
| chr11_53769647_53770088 | Irf1 | 147 | 0.916822 | 0.45 | 5.6e-04 | Click! |
| chr8_46792734_46792886 | Irf2 | 689 | 0.643148 | 0.75 | 5.9e-11 | Click! |
| chr8_46811361_46811578 | Irf2 | 3536 | 0.207358 | 0.68 | 1.5e-08 | Click! |
| chr8_46811119_46811270 | Irf2 | 3811 | 0.201050 | 0.51 | 8.0e-05 | Click! |
| chr8_46750506_46750809 | Irf2 | 10391 | 0.141711 | 0.41 | 2.0e-03 | Click! |
| chr8_46818399_46818550 | Irf2 | 3469 | 0.211972 | 0.41 | 2.0e-03 | Click! |
| chr7_141265966_141266219 | Irf7 | 48 | 0.931747 | 0.89 | 2.9e-19 | Click! |
| chr7_141266285_141266574 | Irf7 | 6 | 0.937654 | 0.88 | 1.1e-18 | Click! |
| chr7_141265029_141265353 | Irf7 | 60 | 0.927920 | 0.79 | 6.1e-13 | Click! |
| chr7_141265541_141265718 | Irf7 | 78 | 0.921986 | 0.77 | 6.2e-12 | Click! |
| chr7_141268978_141269142 | Irf7 | 2579 | 0.110839 | 0.74 | 1.3e-10 | Click! |
| chr8_120744019_120744196 | Irf8 | 1373 | 0.366470 | 0.78 | 2.5e-12 | Click! |
| chr8_120743577_120743842 | Irf8 | 1771 | 0.293896 | 0.77 | 6.5e-12 | Click! |
| chr8_120752105_120752314 | Irf8 | 0 | 0.973682 | 0.68 | 8.0e-09 | Click! |
| chr8_120739607_120739758 | Irf8 | 1043 | 0.455481 | 0.64 | 1.1e-07 | Click! |
| chr8_120745533_120745691 | Irf8 | 132 | 0.951954 | 0.62 | 3.9e-07 | Click! |
| chr14_55603947_55604629 | Irf9 | 289 | 0.686598 | 0.80 | 2.4e-13 | Click! |
| chr14_55603603_55603875 | Irf9 | 168 | 0.817394 | 0.71 | 1.5e-09 | Click! |
| chr14_55606208_55606359 | Irf9 | 463 | 0.505536 | 0.60 | 1.3e-06 | Click! |
| chr14_55605839_55606025 | Irf9 | 112 | 0.868536 | 0.60 | 1.5e-06 | Click! |
| chr14_55606608_55606759 | Irf9 | 592 | 0.400724 | 0.55 | 1.4e-05 | Click! |
Activity of the Irf2_Irf1_Irf8_Irf9_Irf7 motif across conditions
Conditions sorted by the z-value of the Irf2_Irf1_Irf8_Irf9_Irf7 motif activity
Move your cursor over a bar to see sample name and corresponding Z-value.
Top target CREs of the motif:
| Cis Regulatory Element (CRE) | Target Score | Top associated gene | Gene Info | Distance of CRE to TSS | CRE/Gene association probability |
|---|---|---|---|---|---|
| chr14_14351950_14353283 | 66.07 |
Il3ra |
interleukin 3 receptor, alpha chain |
2995 |
0.15 |
| chr12_103434110_103434336 | 42.87 |
Ifi27 |
interferon, alpha-inducible protein 27 |
11 |
0.95 |
| chr19_8518374_8518525 | 42.77 |
Gm8189 |
predicted gene 8189 |
23349 |
0.14 |
| chr8_120486990_120488549 | 41.15 |
Gse1 |
genetic suppressor element 1, coiled-coil protein |
678 |
0.64 |
| chr17_36121540_36121726 | 36.12 |
Gm19684 |
predicted gene, 19684 |
45 |
0.63 |
| chr9_107975396_107975585 | 35.29 |
Uba7 |
ubiquitin-like modifier activating enzyme 7 |
15 |
0.92 |
| chr11_86581327_86581590 | 34.47 |
Mir21a |
microRNA 21a |
2700 |
0.21 |
| chr6_38342333_38342771 | 33.53 |
Zc3hav1 |
zinc finger CCCH type, antiviral 1 |
11721 |
0.13 |
| chr4_154928100_154928296 | 33.30 |
Tnfrsf14 |
tumor necrosis factor receptor superfamily, member 14 (herpesvirus entry mediator) |
4 |
0.96 |
| chr11_119392977_119393557 | 32.39 |
Rnf213 |
ring finger protein 213 |
167 |
0.93 |
| chr7_120865040_120865504 | 28.46 |
Gm15774 |
predicted gene 15774 |
10026 |
0.13 |
| chr15_50362191_50362432 | 28.23 |
Gm49198 |
predicted gene, 49198 |
75413 |
0.13 |
| chr17_36042796_36043034 | 28.22 |
Gm6034 |
predicted gene 6034 |
46 |
0.63 |
| chr13_98944819_98945097 | 27.30 |
Gm35215 |
predicted gene, 35215 |
958 |
0.45 |
| chr2_158159962_158160168 | 26.57 |
Tgm2 |
transglutaminase 2, C polypeptide |
13629 |
0.14 |
| chr6_121245511_121246024 | 24.98 |
Usp18 |
ubiquitin specific peptidase 18 |
139 |
0.94 |
| chr6_34863037_34863250 | 24.69 |
Tmem140 |
transmembrane protein 140 |
3 |
0.96 |
| chr11_53796522_53796874 | 24.50 |
Gm12216 |
predicted gene 12216 |
823 |
0.49 |
| chr5_100636931_100637107 | 24.48 |
Coq2 |
coenzyme Q2 4-hydroxybenzoate polyprenyltransferase |
27400 |
0.12 |
| chr5_114922913_114923574 | 24.43 |
Oasl1 |
2'-5' oligoadenylate synthetase-like 1 |
3 |
0.5 |
| chr5_76990916_76991084 | 24.10 |
Srp72 |
signal recognition particle 72 |
2993 |
0.16 |
| chr12_26460219_26460410 | 24.10 |
Rsad2 |
radical S-adenosyl methionine domain containing 2 |
3862 |
0.17 |
| chr18_5603185_5603788 | 23.86 |
Zeb1 |
zinc finger E-box binding homeobox 1 |
258 |
0.88 |
| chr9_72449518_72449701 | 23.83 |
Gm27231 |
predicted gene 27231 |
7830 |
0.08 |
| chr11_94589805_94589967 | 23.64 |
Acsf2 |
acyl-CoA synthetase family member 2 |
11883 |
0.11 |
| chr6_127245874_127246080 | 23.59 |
Gm43635 |
predicted gene 43635 |
8667 |
0.13 |
| chr15_76243373_76243550 | 23.07 |
Parp10 |
poly (ADP-ribose) polymerase family, member 10 |
20 |
0.93 |
| chr6_125573659_125573981 | 22.91 |
Vwf |
Von Willebrand factor |
7569 |
0.21 |
| chr12_69513289_69513503 | 22.79 |
5830428M24Rik |
RIKEN cDNA 5830428M24 gene |
37846 |
0.11 |
| chr11_78984796_78985130 | 22.76 |
Lgals9 |
lectin, galactose binding, soluble 9 |
17 |
0.98 |
| chr11_73326709_73326885 | 22.70 |
Aspa |
aspartoacylase |
10 |
0.95 |
| chr1_182268291_182268667 | 22.60 |
Degs1 |
delta(4)-desaturase, sphingolipid 1 |
13745 |
0.17 |
| chr4_71291873_71292024 | 22.50 |
Gm11229 |
predicted gene 11229 |
6006 |
0.31 |
| chr11_83078101_83078392 | 22.47 |
Gm20234 |
predicted gene, 20234 |
7000 |
0.08 |
| chr16_10741207_10741384 | 21.83 |
Socs1 |
suppressor of cytokine signaling 1 |
44241 |
0.07 |
| chr19_59905716_59906059 | 21.38 |
Gm17203 |
predicted gene 17203 |
4825 |
0.24 |
| chr2_39325768_39325929 | 21.11 |
Vmn2r-ps2 |
vomeronasal 2, receptor, pseudogene 2 |
51742 |
0.11 |
| chrX_101428817_101430172 | 20.68 |
Nono |
non-POU-domain-containing, octamer binding protein |
61 |
0.96 |
| chr12_3759530_3759697 | 20.54 |
Dtnbos |
dystrobrevin, beta, opposite strand |
2533 |
0.26 |
| chr19_55643252_55643620 | 20.40 |
Tcf7l2 |
transcription factor 7 like 2, T cell specific, HMG box |
98384 |
0.08 |
| chr2_152788848_152789045 | 19.99 |
Gm23802 |
predicted gene, 23802 |
16057 |
0.11 |
| chr9_114621202_114621360 | 19.66 |
Cnot10 |
CCR4-NOT transcription complex, subunit 10 |
18682 |
0.14 |
| chr11_58214634_58215080 | 19.44 |
Irgm2 |
immunity-related GTPase family M member 2 |
151 |
0.92 |
| chr5_100643889_100644395 | 19.15 |
Coq2 |
coenzyme Q2 4-hydroxybenzoate polyprenyltransferase |
20277 |
0.13 |
| chr9_57299666_57299875 | 19.14 |
Gm18996 |
predicted gene, 18996 |
29645 |
0.12 |
| chr19_11235141_11235292 | 18.93 |
Ms4a12 |
membrane-spanning 4-domains, subfamily A, member 12 |
2768 |
0.17 |
| chr5_36726254_36726643 | 18.70 |
Gm43701 |
predicted gene 43701 |
22170 |
0.11 |
| chr6_143751347_143751526 | 18.49 |
1700060C16Rik |
RIKEN cDNA 1700060C16 gene |
100148 |
0.08 |
| chr16_18428507_18428684 | 18.46 |
Txnrd2 |
thioredoxin reductase 2 |
102 |
0.93 |
| chr7_4082909_4083060 | 18.26 |
Gm23741 |
predicted gene, 23741 |
18906 |
0.09 |
| chr13_77548432_77549057 | 18.15 |
Gm9634 |
predicted gene 9634 |
5629 |
0.31 |
| chr14_14012273_14013624 | 18.14 |
Atxn7 |
ataxin 7 |
196 |
0.95 |
| chr4_154635674_154637241 | 18.06 |
Prdm16 |
PR domain containing 16 |
340 |
0.76 |
| chr7_80971099_80971312 | 18.01 |
Gm18782 |
predicted gene, 18782 |
8688 |
0.11 |
| chr5_103753230_103754272 | 17.89 |
Aff1 |
AF4/FMR2 family, member 1 |
411 |
0.87 |
| chr12_84969806_84969957 | 17.84 |
Arel1 |
apoptosis resistant E3 ubiquitin protein ligase 1 |
943 |
0.35 |
| chr2_155541250_155541401 | 17.74 |
Mipep-ps |
mitochondrial intermediate peptidase, pseudogene |
1322 |
0.24 |
| chr2_167697961_167698142 | 17.73 |
A530013C23Rik |
RIKEN cDNA A530013C23 gene |
6870 |
0.12 |
| chr2_167823511_167823855 | 17.63 |
1200007C13Rik |
RIKEN cDNA 1200007C13 gene |
9963 |
0.16 |
| chr1_105971738_105972167 | 17.59 |
Gm18801 |
predicted gene, 18801 |
15642 |
0.14 |
| chr6_38900912_38901211 | 17.54 |
Tbxas1 |
thromboxane A synthase 1, platelet |
17919 |
0.19 |
| chr2_30463478_30464399 | 17.46 |
Ier5l |
immediate early response 5-like |
10281 |
0.13 |
| chr17_36020770_36020975 | 17.45 |
H2-T24 |
histocompatibility 2, T region locus 24 |
312 |
0.69 |
| chr15_75862213_75862415 | 17.44 |
Gsdmd |
gasdermin D |
13 |
0.95 |
| chr6_52486731_52486882 | 17.43 |
1700094M24Rik |
RIKEN cDNA 1700094M24 gene |
5645 |
0.18 |
| chr12_108249547_108249855 | 17.42 |
Ccdc85c |
coiled-coil domain containing 85C |
25432 |
0.16 |
| chr4_6452560_6452756 | 17.35 |
Nsmaf |
neutral sphingomyelinase (N-SMase) activation associated factor |
921 |
0.61 |
| chr11_86581594_86581768 | 17.31 |
Mir21a |
microRNA 21a |
2477 |
0.22 |
| chr7_104507813_104508003 | 17.29 |
Trim30d |
tripartite motif-containing 30D |
59 |
0.94 |
| chr15_74930453_74930628 | 17.21 |
Gm39556 |
predicted gene, 39556 |
1103 |
0.31 |
| chr13_59820217_59820403 | 17.11 |
Tut7 |
terminal uridylyl transferase 7 |
2278 |
0.17 |
| chr12_86836762_86837069 | 17.01 |
Gm10095 |
predicted gene 10095 |
9552 |
0.19 |
| chr19_55866081_55866487 | 16.89 |
Ppnr |
per-pentamer repeat gene |
24612 |
0.2 |
| chr6_113657216_113657453 | 16.84 |
Irak2 |
interleukin-1 receptor-associated kinase 2 |
11516 |
0.07 |
| chr5_96921082_96921373 | 16.69 |
Gm8013 |
predicted gene 8013 |
45 |
0.93 |
| chr14_74972266_74972573 | 16.57 |
Gm4278 |
predicted gene 4278 |
2667 |
0.26 |
| chr12_110498667_110498909 | 16.48 |
Gm19605 |
predicted gene, 19605 |
12580 |
0.16 |
| chr16_38282619_38282812 | 16.45 |
Nr1i2 |
nuclear receptor subfamily 1, group I, member 2 |
12109 |
0.14 |
| chr7_135605115_135605302 | 16.45 |
Ptpre |
protein tyrosine phosphatase, receptor type, E |
620 |
0.73 |
| chr12_26456321_26456727 | 16.29 |
Rsad2 |
radical S-adenosyl methionine domain containing 2 |
72 |
0.96 |
| chr11_72301460_72301663 | 16.24 |
Xaf1 |
XIAP associated factor 1 |
68 |
0.95 |
| chr18_35094056_35094222 | 16.24 |
Gm3587 |
predicted gene 3587 |
6516 |
0.2 |
| chr1_136685478_136685661 | 16.21 |
Gm19705 |
predicted gene, 19705 |
1940 |
0.24 |
| chr8_22807853_22808706 | 16.19 |
1700041G16Rik |
RIKEN cDNA 1700041G16 gene |
4 |
0.97 |
| chr3_135607824_135607975 | 15.86 |
Nfkb1 |
nuclear factor of kappa light polypeptide gene enhancer in B cells 1, p105 |
371 |
0.86 |
| chr19_3905194_3905564 | 15.84 |
Tcirg1 |
T cell, immune regulator 1, ATPase, H+ transporting, lysosomal V0 protein A3 |
149 |
0.89 |
| chr3_60408983_60409147 | 15.83 |
Mbnl1 |
muscleblind like splicing factor 1 |
63765 |
0.12 |
| chr11_100931708_100931859 | 15.83 |
Stat3 |
signal transducer and activator of transcription 3 |
7597 |
0.15 |
| chr17_33919383_33920010 | 15.68 |
Tapbp |
TAP binding protein |
59 |
0.83 |
| chr7_104446060_104446225 | 15.65 |
Trim30a |
tripartite motif-containing 30A |
19051 |
0.09 |
| chr17_78882495_78882691 | 15.65 |
Eif2ak2 |
eukaryotic translation initiation factor 2-alpha kinase 2 |
20 |
0.96 |
| chr15_79892044_79892467 | 15.49 |
Apobec3 |
apolipoprotein B mRNA editing enzyme, catalytic polypeptide 3 |
148 |
0.92 |
| chr16_32190231_32190382 | 15.45 |
Bex6 |
brain expressed family member 6 |
4120 |
0.14 |
| chr10_30655839_30656049 | 15.44 |
Ncoa7 |
nuclear receptor coactivator 7 |
77 |
0.96 |
| chr11_119863663_119863845 | 15.44 |
Rptor |
regulatory associated protein of MTOR, complex 1 |
6310 |
0.16 |
| chr5_137115775_137116361 | 15.43 |
Trim56 |
tripartite motif-containing 56 |
139 |
0.93 |
| chr2_4559355_4560175 | 15.34 |
Frmd4a |
FERM domain containing 4A |
9 |
0.98 |
| chr11_58199487_58199685 | 15.33 |
Igtp |
interferon gamma induced GTPase |
0 |
0.5 |
| chr5_105110188_105110546 | 15.26 |
Gbp9 |
guanylate-binding protein 9 |
90 |
0.97 |
| chr11_69846804_69847286 | 15.21 |
Plscr3 |
phospholipid scramblase 3 |
369 |
0.61 |
| chr13_38296699_38296867 | 15.16 |
Gm47990 |
predicted gene, 47990 |
23743 |
0.13 |
| chr8_94735758_94735943 | 14.91 |
Ccl22 |
chemokine (C-C motif) ligand 22 |
9740 |
0.12 |
| chr8_40572970_40573513 | 14.88 |
Mtmr7 |
myotubularin related protein 7 |
17273 |
0.16 |
| chr2_79121005_79121302 | 14.85 |
Gm14465 |
predicted gene 14465 |
40442 |
0.17 |
| chr10_127508848_127510720 | 14.84 |
Stac3 |
SH3 and cysteine rich domain 3 |
2559 |
0.15 |
| chr17_34204420_34204645 | 14.81 |
Tap2 |
transporter 2, ATP-binding cassette, sub-family B (MDR/TAP) |
35 |
0.87 |
| chr8_33885102_33885274 | 14.78 |
Gm26978 |
predicted gene, 26978 |
559 |
0.74 |
| chr5_36726653_36726822 | 14.63 |
Gm43701 |
predicted gene 43701 |
21881 |
0.11 |
| chr1_42532954_42533261 | 14.63 |
Gm37047 |
predicted gene, 37047 |
41294 |
0.17 |
| chr19_34640676_34640950 | 14.55 |
Ifit1 |
interferon-induced protein with tetratricopeptide repeats 1 |
58 |
0.5 |
| chr15_97380017_97380182 | 14.48 |
Pced1b |
PC-esterase domain containing 1B |
18882 |
0.24 |
| chr17_70850487_70852089 | 14.19 |
Tgif1 |
TGFB-induced factor homeobox 1 |
81 |
0.94 |
| chr9_5298586_5298737 | 14.10 |
Casp1 |
caspase 1 |
25 |
0.98 |
| chr5_120812476_120812687 | 14.00 |
Oas1b |
2'-5' oligoadenylate synthetase 1B |
54 |
0.5 |
| chr2_24385099_24385869 | 13.98 |
Psd4 |
pleckstrin and Sec7 domain containing 4 |
131 |
0.95 |
| chr7_80666603_80666789 | 13.94 |
Crtc3 |
CREB regulated transcription coactivator 3 |
22181 |
0.15 |
| chr3_127123331_127123826 | 13.87 |
Ank2 |
ankyrin 2, brain |
1284 |
0.39 |
| chr5_92353466_92353617 | 13.86 |
Cxcl10 |
chemokine (C-X-C motif) ligand 10 |
4652 |
0.11 |
| chr11_51840369_51840521 | 13.78 |
Jade2 |
jade family PHD finger 2 |
16680 |
0.16 |
| chr7_99411605_99411756 | 13.72 |
Gdpd5 |
glycerophosphodiester phosphodiesterase domain containing 5 |
2970 |
0.2 |
| chr5_114897341_114897492 | 13.71 |
Oasl2 |
2'-5' oligoadenylate synthetase-like 2 |
116 |
0.92 |
| chrX_140505572_140505766 | 13.54 |
Tsc22d3 |
TSC22 domain family, member 3 |
36999 |
0.14 |
| chr18_39369573_39369724 | 13.50 |
Arhgap26 |
Rho GTPase activating protein 26 |
7065 |
0.2 |
| chr5_99339717_99339868 | 13.49 |
Gm35394 |
predicted gene, 35394 |
65697 |
0.12 |
| chr19_23152302_23152649 | 13.46 |
Mir1192 |
microRNA 1192 |
3044 |
0.22 |
| chr3_37553534_37553697 | 13.40 |
Gm12564 |
predicted gene 12564 |
2888 |
0.19 |
| chr3_86110180_86110355 | 13.26 |
Gm25188 |
predicted gene, 25188 |
9733 |
0.11 |
| chr6_67170285_67170790 | 13.24 |
A430010J10Rik |
RIKEN cDNA A430010J10 gene |
5334 |
0.17 |
| chr7_110087753_110088042 | 13.23 |
Zfp143 |
zinc finger protein 143 |
3732 |
0.15 |
| chr13_23436521_23436693 | 13.14 |
C230035I16Rik |
RIKEN cDNA C230035I16 gene |
5585 |
0.09 |
| chr9_111056836_111057083 | 13.07 |
Ccrl2 |
chemokine (C-C motif) receptor-like 2 |
287 |
0.82 |
| chr13_58158180_58158751 | 13.07 |
Idnk |
idnK gluconokinase homolog (E. coli) |
782 |
0.36 |
| chr11_86586799_86587209 | 13.04 |
Vmp1 |
vacuole membrane protein 1 |
10 |
0.97 |
| chr8_46844739_46844892 | 12.98 |
Gm45481 |
predicted gene 45481 |
10903 |
0.18 |
| chr17_34862151_34862359 | 12.95 |
Cfb |
complement factor B |
82 |
0.88 |
| chr13_37513916_37514640 | 12.93 |
Gm29590 |
predicted gene 29590 |
4560 |
0.12 |
| chr17_36023721_36023895 | 12.90 |
H2-T24 |
histocompatibility 2, T region locus 24 |
3248 |
0.08 |
| chr19_34583250_34583593 | 12.89 |
Ifit3 |
interferon-induced protein with tetratricopeptide repeats 3 |
110 |
0.94 |
| chr13_93388637_93389177 | 12.81 |
Gm47155 |
predicted gene, 47155 |
21876 |
0.14 |
| chr11_96967275_96967440 | 12.80 |
Sp2 |
Sp2 transcription factor |
1308 |
0.25 |
| chr7_80033489_80033640 | 12.77 |
Gm44951 |
predicted gene 44951 |
3141 |
0.16 |
| chr16_55816469_55816872 | 12.75 |
Nfkbiz |
nuclear factor of kappa light polypeptide gene enhancer in B cells inhibitor, zeta |
1845 |
0.33 |
| chr14_55577823_55578992 | 12.72 |
Psme1 |
proteasome (prosome, macropain) activator subunit 1 (PA28 alpha) |
2 |
0.91 |
| chr8_79638728_79640227 | 12.63 |
Otud4 |
OTU domain containing 4 |
141 |
0.96 |
| chr3_103020186_103021519 | 12.61 |
Csde1 |
cold shock domain containing E1, RNA binding |
188 |
0.92 |
| chr11_53859007_53859393 | 12.56 |
Gm12216 |
predicted gene 12216 |
29 |
0.96 |
| chr12_97061465_97061811 | 12.56 |
Gm47397 |
predicted gene, 47397 |
40826 |
0.21 |
| chr7_102565432_102565621 | 12.55 |
Trim21 |
tripartite motif-containing 21 |
40 |
0.93 |
| chr10_96686112_96686478 | 12.52 |
Gm48507 |
predicted gene, 48507 |
25512 |
0.18 |
| chr12_26469028_26470065 | 12.50 |
Cmpk2 |
cytidine monophosphate (UMP-CMP) kinase 2, mitochondrial |
342 |
0.84 |
| chr9_64070545_64070750 | 12.48 |
Scarletltr |
Scarletltr, erythroid developmental long intergenic non-protein coding transcript |
10114 |
0.12 |
| chr7_104315472_104315664 | 12.44 |
Trim12a |
tripartite motif-containing 12A |
102 |
0.84 |
| chr14_59365472_59365623 | 12.39 |
Phf11d |
PHD finger protein 11D |
77 |
0.96 |
| chr6_129230311_129230601 | 12.39 |
2310001H17Rik |
RIKEN cDNA 2310001H17 gene |
3518 |
0.15 |
| chr7_141265966_141266219 | 12.38 |
Irf7 |
interferon regulatory factor 7 |
48 |
0.93 |
| chr7_70358895_70359853 | 12.38 |
Nr2f2 |
nuclear receptor subfamily 2, group F, member 2 |
521 |
0.68 |
| chr5_114371791_114371942 | 12.34 |
Kctd10 |
potassium channel tetramerisation domain containing 10 |
276 |
0.87 |
| chr19_45015990_45016770 | 12.28 |
Lzts2 |
leucine zipper, putative tumor suppressor 2 |
117 |
0.93 |
| chr13_52825051_52825202 | 12.28 |
BB123696 |
expressed sequence BB123696 |
67921 |
0.11 |
| chr13_100201785_100201950 | 12.28 |
Naip2 |
NLR family, apoptosis inhibitory protein 2 |
94 |
0.96 |
| chr1_34389196_34389610 | 12.27 |
Gm5266 |
predicted gene 5266 |
22032 |
0.09 |
| chr3_59228822_59228973 | 12.22 |
P2ry12 |
purinergic receptor P2Y, G-protein coupled 12 |
1316 |
0.36 |
| chr7_78913903_78914305 | 12.21 |
Isg20 |
interferon-stimulated protein |
123 |
0.94 |
| chr11_59656088_59656239 | 12.19 |
Mprip |
myosin phosphatase Rho interacting protein |
5142 |
0.15 |
| chr2_162930645_162930796 | 12.19 |
Srsf6 |
serine and arginine-rich splicing factor 6 |
808 |
0.51 |
| chr5_53998183_53999428 | 12.17 |
Stim2 |
stromal interaction molecule 2 |
240 |
0.95 |
| chr11_21058491_21058642 | 12.14 |
Peli1 |
pellino 1 |
32725 |
0.16 |
| chr9_63757305_63758776 | 12.13 |
Smad3 |
SMAD family member 3 |
46 |
0.98 |
| chr1_13668642_13668800 | 12.11 |
Xkr9 |
X-linked Kx blood group related 9 |
50 |
0.97 |
| chr4_99942066_99942281 | 12.04 |
Itgb3bp |
integrin beta 3 binding protein (beta3-endonexin) |
12360 |
0.17 |
| chr12_87284796_87284947 | 11.99 |
Ism2 |
isthmin 2 |
2202 |
0.17 |
| chr17_18558874_18559025 | 11.97 |
Vmn2r96 |
vomeronasal 2, receptor 96 |
14202 |
0.23 |
| chr1_91301585_91301867 | 11.95 |
Scly |
selenocysteine lyase |
1071 |
0.36 |
| chr11_121056618_121056859 | 11.88 |
Sectm1b |
secreted and transmembrane 1B |
110 |
0.92 |
| chr9_64084343_64084529 | 11.87 |
Scarletltr |
Scarletltr, erythroid developmental long intergenic non-protein coding transcript |
3675 |
0.15 |
| chr7_104465078_104465376 | 11.86 |
Trim30a |
tripartite motif-containing 30A |
34 |
0.95 |
| chr5_97007576_97007868 | 11.86 |
Bmp2k |
BMP2 inducible kinase |
10033 |
0.14 |
| chr19_34445758_34445910 | 11.82 |
Gm26902 |
predicted gene, 26902 |
28974 |
0.12 |
| chr5_137345934_137346263 | 11.78 |
Ephb4 |
Eph receptor B4 |
4011 |
0.1 |
| chr17_34198241_34198411 | 11.77 |
Psmb8 |
proteasome (prosome, macropain) subunit, beta type 8 (large multifunctional peptidase 7) |
44 |
0.92 |
| chr4_135312755_135313155 | 11.75 |
Gm12982 |
predicted gene 12982 |
4985 |
0.13 |
| chr5_5186166_5186392 | 11.74 |
Cdk14 |
cyclin-dependent kinase 14 |
9076 |
0.17 |
| chr13_59509801_59510082 | 11.69 |
Agtpbp1 |
ATP/GTP binding protein 1 |
4213 |
0.2 |
| chr16_36890395_36890556 | 11.68 |
Gm49600 |
predicted gene, 49600 |
3919 |
0.11 |
| chr7_78803984_78804162 | 11.67 |
5330411O13Rik |
RIKEN cDNA 5330411O13 gene |
14212 |
0.11 |
| chr2_126597335_126597526 | 11.67 |
Hdc |
histidine decarboxylase |
831 |
0.59 |
| chr4_100994668_100995090 | 11.64 |
Cachd1 |
cache domain containing 1 |
169 |
0.95 |
| chr1_156956428_156956586 | 11.60 |
4930439D14Rik |
RIKEN cDNA 4930439D14 gene |
16669 |
0.16 |
| chr18_6760941_6761115 | 11.57 |
Gm7466 |
predicted gene 7466 |
69 |
0.97 |
| chr8_106563693_106563844 | 11.57 |
Gm10073 |
predicted pseudogene 10073 |
9582 |
0.16 |
| chr4_150685000_150685176 | 11.45 |
Gm16079 |
predicted gene 16079 |
6296 |
0.22 |
| chr6_51545342_51545493 | 11.44 |
Snx10 |
sorting nexin 10 |
851 |
0.65 |
| chr8_46739090_46739964 | 11.35 |
Gm16675 |
predicted gene, 16675 |
12 |
0.73 |
| chr2_60940041_60940219 | 11.35 |
Rbms1 |
RNA binding motif, single stranded interacting protein 1 |
23062 |
0.21 |
| chr2_133761481_133761632 | 11.33 |
Gm25258 |
predicted gene, 25258 |
177135 |
0.03 |
| chr16_4012853_4013176 | 11.29 |
Slx4 |
SLX4 structure-specific endonuclease subunit homolog (S. cerevisiae) |
9244 |
0.1 |
| chr1_129956786_129956952 | 11.29 |
Gm37278 |
predicted gene, 37278 |
13707 |
0.22 |
| chr9_61370339_61371660 | 11.22 |
Gm10655 |
predicted gene 10655 |
628 |
0.63 |
| chr12_111417349_111417713 | 11.18 |
Exoc3l4 |
exocyst complex component 3-like 4 |
55 |
0.96 |
| chr5_64861022_64861206 | 11.18 |
Klf3 |
Kruppel-like factor 3 (basic) |
34305 |
0.11 |
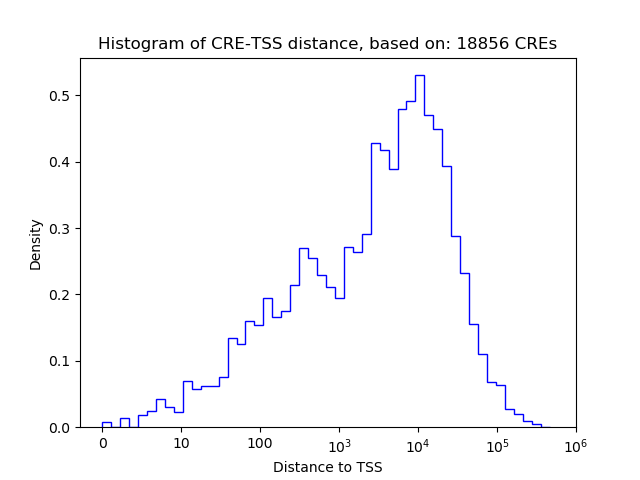
Histogram of CRE-TSS distances for CREs targeted by :
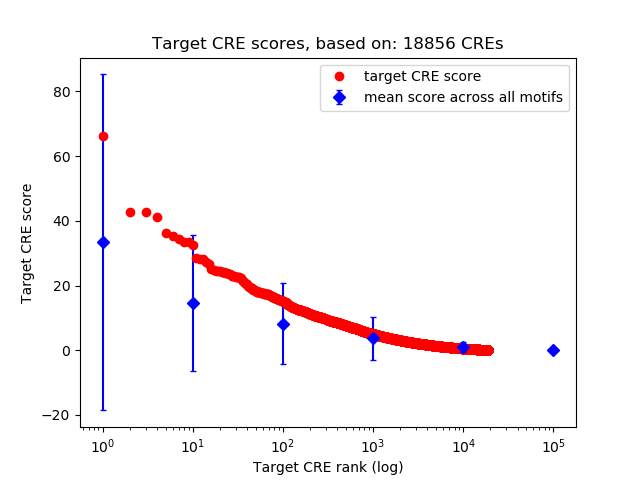
Rank distribution of CRE target scores:
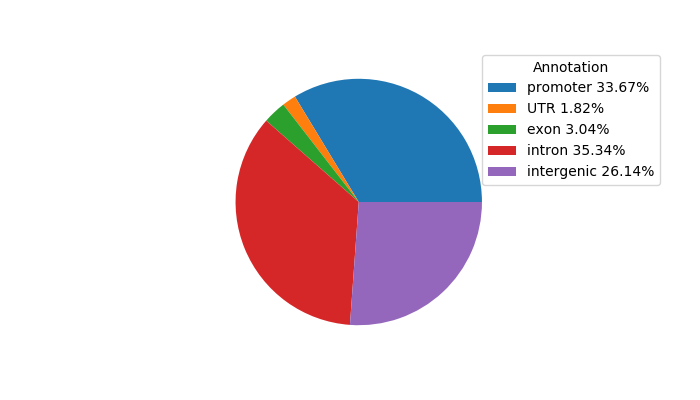
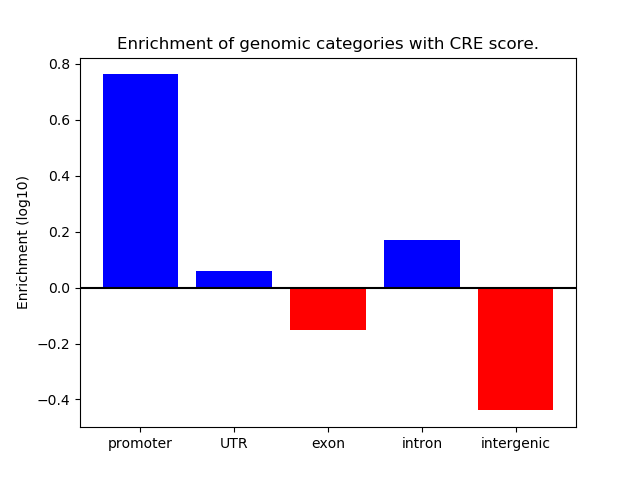
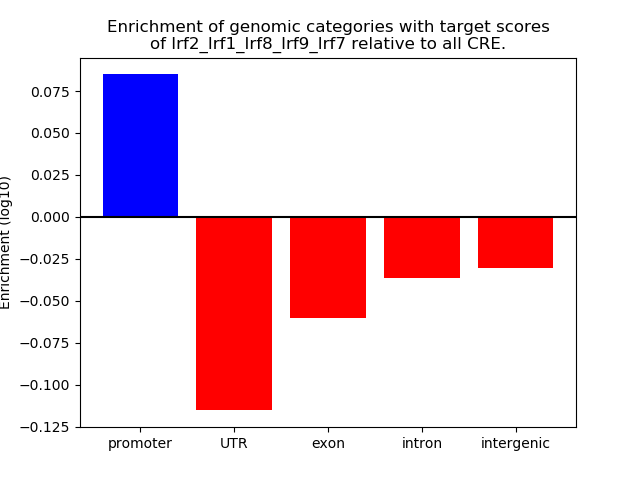
Distribution of target CREs across different genomic regions:
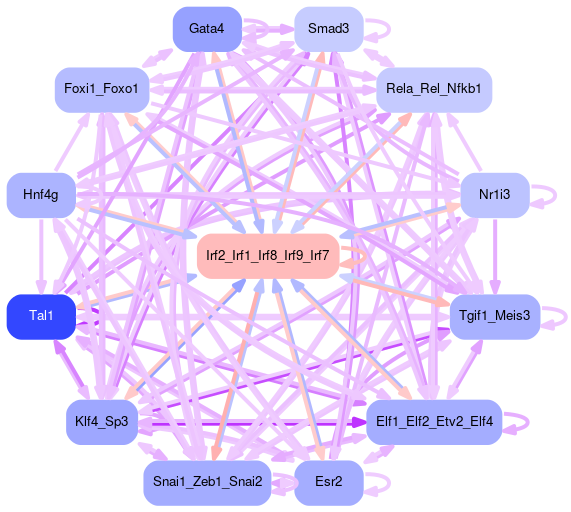
Network of associatons between targets according to the STRING database.

Gene Ontology Analysis
Gene overrepresentation in biological process category:
| Log-likelihood per target | Total log-likelihood | Term | Description |
|---|---|---|---|
| 10.6 | 31.7 | GO:0043321 | regulation of natural killer cell degranulation(GO:0043321) |
| 9.7 | 48.3 | GO:0032020 | ISG15-protein conjugation(GO:0032020) |
| 7.3 | 21.8 | GO:1902915 | negative regulation of protein K63-linked ubiquitination(GO:1900045) negative regulation of protein polyubiquitination(GO:1902915) |
| 6.7 | 40.4 | GO:0042270 | protection from natural killer cell mediated cytotoxicity(GO:0042270) |
| 6.7 | 20.1 | GO:0034165 | positive regulation of toll-like receptor 9 signaling pathway(GO:0034165) |
| 6.4 | 57.7 | GO:0070269 | pyroptosis(GO:0070269) |
| 6.2 | 18.5 | GO:0097296 | activation of cysteine-type endopeptidase activity involved in apoptotic signaling pathway(GO:0097296) |
| 6.0 | 30.0 | GO:0002741 | positive regulation of cytokine secretion involved in immune response(GO:0002741) |
| 5.8 | 17.5 | GO:1900169 | regulation of glucocorticoid mediated signaling pathway(GO:1900169) |
| 5.7 | 22.8 | GO:0006083 | acetate metabolic process(GO:0006083) |
| 5.5 | 21.9 | GO:1903377 | negative regulation of oxidative stress-induced neuron intrinsic apoptotic signaling pathway(GO:1903377) |
| 5.3 | 21.2 | GO:0010528 | regulation of transposition(GO:0010528) negative regulation of transposition(GO:0010529) |
| 5.1 | 15.2 | GO:0010956 | negative regulation of calcidiol 1-monooxygenase activity(GO:0010956) |
| 5.0 | 14.9 | GO:0007039 | protein catabolic process in the vacuole(GO:0007039) |
| 4.4 | 17.5 | GO:0070966 | nuclear-transcribed mRNA catabolic process, no-go decay(GO:0070966) |
| 4.3 | 30.3 | GO:2000051 | negative regulation of non-canonical Wnt signaling pathway(GO:2000051) |
| 4.3 | 12.9 | GO:1900226 | negative regulation of NLRP3 inflammasome complex assembly(GO:1900226) |
| 4.0 | 12.1 | GO:0090086 | negative regulation of protein deubiquitination(GO:0090086) |
| 4.0 | 12.0 | GO:0061470 | T follicular helper cell differentiation(GO:0061470) |
| 3.9 | 15.6 | GO:0052055 | modulation by symbiont of host molecular function(GO:0052055) |
| 3.9 | 19.3 | GO:0070627 | ferrous iron import(GO:0070627) |
| 3.8 | 7.6 | GO:0018171 | peptidyl-cysteine oxidation(GO:0018171) |
| 3.8 | 22.7 | GO:0042590 | antigen processing and presentation of exogenous peptide antigen via MHC class I(GO:0042590) |
| 3.8 | 7.5 | GO:0050904 | diapedesis(GO:0050904) |
| 3.7 | 11.0 | GO:0060700 | regulation of ribonuclease activity(GO:0060700) |
| 3.6 | 14.5 | GO:0021590 | cerebellum maturation(GO:0021590) |
| 3.5 | 10.6 | GO:0002036 | regulation of L-glutamate transport(GO:0002036) |
| 3.5 | 10.5 | GO:0039534 | negative regulation of MDA-5 signaling pathway(GO:0039534) |
| 3.4 | 10.2 | GO:0009139 | dUDP biosynthetic process(GO:0006227) pyrimidine nucleoside diphosphate biosynthetic process(GO:0009139) pyrimidine deoxyribonucleoside diphosphate metabolic process(GO:0009196) pyrimidine deoxyribonucleoside diphosphate biosynthetic process(GO:0009197) dUDP metabolic process(GO:0046077) |
| 3.4 | 13.5 | GO:0038026 | reelin-mediated signaling pathway(GO:0038026) |
| 3.4 | 64.3 | GO:0035455 | response to interferon-alpha(GO:0035455) |
| 3.4 | 16.8 | GO:0006686 | sphingomyelin biosynthetic process(GO:0006686) |
| 3.4 | 26.9 | GO:0060340 | positive regulation of type I interferon-mediated signaling pathway(GO:0060340) |
| 3.3 | 10.0 | GO:0006741 | NADP biosynthetic process(GO:0006741) |
| 3.3 | 10.0 | GO:0060375 | regulation of mast cell differentiation(GO:0060375) |
| 3.3 | 10.0 | GO:2000338 | chemokine (C-X-C motif) ligand 1 production(GO:0072566) regulation of chemokine (C-X-C motif) ligand 1 production(GO:2000338) |
| 3.2 | 9.6 | GO:0006768 | biotin metabolic process(GO:0006768) |
| 3.2 | 9.5 | GO:0018199 | peptidyl-glutamine modification(GO:0018199) |
| 3.1 | 6.3 | GO:0060397 | JAK-STAT cascade involved in growth hormone signaling pathway(GO:0060397) |
| 3.0 | 12.1 | GO:0048625 | myoblast fate commitment(GO:0048625) |
| 3.0 | 9.0 | GO:0006556 | S-adenosylmethionine biosynthetic process(GO:0006556) |
| 3.0 | 8.9 | GO:0032788 | saturated monocarboxylic acid metabolic process(GO:0032788) unsaturated monocarboxylic acid metabolic process(GO:0032789) |
| 2.9 | 2.9 | GO:1904504 | regulation of lipophagy(GO:1904502) positive regulation of lipophagy(GO:1904504) |
| 2.9 | 11.4 | GO:0034154 | toll-like receptor 7 signaling pathway(GO:0034154) |
| 2.8 | 8.5 | GO:0034197 | acylglycerol transport(GO:0034196) triglyceride transport(GO:0034197) |
| 2.8 | 8.4 | GO:0090365 | regulation of mRNA modification(GO:0090365) |
| 2.8 | 8.4 | GO:0061511 | centriole elongation(GO:0061511) |
| 2.8 | 8.4 | GO:0048208 | vesicle targeting, rough ER to cis-Golgi(GO:0048207) COPII vesicle coating(GO:0048208) |
| 2.8 | 66.8 | GO:0035456 | response to interferon-beta(GO:0035456) |
| 2.8 | 11.1 | GO:0051919 | positive regulation of fibrinolysis(GO:0051919) |
| 2.8 | 13.8 | GO:0006548 | histidine catabolic process(GO:0006548) imidazole-containing compound catabolic process(GO:0052805) |
| 2.7 | 8.2 | GO:0006982 | response to lipid hydroperoxide(GO:0006982) |
| 2.7 | 10.8 | GO:0033634 | positive regulation of cell-cell adhesion mediated by integrin(GO:0033634) |
| 2.7 | 13.4 | GO:0071918 | urea transmembrane transport(GO:0071918) |
| 2.7 | 8.0 | GO:0038028 | insulin receptor signaling pathway via phosphatidylinositol 3-kinase(GO:0038028) |
| 2.7 | 8.0 | GO:1904139 | microglial cell migration(GO:1904124) regulation of microglial cell migration(GO:1904139) |
| 2.6 | 7.9 | GO:1900126 | negative regulation of hyaluronan biosynthetic process(GO:1900126) |
| 2.6 | 7.9 | GO:0043974 | histone H3-K27 acetylation(GO:0043974) regulation of histone H3-K27 acetylation(GO:1901674) |
| 2.6 | 13.0 | GO:0046485 | ether lipid metabolic process(GO:0046485) |
| 2.6 | 7.7 | GO:0045472 | response to ether(GO:0045472) |
| 2.5 | 7.6 | GO:2000383 | regulation of ectoderm development(GO:2000383) negative regulation of ectoderm development(GO:2000384) |
| 2.5 | 7.6 | GO:0044778 | meiotic DNA integrity checkpoint(GO:0044778) |
| 2.5 | 2.5 | GO:0018197 | peptidyl-aspartic acid modification(GO:0018197) |
| 2.4 | 38.4 | GO:0046597 | negative regulation of viral entry into host cell(GO:0046597) |
| 2.4 | 9.6 | GO:0000480 | endonucleolytic cleavage in 5'-ETS of tricistronic rRNA transcript (SSU-rRNA, 5.8S rRNA, LSU-rRNA)(GO:0000480) |
| 2.4 | 16.5 | GO:1904417 | regulation of xenophagy(GO:1904415) positive regulation of xenophagy(GO:1904417) |
| 2.3 | 2.3 | GO:0002904 | positive regulation of B cell apoptotic process(GO:0002904) |
| 2.3 | 9.3 | GO:0030578 | PML body organization(GO:0030578) |
| 2.3 | 6.9 | GO:2000048 | negative regulation of cell-cell adhesion mediated by cadherin(GO:2000048) |
| 2.3 | 6.8 | GO:0097527 | necroptotic signaling pathway(GO:0097527) |
| 2.2 | 6.7 | GO:0006438 | valyl-tRNA aminoacylation(GO:0006438) |
| 2.2 | 6.7 | GO:0072429 | response to intra-S DNA damage checkpoint signaling(GO:0072429) |
| 2.2 | 13.3 | GO:0090336 | positive regulation of brown fat cell differentiation(GO:0090336) |
| 2.2 | 17.7 | GO:0048752 | semicircular canal morphogenesis(GO:0048752) |
| 2.2 | 44.3 | GO:0045071 | negative regulation of viral genome replication(GO:0045071) |
| 2.2 | 8.8 | GO:2000741 | positive regulation of mesenchymal stem cell differentiation(GO:2000741) |
| 2.2 | 6.6 | GO:0046061 | dATP catabolic process(GO:0046061) |
| 2.2 | 13.0 | GO:0032825 | positive regulation of natural killer cell differentiation(GO:0032825) |
| 2.2 | 10.8 | GO:0032237 | activation of store-operated calcium channel activity(GO:0032237) |
| 2.1 | 6.4 | GO:2000346 | negative regulation of hepatocyte proliferation(GO:2000346) |
| 2.1 | 6.2 | GO:0045658 | regulation of neutrophil differentiation(GO:0045658) |
| 2.1 | 6.2 | GO:1903847 | regulation of aorta morphogenesis(GO:1903847) positive regulation of aorta morphogenesis(GO:1903849) |
| 2.1 | 6.2 | GO:0051599 | response to hydrostatic pressure(GO:0051599) |
| 2.0 | 6.1 | GO:0000960 | mitochondrial RNA catabolic process(GO:0000957) regulation of mitochondrial RNA catabolic process(GO:0000960) |
| 2.0 | 8.2 | GO:2000659 | regulation of interleukin-1-mediated signaling pathway(GO:2000659) |
| 2.0 | 8.1 | GO:1901026 | ripoptosome assembly(GO:0097343) ripoptosome assembly involved in necroptotic process(GO:1901026) |
| 2.0 | 2.0 | GO:0090232 | positive regulation of spindle checkpoint(GO:0090232) |
| 2.0 | 6.1 | GO:0046271 | phenylpropanoid catabolic process(GO:0046271) |
| 2.0 | 8.0 | GO:0060528 | secretory columnal luminar epithelial cell differentiation involved in prostate glandular acinus development(GO:0060528) |
| 2.0 | 4.0 | GO:2000832 | negative regulation of steroid hormone secretion(GO:2000832) negative regulation of corticosteroid hormone secretion(GO:2000847) negative regulation of glucocorticoid secretion(GO:2000850) |
| 2.0 | 17.9 | GO:0043569 | negative regulation of insulin-like growth factor receptor signaling pathway(GO:0043569) |
| 2.0 | 4.0 | GO:1901386 | negative regulation of voltage-gated calcium channel activity(GO:1901386) |
| 2.0 | 9.9 | GO:0090435 | protein localization to nuclear envelope(GO:0090435) |
| 2.0 | 7.9 | GO:0042518 | negative regulation of tyrosine phosphorylation of Stat3 protein(GO:0042518) |
| 2.0 | 9.8 | GO:0045602 | negative regulation of endothelial cell differentiation(GO:0045602) |
| 1.9 | 54.1 | GO:0001562 | response to protozoan(GO:0001562) |
| 1.9 | 11.5 | GO:2000675 | negative regulation of type B pancreatic cell apoptotic process(GO:2000675) |
| 1.9 | 9.5 | GO:0060836 | lymphatic endothelial cell differentiation(GO:0060836) |
| 1.9 | 5.7 | GO:0035694 | mitochondrial protein catabolic process(GO:0035694) |
| 1.9 | 9.5 | GO:0080009 | mRNA methylation(GO:0080009) |
| 1.9 | 9.4 | GO:0071680 | response to indole-3-methanol(GO:0071680) cellular response to indole-3-methanol(GO:0071681) |
| 1.9 | 5.6 | GO:0010724 | regulation of definitive erythrocyte differentiation(GO:0010724) |
| 1.9 | 5.6 | GO:0035771 | interleukin-4-mediated signaling pathway(GO:0035771) |
| 1.8 | 14.7 | GO:0097286 | iron ion import(GO:0097286) |
| 1.8 | 7.3 | GO:0001887 | selenium compound metabolic process(GO:0001887) |
| 1.8 | 14.4 | GO:0048387 | negative regulation of retinoic acid receptor signaling pathway(GO:0048387) |
| 1.8 | 5.3 | GO:0048549 | positive regulation of pinocytosis(GO:0048549) |
| 1.7 | 5.2 | GO:0061355 | Wnt protein secretion(GO:0061355) regulation of Wnt protein secretion(GO:0061356) |
| 1.7 | 1.7 | GO:0009189 | deoxyribonucleoside diphosphate biosynthetic process(GO:0009189) |
| 1.7 | 1.7 | GO:0070673 | response to interleukin-18(GO:0070673) cellular response to interleukin-18(GO:0071351) |
| 1.7 | 5.2 | GO:0070947 | neutrophil mediated killing of fungus(GO:0070947) |
| 1.7 | 6.9 | GO:0010891 | negative regulation of sequestering of triglyceride(GO:0010891) |
| 1.7 | 5.2 | GO:0060931 | sinoatrial node cell development(GO:0060931) |
| 1.7 | 8.6 | GO:0043379 | memory T cell differentiation(GO:0043379) |
| 1.7 | 3.5 | GO:0033668 | negative regulation by symbiont of host apoptotic process(GO:0033668) negative regulation by symbiont of host programmed cell death(GO:0052041) negative regulation by organism of programmed cell death in other organism involved in symbiotic interaction(GO:0052490) |
| 1.7 | 8.6 | GO:0002457 | T cell antigen processing and presentation(GO:0002457) |
| 1.7 | 1.7 | GO:1901187 | regulation of ephrin receptor signaling pathway(GO:1901187) |
| 1.7 | 6.8 | GO:1990414 | replication-born double-strand break repair via sister chromatid exchange(GO:1990414) |
| 1.7 | 13.3 | GO:0070493 | thrombin receptor signaling pathway(GO:0070493) |
| 1.7 | 5.0 | GO:0044791 | modulation by host of viral release from host cell(GO:0044789) positive regulation by host of viral release from host cell(GO:0044791) |
| 1.6 | 3.3 | GO:0006573 | valine metabolic process(GO:0006573) |
| 1.6 | 6.6 | GO:0007023 | post-chaperonin tubulin folding pathway(GO:0007023) |
| 1.6 | 4.9 | GO:1904059 | regulation of locomotor rhythm(GO:1904059) |
| 1.6 | 3.3 | GO:2000828 | regulation of parathyroid hormone secretion(GO:2000828) |
| 1.6 | 11.4 | GO:1902715 | positive regulation of interferon-gamma secretion(GO:1902715) |
| 1.6 | 4.9 | GO:0034141 | positive regulation of toll-like receptor 3 signaling pathway(GO:0034141) |
| 1.6 | 3.2 | GO:0035054 | embryonic heart tube anterior/posterior pattern specification(GO:0035054) |
| 1.6 | 1.6 | GO:0042504 | tyrosine phosphorylation of Stat4 protein(GO:0042504) regulation of tyrosine phosphorylation of Stat4 protein(GO:0042519) |
| 1.6 | 8.1 | GO:0010571 | positive regulation of nuclear cell cycle DNA replication(GO:0010571) |
| 1.6 | 44.4 | GO:0046825 | regulation of protein export from nucleus(GO:0046825) |
| 1.6 | 4.7 | GO:1904177 | regulation of adipose tissue development(GO:1904177) |
| 1.6 | 23.7 | GO:0032012 | ARF protein signal transduction(GO:0032011) regulation of ARF protein signal transduction(GO:0032012) |
| 1.6 | 6.3 | GO:0045901 | positive regulation of translational elongation(GO:0045901) |
| 1.6 | 4.7 | GO:1900095 | regulation of dosage compensation by inactivation of X chromosome(GO:1900095) |
| 1.5 | 4.6 | GO:0070889 | platelet alpha granule organization(GO:0070889) |
| 1.5 | 13.7 | GO:0045019 | negative regulation of nitric oxide biosynthetic process(GO:0045019) negative regulation of nitric oxide metabolic process(GO:1904406) |
| 1.5 | 6.1 | GO:0038165 | oncostatin-M-mediated signaling pathway(GO:0038165) |
| 1.5 | 6.1 | GO:0009597 | detection of virus(GO:0009597) |
| 1.5 | 4.5 | GO:0002432 | granuloma formation(GO:0002432) |
| 1.5 | 6.0 | GO:0045719 | negative regulation of glycogen biosynthetic process(GO:0045719) |
| 1.5 | 4.5 | GO:0006210 | pyrimidine nucleobase catabolic process(GO:0006208) thymine catabolic process(GO:0006210) thymine metabolic process(GO:0019859) |
| 1.5 | 6.0 | GO:0098910 | regulation of atrial cardiac muscle cell action potential(GO:0098910) |
| 1.5 | 1.5 | GO:0036258 | multivesicular body assembly(GO:0036258) |
| 1.5 | 10.5 | GO:0046473 | phosphatidic acid metabolic process(GO:0046473) |
| 1.5 | 6.0 | GO:0009957 | epidermal cell fate specification(GO:0009957) |
| 1.5 | 3.0 | GO:1903751 | regulation of intrinsic apoptotic signaling pathway in response to hydrogen peroxide(GO:1903750) negative regulation of intrinsic apoptotic signaling pathway in response to hydrogen peroxide(GO:1903751) |
| 1.5 | 3.0 | GO:0043435 | response to corticotropin-releasing hormone(GO:0043435) cellular response to corticotropin-releasing hormone stimulus(GO:0071376) |
| 1.5 | 4.4 | GO:0061113 | pancreas morphogenesis(GO:0061113) |
| 1.4 | 4.3 | GO:0009080 | alanine catabolic process(GO:0006524) pyruvate family amino acid catabolic process(GO:0009080) |
| 1.4 | 2.9 | GO:0019626 | short-chain fatty acid catabolic process(GO:0019626) |
| 1.4 | 2.8 | GO:0046084 | adenine metabolic process(GO:0046083) adenine biosynthetic process(GO:0046084) |
| 1.4 | 5.6 | GO:1990086 | lens fiber cell apoptotic process(GO:1990086) |
| 1.4 | 1.4 | GO:0034140 | negative regulation of toll-like receptor 3 signaling pathway(GO:0034140) |
| 1.4 | 15.5 | GO:0009437 | carnitine metabolic process(GO:0009437) |
| 1.4 | 2.8 | GO:0000320 | re-entry into mitotic cell cycle(GO:0000320) |
| 1.4 | 4.2 | GO:0032252 | secretory granule localization(GO:0032252) |
| 1.4 | 1.4 | GO:0009263 | deoxyribonucleotide biosynthetic process(GO:0009263) |
| 1.4 | 13.6 | GO:0097066 | response to thyroid hormone(GO:0097066) |
| 1.4 | 15.0 | GO:0006047 | UDP-N-acetylglucosamine metabolic process(GO:0006047) |
| 1.4 | 4.1 | GO:0051572 | negative regulation of histone H3-K4 methylation(GO:0051572) |
| 1.3 | 6.7 | GO:0006167 | AMP biosynthetic process(GO:0006167) |
| 1.3 | 4.0 | GO:1903898 | negative regulation of PERK-mediated unfolded protein response(GO:1903898) |
| 1.3 | 4.0 | GO:0060137 | maternal process involved in parturition(GO:0060137) |
| 1.3 | 4.0 | GO:0002337 | B-1a B cell differentiation(GO:0002337) |
| 1.3 | 3.9 | GO:0046060 | dATP metabolic process(GO:0046060) |
| 1.3 | 2.6 | GO:0010248 | establishment or maintenance of transmembrane electrochemical gradient(GO:0010248) |
| 1.3 | 2.6 | GO:0019371 | cyclooxygenase pathway(GO:0019371) |
| 1.3 | 7.8 | GO:0018401 | peptidyl-proline hydroxylation to 4-hydroxy-L-proline(GO:0018401) |
| 1.3 | 15.5 | GO:0051044 | positive regulation of membrane protein ectodomain proteolysis(GO:0051044) |
| 1.3 | 2.6 | GO:0072361 | regulation of glycolytic process by regulation of transcription from RNA polymerase II promoter(GO:0072361) |
| 1.3 | 6.4 | GO:0006207 | 'de novo' pyrimidine nucleobase biosynthetic process(GO:0006207) pyrimidine nucleobase biosynthetic process(GO:0019856) |
| 1.3 | 3.8 | GO:0000087 | mitotic M phase(GO:0000087) |
| 1.3 | 3.8 | GO:0001712 | ectodermal cell fate commitment(GO:0001712) |
| 1.3 | 1.3 | GO:0060584 | regulation of prostaglandin-endoperoxide synthase activity(GO:0060584) positive regulation of prostaglandin-endoperoxide synthase activity(GO:0060585) |
| 1.3 | 5.1 | GO:2000348 | regulation of CD40 signaling pathway(GO:2000348) |
| 1.3 | 3.8 | GO:1903797 | positive regulation of inorganic anion transmembrane transport(GO:1903797) |
| 1.3 | 2.6 | GO:0006545 | glycine biosynthetic process(GO:0006545) |
| 1.3 | 5.1 | GO:0097368 | establishment of Sertoli cell barrier(GO:0097368) |
| 1.3 | 5.1 | GO:0018377 | protein myristoylation(GO:0018377) |
| 1.3 | 2.5 | GO:0090283 | regulation of protein glycosylation in Golgi(GO:0090283) |
| 1.3 | 1.3 | GO:0098869 | cellular oxidant detoxification(GO:0098869) |
| 1.3 | 1.3 | GO:0032460 | negative regulation of protein oligomerization(GO:0032460) |
| 1.3 | 2.5 | GO:0002838 | negative regulation of response to tumor cell(GO:0002835) negative regulation of immune response to tumor cell(GO:0002838) |
| 1.3 | 5.0 | GO:0090666 | scaRNA localization to Cajal body(GO:0090666) |
| 1.3 | 7.5 | GO:0061099 | negative regulation of protein tyrosine kinase activity(GO:0061099) |
| 1.3 | 2.5 | GO:1901844 | regulation of cell communication by electrical coupling involved in cardiac conduction(GO:1901844) |
| 1.3 | 2.5 | GO:0048388 | endosomal lumen acidification(GO:0048388) |
| 1.2 | 7.5 | GO:0071318 | cellular response to ATP(GO:0071318) |
| 1.2 | 3.7 | GO:0042536 | negative regulation of tumor necrosis factor biosynthetic process(GO:0042536) |
| 1.2 | 2.5 | GO:0045053 | protein retention in Golgi apparatus(GO:0045053) |
| 1.2 | 8.6 | GO:0045651 | positive regulation of macrophage differentiation(GO:0045651) |
| 1.2 | 11.0 | GO:0043249 | erythrocyte maturation(GO:0043249) |
| 1.2 | 6.1 | GO:0046543 | development of secondary female sexual characteristics(GO:0046543) |
| 1.2 | 6.1 | GO:0009249 | protein lipoylation(GO:0009249) |
| 1.2 | 2.4 | GO:0046112 | purine nucleobase biosynthetic process(GO:0009113) nucleobase biosynthetic process(GO:0046112) |
| 1.2 | 7.3 | GO:0031274 | positive regulation of pseudopodium assembly(GO:0031274) |
| 1.2 | 4.9 | GO:0035279 | mRNA cleavage involved in gene silencing by miRNA(GO:0035279) mRNA cleavage involved in gene silencing(GO:0098795) |
| 1.2 | 2.4 | GO:0002277 | myeloid dendritic cell activation involved in immune response(GO:0002277) |
| 1.2 | 4.8 | GO:0032261 | purine nucleotide salvage(GO:0032261) IMP salvage(GO:0032264) |
| 1.2 | 3.6 | GO:0035526 | retrograde transport, plasma membrane to Golgi(GO:0035526) |
| 1.2 | 7.2 | GO:0046874 | quinolinate metabolic process(GO:0046874) |
| 1.2 | 2.4 | GO:0006547 | histidine metabolic process(GO:0006547) |
| 1.2 | 23.6 | GO:0000305 | response to oxygen radical(GO:0000305) |
| 1.2 | 5.9 | GO:0060330 | regulation of response to interferon-gamma(GO:0060330) |
| 1.2 | 4.7 | GO:0042780 | tRNA 3'-end processing(GO:0042780) |
| 1.2 | 3.5 | GO:0001732 | formation of cytoplasmic translation initiation complex(GO:0001732) |
| 1.2 | 9.4 | GO:0034379 | very-low-density lipoprotein particle assembly(GO:0034379) |
| 1.2 | 2.3 | GO:2000670 | dendritic cell apoptotic process(GO:0097048) regulation of dendritic cell apoptotic process(GO:2000668) positive regulation of dendritic cell apoptotic process(GO:2000670) |
| 1.2 | 3.5 | GO:0035553 | oxidative RNA demethylation(GO:0035513) oxidative single-stranded RNA demethylation(GO:0035553) |
| 1.2 | 3.5 | GO:0032066 | nucleolus to nucleoplasm transport(GO:0032066) |
| 1.2 | 2.3 | GO:0070682 | proteasome regulatory particle assembly(GO:0070682) |
| 1.2 | 2.3 | GO:0007220 | Notch receptor processing(GO:0007220) |
| 1.2 | 2.3 | GO:0006701 | progesterone biosynthetic process(GO:0006701) |
| 1.1 | 2.3 | GO:0044027 | hypermethylation of CpG island(GO:0044027) |
| 1.1 | 5.7 | GO:0044539 | long-chain fatty acid import(GO:0044539) |
| 1.1 | 2.3 | GO:0030167 | proteoglycan catabolic process(GO:0030167) |
| 1.1 | 9.2 | GO:0048194 | Golgi vesicle budding(GO:0048194) |
| 1.1 | 8.0 | GO:2000643 | positive regulation of early endosome to late endosome transport(GO:2000643) |
| 1.1 | 3.4 | GO:0018065 | protein-cofactor linkage(GO:0018065) |
| 1.1 | 1.1 | GO:0042524 | negative regulation of tyrosine phosphorylation of Stat5 protein(GO:0042524) |
| 1.1 | 3.4 | GO:1902990 | mitotic telomere maintenance via semi-conservative replication(GO:1902990) |
| 1.1 | 4.6 | GO:0044314 | protein K27-linked ubiquitination(GO:0044314) |
| 1.1 | 4.6 | GO:0048023 | positive regulation of melanin biosynthetic process(GO:0048023) positive regulation of secondary metabolite biosynthetic process(GO:1900378) |
| 1.1 | 3.4 | GO:0008228 | opsonization(GO:0008228) |
| 1.1 | 4.5 | GO:0010510 | regulation of acetyl-CoA biosynthetic process from pyruvate(GO:0010510) |
| 1.1 | 2.2 | GO:1990705 | cholangiocyte proliferation(GO:1990705) |
| 1.1 | 4.5 | GO:0050882 | voluntary musculoskeletal movement(GO:0050882) |
| 1.1 | 13.4 | GO:0040015 | negative regulation of multicellular organism growth(GO:0040015) |
| 1.1 | 2.2 | GO:0071336 | regulation of hair follicle cell proliferation(GO:0071336) |
| 1.1 | 2.2 | GO:0071314 | cellular response to cocaine(GO:0071314) |
| 1.1 | 3.3 | GO:0009256 | 10-formyltetrahydrofolate metabolic process(GO:0009256) |
| 1.1 | 2.2 | GO:0051088 | PMA-inducible membrane protein ectodomain proteolysis(GO:0051088) |
| 1.1 | 10.9 | GO:0000052 | citrulline metabolic process(GO:0000052) |
| 1.1 | 10.9 | GO:0001731 | formation of translation preinitiation complex(GO:0001731) |
| 1.1 | 3.3 | GO:0045629 | negative regulation of T-helper 2 cell differentiation(GO:0045629) |
| 1.1 | 1.1 | GO:0045404 | positive regulation of interleukin-4 biosynthetic process(GO:0045404) |
| 1.1 | 5.4 | GO:0030575 | nuclear body organization(GO:0030575) |
| 1.1 | 6.5 | GO:0033601 | positive regulation of mammary gland epithelial cell proliferation(GO:0033601) |
| 1.1 | 9.7 | GO:0060213 | regulation of nuclear-transcribed mRNA poly(A) tail shortening(GO:0060211) positive regulation of nuclear-transcribed mRNA poly(A) tail shortening(GO:0060213) |
| 1.1 | 3.2 | GO:1903912 | negative regulation of endoplasmic reticulum stress-induced eIF2 alpha phosphorylation(GO:1903912) |
| 1.1 | 3.2 | GO:1901162 | serotonin biosynthetic process(GO:0042427) primary amino compound biosynthetic process(GO:1901162) |
| 1.1 | 3.2 | GO:0060352 | cell adhesion molecule production(GO:0060352) |
| 1.1 | 1.1 | GO:0046501 | protoporphyrinogen IX metabolic process(GO:0046501) |
| 1.1 | 3.2 | GO:1901492 | positive regulation of lymphangiogenesis(GO:1901492) |
| 1.1 | 2.1 | GO:0051902 | negative regulation of mitochondrial depolarization(GO:0051902) negative regulation of membrane depolarization(GO:1904180) |
| 1.1 | 5.3 | GO:0010626 | negative regulation of Schwann cell proliferation(GO:0010626) |
| 1.1 | 2.1 | GO:0035928 | rRNA import into mitochondrion(GO:0035928) |
| 1.1 | 2.1 | GO:1901421 | positive regulation of response to alcohol(GO:1901421) |
| 1.1 | 4.2 | GO:0015838 | amino-acid betaine transport(GO:0015838) |
| 1.0 | 4.2 | GO:1903553 | positive regulation of extracellular exosome assembly(GO:1903553) |
| 1.0 | 9.4 | GO:0035855 | megakaryocyte development(GO:0035855) |
| 1.0 | 4.2 | GO:0043353 | enucleate erythrocyte differentiation(GO:0043353) |
| 1.0 | 4.2 | GO:0001920 | negative regulation of receptor recycling(GO:0001920) |
| 1.0 | 2.1 | GO:0044857 | plasma membrane raft assembly(GO:0044854) plasma membrane raft organization(GO:0044857) caveola assembly(GO:0070836) |
| 1.0 | 2.1 | GO:2000586 | regulation of platelet-derived growth factor receptor-beta signaling pathway(GO:2000586) negative regulation of platelet-derived growth factor receptor-beta signaling pathway(GO:2000587) |
| 1.0 | 7.3 | GO:1900262 | regulation of DNA-directed DNA polymerase activity(GO:1900262) positive regulation of DNA-directed DNA polymerase activity(GO:1900264) |
| 1.0 | 5.2 | GO:0015825 | L-serine transport(GO:0015825) |
| 1.0 | 7.3 | GO:2001256 | regulation of store-operated calcium entry(GO:2001256) |
| 1.0 | 3.1 | GO:0006114 | glycerol biosynthetic process(GO:0006114) |
| 1.0 | 2.1 | GO:0002309 | T cell proliferation involved in immune response(GO:0002309) |
| 1.0 | 19.6 | GO:2000272 | negative regulation of receptor activity(GO:2000272) |
| 1.0 | 1.0 | GO:0010887 | negative regulation of cholesterol storage(GO:0010887) |
| 1.0 | 8.2 | GO:0034063 | stress granule assembly(GO:0034063) |
| 1.0 | 4.1 | GO:0008594 | photoreceptor cell morphogenesis(GO:0008594) |
| 1.0 | 1.0 | GO:0036444 | calcium ion transmembrane import into mitochondrion(GO:0036444) |
| 1.0 | 5.1 | GO:0010815 | bradykinin catabolic process(GO:0010815) |
| 1.0 | 5.1 | GO:1902459 | positive regulation of stem cell population maintenance(GO:1902459) |
| 1.0 | 3.0 | GO:0018076 | N-terminal peptidyl-lysine acetylation(GO:0018076) |
| 1.0 | 3.0 | GO:0003062 | regulation of heart rate by chemical signal(GO:0003062) |
| 1.0 | 3.0 | GO:0033499 | galactose catabolic process via UDP-galactose(GO:0033499) glycolytic process from galactose(GO:0061623) |
| 1.0 | 3.0 | GO:1901509 | regulation of endothelial tube morphogenesis(GO:1901509) |
| 1.0 | 3.0 | GO:0045541 | negative regulation of cholesterol biosynthetic process(GO:0045541) negative regulation of cholesterol metabolic process(GO:0090206) |
| 1.0 | 4.0 | GO:0071494 | cellular response to UV-C(GO:0071494) |
| 1.0 | 2.0 | GO:0046149 | heme catabolic process(GO:0042167) pigment catabolic process(GO:0046149) |
| 1.0 | 7.9 | GO:0043983 | histone H4-K12 acetylation(GO:0043983) |
| 1.0 | 5.9 | GO:0035745 | T-helper 2 cell cytokine production(GO:0035745) |
| 1.0 | 6.9 | GO:0034058 | endosomal vesicle fusion(GO:0034058) |
| 1.0 | 3.0 | GO:2000169 | regulation of peptidyl-cysteine S-nitrosylation(GO:2000169) |
| 1.0 | 3.0 | GO:1904354 | negative regulation of telomere capping(GO:1904354) |
| 1.0 | 3.9 | GO:0051987 | positive regulation of attachment of spindle microtubules to kinetochore(GO:0051987) |
| 1.0 | 6.9 | GO:0097284 | hepatocyte apoptotic process(GO:0097284) |
| 1.0 | 5.9 | GO:0000185 | activation of MAPKKK activity(GO:0000185) |
| 1.0 | 1.0 | GO:0035992 | tendon cell differentiation(GO:0035990) tendon formation(GO:0035992) |
| 1.0 | 6.8 | GO:1902033 | regulation of hematopoietic stem cell proliferation(GO:1902033) |
| 1.0 | 2.9 | GO:2000562 | negative regulation of CD4-positive, alpha-beta T cell proliferation(GO:2000562) |
| 1.0 | 1.0 | GO:0006975 | DNA damage induced protein phosphorylation(GO:0006975) |
| 1.0 | 1.0 | GO:0090258 | negative regulation of mitochondrial fission(GO:0090258) |
| 1.0 | 2.9 | GO:0045218 | zonula adherens maintenance(GO:0045218) |
| 1.0 | 2.9 | GO:0044351 | macropinocytosis(GO:0044351) |
| 1.0 | 2.9 | GO:0001555 | oocyte growth(GO:0001555) |
| 1.0 | 3.8 | GO:0060050 | positive regulation of protein glycosylation(GO:0060050) |
| 1.0 | 3.8 | GO:0030091 | protein repair(GO:0030091) |
| 1.0 | 1.9 | GO:0032290 | peripheral nervous system myelin formation(GO:0032290) |
| 1.0 | 2.9 | GO:0060762 | regulation of branching involved in mammary gland duct morphogenesis(GO:0060762) |
| 1.0 | 1.9 | GO:0034145 | positive regulation of toll-like receptor 4 signaling pathway(GO:0034145) |
| 1.0 | 4.8 | GO:1902916 | positive regulation of protein polyubiquitination(GO:1902916) |
| 1.0 | 7.6 | GO:0051561 | positive regulation of mitochondrial calcium ion concentration(GO:0051561) |
| 1.0 | 2.9 | GO:2000042 | negative regulation of double-strand break repair via homologous recombination(GO:2000042) |
| 0.9 | 3.8 | GO:2000189 | positive regulation of cholesterol homeostasis(GO:2000189) |
| 0.9 | 0.9 | GO:0002176 | male germ cell proliferation(GO:0002176) |
| 0.9 | 0.9 | GO:0035459 | cargo loading into vesicle(GO:0035459) cargo loading into COPII-coated vesicle(GO:0090110) |
| 0.9 | 1.9 | GO:0032966 | negative regulation of collagen metabolic process(GO:0010713) negative regulation of collagen biosynthetic process(GO:0032966) |
| 0.9 | 1.9 | GO:0006680 | glucosylceramide catabolic process(GO:0006680) |
| 0.9 | 5.7 | GO:0048096 | chromatin-mediated maintenance of transcription(GO:0048096) |
| 0.9 | 1.9 | GO:2000483 | negative regulation of interleukin-8 secretion(GO:2000483) |
| 0.9 | 7.5 | GO:0090266 | regulation of mitotic cell cycle spindle assembly checkpoint(GO:0090266) regulation of mitotic spindle checkpoint(GO:1903504) |
| 0.9 | 0.9 | GO:0002434 | immune complex clearance(GO:0002434) |
| 0.9 | 2.8 | GO:0051547 | regulation of keratinocyte migration(GO:0051547) positive regulation of keratinocyte migration(GO:0051549) |
| 0.9 | 4.6 | GO:0000972 | transcription-dependent tethering of RNA polymerase II gene DNA at nuclear periphery(GO:0000972) |
| 0.9 | 8.3 | GO:0045948 | positive regulation of translational initiation(GO:0045948) |
| 0.9 | 2.8 | GO:0060414 | aorta smooth muscle tissue morphogenesis(GO:0060414) |
| 0.9 | 4.6 | GO:0097421 | liver regeneration(GO:0097421) |
| 0.9 | 2.8 | GO:0015889 | cobalamin transport(GO:0015889) |
| 0.9 | 1.8 | GO:0043553 | negative regulation of phosphatidylinositol 3-kinase activity(GO:0043553) |
| 0.9 | 3.6 | GO:2000015 | regulation of determination of dorsal identity(GO:2000015) |
| 0.9 | 9.1 | GO:0046855 | inositol phosphate dephosphorylation(GO:0046855) |
| 0.9 | 6.4 | GO:0006689 | ganglioside catabolic process(GO:0006689) |
| 0.9 | 3.6 | GO:0070102 | interleukin-6-mediated signaling pathway(GO:0070102) |
| 0.9 | 0.9 | GO:0045091 | regulation of single stranded viral RNA replication via double stranded DNA intermediate(GO:0045091) |
| 0.9 | 1.8 | GO:0045347 | negative regulation of MHC class II biosynthetic process(GO:0045347) |
| 0.9 | 9.9 | GO:0032801 | receptor catabolic process(GO:0032801) |
| 0.9 | 16.3 | GO:0071539 | protein localization to centrosome(GO:0071539) |
| 0.9 | 37.9 | GO:0007566 | embryo implantation(GO:0007566) |
| 0.9 | 2.7 | GO:0035441 | cell migration involved in vasculogenesis(GO:0035441) |
| 0.9 | 3.6 | GO:0015671 | oxygen transport(GO:0015671) |
| 0.9 | 10.7 | GO:0051601 | exocyst localization(GO:0051601) |
| 0.9 | 1.8 | GO:0036016 | response to interleukin-3(GO:0036015) cellular response to interleukin-3(GO:0036016) |
| 0.9 | 8.0 | GO:0046007 | negative regulation of activated T cell proliferation(GO:0046007) |
| 0.9 | 3.5 | GO:0003241 | growth involved in heart morphogenesis(GO:0003241) |
| 0.9 | 1.8 | GO:0045341 | MHC class I biosynthetic process(GO:0045341) regulation of MHC class I biosynthetic process(GO:0045343) positive regulation of MHC class I biosynthetic process(GO:0045345) |
| 0.9 | 2.7 | GO:0030811 | regulation of nucleotide catabolic process(GO:0030811) |
| 0.9 | 2.6 | GO:0032485 | Ral protein signal transduction(GO:0032484) regulation of Ral protein signal transduction(GO:0032485) |
| 0.9 | 26.4 | GO:0007091 | metaphase/anaphase transition of mitotic cell cycle(GO:0007091) metaphase/anaphase transition of cell cycle(GO:0044784) |
| 0.9 | 3.5 | GO:0051031 | tRNA transport(GO:0051031) |
| 0.9 | 5.3 | GO:0032534 | regulation of microvillus assembly(GO:0032534) |
| 0.9 | 2.6 | GO:0046490 | isopentenyl diphosphate biosynthetic process(GO:0009240) isopentenyl diphosphate biosynthetic process, mevalonate pathway(GO:0019287) isopentenyl diphosphate metabolic process(GO:0046490) |
| 0.9 | 2.6 | GO:0001543 | ovarian follicle rupture(GO:0001543) |
| 0.9 | 5.2 | GO:0016266 | O-glycan processing(GO:0016266) |
| 0.9 | 17.5 | GO:0006779 | porphyrin-containing compound biosynthetic process(GO:0006779) tetrapyrrole biosynthetic process(GO:0033014) |
| 0.9 | 2.6 | GO:0006543 | glutamine catabolic process(GO:0006543) |
| 0.9 | 3.5 | GO:0030214 | hyaluronan catabolic process(GO:0030214) |
| 0.9 | 2.6 | GO:1903961 | positive regulation of anion transmembrane transport(GO:1903961) |
| 0.9 | 13.9 | GO:0090200 | positive regulation of release of cytochrome c from mitochondria(GO:0090200) |
| 0.9 | 0.9 | GO:0039703 | viral RNA genome replication(GO:0039694) RNA replication(GO:0039703) |
| 0.9 | 6.1 | GO:0046643 | regulation of gamma-delta T cell differentiation(GO:0045586) regulation of gamma-delta T cell activation(GO:0046643) |
| 0.9 | 6.9 | GO:0032366 | intracellular sterol transport(GO:0032366) |
| 0.9 | 6.9 | GO:0045839 | negative regulation of mitotic nuclear division(GO:0045839) |
| 0.9 | 0.9 | GO:0072367 | regulation of lipid transport by regulation of transcription from RNA polymerase II promoter(GO:0072367) |
| 0.9 | 0.9 | GO:0001992 | regulation of systemic arterial blood pressure by vasopressin(GO:0001992) |
| 0.9 | 6.9 | GO:0042730 | fibrinolysis(GO:0042730) |
| 0.9 | 2.6 | GO:0048102 | autophagic cell death(GO:0048102) |
| 0.9 | 5.1 | GO:0034116 | positive regulation of heterotypic cell-cell adhesion(GO:0034116) |
| 0.9 | 5.1 | GO:0035814 | negative regulation of renal sodium excretion(GO:0035814) |
| 0.9 | 0.9 | GO:0061622 | glycolytic process through glucose-1-phosphate(GO:0061622) |
| 0.8 | 1.7 | GO:0098902 | regulation of membrane depolarization during action potential(GO:0098902) |
| 0.8 | 3.4 | GO:0071557 | histone H3-K27 demethylation(GO:0071557) |
| 0.8 | 3.4 | GO:0031584 | activation of phospholipase D activity(GO:0031584) |
| 0.8 | 0.8 | GO:0090230 | regulation of centromere complex assembly(GO:0090230) |
| 0.8 | 0.8 | GO:1900102 | negative regulation of endoplasmic reticulum unfolded protein response(GO:1900102) |
| 0.8 | 2.5 | GO:0043652 | engulfment of apoptotic cell(GO:0043652) |
| 0.8 | 1.7 | GO:0090335 | regulation of brown fat cell differentiation(GO:0090335) |
| 0.8 | 23.5 | GO:0033003 | regulation of mast cell activation(GO:0033003) |
| 0.8 | 3.3 | GO:0032876 | negative regulation of DNA endoreduplication(GO:0032876) |
| 0.8 | 8.3 | GO:0043518 | negative regulation of DNA damage response, signal transduction by p53 class mediator(GO:0043518) |
| 0.8 | 1.7 | GO:0045636 | positive regulation of melanocyte differentiation(GO:0045636) |
| 0.8 | 4.1 | GO:0043619 | regulation of transcription from RNA polymerase II promoter in response to oxidative stress(GO:0043619) |
| 0.8 | 0.8 | GO:0007182 | common-partner SMAD protein phosphorylation(GO:0007182) |
| 0.8 | 1.6 | GO:0039536 | negative regulation of RIG-I signaling pathway(GO:0039536) |
| 0.8 | 2.5 | GO:0071635 | negative regulation of transforming growth factor beta production(GO:0071635) |
| 0.8 | 2.5 | GO:0032483 | regulation of Rab protein signal transduction(GO:0032483) |
| 0.8 | 1.6 | GO:0006678 | glucosylceramide metabolic process(GO:0006678) |
| 0.8 | 4.1 | GO:0070072 | vacuolar proton-transporting V-type ATPase complex assembly(GO:0070072) |
| 0.8 | 0.8 | GO:0032727 | positive regulation of interferon-alpha production(GO:0032727) |
| 0.8 | 2.4 | GO:0071447 | cellular response to hydroperoxide(GO:0071447) |
| 0.8 | 0.8 | GO:0034137 | positive regulation of toll-like receptor 2 signaling pathway(GO:0034137) |
| 0.8 | 5.7 | GO:0071364 | cellular response to epidermal growth factor stimulus(GO:0071364) |
| 0.8 | 0.8 | GO:1903376 | neuron intrinsic apoptotic signaling pathway in response to oxidative stress(GO:0036480) regulation of oxidative stress-induced neuron intrinsic apoptotic signaling pathway(GO:1903376) |
| 0.8 | 0.8 | GO:0002192 | IRES-dependent translational initiation(GO:0002192) |
| 0.8 | 3.2 | GO:0033211 | adiponectin-activated signaling pathway(GO:0033211) |
| 0.8 | 2.4 | GO:0006662 | glycerol ether metabolic process(GO:0006662) |
| 0.8 | 4.0 | GO:0070544 | histone H3-K36 demethylation(GO:0070544) |
| 0.8 | 1.6 | GO:0038089 | positive regulation of cell migration by vascular endothelial growth factor signaling pathway(GO:0038089) |
| 0.8 | 4.8 | GO:1990845 | diet induced thermogenesis(GO:0002024) adaptive thermogenesis(GO:1990845) |
| 0.8 | 3.2 | GO:0015697 | quaternary ammonium group transport(GO:0015697) |
| 0.8 | 6.4 | GO:0035090 | maintenance of apical/basal cell polarity(GO:0035090) |
| 0.8 | 27.5 | GO:0055092 | cholesterol homeostasis(GO:0042632) sterol homeostasis(GO:0055092) |
| 0.8 | 2.4 | GO:0046487 | glyoxylate metabolic process(GO:0046487) |
| 0.8 | 2.4 | GO:0018343 | protein farnesylation(GO:0018343) |
| 0.8 | 1.6 | GO:0097167 | circadian regulation of translation(GO:0097167) |
| 0.8 | 3.9 | GO:0031053 | primary miRNA processing(GO:0031053) |
| 0.8 | 13.3 | GO:0042403 | thyroid hormone metabolic process(GO:0042403) |
| 0.8 | 1.6 | GO:0060318 | definitive erythrocyte differentiation(GO:0060318) |
| 0.8 | 2.3 | GO:0042701 | progesterone secretion(GO:0042701) |
| 0.8 | 3.1 | GO:0015722 | canalicular bile acid transport(GO:0015722) |
| 0.8 | 1.6 | GO:0031284 | positive regulation of guanylate cyclase activity(GO:0031284) |
| 0.8 | 30.3 | GO:0097194 | execution phase of apoptosis(GO:0097194) |
| 0.8 | 3.9 | GO:0033132 | negative regulation of glucokinase activity(GO:0033132) negative regulation of hexokinase activity(GO:1903300) |
| 0.8 | 6.2 | GO:0032486 | Rap protein signal transduction(GO:0032486) |
| 0.8 | 4.6 | GO:0045908 | negative regulation of vasodilation(GO:0045908) |
| 0.8 | 1.5 | GO:0034242 | negative regulation of syncytium formation by plasma membrane fusion(GO:0034242) |
| 0.8 | 1.5 | GO:0070863 | positive regulation of protein exit from endoplasmic reticulum(GO:0070863) |
| 0.8 | 1.5 | GO:2001180 | negative regulation of interleukin-10 secretion(GO:2001180) |
| 0.8 | 2.3 | GO:0015760 | hexose phosphate transport(GO:0015712) glucose-6-phosphate transport(GO:0015760) |
| 0.8 | 3.0 | GO:0006646 | phosphatidylethanolamine biosynthetic process(GO:0006646) |
| 0.8 | 6.8 | GO:0006388 | tRNA splicing, via endonucleolytic cleavage and ligation(GO:0006388) |
| 0.8 | 10.6 | GO:0007250 | activation of NF-kappaB-inducing kinase activity(GO:0007250) |
| 0.8 | 1.5 | GO:0001787 | natural killer cell proliferation(GO:0001787) |
| 0.8 | 1.5 | GO:2000378 | negative regulation of reactive oxygen species metabolic process(GO:2000378) |
| 0.8 | 0.8 | GO:0035887 | aortic smooth muscle cell differentiation(GO:0035887) |
| 0.8 | 1.5 | GO:0009051 | pentose-phosphate shunt, oxidative branch(GO:0009051) |
| 0.7 | 0.7 | GO:0006551 | leucine metabolic process(GO:0006551) |
| 0.7 | 1.5 | GO:0032349 | positive regulation of aldosterone metabolic process(GO:0032346) positive regulation of aldosterone biosynthetic process(GO:0032349) |
| 0.7 | 0.7 | GO:0033686 | positive regulation of luteinizing hormone secretion(GO:0033686) |
| 0.7 | 5.2 | GO:0030644 | cellular chloride ion homeostasis(GO:0030644) |
| 0.7 | 1.5 | GO:0030951 | establishment or maintenance of microtubule cytoskeleton polarity(GO:0030951) |
| 0.7 | 14.8 | GO:0019884 | antigen processing and presentation of exogenous antigen(GO:0019884) |
| 0.7 | 2.2 | GO:0061635 | regulation of protein complex stability(GO:0061635) |
| 0.7 | 3.7 | GO:0086073 | bundle of His cell-Purkinje myocyte adhesion involved in cell communication(GO:0086073) |
| 0.7 | 4.4 | GO:0071378 | growth hormone receptor signaling pathway(GO:0060396) cellular response to growth hormone stimulus(GO:0071378) |
| 0.7 | 0.7 | GO:0048850 | hypophysis morphogenesis(GO:0048850) |
| 0.7 | 1.5 | GO:0042511 | positive regulation of tyrosine phosphorylation of Stat1 protein(GO:0042511) |
| 0.7 | 0.7 | GO:0048769 | sarcomerogenesis(GO:0048769) |
| 0.7 | 2.2 | GO:2000504 | positive regulation of blood vessel remodeling(GO:2000504) |
| 0.7 | 5.8 | GO:0071361 | cellular response to ethanol(GO:0071361) |
| 0.7 | 1.5 | GO:0070268 | cornification(GO:0070268) |
| 0.7 | 1.5 | GO:0033262 | regulation of nuclear cell cycle DNA replication(GO:0033262) |
| 0.7 | 0.7 | GO:0051106 | regulation of DNA ligation(GO:0051105) positive regulation of DNA ligation(GO:0051106) |
| 0.7 | 1.5 | GO:0015886 | heme transport(GO:0015886) |
| 0.7 | 2.2 | GO:0070317 | negative regulation of G0 to G1 transition(GO:0070317) |
| 0.7 | 4.3 | GO:0043486 | histone exchange(GO:0043486) |
| 0.7 | 1.4 | GO:0007256 | activation of JNKK activity(GO:0007256) |
| 0.7 | 1.4 | GO:0034392 | negative regulation of smooth muscle cell apoptotic process(GO:0034392) |
| 0.7 | 2.9 | GO:0071763 | nuclear membrane organization(GO:0071763) |
| 0.7 | 3.6 | GO:0046135 | pyrimidine ribonucleoside catabolic process(GO:0046133) pyrimidine nucleoside catabolic process(GO:0046135) |
| 0.7 | 12.9 | GO:0030330 | DNA damage response, signal transduction by p53 class mediator(GO:0030330) |
| 0.7 | 2.1 | GO:0010587 | miRNA catabolic process(GO:0010587) |
| 0.7 | 2.1 | GO:2000271 | positive regulation of fibroblast apoptotic process(GO:2000271) |
| 0.7 | 1.4 | GO:1903121 | regulation of TRAIL-activated apoptotic signaling pathway(GO:1903121) |
| 0.7 | 0.7 | GO:1901857 | positive regulation of cellular respiration(GO:1901857) |
| 0.7 | 2.1 | GO:0044375 | regulation of peroxisome size(GO:0044375) |
| 0.7 | 2.8 | GO:0036233 | glycine import(GO:0036233) |
| 0.7 | 4.9 | GO:0021684 | cerebellar granular layer formation(GO:0021684) cerebellar granule cell differentiation(GO:0021707) |
| 0.7 | 2.1 | GO:0006362 | transcription elongation from RNA polymerase I promoter(GO:0006362) |
| 0.7 | 2.8 | GO:0071285 | cellular response to lithium ion(GO:0071285) |
| 0.7 | 1.4 | GO:1902166 | negative regulation of intrinsic apoptotic signaling pathway in response to DNA damage by p53 class mediator(GO:1902166) |
| 0.7 | 0.7 | GO:0090219 | negative regulation of lipid kinase activity(GO:0090219) |
| 0.7 | 4.1 | GO:0010818 | T cell chemotaxis(GO:0010818) |
| 0.7 | 6.9 | GO:0046130 | purine nucleoside catabolic process(GO:0006152) purine ribonucleoside catabolic process(GO:0046130) |
| 0.7 | 1.4 | GO:0071462 | cellular response to water stimulus(GO:0071462) |
| 0.7 | 2.7 | GO:2000210 | positive regulation of anoikis(GO:2000210) |
| 0.7 | 1.4 | GO:0033091 | positive regulation of immature T cell proliferation(GO:0033091) positive regulation of immature T cell proliferation in thymus(GO:0033092) |
| 0.7 | 8.2 | GO:0060712 | spongiotrophoblast layer development(GO:0060712) |
| 0.7 | 5.5 | GO:0006013 | mannose metabolic process(GO:0006013) |
| 0.7 | 4.1 | GO:0031441 | negative regulation of mRNA 3'-end processing(GO:0031441) |
| 0.7 | 2.0 | GO:0034035 | purine ribonucleoside bisphosphate metabolic process(GO:0034035) |
| 0.7 | 2.7 | GO:0016139 | glycoside catabolic process(GO:0016139) |
| 0.7 | 4.0 | GO:0031119 | tRNA pseudouridine synthesis(GO:0031119) |
| 0.7 | 2.0 | GO:0050667 | homocysteine metabolic process(GO:0050667) |
| 0.7 | 4.7 | GO:0031507 | heterochromatin assembly(GO:0031507) |
| 0.7 | 2.7 | GO:1900454 | positive regulation of long term synaptic depression(GO:1900454) |
| 0.7 | 2.0 | GO:1904424 | regulation of GTP binding(GO:1904424) |
| 0.7 | 1.3 | GO:0033030 | negative regulation of neutrophil apoptotic process(GO:0033030) |
| 0.7 | 11.4 | GO:0010390 | histone monoubiquitination(GO:0010390) |
| 0.7 | 2.7 | GO:0035509 | negative regulation of myosin-light-chain-phosphatase activity(GO:0035509) |
| 0.7 | 6.7 | GO:0000188 | inactivation of MAPK activity(GO:0000188) |
| 0.7 | 5.3 | GO:0061014 | positive regulation of mRNA catabolic process(GO:0061014) |
| 0.7 | 3.3 | GO:0010452 | histone H3-K36 methylation(GO:0010452) |
| 0.7 | 0.7 | GO:0035630 | bone mineralization involved in bone maturation(GO:0035630) |
| 0.7 | 4.6 | GO:0036003 | positive regulation of transcription from RNA polymerase II promoter in response to stress(GO:0036003) |
| 0.7 | 0.7 | GO:0061325 | cell proliferation involved in outflow tract morphogenesis(GO:0061325) |
| 0.7 | 5.3 | GO:0006610 | ribosomal protein import into nucleus(GO:0006610) |
| 0.7 | 7.3 | GO:0071425 | hematopoietic stem cell proliferation(GO:0071425) |
| 0.7 | 2.0 | GO:1904694 | negative regulation of vascular smooth muscle contraction(GO:1904694) |
| 0.7 | 2.0 | GO:1901525 | negative regulation of macromitophagy(GO:1901525) |
| 0.7 | 1.3 | GO:0019482 | beta-alanine metabolic process(GO:0019482) |
| 0.7 | 2.6 | GO:0061158 | 3'-UTR-mediated mRNA destabilization(GO:0061158) |
| 0.7 | 2.6 | GO:1900047 | negative regulation of blood coagulation(GO:0030195) negative regulation of hemostasis(GO:1900047) |
| 0.7 | 2.0 | GO:0007525 | somatic muscle development(GO:0007525) |
| 0.7 | 1.3 | GO:0044004 | killing by symbiont of host cells(GO:0001907) disruption by symbiont of host cell(GO:0044004) |
| 0.7 | 5.9 | GO:0006895 | Golgi to endosome transport(GO:0006895) |
| 0.7 | 1.3 | GO:1904738 | vascular associated smooth muscle cell migration(GO:1904738) regulation of vascular associated smooth muscle cell migration(GO:1904752) |
| 0.7 | 0.7 | GO:0034454 | microtubule anchoring at centrosome(GO:0034454) |
| 0.6 | 1.3 | GO:0001915 | negative regulation of T cell mediated cytotoxicity(GO:0001915) |
| 0.6 | 16.7 | GO:0018196 | peptidyl-asparagine modification(GO:0018196) |
| 0.6 | 2.6 | GO:2000726 | negative regulation of cardiac muscle cell differentiation(GO:2000726) |
| 0.6 | 3.2 | GO:0006370 | 7-methylguanosine mRNA capping(GO:0006370) |
| 0.6 | 1.9 | GO:0044829 | positive regulation by host of viral genome replication(GO:0044829) |
| 0.6 | 1.3 | GO:0032482 | Rab protein signal transduction(GO:0032482) |
| 0.6 | 3.8 | GO:0030953 | astral microtubule organization(GO:0030953) |
| 0.6 | 2.5 | GO:0097211 | response to gonadotropin-releasing hormone(GO:0097210) cellular response to gonadotropin-releasing hormone(GO:0097211) |
| 0.6 | 1.9 | GO:0032286 | central nervous system myelin maintenance(GO:0032286) |
| 0.6 | 2.5 | GO:0018119 | peptidyl-cysteine S-nitrosylation(GO:0018119) |
| 0.6 | 3.8 | GO:0021702 | cerebellar Purkinje cell differentiation(GO:0021702) |
| 0.6 | 24.7 | GO:0006749 | glutathione metabolic process(GO:0006749) |
| 0.6 | 6.3 | GO:0043407 | negative regulation of MAP kinase activity(GO:0043407) |
| 0.6 | 0.6 | GO:0051138 | regulation of NK T cell differentiation(GO:0051136) positive regulation of NK T cell differentiation(GO:0051138) |
| 0.6 | 0.6 | GO:0010159 | specification of organ position(GO:0010159) |
| 0.6 | 4.4 | GO:0046697 | decidualization(GO:0046697) |
| 0.6 | 1.9 | GO:0031118 | rRNA pseudouridine synthesis(GO:0031118) |
| 0.6 | 3.1 | GO:0043456 | regulation of pentose-phosphate shunt(GO:0043456) |
| 0.6 | 0.6 | GO:0042525 | tyrosine phosphorylation of Stat6 protein(GO:0042505) regulation of tyrosine phosphorylation of Stat6 protein(GO:0042525) |
| 0.6 | 3.1 | GO:0010759 | positive regulation of macrophage chemotaxis(GO:0010759) |
| 0.6 | 0.6 | GO:0002159 | desmosome assembly(GO:0002159) |
| 0.6 | 18.0 | GO:0000387 | spliceosomal snRNP assembly(GO:0000387) |
| 0.6 | 5.0 | GO:0018206 | peptidyl-methionine modification(GO:0018206) |
| 0.6 | 6.2 | GO:0032438 | melanosome organization(GO:0032438) |
| 0.6 | 11.8 | GO:0000060 | protein import into nucleus, translocation(GO:0000060) |
| 0.6 | 6.2 | GO:0001833 | inner cell mass cell proliferation(GO:0001833) |
| 0.6 | 1.2 | GO:0035811 | negative regulation of urine volume(GO:0035811) |
| 0.6 | 10.5 | GO:0071108 | protein K48-linked deubiquitination(GO:0071108) |
| 0.6 | 1.8 | GO:0060613 | fat pad development(GO:0060613) |
| 0.6 | 0.6 | GO:0043951 | negative regulation of cAMP-mediated signaling(GO:0043951) |
| 0.6 | 3.1 | GO:0042738 | exogenous drug catabolic process(GO:0042738) |
| 0.6 | 20.8 | GO:1902807 | negative regulation of cell cycle G1/S phase transition(GO:1902807) |
| 0.6 | 12.8 | GO:0030261 | chromosome condensation(GO:0030261) |
| 0.6 | 4.9 | GO:0051292 | nuclear pore complex assembly(GO:0051292) |
| 0.6 | 1.2 | GO:0036023 | limb joint morphogenesis(GO:0036022) embryonic skeletal limb joint morphogenesis(GO:0036023) |
| 0.6 | 0.6 | GO:1903237 | negative regulation of leukocyte tethering or rolling(GO:1903237) |
| 0.6 | 1.2 | GO:0034729 | histone H3-K79 methylation(GO:0034729) |
| 0.6 | 0.6 | GO:0032957 | inositol trisphosphate metabolic process(GO:0032957) |
| 0.6 | 0.6 | GO:0042447 | hormone catabolic process(GO:0042447) |
| 0.6 | 2.4 | GO:0019695 | choline metabolic process(GO:0019695) |
| 0.6 | 1.8 | GO:0033632 | regulation of cell-cell adhesion mediated by integrin(GO:0033632) |
| 0.6 | 0.6 | GO:0006787 | porphyrin-containing compound catabolic process(GO:0006787) tetrapyrrole catabolic process(GO:0033015) |
| 0.6 | 2.4 | GO:0006561 | proline biosynthetic process(GO:0006561) |
| 0.6 | 0.6 | GO:0035799 | ureter maturation(GO:0035799) |
| 0.6 | 0.6 | GO:0015705 | iodide transport(GO:0015705) |
| 0.6 | 1.8 | GO:0015959 | diadenosine polyphosphate metabolic process(GO:0015959) |
| 0.6 | 3.0 | GO:0043129 | surfactant homeostasis(GO:0043129) |
| 0.6 | 1.8 | GO:0040016 | embryonic cleavage(GO:0040016) |
| 0.6 | 1.8 | GO:0038094 | Fc-gamma receptor signaling pathway(GO:0038094) |
| 0.6 | 3.6 | GO:0007035 | vacuolar acidification(GO:0007035) |
| 0.6 | 1.8 | GO:0006772 | thiamine metabolic process(GO:0006772) thiamine-containing compound metabolic process(GO:0042723) |
| 0.6 | 1.2 | GO:1903011 | negative regulation of bone development(GO:1903011) |
| 0.6 | 1.2 | GO:0018992 | germ-line sex determination(GO:0018992) |
| 0.6 | 0.6 | GO:0035404 | histone-serine phosphorylation(GO:0035404) histone H3-S28 phosphorylation(GO:0043988) |
| 0.6 | 1.8 | GO:0060825 | fibroblast growth factor receptor signaling pathway involved in neural plate anterior/posterior pattern formation(GO:0060825) regulation of fibroblast growth factor receptor signaling pathway involved in neural plate anterior/posterior pattern formation(GO:2000313) |
| 0.6 | 1.2 | GO:0002018 | renin-angiotensin regulation of aldosterone production(GO:0002018) |
| 0.6 | 0.6 | GO:0050819 | negative regulation of coagulation(GO:0050819) |
| 0.6 | 1.8 | GO:1901301 | regulation of cargo loading into COPII-coated vesicle(GO:1901301) |
| 0.6 | 3.5 | GO:0000012 | single strand break repair(GO:0000012) |
| 0.6 | 1.2 | GO:0010748 | negative regulation of plasma membrane long-chain fatty acid transport(GO:0010748) |
| 0.6 | 0.6 | GO:0001796 | type IIa hypersensitivity(GO:0001794) regulation of type IIa hypersensitivity(GO:0001796) positive regulation of type IIa hypersensitivity(GO:0001798) type II hypersensitivity(GO:0002445) regulation of type II hypersensitivity(GO:0002892) positive regulation of type II hypersensitivity(GO:0002894) |
| 0.6 | 2.3 | GO:0043031 | negative regulation of macrophage activation(GO:0043031) |
| 0.6 | 1.7 | GO:0046889 | positive regulation of lipid biosynthetic process(GO:0046889) |
| 0.6 | 0.6 | GO:0009946 | proximal/distal axis specification(GO:0009946) specification of axis polarity(GO:0065001) |
| 0.6 | 5.8 | GO:0045725 | positive regulation of glycogen biosynthetic process(GO:0045725) |
| 0.6 | 1.7 | GO:1904948 | midbrain dopaminergic neuron differentiation(GO:1904948) |
| 0.6 | 0.6 | GO:0045416 | positive regulation of interleukin-8 biosynthetic process(GO:0045416) |
| 0.6 | 1.7 | GO:0060768 | regulation of epithelial cell proliferation involved in prostate gland development(GO:0060768) |
| 0.6 | 2.3 | GO:0010225 | response to UV-C(GO:0010225) |
| 0.6 | 8.0 | GO:0070979 | protein K11-linked ubiquitination(GO:0070979) |
| 0.6 | 1.7 | GO:2000074 | regulation of type B pancreatic cell development(GO:2000074) |
| 0.6 | 1.7 | GO:0048597 | post-embryonic camera-type eye morphogenesis(GO:0048597) |
| 0.6 | 1.7 | GO:1990036 | calcium ion import into sarcoplasmic reticulum(GO:1990036) |
| 0.6 | 1.7 | GO:0043654 | recognition of apoptotic cell(GO:0043654) |
| 0.6 | 2.8 | GO:0009070 | serine family amino acid biosynthetic process(GO:0009070) |
| 0.6 | 1.1 | GO:0019676 | ammonia assimilation cycle(GO:0019676) |
| 0.6 | 1.1 | GO:0010992 | ubiquitin homeostasis(GO:0010992) |
| 0.6 | 3.4 | GO:0045618 | positive regulation of keratinocyte differentiation(GO:0045618) |
| 0.6 | 0.6 | GO:0055005 | ventricular cardiac myofibril assembly(GO:0055005) |
| 0.6 | 1.1 | GO:0007296 | vitellogenesis(GO:0007296) |
| 0.6 | 0.6 | GO:0034395 | regulation of transcription from RNA polymerase II promoter in response to iron(GO:0034395) |
| 0.6 | 1.7 | GO:0002291 | T cell activation via T cell receptor contact with antigen bound to MHC molecule on antigen presenting cell(GO:0002291) |
| 0.6 | 0.6 | GO:0008078 | mesodermal cell migration(GO:0008078) |
| 0.6 | 0.6 | GO:1902237 | positive regulation of endoplasmic reticulum stress-induced intrinsic apoptotic signaling pathway(GO:1902237) |
| 0.6 | 0.6 | GO:0043465 | regulation of fermentation(GO:0043465) regulation of NAD metabolic process(GO:1902688) regulation of glucose catabolic process to lactate via pyruvate(GO:1904023) |
| 0.6 | 1.1 | GO:0031914 | negative regulation of synaptic plasticity(GO:0031914) |
| 0.6 | 2.8 | GO:1904970 | brush border assembly(GO:1904970) |
| 0.6 | 1.7 | GO:0002913 | positive regulation of T cell tolerance induction(GO:0002666) positive regulation of T cell anergy(GO:0002669) positive regulation of lymphocyte anergy(GO:0002913) |
| 0.6 | 4.4 | GO:2001022 | positive regulation of response to DNA damage stimulus(GO:2001022) |
| 0.5 | 0.5 | GO:0031446 | regulation of fast-twitch skeletal muscle fiber contraction(GO:0031446) positive regulation of fast-twitch skeletal muscle fiber contraction(GO:0031448) |
| 0.5 | 1.6 | GO:0046040 | IMP metabolic process(GO:0046040) |
| 0.5 | 1.6 | GO:0050862 | positive regulation of T cell receptor signaling pathway(GO:0050862) |
| 0.5 | 1.6 | GO:0046726 | positive regulation by virus of viral protein levels in host cell(GO:0046726) |
| 0.5 | 1.6 | GO:0043578 | nuclear matrix organization(GO:0043578) nuclear matrix anchoring at nuclear membrane(GO:0090292) |
| 0.5 | 2.7 | GO:0045579 | positive regulation of B cell differentiation(GO:0045579) |
| 0.5 | 0.5 | GO:0031282 | regulation of guanylate cyclase activity(GO:0031282) |
| 0.5 | 0.5 | GO:0046122 | purine deoxyribonucleoside metabolic process(GO:0046122) |
| 0.5 | 2.7 | GO:0048227 | plasma membrane to endosome transport(GO:0048227) |
| 0.5 | 1.1 | GO:0010874 | regulation of cholesterol efflux(GO:0010874) |
| 0.5 | 0.5 | GO:0009136 | purine nucleoside diphosphate biosynthetic process(GO:0009136) purine ribonucleoside diphosphate biosynthetic process(GO:0009180) ribonucleoside diphosphate biosynthetic process(GO:0009188) |
| 0.5 | 3.3 | GO:0060390 | regulation of SMAD protein import into nucleus(GO:0060390) |
| 0.5 | 1.1 | GO:0090166 | Golgi disassembly(GO:0090166) |
| 0.5 | 1.1 | GO:1903774 | positive regulation of viral budding via host ESCRT complex(GO:1903774) |
| 0.5 | 1.1 | GO:0072643 | interferon-gamma secretion(GO:0072643) |
| 0.5 | 2.1 | GO:0061684 | chaperone-mediated autophagy(GO:0061684) |
| 0.5 | 2.1 | GO:0060068 | vagina development(GO:0060068) |
| 0.5 | 1.1 | GO:0031269 | pseudopodium assembly(GO:0031269) |
| 0.5 | 2.1 | GO:0097428 | protein maturation by iron-sulfur cluster transfer(GO:0097428) |
| 0.5 | 1.1 | GO:0007351 | tripartite regional subdivision(GO:0007351) anterior/posterior axis specification, embryo(GO:0008595) |
| 0.5 | 1.1 | GO:0070236 | negative regulation of activation-induced cell death of T cells(GO:0070236) |
| 0.5 | 1.6 | GO:0036066 | protein O-linked fucosylation(GO:0036066) |
| 0.5 | 0.5 | GO:1901203 | positive regulation of extracellular matrix assembly(GO:1901203) |
| 0.5 | 18.6 | GO:0045668 | negative regulation of osteoblast differentiation(GO:0045668) |
| 0.5 | 0.5 | GO:1904468 | negative regulation of tumor necrosis factor secretion(GO:1904468) |
| 0.5 | 1.6 | GO:0006987 | activation of signaling protein activity involved in unfolded protein response(GO:0006987) |
| 0.5 | 4.8 | GO:2000251 | positive regulation of actin cytoskeleton reorganization(GO:2000251) |
| 0.5 | 2.7 | GO:0045792 | negative regulation of cell size(GO:0045792) |
| 0.5 | 0.5 | GO:0003198 | epithelial to mesenchymal transition involved in endocardial cushion formation(GO:0003198) |
| 0.5 | 2.1 | GO:0070837 | dehydroascorbic acid transport(GO:0070837) |
| 0.5 | 4.2 | GO:2001241 | positive regulation of extrinsic apoptotic signaling pathway in absence of ligand(GO:2001241) |
| 0.5 | 2.1 | GO:0033623 | regulation of integrin activation(GO:0033623) |
| 0.5 | 9.5 | GO:0045047 | protein targeting to ER(GO:0045047) |
| 0.5 | 12.1 | GO:0000184 | nuclear-transcribed mRNA catabolic process, nonsense-mediated decay(GO:0000184) |
| 0.5 | 1.0 | GO:0072718 | response to cisplatin(GO:0072718) |
| 0.5 | 1.0 | GO:0060056 | mammary gland involution(GO:0060056) |
| 0.5 | 1.0 | GO:0008088 | axo-dendritic transport(GO:0008088) |
| 0.5 | 1.6 | GO:0015014 | heparan sulfate proteoglycan biosynthetic process, polysaccharide chain biosynthetic process(GO:0015014) |
| 0.5 | 6.2 | GO:0030212 | hyaluronan metabolic process(GO:0030212) |
| 0.5 | 1.0 | GO:0002254 | kinin cascade(GO:0002254) |
| 0.5 | 1.0 | GO:0051596 | methylglyoxal catabolic process to D-lactate via S-lactoyl-glutathione(GO:0019243) methylglyoxal catabolic process(GO:0051596) methylglyoxal catabolic process to lactate(GO:0061727) |
| 0.5 | 0.5 | GO:0070723 | response to cholesterol(GO:0070723) |
| 0.5 | 0.5 | GO:0010749 | regulation of nitric oxide mediated signal transduction(GO:0010749) |
| 0.5 | 5.6 | GO:0032897 | negative regulation of viral transcription(GO:0032897) |
| 0.5 | 1.5 | GO:0071357 | cellular response to type I interferon(GO:0071357) |
| 0.5 | 1.5 | GO:0033387 | putrescine biosynthetic process from ornithine(GO:0033387) |
| 0.5 | 1.5 | GO:0043137 | DNA replication, removal of RNA primer(GO:0043137) |
| 0.5 | 1.5 | GO:0032494 | response to peptidoglycan(GO:0032494) |
| 0.5 | 1.0 | GO:0061535 | glutamate secretion, neurotransmission(GO:0061535) |
| 0.5 | 1.5 | GO:0015819 | lysine transport(GO:0015819) |
| 0.5 | 2.0 | GO:0009048 | dosage compensation(GO:0007549) dosage compensation by inactivation of X chromosome(GO:0009048) |
| 0.5 | 0.5 | GO:0008626 | granzyme-mediated apoptotic signaling pathway(GO:0008626) |
| 0.5 | 2.5 | GO:0007341 | penetration of zona pellucida(GO:0007341) |
| 0.5 | 1.5 | GO:0048386 | positive regulation of retinoic acid receptor signaling pathway(GO:0048386) |
| 0.5 | 0.5 | GO:1901727 | positive regulation of histone deacetylase activity(GO:1901727) |
| 0.5 | 1.0 | GO:0010040 | response to iron(II) ion(GO:0010040) |
| 0.5 | 0.5 | GO:0090238 | positive regulation of arachidonic acid secretion(GO:0090238) |
| 0.5 | 2.0 | GO:0090209 | negative regulation of triglyceride metabolic process(GO:0090209) |
| 0.5 | 5.5 | GO:0008214 | protein demethylation(GO:0006482) protein dealkylation(GO:0008214) |
| 0.5 | 2.0 | GO:1903140 | regulation of endothelial cell development(GO:1901550) regulation of establishment of endothelial barrier(GO:1903140) |
| 0.5 | 4.0 | GO:0000290 | deadenylation-dependent decapping of nuclear-transcribed mRNA(GO:0000290) |
| 0.5 | 4.0 | GO:0097320 | membrane tubulation(GO:0097320) |
| 0.5 | 1.0 | GO:0007597 | blood coagulation, intrinsic pathway(GO:0007597) |
| 0.5 | 1.5 | GO:0010499 | proteasomal ubiquitin-independent protein catabolic process(GO:0010499) |
| 0.5 | 1.0 | GO:0032906 | transforming growth factor beta2 production(GO:0032906) regulation of transforming growth factor beta2 production(GO:0032909) |
| 0.5 | 4.4 | GO:0032793 | positive regulation of CREB transcription factor activity(GO:0032793) |
| 0.5 | 1.0 | GO:0010668 | ectodermal cell differentiation(GO:0010668) |
| 0.5 | 0.5 | GO:0003097 | renal water transport(GO:0003097) |
| 0.5 | 1.5 | GO:1900060 | negative regulation of ceramide biosynthetic process(GO:1900060) |
| 0.5 | 1.9 | GO:0002923 | regulation of humoral immune response mediated by circulating immunoglobulin(GO:0002923) |
| 0.5 | 2.9 | GO:0006384 | transcription initiation from RNA polymerase III promoter(GO:0006384) |
| 0.5 | 1.5 | GO:1905098 | negative regulation of guanyl-nucleotide exchange factor activity(GO:1905098) |
| 0.5 | 1.9 | GO:0055098 | response to low-density lipoprotein particle(GO:0055098) |
| 0.5 | 5.8 | GO:0019432 | triglyceride biosynthetic process(GO:0019432) |
| 0.5 | 1.5 | GO:0051121 | hepoxilin metabolic process(GO:0051121) hepoxilin biosynthetic process(GO:0051122) |
| 0.5 | 1.4 | GO:0006116 | NADH oxidation(GO:0006116) |
| 0.5 | 3.4 | GO:0072698 | protein localization to microtubule cytoskeleton(GO:0072698) |
| 0.5 | 2.9 | GO:0050957 | equilibrioception(GO:0050957) |
| 0.5 | 3.8 | GO:0006071 | glycerol metabolic process(GO:0006071) |
| 0.5 | 5.8 | GO:0006446 | regulation of translational initiation(GO:0006446) |
| 0.5 | 1.4 | GO:0001767 | establishment of lymphocyte polarity(GO:0001767) establishment of T cell polarity(GO:0001768) |
| 0.5 | 3.4 | GO:0048739 | cardiac muscle fiber development(GO:0048739) |
| 0.5 | 1.4 | GO:0061687 | detoxification of inorganic compound(GO:0061687) |
| 0.5 | 9.1 | GO:0051028 | mRNA transport(GO:0051028) |
| 0.5 | 2.9 | GO:0032785 | negative regulation of DNA-templated transcription, elongation(GO:0032785) negative regulation of transcription elongation from RNA polymerase II promoter(GO:0034244) |
| 0.5 | 1.0 | GO:0002326 | B cell lineage commitment(GO:0002326) |
| 0.5 | 1.4 | GO:0072599 | establishment of protein localization to endoplasmic reticulum(GO:0072599) |
| 0.5 | 3.3 | GO:0048147 | negative regulation of fibroblast proliferation(GO:0048147) |
| 0.5 | 0.9 | GO:1901563 | response to camptothecin(GO:1901563) |
| 0.5 | 0.9 | GO:0039689 | negative stranded viral RNA replication(GO:0039689) multi-organism biosynthetic process(GO:0044034) |
| 0.5 | 0.9 | GO:0048263 | determination of dorsal/ventral asymmetry(GO:0048262) determination of dorsal identity(GO:0048263) |
| 0.5 | 1.4 | GO:0003096 | renal sodium ion transport(GO:0003096) |
| 0.5 | 0.9 | GO:0034377 | plasma lipoprotein particle assembly(GO:0034377) |
| 0.5 | 0.5 | GO:2000491 | positive regulation of hepatic stellate cell activation(GO:2000491) |
| 0.5 | 5.7 | GO:0000413 | protein peptidyl-prolyl isomerization(GO:0000413) |
| 0.5 | 1.9 | GO:0044380 | protein localization to cytoskeleton(GO:0044380) |
| 0.5 | 0.5 | GO:0006522 | alanine metabolic process(GO:0006522) pyruvate family amino acid metabolic process(GO:0009078) |
| 0.5 | 1.9 | GO:0070940 | dephosphorylation of RNA polymerase II C-terminal domain(GO:0070940) |
| 0.5 | 2.8 | GO:0030277 | maintenance of gastrointestinal epithelium(GO:0030277) |
| 0.5 | 1.9 | GO:0002115 | store-operated calcium entry(GO:0002115) |
| 0.5 | 1.4 | GO:0043328 | late endosome to vacuole transport via multivesicular body sorting pathway(GO:0032511) protein targeting to vacuole involved in ubiquitin-dependent protein catabolic process via the multivesicular body sorting pathway(GO:0043328) |
| 0.5 | 3.2 | GO:0016574 | histone ubiquitination(GO:0016574) |
| 0.5 | 0.9 | GO:0010735 | positive regulation of transcription via serum response element binding(GO:0010735) |
| 0.5 | 1.4 | GO:0032227 | negative regulation of synaptic transmission, dopaminergic(GO:0032227) |
| 0.5 | 0.5 | GO:1901970 | positive regulation of mitotic sister chromatid separation(GO:1901970) |
| 0.5 | 0.5 | GO:0042737 | drug catabolic process(GO:0042737) |
| 0.5 | 1.8 | GO:0090527 | actin filament reorganization(GO:0090527) |
| 0.5 | 5.5 | GO:0045116 | protein neddylation(GO:0045116) |
| 0.5 | 1.4 | GO:0042789 | mRNA transcription from RNA polymerase II promoter(GO:0042789) |
| 0.5 | 1.8 | GO:0030311 | poly-N-acetyllactosamine metabolic process(GO:0030309) poly-N-acetyllactosamine biosynthetic process(GO:0030311) |
| 0.5 | 1.4 | GO:0006848 | pyruvate transport(GO:0006848) pyruvate transmembrane transport(GO:1901475) |
| 0.5 | 1.8 | GO:1903608 | protein localization to cytoplasmic stress granule(GO:1903608) |
| 0.5 | 0.9 | GO:0046628 | positive regulation of insulin receptor signaling pathway(GO:0046628) |
| 0.5 | 3.6 | GO:0035810 | positive regulation of urine volume(GO:0035810) |
| 0.5 | 6.3 | GO:0015693 | magnesium ion transport(GO:0015693) |
| 0.5 | 1.4 | GO:0036092 | phosphatidylinositol-3-phosphate biosynthetic process(GO:0036092) |
| 0.5 | 1.8 | GO:0010758 | regulation of macrophage chemotaxis(GO:0010758) |
| 0.5 | 0.5 | GO:0060405 | regulation of penile erection(GO:0060405) positive regulation of penile erection(GO:0060406) |
| 0.5 | 0.9 | GO:0010832 | negative regulation of myotube differentiation(GO:0010832) |
| 0.5 | 0.5 | GO:1902591 | single-organism membrane budding(GO:1902591) |
| 0.5 | 3.6 | GO:0046184 | aldehyde biosynthetic process(GO:0046184) |
| 0.4 | 1.8 | GO:0034393 | positive regulation of smooth muscle cell apoptotic process(GO:0034393) |
| 0.4 | 6.3 | GO:0038083 | peptidyl-tyrosine autophosphorylation(GO:0038083) |
| 0.4 | 0.4 | GO:0010226 | response to lithium ion(GO:0010226) |
| 0.4 | 0.4 | GO:0007161 | calcium-independent cell-matrix adhesion(GO:0007161) |
| 0.4 | 0.4 | GO:0045657 | positive regulation of monocyte differentiation(GO:0045657) |
| 0.4 | 4.5 | GO:0042074 | cell migration involved in gastrulation(GO:0042074) |
| 0.4 | 0.9 | GO:0002314 | germinal center B cell differentiation(GO:0002314) |
| 0.4 | 0.9 | GO:1904251 | regulation of bile acid metabolic process(GO:1904251) |
| 0.4 | 0.4 | GO:0010873 | positive regulation of cholesterol esterification(GO:0010873) |
| 0.4 | 1.8 | GO:0006527 | arginine catabolic process(GO:0006527) |
| 0.4 | 1.8 | GO:0009226 | nucleotide-sugar biosynthetic process(GO:0009226) |
| 0.4 | 0.9 | GO:0043116 | negative regulation of vascular permeability(GO:0043116) |
| 0.4 | 0.9 | GO:0031946 | negative regulation of glucocorticoid metabolic process(GO:0031944) regulation of glucocorticoid biosynthetic process(GO:0031946) negative regulation of glucocorticoid biosynthetic process(GO:0031947) |
| 0.4 | 2.7 | GO:0050916 | sensory perception of sweet taste(GO:0050916) |
| 0.4 | 3.1 | GO:0030502 | negative regulation of bone mineralization(GO:0030502) |
| 0.4 | 1.8 | GO:0032463 | negative regulation of protein homooligomerization(GO:0032463) |
| 0.4 | 0.9 | GO:0072592 | oxygen metabolic process(GO:0072592) |
| 0.4 | 3.5 | GO:0006123 | mitochondrial electron transport, cytochrome c to oxygen(GO:0006123) |
| 0.4 | 0.4 | GO:0030241 | skeletal muscle myosin thick filament assembly(GO:0030241) striated muscle myosin thick filament assembly(GO:0071688) |
| 0.4 | 1.3 | GO:0015871 | choline transport(GO:0015871) |
| 0.4 | 0.9 | GO:0090271 | positive regulation of fibroblast growth factor production(GO:0090271) |
| 0.4 | 2.6 | GO:0033344 | cholesterol efflux(GO:0033344) |
| 0.4 | 0.9 | GO:0051315 | attachment of mitotic spindle microtubules to kinetochore(GO:0051315) |
| 0.4 | 0.4 | GO:0055064 | chloride ion homeostasis(GO:0055064) |
| 0.4 | 3.9 | GO:1901739 | regulation of myoblast fusion(GO:1901739) positive regulation of myoblast fusion(GO:1901741) |
| 0.4 | 0.9 | GO:0030222 | eosinophil differentiation(GO:0030222) |
| 0.4 | 0.4 | GO:0060760 | positive regulation of response to cytokine stimulus(GO:0060760) |
| 0.4 | 3.0 | GO:0019321 | pentose metabolic process(GO:0019321) |
| 0.4 | 1.3 | GO:0018214 | peptidyl-glutamic acid carboxylation(GO:0017187) protein carboxylation(GO:0018214) |
| 0.4 | 1.7 | GO:0061641 | CENP-A containing nucleosome assembly(GO:0034080) CENP-A containing chromatin organization(GO:0061641) |
| 0.4 | 0.4 | GO:0007529 | establishment of synaptic specificity at neuromuscular junction(GO:0007529) |
| 0.4 | 0.4 | GO:0006824 | cobalt ion transport(GO:0006824) |
| 0.4 | 1.3 | GO:0051988 | regulation of attachment of spindle microtubules to kinetochore(GO:0051988) |
| 0.4 | 1.7 | GO:0035589 | G-protein coupled purinergic nucleotide receptor signaling pathway(GO:0035589) |
| 0.4 | 1.7 | GO:0034975 | protein folding in endoplasmic reticulum(GO:0034975) |
| 0.4 | 0.4 | GO:0030656 | regulation of vitamin metabolic process(GO:0030656) |
| 0.4 | 1.7 | GO:1902019 | regulation of cilium movement involved in cell motility(GO:0060295) regulation of cilium beat frequency involved in ciliary motility(GO:0060296) regulation of cilium-dependent cell motility(GO:1902019) |
| 0.4 | 0.9 | GO:0071034 | CUT catabolic process(GO:0071034) CUT metabolic process(GO:0071043) |
| 0.4 | 0.4 | GO:0061032 | visceral serous pericardium development(GO:0061032) |
| 0.4 | 4.3 | GO:0031952 | regulation of protein autophosphorylation(GO:0031952) |
| 0.4 | 3.0 | GO:0019985 | translesion synthesis(GO:0019985) |
| 0.4 | 3.0 | GO:0032988 | ribonucleoprotein complex disassembly(GO:0032988) |
| 0.4 | 0.4 | GO:0010481 | epidermal cell division(GO:0010481) regulation of epidermal cell division(GO:0010482) |
| 0.4 | 0.4 | GO:2000321 | positive regulation of T-helper 17 cell differentiation(GO:2000321) |
| 0.4 | 0.4 | GO:0002934 | desmosome organization(GO:0002934) |
| 0.4 | 1.7 | GO:0060394 | negative regulation of pathway-restricted SMAD protein phosphorylation(GO:0060394) |
| 0.4 | 1.3 | GO:0006244 | pyrimidine nucleotide catabolic process(GO:0006244) pyrimidine deoxyribonucleotide catabolic process(GO:0009223) |
| 0.4 | 6.8 | GO:0030032 | lamellipodium assembly(GO:0030032) |
| 0.4 | 0.4 | GO:1901033 | positive regulation of response to reactive oxygen species(GO:1901033) |
| 0.4 | 21.0 | GO:0090630 | activation of GTPase activity(GO:0090630) |
| 0.4 | 1.7 | GO:0001672 | regulation of chromatin assembly or disassembly(GO:0001672) |
| 0.4 | 1.3 | GO:1902683 | regulation of receptor localization to synapse(GO:1902683) |
| 0.4 | 0.4 | GO:0045922 | negative regulation of fatty acid metabolic process(GO:0045922) |
| 0.4 | 0.8 | GO:0071332 | response to fructose(GO:0009750) cellular response to fructose stimulus(GO:0071332) |
| 0.4 | 1.2 | GO:0061074 | regulation of neural retina development(GO:0061074) |
| 0.4 | 2.5 | GO:0006670 | sphingosine metabolic process(GO:0006670) |
| 0.4 | 5.0 | GO:0043968 | histone H2A acetylation(GO:0043968) |
| 0.4 | 0.4 | GO:0051775 | response to redox state(GO:0051775) |
| 0.4 | 0.8 | GO:0034447 | regulation of very-low-density lipoprotein particle clearance(GO:0010915) negative regulation of very-low-density lipoprotein particle clearance(GO:0010916) very-low-density lipoprotein particle clearance(GO:0034447) |
| 0.4 | 3.3 | GO:0006335 | DNA replication-dependent nucleosome assembly(GO:0006335) DNA replication-dependent nucleosome organization(GO:0034723) |
| 0.4 | 1.6 | GO:0035977 | protein deglycosylation involved in glycoprotein catabolic process(GO:0035977) protein demannosylation(GO:0036507) protein alpha-1,2-demannosylation(GO:0036508) mannose trimming involved in glycoprotein ERAD pathway(GO:1904382) |
| 0.4 | 0.8 | GO:1904469 | positive regulation of tumor necrosis factor secretion(GO:1904469) |
| 0.4 | 4.1 | GO:0034508 | centromere complex assembly(GO:0034508) |
| 0.4 | 4.5 | GO:0010591 | regulation of lamellipodium assembly(GO:0010591) |
| 0.4 | 4.1 | GO:0045070 | positive regulation of viral genome replication(GO:0045070) |
| 0.4 | 1.2 | GO:0042758 | long-chain fatty acid catabolic process(GO:0042758) |
| 0.4 | 3.3 | GO:0043552 | positive regulation of phosphatidylinositol 3-kinase activity(GO:0043552) |
| 0.4 | 0.8 | GO:0007066 | female meiosis sister chromatid cohesion(GO:0007066) |
| 0.4 | 3.7 | GO:0007097 | nuclear migration(GO:0007097) |
| 0.4 | 1.2 | GO:0045351 | type I interferon biosynthetic process(GO:0045351) |
| 0.4 | 2.0 | GO:0042989 | sequestering of actin monomers(GO:0042989) |
| 0.4 | 2.0 | GO:2000973 | regulation of pro-B cell differentiation(GO:2000973) |
| 0.4 | 0.8 | GO:0065005 | protein-lipid complex assembly(GO:0065005) |
| 0.4 | 0.4 | GO:1903887 | motile primary cilium assembly(GO:1903887) |
| 0.4 | 1.6 | GO:0006012 | galactose metabolic process(GO:0006012) |
| 0.4 | 1.2 | GO:0038030 | non-canonical Wnt signaling pathway via MAPK cascade(GO:0038030) |
| 0.4 | 0.4 | GO:0021882 | regulation of transcription from RNA polymerase II promoter involved in forebrain neuron fate commitment(GO:0021882) commitment of multipotent stem cells to neuronal lineage in forebrain(GO:0021898) |
| 0.4 | 0.8 | GO:0072656 | maintenance of protein location in mitochondrion(GO:0072656) |
| 0.4 | 8.0 | GO:0043001 | Golgi to plasma membrane protein transport(GO:0043001) |
| 0.4 | 0.4 | GO:0051344 | negative regulation of cyclic-nucleotide phosphodiesterase activity(GO:0051344) |
| 0.4 | 0.4 | GO:0031665 | negative regulation of lipopolysaccharide-mediated signaling pathway(GO:0031665) |
| 0.4 | 0.4 | GO:1903026 | negative regulation of RNA polymerase II regulatory region sequence-specific DNA binding(GO:1903026) |
| 0.4 | 2.8 | GO:0038063 | collagen-activated tyrosine kinase receptor signaling pathway(GO:0038063) |
| 0.4 | 2.4 | GO:0035563 | positive regulation of chromatin binding(GO:0035563) |
| 0.4 | 1.2 | GO:0032049 | cardiolipin biosynthetic process(GO:0032049) |
| 0.4 | 19.8 | GO:1903749 | positive regulation of establishment of protein localization to mitochondrion(GO:1903749) |
| 0.4 | 0.8 | GO:0002215 | defense response to nematode(GO:0002215) |
| 0.4 | 0.8 | GO:0010756 | positive regulation of plasminogen activation(GO:0010756) |
| 0.4 | 1.2 | GO:0070126 | mitochondrial translational termination(GO:0070126) |
| 0.4 | 2.7 | GO:0071801 | regulation of podosome assembly(GO:0071801) |
| 0.4 | 7.0 | GO:0030488 | tRNA methylation(GO:0030488) |
| 0.4 | 1.2 | GO:0002349 | histamine production involved in inflammatory response(GO:0002349) histamine secretion involved in inflammatory response(GO:0002441) histamine secretion by mast cell(GO:0002553) |
| 0.4 | 2.0 | GO:0071392 | cellular response to estradiol stimulus(GO:0071392) |
| 0.4 | 1.6 | GO:0002023 | reduction of food intake in response to dietary excess(GO:0002023) |
| 0.4 | 0.8 | GO:0070537 | histone H2A K63-linked deubiquitination(GO:0070537) |
| 0.4 | 0.8 | GO:1901222 | regulation of NIK/NF-kappaB signaling(GO:1901222) |
| 0.4 | 0.4 | GO:0006271 | DNA strand elongation involved in DNA replication(GO:0006271) |
| 0.4 | 1.5 | GO:0048304 | positive regulation of isotype switching to IgG isotypes(GO:0048304) |
| 0.4 | 1.9 | GO:0031570 | DNA damage checkpoint(GO:0000077) DNA integrity checkpoint(GO:0031570) |
| 0.4 | 1.5 | GO:0007008 | outer mitochondrial membrane organization(GO:0007008) |
| 0.4 | 11.9 | GO:0033141 | positive regulation of peptidyl-serine phosphorylation of STAT protein(GO:0033141) |
| 0.4 | 1.5 | GO:0051151 | negative regulation of smooth muscle cell differentiation(GO:0051151) |
| 0.4 | 1.1 | GO:0045647 | negative regulation of erythrocyte differentiation(GO:0045647) |
| 0.4 | 1.1 | GO:0007217 | tachykinin receptor signaling pathway(GO:0007217) |
| 0.4 | 5.7 | GO:0046854 | phosphatidylinositol phosphorylation(GO:0046854) |
| 0.4 | 0.4 | GO:2000416 | regulation of eosinophil migration(GO:2000416) |
| 0.4 | 1.5 | GO:0060693 | regulation of branching involved in salivary gland morphogenesis(GO:0060693) |
| 0.4 | 0.4 | GO:0030952 | establishment or maintenance of cytoskeleton polarity(GO:0030952) |
| 0.4 | 0.8 | GO:0016321 | female meiosis chromosome segregation(GO:0016321) |
| 0.4 | 0.8 | GO:0045144 | meiotic sister chromatid segregation(GO:0045144) meiotic sister chromatid cohesion(GO:0051177) |
| 0.4 | 0.4 | GO:0006102 | isocitrate metabolic process(GO:0006102) |
| 0.4 | 1.1 | GO:0060023 | soft palate development(GO:0060023) |
| 0.4 | 0.8 | GO:0016075 | rRNA catabolic process(GO:0016075) |
| 0.4 | 0.8 | GO:0006007 | glucose catabolic process(GO:0006007) |
| 0.4 | 4.5 | GO:0033209 | tumor necrosis factor-mediated signaling pathway(GO:0033209) |
| 0.4 | 0.4 | GO:0046340 | diacylglycerol catabolic process(GO:0046340) |
| 0.4 | 0.4 | GO:0007398 | ectoderm development(GO:0007398) |
| 0.4 | 3.7 | GO:0046856 | phosphatidylinositol dephosphorylation(GO:0046856) |
| 0.4 | 1.1 | GO:0070828 | heterochromatin organization(GO:0070828) |
| 0.4 | 1.1 | GO:0018094 | protein polyglycylation(GO:0018094) |
| 0.4 | 6.7 | GO:0032008 | positive regulation of TOR signaling(GO:0032008) |
| 0.4 | 2.2 | GO:0045830 | positive regulation of isotype switching(GO:0045830) |
| 0.4 | 1.9 | GO:0060586 | multicellular organismal iron ion homeostasis(GO:0060586) |
| 0.4 | 3.7 | GO:0035873 | lactate transport(GO:0015727) lactate transmembrane transport(GO:0035873) plasma membrane lactate transport(GO:0035879) |
| 0.4 | 0.4 | GO:0071947 | protein deubiquitination involved in ubiquitin-dependent protein catabolic process(GO:0071947) |
| 0.4 | 0.4 | GO:0001781 | neutrophil apoptotic process(GO:0001781) regulation of neutrophil apoptotic process(GO:0033029) positive regulation of neutrophil apoptotic process(GO:0033031) |
| 0.4 | 0.4 | GO:0010637 | negative regulation of mitochondrial fusion(GO:0010637) |
| 0.4 | 1.1 | GO:0014043 | negative regulation of neuron maturation(GO:0014043) |
| 0.4 | 1.5 | GO:0045654 | positive regulation of megakaryocyte differentiation(GO:0045654) |
| 0.4 | 3.7 | GO:0000463 | maturation of LSU-rRNA from tricistronic rRNA transcript (SSU-rRNA, 5.8S rRNA, LSU-rRNA)(GO:0000463) |
| 0.4 | 2.2 | GO:0051447 | negative regulation of meiotic cell cycle(GO:0051447) |
| 0.4 | 4.4 | GO:0031648 | protein destabilization(GO:0031648) |
| 0.4 | 1.5 | GO:0060052 | neurofilament cytoskeleton organization(GO:0060052) |
| 0.4 | 0.4 | GO:0009133 | nucleoside diphosphate biosynthetic process(GO:0009133) |
| 0.4 | 1.1 | GO:0045086 | positive regulation of interleukin-2 biosynthetic process(GO:0045086) |
| 0.4 | 4.7 | GO:0008053 | mitochondrial fusion(GO:0008053) |
| 0.4 | 6.2 | GO:0048247 | lymphocyte chemotaxis(GO:0048247) |
| 0.4 | 1.1 | GO:0009445 | putrescine metabolic process(GO:0009445) |
| 0.4 | 2.2 | GO:0051639 | actin filament network formation(GO:0051639) |
| 0.4 | 1.8 | GO:0034227 | tRNA thio-modification(GO:0034227) |
| 0.4 | 0.4 | GO:0051534 | negative regulation of NFAT protein import into nucleus(GO:0051534) |
| 0.4 | 5.8 | GO:0032784 | regulation of DNA-templated transcription, elongation(GO:0032784) |
| 0.4 | 13.7 | GO:0006418 | tRNA aminoacylation for protein translation(GO:0006418) |
| 0.4 | 0.7 | GO:0010838 | positive regulation of keratinocyte proliferation(GO:0010838) |
| 0.4 | 2.2 | GO:0000083 | regulation of transcription involved in G1/S transition of mitotic cell cycle(GO:0000083) |
| 0.4 | 4.3 | GO:0048535 | lymph node development(GO:0048535) |
| 0.4 | 1.1 | GO:0019433 | triglyceride catabolic process(GO:0019433) |
| 0.4 | 1.8 | GO:0046606 | negative regulation of centrosome duplication(GO:0010826) negative regulation of centrosome cycle(GO:0046606) |
| 0.4 | 3.9 | GO:1900017 | positive regulation of cytokine production involved in inflammatory response(GO:1900017) |
| 0.4 | 0.7 | GO:0090148 | membrane fission(GO:0090148) |
| 0.4 | 2.1 | GO:2000480 | negative regulation of cAMP-dependent protein kinase activity(GO:2000480) |
| 0.4 | 2.5 | GO:0032060 | bleb assembly(GO:0032060) |
| 0.4 | 0.7 | GO:0007354 | zygotic determination of anterior/posterior axis, embryo(GO:0007354) |
| 0.4 | 5.3 | GO:0006801 | superoxide metabolic process(GO:0006801) |
| 0.4 | 0.4 | GO:0019346 | homoserine metabolic process(GO:0009092) transsulfuration(GO:0019346) hydrogen sulfide metabolic process(GO:0070813) hydrogen sulfide biosynthetic process(GO:0070814) |
| 0.4 | 0.7 | GO:0070989 | oxidative demethylation(GO:0070989) |
| 0.4 | 0.7 | GO:0002826 | negative regulation of T-helper 1 type immune response(GO:0002826) |
| 0.4 | 2.5 | GO:0046685 | response to arsenic-containing substance(GO:0046685) |
| 0.4 | 2.1 | GO:0071578 | zinc II ion transmembrane import(GO:0071578) |
| 0.4 | 2.8 | GO:0042771 | intrinsic apoptotic signaling pathway in response to DNA damage by p53 class mediator(GO:0042771) |
| 0.3 | 0.3 | GO:0071725 | response to triacyl bacterial lipopeptide(GO:0071725) cellular response to triacyl bacterial lipopeptide(GO:0071727) |
| 0.3 | 1.7 | GO:0050651 | dermatan sulfate proteoglycan biosynthetic process(GO:0050651) |
| 0.3 | 1.0 | GO:0016556 | mRNA modification(GO:0016556) |
| 0.3 | 5.9 | GO:0019915 | lipid storage(GO:0019915) |
| 0.3 | 1.0 | GO:0034204 | lipid translocation(GO:0034204) |
| 0.3 | 1.7 | GO:0048525 | negative regulation of viral process(GO:0048525) |
| 0.3 | 8.3 | GO:0003333 | amino acid transmembrane transport(GO:0003333) |
| 0.3 | 1.0 | GO:0072531 | pyrimidine-containing compound transmembrane transport(GO:0072531) |
| 0.3 | 1.0 | GO:2000353 | positive regulation of endothelial cell apoptotic process(GO:2000353) |
| 0.3 | 1.7 | GO:0030643 | cellular phosphate ion homeostasis(GO:0030643) cellular trivalent inorganic anion homeostasis(GO:0072502) |
| 0.3 | 3.4 | GO:0030150 | protein import into mitochondrial matrix(GO:0030150) |
| 0.3 | 0.7 | GO:0044003 | modification by symbiont of host morphology or physiology(GO:0044003) |
| 0.3 | 7.6 | GO:0006730 | one-carbon metabolic process(GO:0006730) |
| 0.3 | 0.3 | GO:0006563 | L-serine metabolic process(GO:0006563) |
| 0.3 | 1.4 | GO:0090286 | cytoskeletal anchoring at nuclear membrane(GO:0090286) |
| 0.3 | 1.0 | GO:0010701 | positive regulation of norepinephrine secretion(GO:0010701) |
| 0.3 | 0.7 | GO:0060897 | neural plate regionalization(GO:0060897) |
| 0.3 | 1.0 | GO:0006098 | pentose-phosphate shunt(GO:0006098) |
| 0.3 | 0.7 | GO:0098911 | regulation of ventricular cardiac muscle cell action potential(GO:0098911) |
| 0.3 | 1.0 | GO:0061154 | endothelial tube morphogenesis(GO:0061154) |
| 0.3 | 0.3 | GO:0006046 | N-acetylglucosamine catabolic process(GO:0006046) |
| 0.3 | 1.0 | GO:0010727 | negative regulation of hydrogen peroxide metabolic process(GO:0010727) |
| 0.3 | 1.4 | GO:0043568 | positive regulation of insulin-like growth factor receptor signaling pathway(GO:0043568) |
| 0.3 | 0.3 | GO:2000319 | regulation of T-helper 17 cell differentiation(GO:2000319) |
| 0.3 | 0.7 | GO:0042347 | negative regulation of NF-kappaB import into nucleus(GO:0042347) |
| 0.3 | 0.3 | GO:0036119 | response to platelet-derived growth factor(GO:0036119) cellular response to platelet-derived growth factor stimulus(GO:0036120) |
| 0.3 | 0.7 | GO:0007060 | male meiosis chromosome segregation(GO:0007060) |
| 0.3 | 1.3 | GO:0006776 | vitamin A metabolic process(GO:0006776) |
| 0.3 | 0.3 | GO:2000630 | positive regulation of miRNA metabolic process(GO:2000630) |
| 0.3 | 0.7 | GO:0016554 | cytidine to uridine editing(GO:0016554) |
| 0.3 | 1.3 | GO:1902626 | assembly of large subunit precursor of preribosome(GO:1902626) |
| 0.3 | 5.6 | GO:0050829 | defense response to Gram-negative bacterium(GO:0050829) |
| 0.3 | 0.3 | GO:1903975 | regulation of glial cell migration(GO:1903975) |
| 0.3 | 0.7 | GO:0006933 | negative regulation of cell adhesion involved in substrate-bound cell migration(GO:0006933) |
| 0.3 | 1.3 | GO:0045815 | positive regulation of gene expression, epigenetic(GO:0045815) |
| 0.3 | 1.6 | GO:0016558 | protein import into peroxisome matrix(GO:0016558) |
| 0.3 | 0.3 | GO:1901978 | positive regulation of cell cycle checkpoint(GO:1901978) |
| 0.3 | 2.3 | GO:0032095 | regulation of response to food(GO:0032095) |
| 0.3 | 0.3 | GO:0033567 | DNA replication, Okazaki fragment processing(GO:0033567) |
| 0.3 | 0.3 | GO:0097050 | type B pancreatic cell apoptotic process(GO:0097050) |
| 0.3 | 0.3 | GO:0015936 | coenzyme A metabolic process(GO:0015936) |
| 0.3 | 1.3 | GO:0002762 | negative regulation of myeloid leukocyte differentiation(GO:0002762) |
| 0.3 | 11.6 | GO:0006888 | ER to Golgi vesicle-mediated transport(GO:0006888) |
| 0.3 | 0.3 | GO:0034162 | toll-like receptor 9 signaling pathway(GO:0034162) |
| 0.3 | 1.0 | GO:0032466 | negative regulation of cytokinesis(GO:0032466) |
| 0.3 | 1.0 | GO:1903278 | positive regulation of sodium ion export(GO:1903275) positive regulation of sodium ion export from cell(GO:1903278) |
| 0.3 | 1.3 | GO:0046461 | neutral lipid catabolic process(GO:0046461) acylglycerol catabolic process(GO:0046464) |
| 0.3 | 1.9 | GO:0006349 | regulation of gene expression by genetic imprinting(GO:0006349) |
| 0.3 | 0.3 | GO:0051454 | pH elevation(GO:0045852) intracellular pH elevation(GO:0051454) |
| 0.3 | 0.6 | GO:0007227 | signal transduction downstream of smoothened(GO:0007227) |
| 0.3 | 0.3 | GO:0072194 | kidney smooth muscle tissue development(GO:0072194) |
| 0.3 | 0.6 | GO:0042138 | meiotic DNA double-strand break formation(GO:0042138) |
| 0.3 | 1.0 | GO:2000359 | regulation of binding of sperm to zona pellucida(GO:2000359) |
| 0.3 | 5.7 | GO:0032233 | positive regulation of actin filament bundle assembly(GO:0032233) |
| 0.3 | 1.0 | GO:0031065 | positive regulation of histone deacetylation(GO:0031065) |
| 0.3 | 1.0 | GO:0046951 | ketone body biosynthetic process(GO:0046951) |
| 0.3 | 3.5 | GO:0046329 | negative regulation of JNK cascade(GO:0046329) |
| 0.3 | 0.6 | GO:0070358 | actin polymerization-dependent cell motility(GO:0070358) |
| 0.3 | 0.3 | GO:1902075 | cellular response to salt(GO:1902075) |
| 0.3 | 13.9 | GO:0019882 | antigen processing and presentation(GO:0019882) |
| 0.3 | 0.9 | GO:0045059 | positive thymic T cell selection(GO:0045059) |
| 0.3 | 0.9 | GO:0009137 | purine nucleoside diphosphate catabolic process(GO:0009137) purine ribonucleoside diphosphate catabolic process(GO:0009181) |
| 0.3 | 0.3 | GO:0038093 | Fc receptor signaling pathway(GO:0038093) |
| 0.3 | 4.1 | GO:0007062 | sister chromatid cohesion(GO:0007062) |
| 0.3 | 0.3 | GO:0060437 | lung growth(GO:0060437) |
| 0.3 | 1.3 | GO:0006851 | mitochondrial calcium ion transport(GO:0006851) |
| 0.3 | 1.3 | GO:0018230 | peptidyl-L-cysteine S-palmitoylation(GO:0018230) peptidyl-S-diacylglycerol-L-cysteine biosynthetic process from peptidyl-cysteine(GO:0018231) |
| 0.3 | 1.9 | GO:0071514 | genetic imprinting(GO:0071514) |
| 0.3 | 1.6 | GO:0050434 | positive regulation of viral transcription(GO:0050434) |
| 0.3 | 0.9 | GO:0018026 | peptidyl-lysine monomethylation(GO:0018026) |
| 0.3 | 0.9 | GO:0071941 | nitrogen cycle metabolic process(GO:0071941) |
| 0.3 | 0.6 | GO:0035356 | cellular triglyceride homeostasis(GO:0035356) |
| 0.3 | 0.9 | GO:0015770 | disaccharide transport(GO:0015766) sucrose transport(GO:0015770) oligosaccharide transport(GO:0015772) |
| 0.3 | 0.3 | GO:0031086 | nuclear-transcribed mRNA catabolic process, deadenylation-independent decay(GO:0031086) deadenylation-independent decapping of nuclear-transcribed mRNA(GO:0031087) |
| 0.3 | 4.9 | GO:0014904 | myotube cell development(GO:0014904) |
| 0.3 | 0.9 | GO:0071577 | zinc II ion transmembrane transport(GO:0071577) |
| 0.3 | 0.3 | GO:0044786 | cell cycle DNA replication(GO:0044786) |
| 0.3 | 0.6 | GO:1903715 | regulation of aerobic respiration(GO:1903715) |
| 0.3 | 2.1 | GO:0050855 | regulation of B cell receptor signaling pathway(GO:0050855) |
| 0.3 | 0.3 | GO:0046598 | positive regulation of viral entry into host cell(GO:0046598) |
| 0.3 | 0.9 | GO:0018125 | peptidyl-cysteine methylation(GO:0018125) |
| 0.3 | 3.3 | GO:0000154 | rRNA modification(GO:0000154) |
| 0.3 | 1.2 | GO:0046718 | viral entry into host cell(GO:0046718) |
| 0.3 | 0.6 | GO:0010039 | response to iron ion(GO:0010039) |
| 0.3 | 5.4 | GO:0000956 | nuclear-transcribed mRNA catabolic process(GO:0000956) |
| 0.3 | 0.6 | GO:0060468 | prevention of polyspermy(GO:0060468) |
| 0.3 | 0.3 | GO:0045625 | regulation of T-helper 1 cell differentiation(GO:0045625) |
| 0.3 | 1.8 | GO:0043144 | snoRNA processing(GO:0043144) |
| 0.3 | 0.6 | GO:0090400 | stress-induced premature senescence(GO:0090400) |
| 0.3 | 0.9 | GO:0046909 | intermembrane transport(GO:0046909) |
| 0.3 | 0.9 | GO:0060088 | auditory receptor cell stereocilium organization(GO:0060088) |
| 0.3 | 0.6 | GO:1900227 | positive regulation of NLRP3 inflammasome complex assembly(GO:1900227) |
| 0.3 | 0.6 | GO:0072217 | negative regulation of metanephros development(GO:0072217) |
| 0.3 | 0.9 | GO:0075525 | viral translational termination-reinitiation(GO:0075525) |
| 0.3 | 0.6 | GO:0007571 | age-dependent response to oxidative stress(GO:0001306) age-dependent general metabolic decline(GO:0007571) |
| 0.3 | 0.6 | GO:1903998 | regulation of eating behavior(GO:1903998) negative regulation of eating behavior(GO:1903999) |
| 0.3 | 2.1 | GO:0010718 | positive regulation of epithelial to mesenchymal transition(GO:0010718) |
| 0.3 | 2.7 | GO:0044458 | motile cilium assembly(GO:0044458) |
| 0.3 | 2.9 | GO:0006541 | glutamine metabolic process(GO:0006541) |
| 0.3 | 2.4 | GO:0071347 | cellular response to interleukin-1(GO:0071347) |
| 0.3 | 1.2 | GO:0042501 | serine phosphorylation of STAT protein(GO:0042501) |
| 0.3 | 0.3 | GO:0010459 | negative regulation of heart rate(GO:0010459) |
| 0.3 | 0.9 | GO:0000707 | meiotic DNA recombinase assembly(GO:0000707) |
| 0.3 | 0.9 | GO:0048012 | hepatocyte growth factor receptor signaling pathway(GO:0048012) |
| 0.3 | 0.3 | GO:0061502 | early endosome to recycling endosome transport(GO:0061502) |
| 0.3 | 0.6 | GO:0035622 | intrahepatic bile duct development(GO:0035622) |
| 0.3 | 0.6 | GO:0045112 | integrin biosynthetic process(GO:0045112) |
| 0.3 | 1.4 | GO:0010893 | positive regulation of steroid biosynthetic process(GO:0010893) |
| 0.3 | 0.9 | GO:0008291 | acetylcholine metabolic process(GO:0008291) acetate ester metabolic process(GO:1900619) |
| 0.3 | 1.4 | GO:0060903 | positive regulation of meiosis I(GO:0060903) |
| 0.3 | 1.7 | GO:0006477 | protein sulfation(GO:0006477) |
| 0.3 | 0.3 | GO:2000852 | corticosterone secretion(GO:0035934) regulation of corticosterone secretion(GO:2000852) |
| 0.3 | 0.3 | GO:0009804 | coumarin metabolic process(GO:0009804) |
| 0.3 | 0.3 | GO:0032714 | negative regulation of interleukin-13 production(GO:0032696) negative regulation of interleukin-5 production(GO:0032714) |
| 0.3 | 0.6 | GO:0035435 | phosphate ion transmembrane transport(GO:0035435) |
| 0.3 | 1.1 | GO:0017183 | peptidyl-diphthamide metabolic process(GO:0017182) peptidyl-diphthamide biosynthetic process from peptidyl-histidine(GO:0017183) |
| 0.3 | 0.9 | GO:0006907 | pinocytosis(GO:0006907) |
| 0.3 | 1.4 | GO:0061179 | negative regulation of insulin secretion involved in cellular response to glucose stimulus(GO:0061179) |
| 0.3 | 0.6 | GO:0001842 | neural fold formation(GO:0001842) |
| 0.3 | 0.9 | GO:0048318 | axial mesoderm development(GO:0048318) |
| 0.3 | 0.3 | GO:0032417 | positive regulation of sodium:proton antiporter activity(GO:0032417) |
| 0.3 | 2.0 | GO:0034551 | respiratory chain complex III assembly(GO:0017062) mitochondrial respiratory chain complex III assembly(GO:0034551) mitochondrial respiratory chain complex III biogenesis(GO:0097033) |
| 0.3 | 1.1 | GO:0030321 | transepithelial chloride transport(GO:0030321) |
| 0.3 | 2.8 | GO:0043171 | peptide catabolic process(GO:0043171) |
| 0.3 | 0.3 | GO:0060455 | negative regulation of gastric acid secretion(GO:0060455) |
| 0.3 | 1.1 | GO:0002021 | response to dietary excess(GO:0002021) |
| 0.3 | 1.1 | GO:0044821 | telomere tethering at nuclear periphery(GO:0034398) meiotic telomere tethering at nuclear periphery(GO:0044821) meiotic attachment of telomere to nuclear envelope(GO:0070197) chromosome attachment to the nuclear envelope(GO:0097240) |
| 0.3 | 1.7 | GO:0000301 | retrograde transport, vesicle recycling within Golgi(GO:0000301) |
| 0.3 | 1.7 | GO:0006283 | transcription-coupled nucleotide-excision repair(GO:0006283) |
| 0.3 | 1.4 | GO:0001771 | immunological synapse formation(GO:0001771) |
| 0.3 | 0.3 | GO:1903298 | regulation of hypoxia-induced intrinsic apoptotic signaling pathway(GO:1903297) negative regulation of hypoxia-induced intrinsic apoptotic signaling pathway(GO:1903298) |
| 0.3 | 2.2 | GO:0006607 | NLS-bearing protein import into nucleus(GO:0006607) |
| 0.3 | 4.2 | GO:0019835 | cytolysis(GO:0019835) |
| 0.3 | 5.9 | GO:0006890 | retrograde vesicle-mediated transport, Golgi to ER(GO:0006890) |
| 0.3 | 3.3 | GO:0071353 | cellular response to interleukin-4(GO:0071353) |
| 0.3 | 0.6 | GO:0072672 | neutrophil extravasation(GO:0072672) |
| 0.3 | 0.8 | GO:0060457 | negative regulation of digestive system process(GO:0060457) |
| 0.3 | 4.7 | GO:0071479 | cellular response to ionizing radiation(GO:0071479) |
| 0.3 | 0.6 | GO:0033860 | regulation of NAD(P)H oxidase activity(GO:0033860) |
| 0.3 | 0.6 | GO:1900864 | mitochondrial tRNA modification(GO:0070900) mitochondrial RNA modification(GO:1900864) |
| 0.3 | 0.3 | GO:0009182 | purine deoxyribonucleoside diphosphate metabolic process(GO:0009182) dGDP metabolic process(GO:0046066) |
| 0.3 | 1.1 | GO:0006369 | termination of RNA polymerase II transcription(GO:0006369) |
| 0.3 | 2.5 | GO:0043981 | histone H4-K5 acetylation(GO:0043981) histone H4-K8 acetylation(GO:0043982) |
| 0.3 | 0.3 | GO:2001268 | negative regulation of cysteine-type endopeptidase activity involved in apoptotic signaling pathway(GO:2001268) |
| 0.3 | 1.4 | GO:0039702 | viral budding via host ESCRT complex(GO:0039702) |
| 0.3 | 2.2 | GO:0060158 | phospholipase C-activating dopamine receptor signaling pathway(GO:0060158) |
| 0.3 | 1.4 | GO:0036159 | inner dynein arm assembly(GO:0036159) |
| 0.3 | 0.5 | GO:0031639 | plasminogen activation(GO:0031639) |
| 0.3 | 0.8 | GO:0045054 | constitutive secretory pathway(GO:0045054) |
| 0.3 | 0.8 | GO:0086069 | bundle of His cell to Purkinje myocyte communication(GO:0086069) |
| 0.3 | 0.8 | GO:0006296 | nucleotide-excision repair, DNA incision, 5'-to lesion(GO:0006296) |
| 0.3 | 0.8 | GO:0016480 | negative regulation of transcription from RNA polymerase III promoter(GO:0016480) |
| 0.3 | 1.1 | GO:0051013 | microtubule severing(GO:0051013) |
| 0.3 | 1.1 | GO:0045821 | positive regulation of glycolytic process(GO:0045821) |
| 0.3 | 25.7 | GO:0051607 | defense response to virus(GO:0051607) |
| 0.3 | 1.1 | GO:1990542 | mitochondrial transmembrane transport(GO:1990542) |
| 0.3 | 1.9 | GO:0006957 | complement activation, alternative pathway(GO:0006957) |
| 0.3 | 1.9 | GO:0006995 | cellular response to nitrogen starvation(GO:0006995) cellular response to nitrogen levels(GO:0043562) |
| 0.3 | 1.1 | GO:0006451 | selenocysteine incorporation(GO:0001514) translational readthrough(GO:0006451) |
| 0.3 | 0.3 | GO:0055094 | response to lipoprotein particle(GO:0055094) |
| 0.3 | 0.5 | GO:1904705 | regulation of vascular smooth muscle cell proliferation(GO:1904705) vascular smooth muscle cell proliferation(GO:1990874) |
| 0.3 | 1.1 | GO:0016540 | protein autoprocessing(GO:0016540) |
| 0.3 | 0.3 | GO:0035740 | CD8-positive, alpha-beta T cell proliferation(GO:0035740) |
| 0.3 | 0.3 | GO:0000737 | DNA catabolic process, endonucleolytic(GO:0000737) |
| 0.3 | 1.1 | GO:0002227 | innate immune response in mucosa(GO:0002227) |
| 0.3 | 1.3 | GO:0070230 | positive regulation of lymphocyte apoptotic process(GO:0070230) |
| 0.3 | 0.5 | GO:0046208 | spermine catabolic process(GO:0046208) |
| 0.3 | 5.0 | GO:0016126 | sterol biosynthetic process(GO:0016126) |
| 0.3 | 1.1 | GO:0042760 | very long-chain fatty acid catabolic process(GO:0042760) |
| 0.3 | 0.5 | GO:0002361 | CD4-positive, CD25-positive, alpha-beta regulatory T cell differentiation(GO:0002361) |
| 0.3 | 0.3 | GO:0002678 | positive regulation of chronic inflammatory response(GO:0002678) negative regulation of cardiac muscle contraction(GO:0055118) |
| 0.3 | 1.8 | GO:0030866 | cortical actin cytoskeleton organization(GO:0030866) |
| 0.3 | 0.8 | GO:0060689 | cell differentiation involved in salivary gland development(GO:0060689) |
| 0.3 | 0.5 | GO:0033962 | cytoplasmic mRNA processing body assembly(GO:0033962) |
| 0.3 | 0.3 | GO:0036302 | atrioventricular canal development(GO:0036302) |
| 0.3 | 0.8 | GO:1903966 | monounsaturated fatty acid metabolic process(GO:1903964) monounsaturated fatty acid biosynthetic process(GO:1903966) |
| 0.3 | 14.5 | GO:0016579 | protein deubiquitination(GO:0016579) |
| 0.3 | 1.5 | GO:0043102 | methionine metabolic process(GO:0006555) methionine biosynthetic process(GO:0009086) amino acid salvage(GO:0043102) L-methionine biosynthetic process(GO:0071265) L-methionine salvage(GO:0071267) |
| 0.3 | 0.5 | GO:0002281 | macrophage activation involved in immune response(GO:0002281) |
| 0.3 | 0.8 | GO:0003056 | regulation of vascular smooth muscle contraction(GO:0003056) |
| 0.3 | 0.3 | GO:0001955 | blood vessel maturation(GO:0001955) |
| 0.3 | 3.1 | GO:0050873 | brown fat cell differentiation(GO:0050873) |
| 0.3 | 1.0 | GO:0043011 | myeloid dendritic cell differentiation(GO:0043011) |
| 0.3 | 0.3 | GO:0032069 | regulation of nuclease activity(GO:0032069) |
| 0.3 | 0.3 | GO:0008089 | anterograde axonal transport(GO:0008089) |
| 0.3 | 1.0 | GO:0031572 | G2 DNA damage checkpoint(GO:0031572) |
| 0.3 | 0.3 | GO:0030240 | skeletal muscle thin filament assembly(GO:0030240) |
| 0.3 | 1.3 | GO:0042531 | positive regulation of tyrosine phosphorylation of STAT protein(GO:0042531) |
| 0.3 | 1.0 | GO:0003356 | regulation of cilium beat frequency(GO:0003356) |
| 0.3 | 0.5 | GO:1901096 | regulation of autophagosome maturation(GO:1901096) |
| 0.3 | 0.3 | GO:0015670 | carbon dioxide transport(GO:0015670) |
| 0.3 | 0.8 | GO:0030853 | negative regulation of granulocyte differentiation(GO:0030853) |
| 0.3 | 0.8 | GO:1901029 | negative regulation of mitochondrial outer membrane permeabilization involved in apoptotic signaling pathway(GO:1901029) |
| 0.3 | 0.5 | GO:0051005 | negative regulation of lipoprotein lipase activity(GO:0051005) |
| 0.3 | 1.8 | GO:0032231 | regulation of actin filament bundle assembly(GO:0032231) |
| 0.3 | 4.3 | GO:0006611 | protein export from nucleus(GO:0006611) |
| 0.3 | 0.8 | GO:0070125 | mitochondrial translational elongation(GO:0070125) |
| 0.3 | 0.5 | GO:0048246 | macrophage chemotaxis(GO:0048246) |
| 0.2 | 1.5 | GO:0007176 | regulation of epidermal growth factor-activated receptor activity(GO:0007176) |
| 0.2 | 1.0 | GO:0045648 | positive regulation of erythrocyte differentiation(GO:0045648) |
| 0.2 | 0.5 | GO:0060193 | positive regulation of lipase activity(GO:0060193) |
| 0.2 | 3.7 | GO:0008286 | insulin receptor signaling pathway(GO:0008286) |
| 0.2 | 1.7 | GO:0045974 | negative regulation of translation, ncRNA-mediated(GO:0040033) regulation of translation, ncRNA-mediated(GO:0045974) |
| 0.2 | 0.7 | GO:0098789 | pre-mRNA cleavage required for polyadenylation(GO:0098789) |
| 0.2 | 0.7 | GO:0035627 | ceramide transport(GO:0035627) |
| 0.2 | 0.5 | GO:0043173 | nucleotide salvage(GO:0043173) |
| 0.2 | 0.5 | GO:0015808 | L-alanine transport(GO:0015808) |
| 0.2 | 0.2 | GO:0019042 | viral latency(GO:0019042) |
| 0.2 | 1.0 | GO:0006568 | tryptophan metabolic process(GO:0006568) indolalkylamine metabolic process(GO:0006586) |
| 0.2 | 2.2 | GO:0006144 | purine nucleobase metabolic process(GO:0006144) |
| 0.2 | 0.7 | GO:0080154 | regulation of fertilization(GO:0080154) |
| 0.2 | 3.7 | GO:0006491 | N-glycan processing(GO:0006491) |
| 0.2 | 2.0 | GO:0045899 | positive regulation of RNA polymerase II transcriptional preinitiation complex assembly(GO:0045899) |
| 0.2 | 0.7 | GO:0042448 | progesterone metabolic process(GO:0042448) |
| 0.2 | 0.7 | GO:0006003 | fructose 2,6-bisphosphate metabolic process(GO:0006003) |
| 0.2 | 0.5 | GO:0070244 | negative regulation of thymocyte apoptotic process(GO:0070244) |
| 0.2 | 0.2 | GO:0006166 | purine ribonucleoside salvage(GO:0006166) |
| 0.2 | 1.2 | GO:0006699 | bile acid biosynthetic process(GO:0006699) |
| 0.2 | 4.4 | GO:0007569 | cell aging(GO:0007569) |
| 0.2 | 1.0 | GO:0051697 | protein delipidation(GO:0051697) |
| 0.2 | 0.2 | GO:1902914 | regulation of protein polyubiquitination(GO:1902914) |
| 0.2 | 0.2 | GO:2001185 | regulation of CD8-positive, alpha-beta T cell activation(GO:2001185) |
| 0.2 | 2.2 | GO:0060285 | cilium or flagellum-dependent cell motility(GO:0001539) cilium-dependent cell motility(GO:0060285) |
| 0.2 | 0.5 | GO:0042374 | phylloquinone metabolic process(GO:0042374) phylloquinone catabolic process(GO:0042376) quinone catabolic process(GO:1901662) |
| 0.2 | 0.2 | GO:0001779 | natural killer cell differentiation(GO:0001779) |
| 0.2 | 0.2 | GO:2000767 | positive regulation of cytoplasmic translation(GO:2000767) |
| 0.2 | 1.0 | GO:0006817 | phosphate ion transport(GO:0006817) |
| 0.2 | 1.4 | GO:0048730 | epidermis morphogenesis(GO:0048730) |
| 0.2 | 7.2 | GO:0007229 | integrin-mediated signaling pathway(GO:0007229) |
| 0.2 | 1.2 | GO:0046326 | positive regulation of glucose import(GO:0046326) |
| 0.2 | 1.4 | GO:0051974 | negative regulation of telomerase activity(GO:0051974) |
| 0.2 | 1.4 | GO:0001954 | positive regulation of cell-matrix adhesion(GO:0001954) |
| 0.2 | 0.2 | GO:0009794 | regulation of mitotic cell cycle, embryonic(GO:0009794) mitotic cell cycle, embryonic(GO:0045448) |
| 0.2 | 0.7 | GO:0050810 | regulation of steroid biosynthetic process(GO:0050810) |
| 0.2 | 12.3 | GO:0006633 | fatty acid biosynthetic process(GO:0006633) |
| 0.2 | 0.9 | GO:0006107 | oxaloacetate metabolic process(GO:0006107) |
| 0.2 | 0.5 | GO:0048733 | sebaceous gland development(GO:0048733) |
| 0.2 | 0.7 | GO:0006572 | tyrosine catabolic process(GO:0006572) |
| 0.2 | 1.2 | GO:0006968 | cellular defense response(GO:0006968) |
| 0.2 | 0.9 | GO:0022615 | protein to membrane docking(GO:0022615) |
| 0.2 | 0.7 | GO:0051782 | negative regulation of cell division(GO:0051782) |
| 0.2 | 0.5 | GO:1901678 | iron coordination entity transport(GO:1901678) |
| 0.2 | 0.2 | GO:0050995 | negative regulation of lipid catabolic process(GO:0050995) |
| 0.2 | 0.9 | GO:2000288 | positive regulation of myoblast proliferation(GO:2000288) |
| 0.2 | 0.2 | GO:0030916 | otic vesicle formation(GO:0030916) |
| 0.2 | 5.1 | GO:0003341 | cilium movement(GO:0003341) |
| 0.2 | 2.6 | GO:0015804 | neutral amino acid transport(GO:0015804) |
| 0.2 | 0.5 | GO:0006415 | translational termination(GO:0006415) |
| 0.2 | 0.2 | GO:0040009 | regulation of growth rate(GO:0040009) |
| 0.2 | 0.5 | GO:0016045 | detection of bacterium(GO:0016045) detection of other organism(GO:0098543) |
| 0.2 | 0.2 | GO:0045738 | negative regulation of DNA repair(GO:0045738) |
| 0.2 | 2.1 | GO:0070208 | protein heterotrimerization(GO:0070208) |
| 0.2 | 0.7 | GO:0046174 | polyol catabolic process(GO:0046174) |
| 0.2 | 1.1 | GO:0071157 | negative regulation of cell cycle arrest(GO:0071157) |
| 0.2 | 0.7 | GO:0009191 | ribonucleoside diphosphate catabolic process(GO:0009191) |
| 0.2 | 2.7 | GO:0006471 | protein ADP-ribosylation(GO:0006471) |
| 0.2 | 2.5 | GO:0006829 | zinc II ion transport(GO:0006829) |
| 0.2 | 1.6 | GO:0044342 | type B pancreatic cell proliferation(GO:0044342) |
| 0.2 | 4.3 | GO:0048240 | sperm capacitation(GO:0048240) |
| 0.2 | 5.0 | GO:0006406 | mRNA export from nucleus(GO:0006406) mRNA-containing ribonucleoprotein complex export from nucleus(GO:0071427) |
| 0.2 | 0.5 | GO:0048808 | male genitalia morphogenesis(GO:0048808) male anatomical structure morphogenesis(GO:0090598) |
| 0.2 | 0.2 | GO:0050755 | chemokine metabolic process(GO:0050755) |
| 0.2 | 0.2 | GO:0031145 | anaphase-promoting complex-dependent catabolic process(GO:0031145) |
| 0.2 | 0.2 | GO:0060459 | left lung development(GO:0060459) left lung morphogenesis(GO:0060460) |
| 0.2 | 0.7 | GO:0070131 | positive regulation of mitochondrial translation(GO:0070131) |
| 0.2 | 0.2 | GO:0042534 | tumor necrosis factor biosynthetic process(GO:0042533) regulation of tumor necrosis factor biosynthetic process(GO:0042534) |
| 0.2 | 0.2 | GO:1901317 | regulation of sperm motility(GO:1901317) |
| 0.2 | 0.2 | GO:0060948 | cardiac vascular smooth muscle cell development(GO:0060948) |
| 0.2 | 1.3 | GO:1903441 | protein localization to ciliary membrane(GO:1903441) |
| 0.2 | 0.4 | GO:0060591 | chondroblast differentiation(GO:0060591) |
| 0.2 | 0.4 | GO:0030579 | ubiquitin-dependent SMAD protein catabolic process(GO:0030579) |
| 0.2 | 0.2 | GO:1902608 | regulation of large conductance calcium-activated potassium channel activity(GO:1902606) positive regulation of large conductance calcium-activated potassium channel activity(GO:1902608) |
| 0.2 | 1.1 | GO:0003334 | keratinocyte development(GO:0003334) |
| 0.2 | 0.2 | GO:0071895 | odontoblast differentiation(GO:0071895) |
| 0.2 | 0.7 | GO:0033147 | negative regulation of intracellular estrogen receptor signaling pathway(GO:0033147) |
| 0.2 | 0.4 | GO:0042078 | germ-line stem cell division(GO:0042078) male germ-line stem cell asymmetric division(GO:0048133) germline stem cell asymmetric division(GO:0098728) |
| 0.2 | 2.0 | GO:0050927 | positive regulation of positive chemotaxis(GO:0050927) |
| 0.2 | 0.4 | GO:0048680 | positive regulation of axon regeneration(GO:0048680) |
| 0.2 | 0.7 | GO:0035020 | regulation of Rac protein signal transduction(GO:0035020) |
| 0.2 | 0.4 | GO:0046836 | glycolipid transport(GO:0046836) |
| 0.2 | 0.7 | GO:0016572 | histone phosphorylation(GO:0016572) |
| 0.2 | 1.7 | GO:0016239 | positive regulation of macroautophagy(GO:0016239) |
| 0.2 | 1.1 | GO:0090084 | negative regulation of inclusion body assembly(GO:0090084) |
| 0.2 | 0.2 | GO:0030157 | pancreatic juice secretion(GO:0030157) |
| 0.2 | 1.9 | GO:0006027 | glycosaminoglycan catabolic process(GO:0006027) |
| 0.2 | 0.6 | GO:0015015 | heparan sulfate proteoglycan biosynthetic process, enzymatic modification(GO:0015015) |
| 0.2 | 0.2 | GO:2001055 | positive regulation of mesenchymal cell apoptotic process(GO:2001055) |
| 0.2 | 0.6 | GO:0016576 | histone dephosphorylation(GO:0016576) |
| 0.2 | 0.2 | GO:0051001 | negative regulation of nitric-oxide synthase activity(GO:0051001) |
| 0.2 | 0.2 | GO:0048050 | post-embryonic eye morphogenesis(GO:0048050) |
| 0.2 | 0.8 | GO:0047484 | regulation of response to osmotic stress(GO:0047484) |
| 0.2 | 1.3 | GO:2001244 | positive regulation of intrinsic apoptotic signaling pathway(GO:2001244) |
| 0.2 | 0.2 | GO:0036506 | maintenance of unfolded protein(GO:0036506) maintenance of unfolded protein involved in ERAD pathway(GO:1904378) |
| 0.2 | 2.5 | GO:0045737 | positive regulation of cyclin-dependent protein serine/threonine kinase activity(GO:0045737) |
| 0.2 | 0.8 | GO:0042953 | lipoprotein transport(GO:0042953) lipoprotein localization(GO:0044872) |
| 0.2 | 0.2 | GO:0060017 | parathyroid gland development(GO:0060017) |
| 0.2 | 0.8 | GO:0071569 | protein ufmylation(GO:0071569) protein polyufmylation(GO:1990564) protein K69-linked ufmylation(GO:1990592) |
| 0.2 | 0.4 | GO:0033684 | regulation of luteinizing hormone secretion(GO:0033684) |
| 0.2 | 0.4 | GO:1901836 | regulation of transcription of nuclear large rRNA transcript from RNA polymerase I promoter(GO:1901836) positive regulation of transcription of nuclear large rRNA transcript from RNA polymerase I promoter(GO:1901838) |
| 0.2 | 0.2 | GO:2001225 | regulation of chloride transport(GO:2001225) |
| 0.2 | 0.2 | GO:0031943 | regulation of glucocorticoid metabolic process(GO:0031943) |
| 0.2 | 0.4 | GO:1900028 | negative regulation of ruffle assembly(GO:1900028) |
| 0.2 | 0.2 | GO:0045646 | regulation of erythrocyte differentiation(GO:0045646) |
| 0.2 | 0.6 | GO:2001260 | regulation of semaphorin-plexin signaling pathway(GO:2001260) |
| 0.2 | 0.4 | GO:0050917 | sensory perception of umami taste(GO:0050917) |
| 0.2 | 0.8 | GO:0046716 | muscle cell cellular homeostasis(GO:0046716) |
| 0.2 | 0.2 | GO:0008588 | release of cytoplasmic sequestered NF-kappaB(GO:0008588) |
| 0.2 | 1.0 | GO:0016255 | attachment of GPI anchor to protein(GO:0016255) |
| 0.2 | 1.4 | GO:0006103 | 2-oxoglutarate metabolic process(GO:0006103) |
| 0.2 | 1.8 | GO:0000470 | maturation of LSU-rRNA(GO:0000470) |
| 0.2 | 1.2 | GO:0032418 | lysosome localization(GO:0032418) |
| 0.2 | 4.4 | GO:0006958 | complement activation, classical pathway(GO:0006958) |
| 0.2 | 0.2 | GO:0050926 | regulation of positive chemotaxis(GO:0050926) |
| 0.2 | 0.4 | GO:0033058 | directional locomotion(GO:0033058) |
| 0.2 | 1.4 | GO:0070166 | enamel mineralization(GO:0070166) |
| 0.2 | 0.2 | GO:0031054 | pre-miRNA processing(GO:0031054) |
| 0.2 | 1.4 | GO:0010863 | positive regulation of phospholipase C activity(GO:0010863) |
| 0.2 | 0.4 | GO:0045656 | negative regulation of monocyte differentiation(GO:0045656) |
| 0.2 | 0.6 | GO:0007320 | insemination(GO:0007320) |
| 0.2 | 0.6 | GO:2000678 | negative regulation of transcription regulatory region DNA binding(GO:2000678) |
| 0.2 | 0.2 | GO:0006533 | aspartate catabolic process(GO:0006533) |
| 0.2 | 0.4 | GO:0033080 | immature T cell proliferation in thymus(GO:0033080) regulation of immature T cell proliferation in thymus(GO:0033084) negative regulation of immature T cell proliferation in thymus(GO:0033088) |
| 0.2 | 1.6 | GO:0051923 | sulfation(GO:0051923) |
| 0.2 | 4.3 | GO:0009060 | aerobic respiration(GO:0009060) |
| 0.2 | 0.6 | GO:0090303 | positive regulation of wound healing(GO:0090303) |
| 0.2 | 0.6 | GO:0050994 | regulation of lipid catabolic process(GO:0050994) |
| 0.2 | 0.4 | GO:0070934 | CRD-mediated mRNA stabilization(GO:0070934) |
| 0.2 | 0.8 | GO:0009992 | cellular water homeostasis(GO:0009992) |
| 0.2 | 0.2 | GO:0046602 | regulation of mitotic centrosome separation(GO:0046602) |
| 0.2 | 0.2 | GO:0071294 | cellular response to zinc ion(GO:0071294) |
| 0.2 | 0.6 | GO:0060005 | vestibular reflex(GO:0060005) |
| 0.2 | 0.4 | GO:0015802 | basic amino acid transport(GO:0015802) |
| 0.2 | 0.8 | GO:1903900 | regulation of viral life cycle(GO:1903900) |
| 0.2 | 0.2 | GO:0035405 | histone-threonine phosphorylation(GO:0035405) |
| 0.2 | 0.2 | GO:0044126 | regulation of growth of symbiont in host(GO:0044126) modulation of growth of symbiont involved in interaction with host(GO:0044144) |
| 0.2 | 1.9 | GO:0016180 | snRNA processing(GO:0016180) |
| 0.2 | 0.4 | GO:0006528 | asparagine metabolic process(GO:0006528) |
| 0.2 | 0.2 | GO:0034638 | phosphatidylcholine catabolic process(GO:0034638) |
| 0.2 | 0.6 | GO:0008355 | olfactory learning(GO:0008355) |
| 0.2 | 2.5 | GO:0034587 | piRNA metabolic process(GO:0034587) |
| 0.2 | 1.1 | GO:0050830 | defense response to Gram-positive bacterium(GO:0050830) |
| 0.2 | 0.2 | GO:0006344 | maintenance of chromatin silencing(GO:0006344) |
| 0.2 | 0.2 | GO:0007501 | mesodermal cell fate specification(GO:0007501) |
| 0.2 | 0.4 | GO:0048539 | bone marrow development(GO:0048539) |
| 0.2 | 0.4 | GO:0010359 | regulation of anion channel activity(GO:0010359) |
| 0.2 | 2.6 | GO:0045746 | negative regulation of Notch signaling pathway(GO:0045746) |
| 0.2 | 0.9 | GO:0045724 | positive regulation of cilium assembly(GO:0045724) |
| 0.2 | 1.3 | GO:0045851 | pH reduction(GO:0045851) |
| 0.2 | 1.1 | GO:1900026 | positive regulation of substrate adhesion-dependent cell spreading(GO:1900026) |
| 0.2 | 0.4 | GO:0010387 | COP9 signalosome assembly(GO:0010387) |
| 0.2 | 1.3 | GO:0016226 | iron-sulfur cluster assembly(GO:0016226) metallo-sulfur cluster assembly(GO:0031163) |
| 0.2 | 0.4 | GO:0010165 | response to X-ray(GO:0010165) |
| 0.2 | 0.4 | GO:0032287 | peripheral nervous system myelin maintenance(GO:0032287) |
| 0.2 | 0.5 | GO:0001561 | fatty acid alpha-oxidation(GO:0001561) |
| 0.2 | 3.6 | GO:0006289 | nucleotide-excision repair(GO:0006289) |
| 0.2 | 0.4 | GO:0016093 | polyprenol metabolic process(GO:0016093) dolichol metabolic process(GO:0019348) |
| 0.2 | 0.2 | GO:1901979 | regulation of inward rectifier potassium channel activity(GO:1901979) |
| 0.2 | 4.6 | GO:0010501 | RNA secondary structure unwinding(GO:0010501) |
| 0.2 | 0.2 | GO:0048819 | regulation of hair follicle maturation(GO:0048819) |
| 0.2 | 0.5 | GO:0060252 | positive regulation of glial cell proliferation(GO:0060252) |
| 0.2 | 0.9 | GO:0000731 | DNA synthesis involved in DNA repair(GO:0000731) |
| 0.2 | 2.1 | GO:0007140 | male meiosis(GO:0007140) |
| 0.2 | 1.6 | GO:0050892 | intestinal absorption(GO:0050892) |
| 0.2 | 0.9 | GO:0000380 | alternative mRNA splicing, via spliceosome(GO:0000380) |
| 0.2 | 2.3 | GO:0006953 | acute-phase response(GO:0006953) |
| 0.2 | 0.7 | GO:0043551 | regulation of phosphatidylinositol 3-kinase activity(GO:0043551) |
| 0.2 | 0.7 | GO:0006656 | phosphatidylcholine biosynthetic process(GO:0006656) |
| 0.2 | 0.2 | GO:0070086 | ubiquitin-dependent endocytosis(GO:0070086) |
| 0.2 | 0.7 | GO:0006544 | glycine metabolic process(GO:0006544) |
| 0.2 | 0.2 | GO:0000056 | ribosomal small subunit export from nucleus(GO:0000056) |
| 0.2 | 0.3 | GO:0010828 | positive regulation of glucose transport(GO:0010828) |
| 0.2 | 0.5 | GO:0034316 | negative regulation of Arp2/3 complex-mediated actin nucleation(GO:0034316) |
| 0.2 | 0.2 | GO:0006301 | postreplication repair(GO:0006301) |
| 0.2 | 0.3 | GO:0071670 | smooth muscle cell chemotaxis(GO:0071670) |
| 0.2 | 0.2 | GO:0046386 | deoxyribose phosphate catabolic process(GO:0046386) |
| 0.2 | 0.3 | GO:0031063 | regulation of histone deacetylation(GO:0031063) |
| 0.2 | 0.2 | GO:0034983 | peptidyl-lysine deacetylation(GO:0034983) |
| 0.2 | 0.2 | GO:2000664 | positive regulation of interleukin-5 secretion(GO:2000664) positive regulation of interleukin-13 secretion(GO:2000667) |
| 0.2 | 0.3 | GO:0048599 | oocyte development(GO:0048599) |
| 0.2 | 0.3 | GO:0044336 | canonical Wnt signaling pathway involved in negative regulation of apoptotic process(GO:0044336) |
| 0.2 | 0.5 | GO:0045002 | double-strand break repair via single-strand annealing(GO:0045002) |
| 0.2 | 0.5 | GO:0046341 | CDP-diacylglycerol metabolic process(GO:0046341) |
| 0.2 | 0.3 | GO:0046641 | positive regulation of alpha-beta T cell proliferation(GO:0046641) |
| 0.2 | 0.8 | GO:0006268 | DNA unwinding involved in DNA replication(GO:0006268) |
| 0.2 | 0.2 | GO:0002369 | T cell cytokine production(GO:0002369) |
| 0.2 | 0.3 | GO:1902309 | negative regulation of peptidyl-serine dephosphorylation(GO:1902309) |
| 0.2 | 1.0 | GO:1904816 | positive regulation of protein localization to chromosome, telomeric region(GO:1904816) |
| 0.2 | 1.2 | GO:0034033 | nucleoside bisphosphate biosynthetic process(GO:0033866) ribonucleoside bisphosphate biosynthetic process(GO:0034030) purine nucleoside bisphosphate biosynthetic process(GO:0034033) |
| 0.2 | 0.3 | GO:0002414 | immunoglobulin transcytosis in epithelial cells(GO:0002414) |
| 0.2 | 0.7 | GO:0030206 | chondroitin sulfate biosynthetic process(GO:0030206) |
| 0.2 | 0.3 | GO:0036010 | protein localization to endosome(GO:0036010) |
| 0.2 | 0.2 | GO:0002576 | platelet degranulation(GO:0002576) |
| 0.2 | 0.3 | GO:1901873 | regulation of post-translational protein modification(GO:1901873) negative regulation of post-translational protein modification(GO:1901874) |
| 0.2 | 0.3 | GO:2000286 | receptor internalization involved in canonical Wnt signaling pathway(GO:2000286) |
| 0.2 | 0.3 | GO:2001198 | regulation of dendritic cell differentiation(GO:2001198) negative regulation of dendritic cell differentiation(GO:2001199) |
| 0.2 | 0.3 | GO:0016095 | polyprenol catabolic process(GO:0016095) |
| 0.2 | 0.2 | GO:0048563 | post-embryonic organ morphogenesis(GO:0048563) |
| 0.2 | 0.5 | GO:0045577 | regulation of B cell differentiation(GO:0045577) |
| 0.2 | 0.5 | GO:0032757 | positive regulation of interleukin-8 production(GO:0032757) |
| 0.2 | 0.3 | GO:0043415 | positive regulation of skeletal muscle tissue regeneration(GO:0043415) |
| 0.2 | 0.5 | GO:0051482 | positive regulation of cytosolic calcium ion concentration involved in phospholipase C-activating G-protein coupled signaling pathway(GO:0051482) |
| 0.2 | 0.5 | GO:0000038 | very long-chain fatty acid metabolic process(GO:0000038) |
| 0.2 | 0.2 | GO:0061009 | common bile duct development(GO:0061009) |
| 0.2 | 0.2 | GO:0031100 | organ regeneration(GO:0031100) |
| 0.2 | 0.2 | GO:0060416 | response to growth hormone(GO:0060416) |
| 0.2 | 3.1 | GO:0001824 | blastocyst development(GO:0001824) |
| 0.2 | 0.2 | GO:0045653 | negative regulation of megakaryocyte differentiation(GO:0045653) |
| 0.2 | 0.3 | GO:0048478 | replication fork protection(GO:0048478) |
| 0.2 | 0.9 | GO:1902042 | negative regulation of extrinsic apoptotic signaling pathway via death domain receptors(GO:1902042) |
| 0.2 | 2.3 | GO:0007093 | mitotic cell cycle checkpoint(GO:0007093) |
| 0.2 | 0.3 | GO:0036481 | intrinsic apoptotic signaling pathway in response to hydrogen peroxide(GO:0036481) |
| 0.2 | 0.2 | GO:0002238 | response to molecule of fungal origin(GO:0002238) |
| 0.2 | 0.5 | GO:0061084 | regulation of protein refolding(GO:0061083) negative regulation of protein refolding(GO:0061084) negative regulation of protein folding(GO:1903333) |
| 0.2 | 0.2 | GO:0051446 | positive regulation of meiotic cell cycle(GO:0051446) |
| 0.2 | 0.5 | GO:0030202 | heparin metabolic process(GO:0030202) heparin biosynthetic process(GO:0030210) |
| 0.2 | 0.3 | GO:0051560 | mitochondrial calcium ion homeostasis(GO:0051560) |
| 0.2 | 0.3 | GO:1904058 | positive regulation of sensory perception of pain(GO:1904058) |
| 0.2 | 0.3 | GO:0090360 | platelet-derived growth factor production(GO:0090360) regulation of platelet-derived growth factor production(GO:0090361) |
| 0.2 | 0.5 | GO:0070164 | negative regulation of adiponectin secretion(GO:0070164) |
| 0.2 | 2.3 | GO:0051058 | negative regulation of small GTPase mediated signal transduction(GO:0051058) |
| 0.2 | 0.9 | GO:0048009 | insulin-like growth factor receptor signaling pathway(GO:0048009) |
| 0.2 | 1.1 | GO:1901184 | regulation of ERBB signaling pathway(GO:1901184) |
| 0.2 | 1.1 | GO:0042036 | negative regulation of cytokine biosynthetic process(GO:0042036) |
| 0.2 | 0.3 | GO:0005984 | disaccharide metabolic process(GO:0005984) |
| 0.1 | 3.1 | GO:0006040 | amino sugar metabolic process(GO:0006040) |
| 0.1 | 1.0 | GO:0070207 | protein homotrimerization(GO:0070207) |
| 0.1 | 0.1 | GO:0036394 | amylase secretion(GO:0036394) |
| 0.1 | 0.3 | GO:0000727 | double-strand break repair via break-induced replication(GO:0000727) |
| 0.1 | 0.1 | GO:0002551 | mast cell chemotaxis(GO:0002551) |
| 0.1 | 0.4 | GO:0002002 | regulation of angiotensin levels in blood(GO:0002002) |
| 0.1 | 0.7 | GO:0008334 | histone mRNA metabolic process(GO:0008334) |
| 0.1 | 1.3 | GO:0014068 | positive regulation of phosphatidylinositol 3-kinase signaling(GO:0014068) |
| 0.1 | 0.3 | GO:0035865 | response to potassium ion(GO:0035864) cellular response to potassium ion(GO:0035865) |
| 0.1 | 0.7 | GO:0043388 | positive regulation of DNA binding(GO:0043388) |
| 0.1 | 0.4 | GO:0000055 | ribosomal large subunit export from nucleus(GO:0000055) |
| 0.1 | 0.1 | GO:1902430 | negative regulation of beta-amyloid formation(GO:1902430) negative regulation of amyloid precursor protein catabolic process(GO:1902992) |
| 0.1 | 0.6 | GO:0043206 | extracellular fibril organization(GO:0043206) |
| 0.1 | 0.1 | GO:0014827 | intestine smooth muscle contraction(GO:0014827) |
| 0.1 | 0.1 | GO:0043101 | purine-containing compound salvage(GO:0043101) |
| 0.1 | 0.1 | GO:0034397 | telomere localization(GO:0034397) chromosome localization to nuclear envelope involved in homologous chromosome segregation(GO:0090220) |
| 0.1 | 0.1 | GO:0071276 | cellular response to cadmium ion(GO:0071276) |
| 0.1 | 0.4 | GO:0006884 | cell volume homeostasis(GO:0006884) |
| 0.1 | 3.2 | GO:0000725 | double-strand break repair via homologous recombination(GO:0000724) recombinational repair(GO:0000725) |
| 0.1 | 0.1 | GO:0003419 | growth plate cartilage chondrocyte proliferation(GO:0003419) |
| 0.1 | 3.8 | GO:0035383 | acyl-CoA metabolic process(GO:0006637) thioester metabolic process(GO:0035383) |
| 0.1 | 1.3 | GO:0031397 | negative regulation of protein ubiquitination(GO:0031397) |
| 0.1 | 1.0 | GO:0016926 | protein desumoylation(GO:0016926) |
| 0.1 | 0.4 | GO:1902261 | positive regulation of delayed rectifier potassium channel activity(GO:1902261) positive regulation of voltage-gated potassium channel activity(GO:1903818) |
| 0.1 | 0.4 | GO:2001012 | mesenchymal cell differentiation involved in kidney development(GO:0072161) mesenchymal cell differentiation involved in renal system development(GO:2001012) |
| 0.1 | 8.1 | GO:0043484 | regulation of RNA splicing(GO:0043484) |
| 0.1 | 1.2 | GO:0060575 | intestinal epithelial cell differentiation(GO:0060575) |
| 0.1 | 0.3 | GO:1902031 | regulation of NADP metabolic process(GO:1902031) |
| 0.1 | 0.1 | GO:0070972 | protein localization to endoplasmic reticulum(GO:0070972) |
| 0.1 | 0.1 | GO:1902809 | regulation of skeletal muscle fiber differentiation(GO:1902809) |
| 0.1 | 1.6 | GO:0051220 | cytoplasmic sequestering of protein(GO:0051220) |
| 0.1 | 0.1 | GO:0034505 | tooth mineralization(GO:0034505) |
| 0.1 | 0.1 | GO:0071455 | cellular response to increased oxygen levels(GO:0036295) cellular response to hyperoxia(GO:0071455) |
| 0.1 | 0.4 | GO:0042635 | positive regulation of hair cycle(GO:0042635) |
| 0.1 | 0.4 | GO:0045760 | positive regulation of action potential(GO:0045760) |
| 0.1 | 0.1 | GO:0032570 | response to progesterone(GO:0032570) |
| 0.1 | 1.1 | GO:0043489 | RNA stabilization(GO:0043489) |
| 0.1 | 0.1 | GO:0070189 | kynurenine metabolic process(GO:0070189) |
| 0.1 | 0.7 | GO:0034121 | regulation of toll-like receptor signaling pathway(GO:0034121) |
| 0.1 | 0.1 | GO:2001032 | regulation of double-strand break repair via nonhomologous end joining(GO:2001032) |
| 0.1 | 0.8 | GO:0006308 | DNA catabolic process(GO:0006308) |
| 0.1 | 2.6 | GO:0009812 | flavonoid metabolic process(GO:0009812) flavonoid biosynthetic process(GO:0009813) flavonoid glucuronidation(GO:0052696) |
| 0.1 | 1.2 | GO:0007032 | endosome organization(GO:0007032) |
| 0.1 | 0.4 | GO:0048934 | peripheral nervous system neuron differentiation(GO:0048934) peripheral nervous system neuron development(GO:0048935) |
| 0.1 | 0.4 | GO:0090026 | positive regulation of monocyte chemotaxis(GO:0090026) |
| 0.1 | 0.1 | GO:0090080 | positive regulation of MAPKKK cascade by fibroblast growth factor receptor signaling pathway(GO:0090080) |
| 0.1 | 0.3 | GO:0051702 | interaction with symbiont(GO:0051702) |
| 0.1 | 0.6 | GO:0042904 | 9-cis-retinoic acid biosynthetic process(GO:0042904) 9-cis-retinoic acid metabolic process(GO:0042905) |
| 0.1 | 0.4 | GO:0035646 | endosome to melanosome transport(GO:0035646) endosome to pigment granule transport(GO:0043485) pigment granule maturation(GO:0048757) |
| 0.1 | 0.9 | GO:0000079 | regulation of cyclin-dependent protein serine/threonine kinase activity(GO:0000079) |
| 0.1 | 0.5 | GO:0046085 | adenosine metabolic process(GO:0046085) |
| 0.1 | 0.1 | GO:2000049 | positive regulation of cell-cell adhesion mediated by cadherin(GO:2000049) |
| 0.1 | 0.5 | GO:0006056 | cell wall mannoprotein biosynthetic process(GO:0000032) mannoprotein metabolic process(GO:0006056) mannoprotein biosynthetic process(GO:0006057) cell wall glycoprotein biosynthetic process(GO:0031506) cell wall biogenesis(GO:0042546) cell wall macromolecule metabolic process(GO:0044036) cell wall macromolecule biosynthetic process(GO:0044038) chain elongation of O-linked mannose residue(GO:0044845) cellular component macromolecule biosynthetic process(GO:0070589) cell wall organization or biogenesis(GO:0071554) |
| 0.1 | 0.4 | GO:0007199 | G-protein coupled receptor signaling pathway coupled to cGMP nucleotide second messenger(GO:0007199) |
| 0.1 | 0.6 | GO:0008630 | intrinsic apoptotic signaling pathway in response to DNA damage(GO:0008630) |
| 0.1 | 0.4 | GO:0046519 | sphingoid metabolic process(GO:0046519) |
| 0.1 | 0.2 | GO:2000058 | regulation of protein ubiquitination involved in ubiquitin-dependent protein catabolic process(GO:2000058) |
| 0.1 | 0.4 | GO:1901374 | acetylcholine transport(GO:0015870) acetate ester transport(GO:1901374) |
| 0.1 | 0.1 | GO:0006266 | DNA ligation(GO:0006266) |
| 0.1 | 1.7 | GO:0007274 | neuromuscular synaptic transmission(GO:0007274) |
| 0.1 | 1.6 | GO:0045109 | intermediate filament organization(GO:0045109) |
| 0.1 | 0.2 | GO:0051026 | chiasma assembly(GO:0051026) |
| 0.1 | 0.2 | GO:0034695 | response to prostaglandin E(GO:0034695) |
| 0.1 | 0.1 | GO:0030908 | intein-mediated protein splicing(GO:0016539) protein splicing(GO:0030908) |
| 0.1 | 1.3 | GO:0048144 | fibroblast proliferation(GO:0048144) |
| 0.1 | 0.6 | GO:0006488 | dolichol-linked oligosaccharide biosynthetic process(GO:0006488) |
| 0.1 | 0.7 | GO:0006379 | mRNA cleavage(GO:0006379) |
| 0.1 | 0.6 | GO:0000070 | mitotic sister chromatid segregation(GO:0000070) |
| 0.1 | 0.5 | GO:0051533 | positive regulation of NFAT protein import into nucleus(GO:0051533) |
| 0.1 | 0.1 | GO:0007494 | midgut development(GO:0007494) |
| 0.1 | 0.1 | GO:0034661 | ncRNA catabolic process(GO:0034661) |
| 0.1 | 1.2 | GO:0070534 | protein K63-linked ubiquitination(GO:0070534) |
| 0.1 | 4.5 | GO:0008643 | carbohydrate transport(GO:0008643) |
| 0.1 | 0.5 | GO:0045103 | intermediate filament-based process(GO:0045103) |
| 0.1 | 0.4 | GO:0045986 | negative regulation of smooth muscle contraction(GO:0045986) |
| 0.1 | 0.1 | GO:1903846 | positive regulation of transforming growth factor beta receptor signaling pathway(GO:0030511) positive regulation of cellular response to transforming growth factor beta stimulus(GO:1903846) |
| 0.1 | 0.1 | GO:2000698 | positive regulation of epithelial cell differentiation involved in kidney development(GO:2000698) |
| 0.1 | 0.6 | GO:0044246 | regulation of multicellular organismal metabolic process(GO:0044246) |
| 0.1 | 0.1 | GO:0035092 | sperm chromatin condensation(GO:0035092) |
| 0.1 | 0.1 | GO:0043302 | positive regulation of leukocyte degranulation(GO:0043302) |
| 0.1 | 0.2 | GO:0002322 | B cell proliferation involved in immune response(GO:0002322) |
| 0.1 | 0.1 | GO:0015840 | urea transport(GO:0015840) |
| 0.1 | 0.1 | GO:0002248 | connective tissue replacement involved in inflammatory response wound healing(GO:0002248) connective tissue replacement(GO:0097709) |
| 0.1 | 0.1 | GO:0035963 | response to interleukin-13(GO:0035962) cellular response to interleukin-13(GO:0035963) |
| 0.1 | 0.2 | GO:0001913 | T cell mediated cytotoxicity(GO:0001913) |
| 0.1 | 0.2 | GO:0031642 | negative regulation of myelination(GO:0031642) |
| 0.1 | 0.1 | GO:0070318 | positive regulation of G0 to G1 transition(GO:0070318) |
| 0.1 | 0.2 | GO:0046929 | negative regulation of neurotransmitter secretion(GO:0046929) |
| 0.1 | 0.1 | GO:2000323 | negative regulation of glucocorticoid receptor signaling pathway(GO:2000323) |
| 0.1 | 0.2 | GO:0030718 | germ-line stem cell population maintenance(GO:0030718) |
| 0.1 | 0.1 | GO:0032439 | endosome localization(GO:0032439) |
| 0.1 | 0.2 | GO:0051299 | centrosome separation(GO:0051299) |
| 0.1 | 0.1 | GO:0035507 | regulation of myosin-light-chain-phosphatase activity(GO:0035507) |
| 0.1 | 0.1 | GO:2000836 | androgen secretion(GO:0035935) regulation of androgen secretion(GO:2000834) positive regulation of androgen secretion(GO:2000836) |
| 0.1 | 0.2 | GO:0007021 | tubulin complex assembly(GO:0007021) |
| 0.1 | 0.1 | GO:0072224 | metanephric glomerulus development(GO:0072224) |
| 0.1 | 0.1 | GO:0044332 | Wnt signaling pathway involved in dorsal/ventral axis specification(GO:0044332) |
| 0.1 | 0.1 | GO:0032462 | regulation of protein homooligomerization(GO:0032462) |
| 0.1 | 0.1 | GO:0050710 | negative regulation of cytokine secretion(GO:0050710) |
| 0.1 | 0.1 | GO:1904429 | regulation of t-circle formation(GO:1904429) positive regulation of t-circle formation(GO:1904431) |
| 0.1 | 0.4 | GO:0071168 | protein localization to chromatin(GO:0071168) |
| 0.1 | 1.0 | GO:0006220 | pyrimidine nucleotide metabolic process(GO:0006220) |
| 0.1 | 0.5 | GO:0030539 | male genitalia development(GO:0030539) |
| 0.1 | 0.7 | GO:0007213 | G-protein coupled acetylcholine receptor signaling pathway(GO:0007213) |
| 0.1 | 0.2 | GO:0015884 | folic acid transport(GO:0015884) |
| 0.1 | 0.4 | GO:0008616 | queuosine biosynthetic process(GO:0008616) queuosine metabolic process(GO:0046116) |
| 0.1 | 1.3 | GO:0021591 | ventricular system development(GO:0021591) |
| 0.1 | 0.1 | GO:0050779 | RNA destabilization(GO:0050779) |
| 0.1 | 0.2 | GO:0042088 | T-helper 1 type immune response(GO:0042088) |
| 0.1 | 0.1 | GO:2000680 | regulation of rubidium ion transport(GO:2000680) |
| 0.1 | 0.3 | GO:1903321 | negative regulation of protein modification by small protein conjugation or removal(GO:1903321) |
| 0.1 | 0.3 | GO:0006693 | prostanoid metabolic process(GO:0006692) prostaglandin metabolic process(GO:0006693) |
| 0.1 | 0.4 | GO:0033280 | response to vitamin D(GO:0033280) |
| 0.1 | 0.7 | GO:0048490 | anterograde synaptic vesicle transport(GO:0048490) synaptic vesicle cytoskeletal transport(GO:0099514) synaptic vesicle transport along microtubule(GO:0099517) |
| 0.1 | 0.4 | GO:1904491 | protein localization to ciliary transition zone(GO:1904491) |
| 0.1 | 0.1 | GO:0086023 | adrenergic receptor signaling pathway involved in heart process(GO:0086023) |
| 0.1 | 0.2 | GO:0046599 | regulation of centriole replication(GO:0046599) |
| 0.1 | 0.2 | GO:2000255 | negative regulation of male germ cell proliferation(GO:2000255) |
| 0.1 | 0.2 | GO:0000447 | endonucleolytic cleavage in ITS1 to separate SSU-rRNA from 5.8S rRNA and LSU-rRNA from tricistronic rRNA transcript (SSU-rRNA, 5.8S rRNA, LSU-rRNA)(GO:0000447) |
| 0.1 | 0.4 | GO:0009235 | cobalamin metabolic process(GO:0009235) |
| 0.1 | 0.1 | GO:0030997 | regulation of centriole-centriole cohesion(GO:0030997) |
| 0.1 | 0.5 | GO:0000338 | protein deneddylation(GO:0000338) |
| 0.1 | 0.4 | GO:0000469 | cleavage involved in rRNA processing(GO:0000469) |
| 0.1 | 0.3 | GO:0031581 | hemidesmosome assembly(GO:0031581) |
| 0.1 | 0.1 | GO:0035880 | embryonic nail plate morphogenesis(GO:0035880) |
| 0.1 | 0.1 | GO:0043985 | histone H4-R3 methylation(GO:0043985) |
| 0.1 | 0.6 | GO:0070306 | lens fiber cell differentiation(GO:0070306) |
| 0.1 | 0.3 | GO:0032469 | endoplasmic reticulum calcium ion homeostasis(GO:0032469) |
| 0.1 | 0.1 | GO:0042637 | catagen(GO:0042637) |
| 0.1 | 0.3 | GO:0070071 | proton-transporting two-sector ATPase complex assembly(GO:0070071) |
| 0.1 | 0.8 | GO:0071875 | adrenergic receptor signaling pathway(GO:0071875) |
| 0.1 | 0.5 | GO:0043616 | keratinocyte proliferation(GO:0043616) |
| 0.1 | 0.1 | GO:0001698 | gastrin-induced gastric acid secretion(GO:0001698) |
| 0.1 | 0.5 | GO:0070525 | tRNA threonylcarbamoyladenosine metabolic process(GO:0070525) |
| 0.1 | 0.1 | GO:0035995 | detection of muscle stretch(GO:0035995) |
| 0.1 | 0.1 | GO:0015682 | ferric iron transport(GO:0015682) trivalent inorganic cation transport(GO:0072512) |
| 0.1 | 0.1 | GO:0042116 | macrophage activation(GO:0042116) |
| 0.1 | 0.4 | GO:0018103 | protein C-linked glycosylation(GO:0018103) peptidyl-tryptophan modification(GO:0018211) protein C-linked glycosylation via tryptophan(GO:0018317) protein C-linked glycosylation via 2'-alpha-mannosyl-L-tryptophan(GO:0018406) |
| 0.1 | 0.1 | GO:0070286 | axonemal dynein complex assembly(GO:0070286) |
| 0.1 | 0.1 | GO:0007195 | adenylate cyclase-inhibiting dopamine receptor signaling pathway(GO:0007195) |
| 0.1 | 2.2 | GO:0098840 | protein transport along microtubule(GO:0098840) |
| 0.1 | 0.1 | GO:0060298 | positive regulation of sarcomere organization(GO:0060298) |
| 0.1 | 0.2 | GO:0019673 | GDP-mannose metabolic process(GO:0019673) |
| 0.1 | 0.3 | GO:0001867 | complement activation, lectin pathway(GO:0001867) |
| 0.1 | 0.5 | GO:0042159 | lipoprotein catabolic process(GO:0042159) |
| 0.1 | 0.1 | GO:2000344 | positive regulation of acrosome reaction(GO:2000344) |
| 0.1 | 0.2 | GO:0009186 | deoxyribonucleoside diphosphate metabolic process(GO:0009186) |
| 0.1 | 0.3 | GO:0071356 | cellular response to tumor necrosis factor(GO:0071356) |
| 0.1 | 0.1 | GO:0009134 | nucleoside diphosphate catabolic process(GO:0009134) |
| 0.1 | 0.4 | GO:0006826 | iron ion transport(GO:0006826) |
| 0.1 | 0.1 | GO:0033033 | negative regulation of myeloid cell apoptotic process(GO:0033033) |
| 0.1 | 0.1 | GO:0009146 | purine nucleoside triphosphate catabolic process(GO:0009146) |
| 0.1 | 0.2 | GO:0032695 | negative regulation of interleukin-12 production(GO:0032695) |
| 0.1 | 0.1 | GO:0042726 | flavin-containing compound metabolic process(GO:0042726) |
| 0.1 | 0.2 | GO:0071596 | ubiquitin-dependent protein catabolic process via the N-end rule pathway(GO:0071596) |
| 0.1 | 0.3 | GO:0007007 | inner mitochondrial membrane organization(GO:0007007) |
| 0.1 | 0.1 | GO:0061343 | cell adhesion involved in heart morphogenesis(GO:0061343) |
| 0.1 | 0.7 | GO:0051602 | response to electrical stimulus(GO:0051602) |
| 0.1 | 0.5 | GO:0051124 | synaptic growth at neuromuscular junction(GO:0051124) |
| 0.1 | 0.1 | GO:0006688 | glycosphingolipid biosynthetic process(GO:0006688) |
| 0.1 | 0.2 | GO:0045078 | positive regulation of interferon-gamma biosynthetic process(GO:0045078) |
| 0.1 | 0.1 | GO:0072677 | eosinophil migration(GO:0072677) |
| 0.1 | 1.1 | GO:0006487 | protein N-linked glycosylation(GO:0006487) |
| 0.1 | 0.2 | GO:0043545 | Mo-molybdopterin cofactor biosynthetic process(GO:0006777) Mo-molybdopterin cofactor metabolic process(GO:0019720) molybdopterin cofactor biosynthetic process(GO:0032324) molybdopterin cofactor metabolic process(GO:0043545) prosthetic group metabolic process(GO:0051189) |
| 0.1 | 0.1 | GO:0006532 | aspartate biosynthetic process(GO:0006532) |
| 0.1 | 1.5 | GO:0035036 | cell-cell recognition(GO:0009988) sperm-egg recognition(GO:0035036) |
| 0.1 | 0.1 | GO:0070206 | protein trimerization(GO:0070206) |
| 0.1 | 0.2 | GO:0042108 | positive regulation of cytokine biosynthetic process(GO:0042108) |
| 0.1 | 0.2 | GO:0015744 | succinate transport(GO:0015744) |
| 0.1 | 0.1 | GO:0003348 | cardiac endothelial cell differentiation(GO:0003348) |
| 0.1 | 0.1 | GO:1902253 | regulation of intrinsic apoptotic signaling pathway by p53 class mediator(GO:1902253) |
| 0.1 | 1.0 | GO:0006694 | steroid biosynthetic process(GO:0006694) |
| 0.1 | 0.1 | GO:0006706 | steroid catabolic process(GO:0006706) |
| 0.1 | 0.1 | GO:0002689 | negative regulation of leukocyte chemotaxis(GO:0002689) |
| 0.1 | 2.2 | GO:0032543 | mitochondrial translation(GO:0032543) |
| 0.1 | 0.2 | GO:0046475 | glycerophospholipid catabolic process(GO:0046475) |
| 0.1 | 0.3 | GO:0048011 | neurotrophin TRK receptor signaling pathway(GO:0048011) |
| 0.1 | 0.1 | GO:0003415 | chondrocyte hypertrophy(GO:0003415) |
| 0.1 | 0.1 | GO:0031440 | regulation of mRNA 3'-end processing(GO:0031440) |
| 0.1 | 0.1 | GO:0008343 | adult feeding behavior(GO:0008343) |
| 0.1 | 14.1 | GO:0048232 | spermatogenesis(GO:0007283) male gamete generation(GO:0048232) |
| 0.1 | 0.1 | GO:0002183 | cytoplasmic translational initiation(GO:0002183) |
| 0.1 | 0.1 | GO:0007343 | egg activation(GO:0007343) |
| 0.1 | 0.5 | GO:0015721 | bile acid and bile salt transport(GO:0015721) |
| 0.1 | 0.1 | GO:0006521 | regulation of glutamine family amino acid metabolic process(GO:0000820) regulation of cellular amino acid metabolic process(GO:0006521) |
| 0.1 | 0.2 | GO:0051445 | regulation of meiotic cell cycle(GO:0051445) |
| 0.1 | 0.4 | GO:0070542 | response to fatty acid(GO:0070542) |
| 0.1 | 0.1 | GO:0006122 | mitochondrial electron transport, ubiquinol to cytochrome c(GO:0006122) |
| 0.1 | 0.3 | GO:0042795 | snRNA transcription(GO:0009301) snRNA transcription from RNA polymerase II promoter(GO:0042795) |
| 0.1 | 0.1 | GO:0001773 | myeloid dendritic cell activation(GO:0001773) |
| 0.1 | 1.1 | GO:0018345 | protein palmitoylation(GO:0018345) |
| 0.1 | 0.1 | GO:0010446 | response to alkaline pH(GO:0010446) |
| 0.1 | 0.2 | GO:0021615 | glossopharyngeal nerve morphogenesis(GO:0021615) |
| 0.1 | 0.1 | GO:0044860 | protein localization to plasma membrane raft(GO:0044860) |
| 0.1 | 0.1 | GO:0060920 | cardiac pacemaker cell differentiation(GO:0060920) |
| 0.1 | 0.1 | GO:0008635 | activation of cysteine-type endopeptidase activity involved in apoptotic process by cytochrome c(GO:0008635) |
| 0.1 | 0.1 | GO:0006069 | ethanol metabolic process(GO:0006067) ethanol oxidation(GO:0006069) |
| 0.1 | 0.2 | GO:0034653 | diterpenoid catabolic process(GO:0016103) retinoic acid catabolic process(GO:0034653) |
| 0.1 | 0.1 | GO:0055003 | cardiac myofibril assembly(GO:0055003) |
| 0.1 | 0.6 | GO:0002763 | positive regulation of myeloid leukocyte differentiation(GO:0002763) |
| 0.1 | 0.1 | GO:0071280 | cellular response to copper ion(GO:0071280) |
| 0.1 | 0.1 | GO:1901894 | regulation of calcium-transporting ATPase activity(GO:1901894) |
| 0.1 | 0.1 | GO:0090493 | catecholamine uptake(GO:0090493) dopamine uptake(GO:0090494) |
| 0.1 | 0.2 | GO:0007084 | mitotic nuclear envelope reassembly(GO:0007084) |
| 0.1 | 1.4 | GO:0002181 | cytoplasmic translation(GO:0002181) |
| 0.1 | 0.1 | GO:1904029 | regulation of cyclin-dependent protein kinase activity(GO:1904029) |
| 0.1 | 0.1 | GO:0042435 | indole-containing compound biosynthetic process(GO:0042435) |
| 0.1 | 0.1 | GO:0021569 | rhombomere 3 development(GO:0021569) |
| 0.1 | 0.2 | GO:0043374 | CD8-positive, alpha-beta T cell differentiation(GO:0043374) |
| 0.1 | 0.1 | GO:0042634 | regulation of hair cycle(GO:0042634) |
| 0.1 | 0.1 | GO:0002767 | immune response-inhibiting cell surface receptor signaling pathway(GO:0002767) |
| 0.1 | 1.2 | GO:0071391 | cellular response to estrogen stimulus(GO:0071391) |
| 0.1 | 0.1 | GO:0051546 | keratinocyte migration(GO:0051546) |
| 0.1 | 0.1 | GO:0031268 | pseudopodium organization(GO:0031268) |
| 0.1 | 0.1 | GO:0060143 | regulation of syncytium formation by plasma membrane fusion(GO:0060142) positive regulation of syncytium formation by plasma membrane fusion(GO:0060143) |
| 0.1 | 0.2 | GO:0002760 | positive regulation of antimicrobial peptide production(GO:0002225) positive regulation of antimicrobial humoral response(GO:0002760) positive regulation of antibacterial peptide production(GO:0002803) |
| 0.1 | 0.1 | GO:0035166 | post-embryonic hemopoiesis(GO:0035166) |
| 0.1 | 0.1 | GO:0021773 | striatal medium spiny neuron differentiation(GO:0021773) |
| 0.1 | 0.2 | GO:0060314 | regulation of ryanodine-sensitive calcium-release channel activity(GO:0060314) |
| 0.1 | 0.1 | GO:0032815 | negative regulation of natural killer cell activation(GO:0032815) |
| 0.1 | 0.1 | GO:0042492 | gamma-delta T cell differentiation(GO:0042492) |
| 0.1 | 0.2 | GO:0060075 | regulation of resting membrane potential(GO:0060075) |
| 0.1 | 0.5 | GO:0050891 | multicellular organismal water homeostasis(GO:0050891) |
| 0.1 | 0.2 | GO:0006729 | tetrahydrobiopterin biosynthetic process(GO:0006729) |
| 0.1 | 0.4 | GO:0042481 | regulation of odontogenesis(GO:0042481) |
| 0.1 | 0.1 | GO:0007181 | transforming growth factor beta receptor complex assembly(GO:0007181) |
| 0.1 | 0.4 | GO:0031629 | synaptic vesicle fusion to presynaptic active zone membrane(GO:0031629) vesicle fusion to plasma membrane(GO:0099500) |
| 0.1 | 0.1 | GO:0019372 | lipoxygenase pathway(GO:0019372) |
| 0.1 | 0.2 | GO:0046958 | nonassociative learning(GO:0046958) |
| 0.1 | 0.3 | GO:0051125 | regulation of actin nucleation(GO:0051125) |
| 0.1 | 0.2 | GO:0097306 | cellular response to alcohol(GO:0097306) |
| 0.1 | 0.9 | GO:0016125 | sterol metabolic process(GO:0016125) |
| 0.1 | 0.3 | GO:0006879 | cellular iron ion homeostasis(GO:0006879) |
| 0.0 | 0.1 | GO:0006703 | estrogen biosynthetic process(GO:0006703) |
| 0.0 | 0.0 | GO:2000327 | regulation of ligand-dependent nuclear receptor transcription coactivator activity(GO:2000325) positive regulation of ligand-dependent nuclear receptor transcription coactivator activity(GO:2000327) |
| 0.0 | 0.0 | GO:0019724 | B cell mediated immunity(GO:0019724) |
| 0.0 | 0.1 | GO:0001560 | regulation of cell growth by extracellular stimulus(GO:0001560) |
| 0.0 | 0.0 | GO:0002455 | humoral immune response mediated by circulating immunoglobulin(GO:0002455) |
| 0.0 | 0.2 | GO:0072376 | protein activation cascade(GO:0072376) |
| 0.0 | 0.1 | GO:0060216 | definitive hemopoiesis(GO:0060216) |
| 0.0 | 0.0 | GO:0002086 | diaphragm contraction(GO:0002086) |
| 0.0 | 0.1 | GO:0007468 | regulation of rhodopsin gene expression(GO:0007468) |
| 0.0 | 0.0 | GO:2000474 | regulation of opioid receptor signaling pathway(GO:2000474) |
| 0.0 | 0.2 | GO:0002082 | regulation of oxidative phosphorylation(GO:0002082) |
| 0.0 | 0.2 | GO:0006474 | N-terminal protein amino acid acetylation(GO:0006474) |
| 0.0 | 0.0 | GO:0060452 | positive regulation of striated muscle contraction(GO:0045989) positive regulation of cardiac muscle contraction(GO:0060452) |
| 0.0 | 0.0 | GO:1900738 | regulation of phospholipase C-activating G-protein coupled receptor signaling pathway(GO:1900736) positive regulation of phospholipase C-activating G-protein coupled receptor signaling pathway(GO:1900738) |
| 0.0 | 0.2 | GO:0000460 | maturation of 5.8S rRNA(GO:0000460) |
| 0.0 | 0.1 | GO:0000103 | sulfate assimilation(GO:0000103) |
| 0.0 | 0.4 | GO:0032355 | response to estradiol(GO:0032355) |
| 0.0 | 0.4 | GO:0032527 | protein exit from endoplasmic reticulum(GO:0032527) |
| 0.0 | 0.0 | GO:0008065 | establishment of blood-nerve barrier(GO:0008065) |
| 0.0 | 0.1 | GO:0001957 | intramembranous ossification(GO:0001957) direct ossification(GO:0036072) |
| 0.0 | 0.0 | GO:0061055 | myotome development(GO:0061055) |
| 0.0 | 0.2 | GO:0031061 | negative regulation of histone methylation(GO:0031061) |
| 0.0 | 0.2 | GO:0016447 | somatic recombination of immunoglobulin gene segments(GO:0016447) |
| 0.0 | 0.0 | GO:0033574 | response to testosterone(GO:0033574) |
| 0.0 | 0.0 | GO:0009650 | UV protection(GO:0009650) |
| 0.0 | 2.8 | GO:0042742 | defense response to bacterium(GO:0042742) |
| 0.0 | 0.1 | GO:0050965 | detection of temperature stimulus involved in sensory perception(GO:0050961) detection of temperature stimulus involved in sensory perception of pain(GO:0050965) |
| 0.0 | 0.1 | GO:1902775 | mitochondrial ribosome assembly(GO:0061668) mitochondrial large ribosomal subunit assembly(GO:1902775) |
| 0.0 | 0.0 | GO:0021571 | rhombomere 5 development(GO:0021571) |
| 0.0 | 0.0 | GO:0031033 | myosin filament organization(GO:0031033) myosin filament assembly(GO:0031034) |
| 0.0 | 0.1 | GO:0048715 | negative regulation of oligodendrocyte differentiation(GO:0048715) |
| 0.0 | 0.1 | GO:0090315 | negative regulation of protein targeting to membrane(GO:0090315) |
| 0.0 | 0.0 | GO:1900121 | negative regulation of receptor binding(GO:1900121) |
| 0.0 | 0.1 | GO:0035610 | protein deglutamylation(GO:0035608) protein side chain deglutamylation(GO:0035610) |
| 0.0 | 0.1 | GO:0009620 | response to fungus(GO:0009620) |
| 0.0 | 0.0 | GO:0048569 | post-embryonic organ development(GO:0048569) |
| 0.0 | 0.0 | GO:1901299 | negative regulation of hydrogen peroxide-mediated programmed cell death(GO:1901299) |
| 0.0 | 0.0 | GO:0006691 | leukotriene metabolic process(GO:0006691) |
| 0.0 | 0.3 | GO:0098781 | ncRNA transcription(GO:0098781) |
| 0.0 | 0.1 | GO:0097006 | regulation of plasma lipoprotein particle levels(GO:0097006) |
| 0.0 | 3.9 | GO:0019236 | response to pheromone(GO:0019236) |
| 0.0 | 0.2 | GO:0051281 | positive regulation of release of sequestered calcium ion into cytosol(GO:0051281) |
| 0.0 | 0.0 | GO:0001845 | phagolysosome assembly(GO:0001845) |
| 0.0 | 0.0 | GO:0019730 | antimicrobial humoral response(GO:0019730) |
| 0.0 | 0.0 | GO:0001574 | ganglioside biosynthetic process(GO:0001574) |
| 0.0 | 0.1 | GO:0009642 | response to light intensity(GO:0009642) |
| 0.0 | 0.4 | GO:0014823 | response to activity(GO:0014823) |
| 0.0 | 0.1 | GO:0070192 | chromosome organization involved in meiotic cell cycle(GO:0070192) |
| 0.0 | 0.0 | GO:0006285 | base-excision repair, AP site formation(GO:0006285) |
| 0.0 | 0.0 | GO:0032435 | negative regulation of proteasomal ubiquitin-dependent protein catabolic process(GO:0032435) |
| 0.0 | 1.9 | GO:0007051 | spindle organization(GO:0007051) |
| 0.0 | 0.1 | GO:0090161 | Golgi ribbon formation(GO:0090161) |
| 0.0 | 0.1 | GO:0070345 | negative regulation of fat cell proliferation(GO:0070345) |
| 0.0 | 0.1 | GO:0045838 | positive regulation of membrane potential(GO:0045838) |
| 0.0 | 0.1 | GO:0043416 | regulation of skeletal muscle tissue regeneration(GO:0043416) |
| 0.0 | 0.1 | GO:0042640 | anagen(GO:0042640) |
| 0.0 | 0.1 | GO:0006627 | protein processing involved in protein targeting to mitochondrion(GO:0006627) mitochondrial protein processing(GO:0034982) |
| 0.0 | 0.0 | GO:0060527 | prostate glandular acinus morphogenesis(GO:0060526) prostate epithelial cord arborization involved in prostate glandular acinus morphogenesis(GO:0060527) |
| 0.0 | 0.0 | GO:0007621 | negative regulation of female receptivity(GO:0007621) |
| 0.0 | 0.1 | GO:0008211 | glucocorticoid metabolic process(GO:0008211) |
| 0.0 | 0.0 | GO:0044406 | adhesion of symbiont to host(GO:0044406) |
| 0.0 | 0.1 | GO:1903963 | arachidonic acid secretion(GO:0050482) arachidonate transport(GO:1903963) |
| 0.0 | 0.0 | GO:0032655 | regulation of interleukin-12 production(GO:0032655) |
| 0.0 | 0.1 | GO:0071873 | response to norepinephrine(GO:0071873) |
| 0.0 | 0.0 | GO:0032025 | response to cobalt ion(GO:0032025) |
| 0.0 | 0.1 | GO:0046292 | formaldehyde metabolic process(GO:0046292) |
| 0.0 | 0.1 | GO:0098535 | de novo centriole assembly(GO:0098535) |
| 0.0 | 0.0 | GO:0036093 | germ cell proliferation(GO:0036093) |
| 0.0 | 0.0 | GO:1903301 | positive regulation of hexokinase activity(GO:1903301) |
| 0.0 | 0.0 | GO:0048711 | positive regulation of astrocyte differentiation(GO:0048711) |
| 0.0 | 0.0 | GO:0030259 | lipid glycosylation(GO:0030259) |
| 0.0 | 0.0 | GO:0014072 | response to isoquinoline alkaloid(GO:0014072) response to morphine(GO:0043278) |
| 0.0 | 0.0 | GO:0006015 | 5-phosphoribose 1-diphosphate biosynthetic process(GO:0006015) 5-phosphoribose 1-diphosphate metabolic process(GO:0046391) |
| 0.0 | 0.0 | GO:0033194 | response to hydroperoxide(GO:0033194) |
| 0.0 | 0.0 | GO:0046851 | negative regulation of bone resorption(GO:0045779) negative regulation of bone remodeling(GO:0046851) |
| 0.0 | 0.0 | GO:0043045 | DNA methylation involved in embryo development(GO:0043045) changes to DNA methylation involved in embryo development(GO:1901538) |
| 0.0 | 2.0 | GO:0010466 | negative regulation of peptidase activity(GO:0010466) |
| 0.0 | 0.1 | GO:0001659 | temperature homeostasis(GO:0001659) |
| 0.0 | 0.0 | GO:0051055 | negative regulation of lipid biosynthetic process(GO:0051055) |
| 0.0 | 0.0 | GO:0044340 | canonical Wnt signaling pathway involved in regulation of cell proliferation(GO:0044340) |
| 0.0 | 0.5 | GO:0019373 | epoxygenase P450 pathway(GO:0019373) |
| 0.0 | 0.0 | GO:0052803 | imidazole-containing compound metabolic process(GO:0052803) |
| 0.0 | 0.1 | GO:0060707 | trophoblast giant cell differentiation(GO:0060707) |
| 0.0 | 0.0 | GO:0051365 | cellular response to potassium ion starvation(GO:0051365) |
| 0.0 | 0.0 | GO:2000465 | regulation of glycogen (starch) synthase activity(GO:2000465) |
| 0.0 | 0.3 | GO:0030168 | platelet activation(GO:0030168) |
| 0.0 | 0.0 | GO:1902175 | regulation of oxidative stress-induced intrinsic apoptotic signaling pathway(GO:1902175) |
| 0.0 | 0.0 | GO:0006600 | creatine metabolic process(GO:0006600) |
| 0.0 | 0.1 | GO:0071260 | cellular response to mechanical stimulus(GO:0071260) |
| 0.0 | 0.0 | GO:0010948 | negative regulation of cell cycle process(GO:0010948) |
| 0.0 | 0.0 | GO:0034067 | protein localization to Golgi apparatus(GO:0034067) |
| 0.0 | 0.1 | GO:0031122 | cytoplasmic microtubule organization(GO:0031122) |
| 0.0 | 0.0 | GO:0052695 | cellular glucuronidation(GO:0052695) |
| 0.0 | 0.0 | GO:1903242 | regulation of cardiac muscle adaptation(GO:0010612) regulation of cardiac muscle hypertrophy in response to stress(GO:1903242) |
| 0.0 | 0.0 | GO:0000491 | small nucleolar ribonucleoprotein complex assembly(GO:0000491) box C/D snoRNP assembly(GO:0000492) |
| 0.0 | 0.0 | GO:2000354 | regulation of ovarian follicle development(GO:2000354) |
| 0.0 | 0.0 | GO:0060174 | limb bud formation(GO:0060174) |
| 0.0 | 0.0 | GO:0031017 | exocrine pancreas development(GO:0031017) |
| 0.0 | 0.0 | GO:0042222 | interleukin-1 biosynthetic process(GO:0042222) |
| 0.0 | 0.0 | GO:1902117 | positive regulation of organelle assembly(GO:1902117) |
Gene overrepresentation in cellular component category:
| Log-likelihood per target | Total log-likelihood | Term | Description |
|---|---|---|---|
| 8.2 | 32.8 | GO:0042825 | TAP complex(GO:0042825) |
| 7.8 | 38.8 | GO:0072559 | NLRP3 inflammasome complex(GO:0072559) |
| 6.5 | 58.2 | GO:0020003 | symbiont-containing vacuole(GO:0020003) |
| 5.5 | 22.2 | GO:0072557 | IPAF inflammasome complex(GO:0072557) |
| 3.8 | 15.1 | GO:0071141 | SMAD protein complex(GO:0071141) |
| 3.5 | 10.5 | GO:0005658 | alpha DNA polymerase:primase complex(GO:0005658) |
| 3.4 | 23.7 | GO:0042382 | paraspeckles(GO:0042382) |
| 3.1 | 9.2 | GO:0071664 | catenin-TCF7L2 complex(GO:0071664) |
| 3.0 | 15.2 | GO:1990712 | HFE-transferrin receptor complex(GO:1990712) |
| 2.9 | 8.6 | GO:0097057 | TRAF2-GSTP1 complex(GO:0097057) |
| 2.8 | 11.0 | GO:0005784 | Sec61 translocon complex(GO:0005784) translocon complex(GO:0071256) |
| 2.6 | 10.4 | GO:0045298 | tubulin complex(GO:0045298) |
| 2.6 | 12.9 | GO:1990111 | spermatoproteasome complex(GO:1990111) |
| 2.5 | 17.5 | GO:0033256 | I-kappaB/NF-kappaB complex(GO:0033256) |
| 2.4 | 9.7 | GO:0031313 | extrinsic component of endosome membrane(GO:0031313) |
| 2.2 | 13.5 | GO:0070937 | CRD-mediated mRNA stability complex(GO:0070937) |
| 2.2 | 10.9 | GO:0033093 | Weibel-Palade body(GO:0033093) |
| 2.2 | 6.5 | GO:0005899 | insulin receptor complex(GO:0005899) |
| 2.2 | 10.8 | GO:0031838 | haptoglobin-hemoglobin complex(GO:0031838) |
| 2.0 | 6.1 | GO:0036488 | CHOP-C/EBP complex(GO:0036488) |
| 2.0 | 11.8 | GO:0000138 | Golgi trans cisterna(GO:0000138) |
| 1.9 | 30.4 | GO:0000421 | autophagosome membrane(GO:0000421) |
| 1.9 | 3.8 | GO:0065010 | extracellular membrane-bounded organelle(GO:0065010) |
| 1.9 | 1.9 | GO:1990597 | AIP1-IRE1 complex(GO:1990597) |
| 1.9 | 5.6 | GO:0097425 | smooth endoplasmic reticulum membrane(GO:0030868) smooth endoplasmic reticulum part(GO:0097425) |
| 1.8 | 9.1 | GO:0016281 | eukaryotic translation initiation factor 4F complex(GO:0016281) |
| 1.8 | 7.2 | GO:0000836 | ER ubiquitin ligase complex(GO:0000835) Hrd1p ubiquitin ligase complex(GO:0000836) |
| 1.8 | 5.4 | GO:0031088 | platelet dense granule membrane(GO:0031088) |
| 1.7 | 5.2 | GO:0031523 | Myb complex(GO:0031523) |
| 1.7 | 17.0 | GO:0031254 | uropod(GO:0001931) cell trailing edge(GO:0031254) |
| 1.7 | 11.6 | GO:0032009 | early phagosome(GO:0032009) |
| 1.6 | 4.8 | GO:0033596 | TSC1-TSC2 complex(GO:0033596) |
| 1.6 | 6.3 | GO:0044354 | pinosome(GO:0044352) macropinosome(GO:0044354) |
| 1.6 | 6.3 | GO:0044530 | supraspliceosomal complex(GO:0044530) |
| 1.6 | 11.1 | GO:0070971 | endoplasmic reticulum exit site(GO:0070971) |
| 1.6 | 7.8 | GO:0031315 | extrinsic component of mitochondrial outer membrane(GO:0031315) |
| 1.5 | 4.5 | GO:0097443 | sorting endosome(GO:0097443) |
| 1.5 | 1.5 | GO:0005677 | chromatin silencing complex(GO:0005677) |
| 1.4 | 4.3 | GO:0005944 | phosphatidylinositol 3-kinase complex, class IB(GO:0005944) |
| 1.4 | 7.2 | GO:0030896 | checkpoint clamp complex(GO:0030896) |
| 1.4 | 19.9 | GO:0016471 | vacuolar proton-transporting V-type ATPase complex(GO:0016471) |
| 1.4 | 1.4 | GO:1990423 | RZZ complex(GO:1990423) |
| 1.4 | 5.5 | GO:0030127 | COPII vesicle coat(GO:0030127) |
| 1.3 | 9.4 | GO:0030130 | clathrin coat of trans-Golgi network vesicle(GO:0030130) |
| 1.3 | 18.8 | GO:0030914 | STAGA complex(GO:0030914) |
| 1.3 | 6.7 | GO:0005663 | DNA replication factor C complex(GO:0005663) |
| 1.3 | 8.0 | GO:0030915 | Smc5-Smc6 complex(GO:0030915) |
| 1.3 | 6.5 | GO:0048476 | Holliday junction resolvase complex(GO:0048476) |
| 1.3 | 14.3 | GO:0042612 | MHC class I protein complex(GO:0042612) |
| 1.3 | 48.0 | GO:0005637 | nuclear inner membrane(GO:0005637) |
| 1.3 | 5.1 | GO:0005642 | annulate lamellae(GO:0005642) |
| 1.2 | 8.6 | GO:0016600 | flotillin complex(GO:0016600) |
| 1.2 | 9.8 | GO:0030496 | midbody(GO:0030496) |
| 1.2 | 4.8 | GO:0002079 | inner acrosomal membrane(GO:0002079) |
| 1.2 | 9.5 | GO:0044666 | MLL3/4 complex(GO:0044666) |
| 1.1 | 3.4 | GO:0009279 | cell outer membrane(GO:0009279) cell envelope(GO:0030313) external encapsulating structure part(GO:0044462) |
| 1.1 | 2.3 | GO:0097418 | neurofibrillary tangle(GO:0097418) |
| 1.1 | 3.4 | GO:0005638 | lamin filament(GO:0005638) |
| 1.1 | 12.2 | GO:0031588 | nucleotide-activated protein kinase complex(GO:0031588) |
| 1.1 | 5.5 | GO:0030870 | Mre11 complex(GO:0030870) |
| 1.1 | 3.3 | GO:0030132 | clathrin coat of coated pit(GO:0030132) |
| 1.1 | 5.4 | GO:0042406 | extrinsic component of endoplasmic reticulum membrane(GO:0042406) |
| 1.1 | 3.2 | GO:0010009 | cytoplasmic side of endosome membrane(GO:0010009) |
| 1.1 | 4.2 | GO:0072357 | PTW/PP1 phosphatase complex(GO:0072357) |
| 1.0 | 3.1 | GO:0038201 | TORC2 complex(GO:0031932) TOR complex(GO:0038201) |
| 1.0 | 3.1 | GO:0005833 | hemoglobin complex(GO:0005833) |
| 1.0 | 8.3 | GO:0044215 | other organism(GO:0044215) other organism cell(GO:0044216) other organism part(GO:0044217) |
| 1.0 | 4.2 | GO:0000502 | proteasome complex(GO:0000502) |
| 1.0 | 3.1 | GO:0097452 | GAIT complex(GO:0097452) |
| 1.0 | 3.1 | GO:0032280 | symmetric synapse(GO:0032280) |
| 1.0 | 29.8 | GO:0000118 | histone deacetylase complex(GO:0000118) |
| 1.0 | 13.3 | GO:0036038 | MKS complex(GO:0036038) |
| 1.0 | 3.0 | GO:0000164 | protein phosphatase type 1 complex(GO:0000164) |
| 1.0 | 4.0 | GO:0000938 | GARP complex(GO:0000938) |
| 1.0 | 5.0 | GO:0005828 | kinetochore microtubule(GO:0005828) |
| 1.0 | 2.9 | GO:0000172 | ribonuclease MRP complex(GO:0000172) |
| 1.0 | 3.9 | GO:0031465 | Cul4B-RING E3 ubiquitin ligase complex(GO:0031465) |
| 0.9 | 4.7 | GO:0044294 | dendritic growth cone(GO:0044294) |
| 0.9 | 6.6 | GO:0044448 | cell cortex part(GO:0044448) |
| 0.9 | 6.5 | GO:0000137 | Golgi cis cisterna(GO:0000137) |
| 0.9 | 50.6 | GO:0005811 | lipid particle(GO:0005811) |
| 0.9 | 16.4 | GO:0043034 | costamere(GO:0043034) |
| 0.9 | 5.4 | GO:0097197 | tetraspanin-enriched microdomain(GO:0097197) |
| 0.9 | 5.4 | GO:0031983 | vesicle lumen(GO:0031983) |
| 0.9 | 3.6 | GO:0097136 | Bcl-2 family protein complex(GO:0097136) |
| 0.9 | 2.7 | GO:0034679 | integrin alpha9-beta1 complex(GO:0034679) |
| 0.9 | 13.0 | GO:0030014 | CCR4-NOT complex(GO:0030014) |
| 0.9 | 0.9 | GO:1990316 | ATG1/ULK1 kinase complex(GO:1990316) |
| 0.9 | 6.0 | GO:0043020 | NADPH oxidase complex(GO:0043020) |
| 0.9 | 3.4 | GO:0002189 | ribose phosphate diphosphokinase complex(GO:0002189) |
| 0.9 | 6.0 | GO:0031931 | TORC1 complex(GO:0031931) |
| 0.8 | 15.3 | GO:0005697 | telomerase holoenzyme complex(GO:0005697) |
| 0.8 | 4.2 | GO:0008385 | IkappaB kinase complex(GO:0008385) |
| 0.8 | 5.0 | GO:0014731 | spectrin-associated cytoskeleton(GO:0014731) |
| 0.8 | 3.3 | GO:0005915 | zonula adherens(GO:0005915) |
| 0.8 | 53.1 | GO:0016363 | nuclear matrix(GO:0016363) |
| 0.8 | 19.0 | GO:0034364 | high-density lipoprotein particle(GO:0034364) |
| 0.8 | 7.4 | GO:0035631 | CD40 receptor complex(GO:0035631) |
| 0.8 | 3.3 | GO:0072487 | MSL complex(GO:0072487) |
| 0.8 | 7.3 | GO:0005869 | dynactin complex(GO:0005869) |
| 0.8 | 2.4 | GO:0001651 | dense fibrillar component(GO:0001651) |
| 0.8 | 16.6 | GO:0031307 | integral component of mitochondrial outer membrane(GO:0031307) |
| 0.8 | 49.8 | GO:0042641 | actomyosin(GO:0042641) |
| 0.8 | 2.3 | GO:0046691 | intracellular canaliculus(GO:0046691) |
| 0.8 | 3.1 | GO:0033588 | Elongator holoenzyme complex(GO:0033588) |
| 0.8 | 3.1 | GO:0005610 | laminin-5 complex(GO:0005610) |
| 0.8 | 1.5 | GO:0043218 | compact myelin(GO:0043218) |
| 0.8 | 0.8 | GO:0097512 | cardiac myofibril(GO:0097512) |
| 0.8 | 22.5 | GO:0010494 | cytoplasmic stress granule(GO:0010494) |
| 0.8 | 53.3 | GO:0017053 | transcriptional repressor complex(GO:0017053) |
| 0.7 | 4.3 | GO:0005744 | mitochondrial inner membrane presequence translocase complex(GO:0005744) |
| 0.7 | 4.3 | GO:0005796 | Golgi lumen(GO:0005796) |
| 0.7 | 4.3 | GO:0000812 | Swr1 complex(GO:0000812) |
| 0.7 | 3.6 | GO:0005797 | Golgi medial cisterna(GO:0005797) |
| 0.7 | 5.0 | GO:0046581 | intercellular canaliculus(GO:0046581) |
| 0.7 | 5.0 | GO:0070938 | contractile ring(GO:0070938) |
| 0.7 | 17.5 | GO:0015030 | Cajal body(GO:0015030) |
| 0.7 | 15.4 | GO:0031985 | Golgi cisterna(GO:0031985) |
| 0.7 | 2.1 | GO:0070531 | BRCA1-A complex(GO:0070531) |
| 0.7 | 23.4 | GO:0016592 | mediator complex(GO:0016592) |
| 0.7 | 15.1 | GO:0022624 | proteasome accessory complex(GO:0022624) |
| 0.7 | 24.6 | GO:0008023 | transcription elongation factor complex(GO:0008023) |
| 0.7 | 2.0 | GO:0070552 | BRISC complex(GO:0070552) |
| 0.7 | 2.0 | GO:0031933 | telomeric heterochromatin(GO:0031933) |
| 0.7 | 4.0 | GO:0032797 | SMN complex(GO:0032797) |
| 0.7 | 2.7 | GO:0030485 | smooth muscle contractile fiber(GO:0030485) |
| 0.7 | 9.9 | GO:0043196 | varicosity(GO:0043196) |
| 0.7 | 3.3 | GO:0030056 | hemidesmosome(GO:0030056) |
| 0.7 | 3.9 | GO:0072669 | tRNA-splicing ligase complex(GO:0072669) |
| 0.6 | 5.2 | GO:0032593 | insulin-responsive compartment(GO:0032593) |
| 0.6 | 3.2 | GO:0034388 | Pwp2p-containing subcomplex of 90S preribosome(GO:0034388) |
| 0.6 | 3.2 | GO:0005851 | eukaryotic translation initiation factor 2B complex(GO:0005851) |
| 0.6 | 14.1 | GO:0030131 | clathrin adaptor complex(GO:0030131) |
| 0.6 | 1.9 | GO:0035355 | Toll-like receptor 2-Toll-like receptor 6 protein complex(GO:0035355) |
| 0.6 | 1.9 | GO:0016602 | CCAAT-binding factor complex(GO:0016602) |
| 0.6 | 3.2 | GO:0061617 | MICOS complex(GO:0061617) |
| 0.6 | 1.3 | GO:0005914 | spot adherens junction(GO:0005914) |
| 0.6 | 1.9 | GO:0005896 | interleukin-6 receptor complex(GO:0005896) |
| 0.6 | 0.6 | GO:0097470 | ribbon synapse(GO:0097470) |
| 0.6 | 14.8 | GO:0032040 | small-subunit processome(GO:0032040) |
| 0.6 | 2.5 | GO:0042629 | mast cell granule(GO:0042629) |
| 0.6 | 12.9 | GO:0005680 | anaphase-promoting complex(GO:0005680) |
| 0.6 | 1.8 | GO:0005901 | caveola(GO:0005901) |
| 0.6 | 5.5 | GO:0097542 | ciliary tip(GO:0097542) |
| 0.6 | 13.4 | GO:0000786 | nucleosome(GO:0000786) |
| 0.6 | 1.8 | GO:0061574 | ASAP complex(GO:0061574) |
| 0.6 | 1.8 | GO:0016222 | procollagen-proline 4-dioxygenase complex(GO:0016222) |
| 0.6 | 1.2 | GO:0031094 | platelet dense tubular network(GO:0031094) |
| 0.6 | 1.2 | GO:0001739 | sex chromatin(GO:0001739) |
| 0.6 | 1.2 | GO:0005956 | protein kinase CK2 complex(GO:0005956) |
| 0.6 | 1.8 | GO:0002102 | podosome(GO:0002102) |
| 0.6 | 0.6 | GO:0098827 | endoplasmic reticulum subcompartment(GO:0098827) |
| 0.6 | 6.3 | GO:0031430 | M band(GO:0031430) |
| 0.6 | 0.6 | GO:0042824 | MHC class I peptide loading complex(GO:0042824) |
| 0.6 | 1.7 | GO:0005927 | muscle tendon junction(GO:0005927) |
| 0.6 | 2.3 | GO:0033063 | Rad51B-Rad51C-Rad51D-XRCC2 complex(GO:0033063) |
| 0.6 | 8.5 | GO:0005868 | cytoplasmic dynein complex(GO:0005868) |
| 0.6 | 2.2 | GO:0001650 | fibrillar center(GO:0001650) |
| 0.6 | 2.2 | GO:0005916 | fascia adherens(GO:0005916) |
| 0.6 | 2.8 | GO:0035749 | myelin sheath adaxonal region(GO:0035749) |
| 0.6 | 0.6 | GO:0044322 | endoplasmic reticulum quality control compartment(GO:0044322) |
| 0.6 | 3.9 | GO:0000243 | commitment complex(GO:0000243) |
| 0.6 | 6.6 | GO:0001891 | phagocytic cup(GO:0001891) |
| 0.5 | 1.1 | GO:0033553 | rDNA heterochromatin(GO:0033553) |
| 0.5 | 8.2 | GO:0035861 | site of double-strand break(GO:0035861) |
| 0.5 | 3.8 | GO:0048500 | signal recognition particle, endoplasmic reticulum targeting(GO:0005786) signal recognition particle(GO:0048500) |
| 0.5 | 0.5 | GO:0045180 | basal cortex(GO:0045180) |
| 0.5 | 4.8 | GO:0032045 | guanyl-nucleotide exchange factor complex(GO:0032045) |
| 0.5 | 1.6 | GO:0031417 | NatC complex(GO:0031417) |
| 0.5 | 14.3 | GO:0009925 | basal plasma membrane(GO:0009925) |
| 0.5 | 4.2 | GO:0044232 | organelle membrane contact site(GO:0044232) |
| 0.5 | 7.8 | GO:0005849 | mRNA cleavage factor complex(GO:0005849) |
| 0.5 | 6.8 | GO:0031231 | intrinsic component of peroxisomal membrane(GO:0031231) |
| 0.5 | 45.4 | GO:0072562 | blood microparticle(GO:0072562) |
| 0.5 | 4.7 | GO:0071004 | U2-type prespliceosome(GO:0071004) |
| 0.5 | 1.5 | GO:0005971 | ribonucleoside-diphosphate reductase complex(GO:0005971) |
| 0.5 | 4.1 | GO:0005682 | U5 snRNP(GO:0005682) |
| 0.5 | 1.5 | GO:0031462 | Cul2-RING ubiquitin ligase complex(GO:0031462) |
| 0.5 | 1.5 | GO:0005840 | ribosome(GO:0005840) |
| 0.5 | 0.5 | GO:0034399 | nuclear periphery(GO:0034399) |
| 0.5 | 1.0 | GO:0042581 | specific granule(GO:0042581) |
| 0.5 | 6.1 | GO:0043240 | Fanconi anaemia nuclear complex(GO:0043240) |
| 0.5 | 4.0 | GO:0097208 | alveolar lamellar body(GO:0097208) |
| 0.5 | 10.6 | GO:0034451 | centriolar satellite(GO:0034451) |
| 0.5 | 2.5 | GO:0071437 | invadopodium(GO:0071437) |
| 0.5 | 9.1 | GO:0030992 | intraciliary transport particle B(GO:0030992) |
| 0.5 | 3.0 | GO:0045252 | oxoglutarate dehydrogenase complex(GO:0045252) |
| 0.5 | 6.0 | GO:0031528 | microvillus membrane(GO:0031528) |
| 0.5 | 19.9 | GO:0030173 | integral component of Golgi membrane(GO:0030173) |
| 0.5 | 4.0 | GO:0017059 | serine C-palmitoyltransferase complex(GO:0017059) endoplasmic reticulum palmitoyltransferase complex(GO:0031211) |
| 0.5 | 46.9 | GO:0005923 | bicellular tight junction(GO:0005923) |
| 0.5 | 4.4 | GO:0097539 | ciliary transition fiber(GO:0097539) |
| 0.5 | 0.5 | GO:0020016 | ciliary pocket(GO:0020016) ciliary pocket membrane(GO:0020018) |
| 0.5 | 4.4 | GO:0005832 | chaperonin-containing T-complex(GO:0005832) |
| 0.5 | 0.5 | GO:0031298 | replication fork protection complex(GO:0031298) |
| 0.5 | 3.9 | GO:0033116 | endoplasmic reticulum-Golgi intermediate compartment membrane(GO:0033116) |
| 0.5 | 5.3 | GO:0035102 | PRC1 complex(GO:0035102) |
| 0.5 | 9.6 | GO:0090544 | BAF-type complex(GO:0090544) |
| 0.5 | 0.5 | GO:0005594 | FACIT collagen trimer(GO:0005593) collagen type IX trimer(GO:0005594) |
| 0.5 | 22.4 | GO:0016605 | PML body(GO:0016605) |
| 0.5 | 3.3 | GO:0034709 | methylosome(GO:0034709) |
| 0.5 | 2.4 | GO:1990124 | messenger ribonucleoprotein complex(GO:1990124) |
| 0.5 | 1.4 | GO:0030125 | clathrin vesicle coat(GO:0030125) |
| 0.5 | 0.5 | GO:0005687 | U4 snRNP(GO:0005687) |
| 0.5 | 1.9 | GO:0031464 | Cul4A-RING E3 ubiquitin ligase complex(GO:0031464) |
| 0.5 | 1.9 | GO:0042583 | chromaffin granule(GO:0042583) |
| 0.5 | 5.6 | GO:0031616 | spindle pole centrosome(GO:0031616) |
| 0.5 | 8.8 | GO:0000307 | cyclin-dependent protein kinase holoenzyme complex(GO:0000307) |
| 0.5 | 13.4 | GO:0030864 | cortical actin cytoskeleton(GO:0030864) |
| 0.5 | 6.9 | GO:0005844 | polysome(GO:0005844) |
| 0.5 | 52.4 | GO:0042579 | peroxisome(GO:0005777) microbody(GO:0042579) |
| 0.5 | 17.4 | GO:0000932 | cytoplasmic mRNA processing body(GO:0000932) |
| 0.5 | 0.5 | GO:0097427 | microtubule bundle(GO:0097427) |
| 0.5 | 1.4 | GO:0045171 | intercellular bridge(GO:0045171) |
| 0.5 | 2.3 | GO:0097431 | mitotic spindle pole(GO:0097431) |
| 0.5 | 0.9 | GO:0032432 | actin filament bundle(GO:0032432) |
| 0.5 | 1.4 | GO:1990923 | PET complex(GO:1990923) |
| 0.4 | 1.3 | GO:0000811 | GINS complex(GO:0000811) |
| 0.4 | 41.5 | GO:0005903 | brush border(GO:0005903) |
| 0.4 | 2.7 | GO:0034992 | microtubule organizing center attachment site(GO:0034992) LINC complex(GO:0034993) |
| 0.4 | 1.3 | GO:0000814 | ESCRT II complex(GO:0000814) |
| 0.4 | 2.6 | GO:0090543 | Flemming body(GO:0090543) |
| 0.4 | 0.9 | GO:0000322 | storage vacuole(GO:0000322) |
| 0.4 | 2.6 | GO:0031209 | SCAR complex(GO:0031209) |
| 0.4 | 0.4 | GO:0000785 | chromatin(GO:0000785) |
| 0.4 | 2.6 | GO:0017101 | aminoacyl-tRNA synthetase multienzyme complex(GO:0017101) |
| 0.4 | 0.4 | GO:0031466 | Cul5-RING ubiquitin ligase complex(GO:0031466) |
| 0.4 | 3.9 | GO:0001673 | male germ cell nucleus(GO:0001673) |
| 0.4 | 0.4 | GO:0002178 | palmitoyltransferase complex(GO:0002178) |
| 0.4 | 1.3 | GO:0000242 | pericentriolar material(GO:0000242) |
| 0.4 | 1.7 | GO:0031143 | pseudopodium(GO:0031143) |
| 0.4 | 6.3 | GO:0000145 | exocyst(GO:0000145) |
| 0.4 | 8.0 | GO:0008305 | integrin complex(GO:0008305) |
| 0.4 | 0.4 | GO:0044326 | dendritic spine neck(GO:0044326) |
| 0.4 | 2.9 | GO:0033270 | paranode region of axon(GO:0033270) |
| 0.4 | 1.2 | GO:0044299 | C-fiber(GO:0044299) |
| 0.4 | 1.2 | GO:0005967 | mitochondrial pyruvate dehydrogenase complex(GO:0005967) |
| 0.4 | 2.0 | GO:0031512 | motile primary cilium(GO:0031512) |
| 0.4 | 1.2 | GO:0005955 | calcineurin complex(GO:0005955) |
| 0.4 | 4.9 | GO:0005942 | phosphatidylinositol 3-kinase complex(GO:0005942) |
| 0.4 | 1.6 | GO:1990130 | Iml1 complex(GO:1990130) |
| 0.4 | 2.0 | GO:0005827 | polar microtubule(GO:0005827) |
| 0.4 | 3.6 | GO:0005751 | mitochondrial respiratory chain complex IV(GO:0005751) |
| 0.4 | 1.2 | GO:0042599 | lamellar body(GO:0042599) |
| 0.4 | 4.8 | GO:0031083 | BLOC-1 complex(GO:0031083) |
| 0.4 | 4.4 | GO:0000177 | cytoplasmic exosome (RNase complex)(GO:0000177) |
| 0.4 | 4.7 | GO:0005721 | pericentric heterochromatin(GO:0005721) |
| 0.4 | 0.8 | GO:0005785 | signal recognition particle receptor complex(GO:0005785) |
| 0.4 | 0.8 | GO:1990604 | IRE1-TRAF2-ASK1 complex(GO:1990604) |
| 0.4 | 0.8 | GO:0016461 | unconventional myosin complex(GO:0016461) |
| 0.4 | 5.1 | GO:0005666 | DNA-directed RNA polymerase III complex(GO:0005666) |
| 0.4 | 0.8 | GO:0035867 | alphav-beta3 integrin-IGF-1-IGF1R complex(GO:0035867) |
| 0.4 | 1.5 | GO:0000942 | condensed nuclear chromosome outer kinetochore(GO:0000942) |
| 0.4 | 13.5 | GO:0005762 | organellar large ribosomal subunit(GO:0000315) mitochondrial large ribosomal subunit(GO:0005762) |
| 0.4 | 1.2 | GO:0016939 | kinesin II complex(GO:0016939) |
| 0.4 | 0.4 | GO:0000792 | heterochromatin(GO:0000792) |
| 0.4 | 1.5 | GO:0032541 | cortical endoplasmic reticulum(GO:0032541) |
| 0.4 | 35.3 | GO:0000775 | chromosome, centromeric region(GO:0000775) |
| 0.4 | 0.4 | GO:0000125 | PCAF complex(GO:0000125) |
| 0.4 | 5.6 | GO:0005776 | autophagosome(GO:0005776) |
| 0.4 | 3.4 | GO:0042613 | MHC class II protein complex(GO:0042613) |
| 0.4 | 82.6 | GO:0005925 | focal adhesion(GO:0005925) |
| 0.4 | 3.7 | GO:0035327 | transcriptionally active chromatin(GO:0035327) |
| 0.4 | 1.5 | GO:0030688 | preribosome, small subunit precursor(GO:0030688) |
| 0.4 | 0.7 | GO:0000176 | nuclear exosome (RNase complex)(GO:0000176) |
| 0.4 | 4.0 | GO:1904949 | ATPase complex(GO:1904949) |
| 0.4 | 0.4 | GO:0032585 | multivesicular body membrane(GO:0032585) |
| 0.4 | 2.1 | GO:0034464 | BBSome(GO:0034464) |
| 0.4 | 0.7 | GO:0071010 | prespliceosome(GO:0071010) |
| 0.4 | 1.1 | GO:0000110 | nucleotide-excision repair factor 1 complex(GO:0000110) |
| 0.4 | 2.1 | GO:0042582 | primary lysosome(GO:0005766) azurophil granule(GO:0042582) |
| 0.4 | 0.7 | GO:0031074 | nucleocytoplasmic shuttling complex(GO:0031074) |
| 0.4 | 1.1 | GO:0000214 | tRNA-intron endonuclease complex(GO:0000214) |
| 0.4 | 1.1 | GO:0044194 | cytolytic granule(GO:0044194) |
| 0.4 | 14.1 | GO:0009295 | nucleoid(GO:0009295) mitochondrial nucleoid(GO:0042645) |
| 0.4 | 5.3 | GO:0030119 | AP-type membrane coat adaptor complex(GO:0030119) |
| 0.4 | 1.4 | GO:0016235 | aggresome(GO:0016235) |
| 0.3 | 1.4 | GO:0002199 | zona pellucida receptor complex(GO:0002199) |
| 0.3 | 2.1 | GO:0035869 | ciliary transition zone(GO:0035869) |
| 0.3 | 3.5 | GO:0005771 | multivesicular body(GO:0005771) |
| 0.3 | 1.0 | GO:0071439 | clathrin complex(GO:0071439) |
| 0.3 | 0.7 | GO:0002193 | MAML1-RBP-Jkappa- ICN1 complex(GO:0002193) |
| 0.3 | 0.7 | GO:0033269 | internode region of axon(GO:0033269) |
| 0.3 | 1.4 | GO:0061700 | GATOR2 complex(GO:0061700) |
| 0.3 | 2.1 | GO:0030991 | intraciliary transport particle A(GO:0030991) |
| 0.3 | 4.5 | GO:0005665 | DNA-directed RNA polymerase II, core complex(GO:0005665) |
| 0.3 | 0.7 | GO:0044292 | dendrite terminus(GO:0044292) |
| 0.3 | 1.0 | GO:0008282 | ATP-sensitive potassium channel complex(GO:0008282) |
| 0.3 | 4.4 | GO:0005669 | transcription factor TFIID complex(GO:0005669) |
| 0.3 | 6.0 | GO:0016459 | myosin complex(GO:0016459) |
| 0.3 | 8.0 | GO:0005902 | microvillus(GO:0005902) |
| 0.3 | 2.3 | GO:0080008 | Cul4-RING E3 ubiquitin ligase complex(GO:0080008) |
| 0.3 | 5.2 | GO:0032588 | trans-Golgi network membrane(GO:0032588) |
| 0.3 | 0.3 | GO:0043625 | delta DNA polymerase complex(GO:0043625) |
| 0.3 | 1.6 | GO:0045120 | pronucleus(GO:0045120) |
| 0.3 | 1.6 | GO:0033503 | HULC complex(GO:0033503) |
| 0.3 | 1.0 | GO:0034448 | EGO complex(GO:0034448) Gtr1-Gtr2 GTPase complex(GO:1990131) |
| 0.3 | 10.4 | GO:0034707 | chloride channel complex(GO:0034707) |
| 0.3 | 22.7 | GO:0031965 | nuclear membrane(GO:0031965) |
| 0.3 | 64.9 | GO:0009897 | external side of plasma membrane(GO:0009897) |
| 0.3 | 1.3 | GO:0008622 | epsilon DNA polymerase complex(GO:0008622) |
| 0.3 | 3.7 | GO:0031672 | A band(GO:0031672) |
| 0.3 | 6.5 | GO:0001772 | immunological synapse(GO:0001772) |
| 0.3 | 9.0 | GO:0030136 | clathrin-coated vesicle(GO:0030136) |
| 0.3 | 40.1 | GO:0000790 | nuclear chromatin(GO:0000790) |
| 0.3 | 4.0 | GO:0045335 | phagocytic vesicle(GO:0045335) |
| 0.3 | 2.4 | GO:0032587 | ruffle membrane(GO:0032587) |
| 0.3 | 1.2 | GO:0043203 | axon hillock(GO:0043203) |
| 0.3 | 0.6 | GO:0036449 | microtubule minus-end(GO:0036449) |
| 0.3 | 1.2 | GO:0071782 | endoplasmic reticulum tubular network(GO:0071782) |
| 0.3 | 1.2 | GO:0070688 | MLL5-L complex(GO:0070688) |
| 0.3 | 2.1 | GO:0036513 | Derlin-1 retrotranslocation complex(GO:0036513) |
| 0.3 | 0.3 | GO:1990716 | axonemal central apparatus(GO:1990716) |
| 0.3 | 0.3 | GO:0071203 | WASH complex(GO:0071203) |
| 0.3 | 1.7 | GO:0071546 | pi-body(GO:0071546) |
| 0.3 | 0.6 | GO:0030134 | ER to Golgi transport vesicle(GO:0030134) |
| 0.3 | 10.7 | GO:0005643 | nuclear pore(GO:0005643) |
| 0.3 | 1.7 | GO:0042587 | glycogen granule(GO:0042587) |
| 0.3 | 0.9 | GO:0005952 | cAMP-dependent protein kinase complex(GO:0005952) |
| 0.3 | 3.2 | GO:0001917 | photoreceptor inner segment(GO:0001917) |
| 0.3 | 10.9 | GO:0005758 | mitochondrial intermembrane space(GO:0005758) |
| 0.3 | 0.6 | GO:0097524 | sperm plasma membrane(GO:0097524) |
| 0.3 | 22.3 | GO:0016604 | nuclear body(GO:0016604) |
| 0.3 | 5.6 | GO:0005801 | cis-Golgi network(GO:0005801) |
| 0.3 | 2.0 | GO:0017119 | Golgi transport complex(GO:0017119) |
| 0.3 | 0.6 | GO:0000152 | nuclear ubiquitin ligase complex(GO:0000152) |
| 0.3 | 3.1 | GO:0014704 | intercalated disc(GO:0014704) |
| 0.3 | 0.3 | GO:0008275 | gamma-tubulin small complex(GO:0008275) |
| 0.3 | 0.8 | GO:0042589 | zymogen granule membrane(GO:0042589) |
| 0.3 | 0.6 | GO:0048237 | rough endoplasmic reticulum lumen(GO:0048237) |
| 0.3 | 299.3 | GO:0005654 | nucleoplasm(GO:0005654) |
| 0.3 | 5.7 | GO:0032590 | dendrite membrane(GO:0032590) |
| 0.3 | 1.6 | GO:0000815 | ESCRT III complex(GO:0000815) |
| 0.3 | 0.8 | GO:0097413 | Lewy body(GO:0097413) |
| 0.3 | 69.5 | GO:0000323 | lytic vacuole(GO:0000323) lysosome(GO:0005764) |
| 0.3 | 0.5 | GO:0070820 | tertiary granule(GO:0070820) |
| 0.3 | 2.1 | GO:0000506 | glycosylphosphatidylinositol-N-acetylglucosaminyltransferase (GPI-GnT) complex(GO:0000506) |
| 0.3 | 9.3 | GO:0005635 | nuclear envelope(GO:0005635) |
| 0.3 | 0.5 | GO:0070044 | synaptobrevin 2-SNAP-25-syntaxin-1a complex(GO:0070044) |
| 0.3 | 10.8 | GO:0019005 | SCF ubiquitin ligase complex(GO:0019005) |
| 0.3 | 1.3 | GO:0000127 | transcription factor TFIIIC complex(GO:0000127) |
| 0.3 | 2.0 | GO:0005795 | Golgi stack(GO:0005795) |
| 0.3 | 1.0 | GO:0042105 | alpha-beta T cell receptor complex(GO:0042105) |
| 0.3 | 0.8 | GO:0097526 | spliceosomal tri-snRNP complex(GO:0097526) |
| 0.3 | 1.0 | GO:1990246 | uniplex complex(GO:1990246) |
| 0.2 | 16.6 | GO:0030176 | integral component of endoplasmic reticulum membrane(GO:0030176) |
| 0.2 | 1.5 | GO:0005587 | collagen type IV trimer(GO:0005587) network-forming collagen trimer(GO:0098642) collagen network(GO:0098645) basement membrane collagen trimer(GO:0098651) |
| 0.2 | 0.7 | GO:0032937 | SREBP-SCAP-Insig complex(GO:0032937) |
| 0.2 | 1.2 | GO:0030315 | T-tubule(GO:0030315) |
| 0.2 | 1.0 | GO:0042588 | zymogen granule(GO:0042588) |
| 0.2 | 0.2 | GO:0030904 | retromer complex(GO:0030904) |
| 0.2 | 1.2 | GO:1990909 | Wnt signalosome(GO:1990909) |
| 0.2 | 184.4 | GO:0005829 | cytosol(GO:0005829) |
| 0.2 | 0.7 | GO:0031415 | NatA complex(GO:0031415) |
| 0.2 | 1.7 | GO:0031235 | intrinsic component of the cytoplasmic side of the plasma membrane(GO:0031235) |
| 0.2 | 0.7 | GO:0042627 | chylomicron(GO:0042627) |
| 0.2 | 5.6 | GO:0005834 | heterotrimeric G-protein complex(GO:0005834) |
| 0.2 | 1.4 | GO:0071011 | precatalytic spliceosome(GO:0071011) |
| 0.2 | 1.6 | GO:0008250 | oligosaccharyltransferase complex(GO:0008250) |
| 0.2 | 0.2 | GO:0030981 | cortical microtubule cytoskeleton(GO:0030981) |
| 0.2 | 0.5 | GO:0005579 | membrane attack complex(GO:0005579) |
| 0.2 | 1.5 | GO:0000159 | protein phosphatase type 2A complex(GO:0000159) |
| 0.2 | 1.3 | GO:0032391 | photoreceptor connecting cilium(GO:0032391) |
| 0.2 | 0.2 | GO:0045179 | apical cortex(GO:0045179) |
| 0.2 | 3.7 | GO:0098552 | side of membrane(GO:0098552) |
| 0.2 | 0.4 | GO:0030687 | preribosome, large subunit precursor(GO:0030687) |
| 0.2 | 0.4 | GO:0000805 | X chromosome(GO:0000805) |
| 0.2 | 0.4 | GO:0033179 | proton-transporting V-type ATPase, V0 domain(GO:0033179) |
| 0.2 | 1.7 | GO:0030314 | junctional membrane complex(GO:0030314) |
| 0.2 | 0.4 | GO:0036195 | muscle cell projection(GO:0036194) muscle cell projection membrane(GO:0036195) |
| 0.2 | 0.6 | GO:0005742 | mitochondrial outer membrane translocase complex(GO:0005742) |
| 0.2 | 1.4 | GO:0045275 | mitochondrial respiratory chain complex III(GO:0005750) respiratory chain complex III(GO:0045275) |
| 0.2 | 11.2 | GO:0031968 | outer membrane(GO:0019867) organelle outer membrane(GO:0031968) |
| 0.2 | 0.6 | GO:0045254 | pyruvate dehydrogenase complex(GO:0045254) |
| 0.2 | 1.6 | GO:0010008 | endosome membrane(GO:0010008) |
| 0.2 | 0.4 | GO:1990204 | oxidoreductase complex(GO:1990204) |
| 0.2 | 1.0 | GO:0016272 | prefoldin complex(GO:0016272) |
| 0.2 | 4.5 | GO:0000793 | condensed chromosome(GO:0000793) |
| 0.2 | 0.6 | GO:0071953 | elastic fiber(GO:0071953) |
| 0.2 | 0.4 | GO:0031314 | extrinsic component of mitochondrial inner membrane(GO:0031314) |
| 0.2 | 0.6 | GO:0048179 | activin receptor complex(GO:0048179) |
| 0.2 | 5.4 | GO:0045271 | mitochondrial respiratory chain complex I(GO:0005747) NADH dehydrogenase complex(GO:0030964) respiratory chain complex I(GO:0045271) |
| 0.2 | 155.7 | GO:0005739 | mitochondrion(GO:0005739) |
| 0.2 | 1.3 | GO:0042622 | photoreceptor outer segment membrane(GO:0042622) |
| 0.2 | 0.4 | GO:0043259 | laminin-10 complex(GO:0043259) |
| 0.2 | 0.4 | GO:0097255 | R2TP complex(GO:0097255) |
| 0.2 | 1.4 | GO:0033017 | sarcoplasmic reticulum membrane(GO:0033017) |
| 0.2 | 0.5 | GO:0005664 | origin recognition complex(GO:0000808) nuclear origin of replication recognition complex(GO:0005664) |
| 0.2 | 0.7 | GO:0032426 | stereocilium tip(GO:0032426) |
| 0.2 | 41.2 | GO:0005730 | nucleolus(GO:0005730) |
| 0.2 | 0.3 | GO:0097058 | CRLF-CLCF1 complex(GO:0097058) |
| 0.2 | 1.2 | GO:0031941 | filamentous actin(GO:0031941) |
| 0.2 | 3.0 | GO:0005938 | cell cortex(GO:0005938) |
| 0.2 | 2.3 | GO:0005892 | acetylcholine-gated channel complex(GO:0005892) |
| 0.2 | 0.6 | GO:0001520 | outer dense fiber(GO:0001520) |
| 0.2 | 28.9 | GO:1990904 | intracellular ribonucleoprotein complex(GO:0030529) ribonucleoprotein complex(GO:1990904) |
| 0.2 | 0.3 | GO:0016234 | inclusion body(GO:0016234) |
| 0.1 | 3.0 | GO:0001750 | photoreceptor outer segment(GO:0001750) |
| 0.1 | 0.4 | GO:0005588 | collagen type V trimer(GO:0005588) |
| 0.1 | 3.9 | GO:0045095 | keratin filament(GO:0045095) |
| 0.1 | 0.3 | GO:0072687 | meiotic spindle(GO:0072687) |
| 0.1 | 121.3 | GO:0070062 | extracellular exosome(GO:0070062) |
| 0.1 | 299.4 | GO:0005634 | nucleus(GO:0005634) |
| 0.1 | 5.7 | GO:0031463 | Cul3-RING ubiquitin ligase complex(GO:0031463) |
| 0.1 | 15.4 | GO:0042175 | nuclear outer membrane-endoplasmic reticulum membrane network(GO:0042175) |
| 0.1 | 0.1 | GO:0008290 | F-actin capping protein complex(GO:0008290) |
| 0.1 | 0.3 | GO:0008287 | protein serine/threonine phosphatase complex(GO:0008287) phosphatase complex(GO:1903293) |
| 0.1 | 1.0 | GO:0030137 | COPI-coated vesicle(GO:0030137) |
| 0.1 | 0.8 | GO:0005583 | fibrillar collagen trimer(GO:0005583) banded collagen fibril(GO:0098643) |
| 0.1 | 1.1 | GO:0016529 | sarcoplasmic reticulum(GO:0016529) |
| 0.1 | 0.1 | GO:0034362 | low-density lipoprotein particle(GO:0034362) |
| 0.1 | 1.7 | GO:0042383 | sarcolemma(GO:0042383) |
| 0.1 | 0.9 | GO:0030667 | secretory granule membrane(GO:0030667) |
| 0.1 | 0.6 | GO:0044291 | cell-cell contact zone(GO:0044291) |
| 0.1 | 51.0 | GO:0005783 | endoplasmic reticulum(GO:0005783) |
| 0.1 | 0.2 | GO:0005968 | Rab-protein geranylgeranyltransferase complex(GO:0005968) |
| 0.1 | 0.1 | GO:0044316 | cone cell pedicle(GO:0044316) |
| 0.1 | 0.3 | GO:0031091 | platelet alpha granule(GO:0031091) |
| 0.1 | 2.6 | GO:0005814 | centriole(GO:0005814) |
| 0.1 | 4.0 | GO:0005769 | early endosome(GO:0005769) |
| 0.1 | 0.5 | GO:0060170 | ciliary membrane(GO:0060170) |
| 0.1 | 0.2 | GO:0016327 | apicolateral plasma membrane(GO:0016327) |
| 0.1 | 0.1 | GO:0005774 | vacuolar membrane(GO:0005774) |
| 0.1 | 0.5 | GO:0017146 | NMDA selective glutamate receptor complex(GO:0017146) |
| 0.1 | 44.6 | GO:0005615 | extracellular space(GO:0005615) |
| 0.1 | 0.3 | GO:0030057 | desmosome(GO:0030057) |
| 0.1 | 38.5 | GO:0005576 | extracellular region(GO:0005576) |
| 0.1 | 2.7 | GO:0030141 | secretory granule(GO:0030141) |
| 0.1 | 0.2 | GO:0030008 | TRAPP complex(GO:0030008) |
| 0.1 | 0.1 | GO:0030312 | external encapsulating structure(GO:0030312) |
| 0.1 | 0.3 | GO:0032420 | stereocilium(GO:0032420) |
| 0.1 | 0.1 | GO:0048787 | presynaptic active zone membrane(GO:0048787) |
| 0.0 | 0.2 | GO:0070652 | HAUS complex(GO:0070652) |
| 0.0 | 0.0 | GO:0005845 | mRNA cap binding complex(GO:0005845) RNA cap binding complex(GO:0034518) |
| 0.0 | 0.2 | GO:0005694 | chromosome(GO:0005694) |
| 0.0 | 0.4 | GO:0000922 | spindle pole(GO:0000922) |
| 0.0 | 0.5 | GO:0031594 | neuromuscular junction(GO:0031594) |
| 0.0 | 0.0 | GO:0032433 | filopodium tip(GO:0032433) |
| 0.0 | 0.3 | GO:0005905 | clathrin-coated pit(GO:0005905) |
| 0.0 | 0.7 | GO:1990234 | transferase complex(GO:1990234) |
| 0.0 | 0.5 | GO:0005882 | intermediate filament(GO:0005882) |
| 0.0 | 0.0 | GO:0030660 | Golgi-associated vesicle membrane(GO:0030660) |
| 0.0 | 0.0 | GO:0036056 | filtration diaphragm(GO:0036056) slit diaphragm(GO:0036057) |
Gene overrepresentation in molecular function category:
| Log-likelihood per target | Total log-likelihood | Term | Description |
|---|---|---|---|
| 10.9 | 32.7 | GO:0046978 | TAP1 binding(GO:0046978) TAP2 binding(GO:0046979) |
| 8.1 | 32.4 | GO:0004839 | ubiquitin activating enzyme activity(GO:0004839) |
| 5.9 | 17.8 | GO:0102007 | lactonohydrolase activity(GO:0046573) acyl-L-homoserine-lactone lactonohydrolase activity(GO:0102007) |
| 5.8 | 23.3 | GO:0004046 | aminoacylase activity(GO:0004046) |
| 5.5 | 16.6 | GO:0001069 | regulatory region RNA binding(GO:0001069) |
| 5.2 | 15.7 | GO:0003726 | double-stranded RNA adenosine deaminase activity(GO:0003726) |
| 4.7 | 18.7 | GO:0044682 | N-cyclopropylmelamine deaminase activity(GO:0034547) N-cyclopropylammeline deaminase activity(GO:0034548) N-cyclopropylammelide alkylamino hydrolase activity(GO:0034549) 2,5-diamino-6-ribitylamino-4(3H)-pyrimidinone 5'-phosphate deaminase activity(GO:0043723) tRNA-specific adenosine-37 deaminase activity(GO:0043829) archaeal-specific GTP cyclohydrolase activity(GO:0044682) tRNA-specific adenosine-34 deaminase activity(GO:0052717) |
| 4.5 | 49.6 | GO:0001730 | 2'-5'-oligoadenylate synthetase activity(GO:0001730) |
| 4.4 | 13.2 | GO:0030620 | U2 snRNA binding(GO:0030620) |
| 3.9 | 23.4 | GO:0016936 | galactoside binding(GO:0016936) |
| 3.9 | 15.4 | GO:0017151 | DEAD/H-box RNA helicase binding(GO:0017151) |
| 3.8 | 18.9 | GO:0004791 | thioredoxin-disulfide reductase activity(GO:0004791) |
| 3.5 | 14.1 | GO:0015038 | glutathione disulfide oxidoreductase activity(GO:0015038) |
| 3.4 | 10.2 | GO:0009041 | uridylate kinase activity(GO:0009041) |
| 3.4 | 13.4 | GO:0015265 | urea channel activity(GO:0015265) |
| 3.1 | 12.6 | GO:0031721 | hemoglobin alpha binding(GO:0031721) |
| 3.1 | 46.1 | GO:0005521 | lamin binding(GO:0005521) |
| 3.1 | 18.4 | GO:0005072 | transforming growth factor beta receptor, cytoplasmic mediator activity(GO:0005072) |
| 3.0 | 8.9 | GO:0070573 | metallodipeptidase activity(GO:0070573) |
| 3.0 | 11.9 | GO:0070326 | very-low-density lipoprotein particle receptor binding(GO:0070326) |
| 2.7 | 21.2 | GO:0016920 | pyroglutamyl-peptidase activity(GO:0016920) |
| 2.6 | 7.8 | GO:0005146 | leukemia inhibitory factor receptor binding(GO:0005146) |
| 2.5 | 7.6 | GO:0070644 | vitamin D response element binding(GO:0070644) |
| 2.5 | 50.3 | GO:0005031 | tumor necrosis factor-activated receptor activity(GO:0005031) death receptor activity(GO:0005035) |
| 2.5 | 7.5 | GO:0003829 | beta-1,3-galactosyl-O-glycosyl-glycoprotein beta-1,6-N-acetylglucosaminyltransferase activity(GO:0003829) |
| 2.5 | 7.5 | GO:0004711 | ribosomal protein S6 kinase activity(GO:0004711) |
| 2.5 | 5.0 | GO:0004514 | nicotinate-nucleotide diphosphorylase (carboxylating) activity(GO:0004514) |
| 2.5 | 2.5 | GO:0042609 | CD4 receptor binding(GO:0042609) |
| 2.4 | 9.8 | GO:0008381 | mechanically-gated ion channel activity(GO:0008381) mechanically gated channel activity(GO:0022833) |
| 2.4 | 7.3 | GO:0060230 | lipoprotein lipase activator activity(GO:0060230) |
| 2.4 | 9.4 | GO:0004095 | carnitine O-palmitoyltransferase activity(GO:0004095) |
| 2.3 | 13.8 | GO:0061133 | endopeptidase activator activity(GO:0061133) |
| 2.2 | 6.7 | GO:0004832 | valine-tRNA ligase activity(GO:0004832) |
| 2.2 | 11.1 | GO:0042015 | interleukin-20 binding(GO:0042015) |
| 2.2 | 21.6 | GO:0008432 | JUN kinase binding(GO:0008432) |
| 2.2 | 15.1 | GO:0050897 | cobalt ion binding(GO:0050897) |
| 2.1 | 6.3 | GO:0008525 | phosphatidylcholine transporter activity(GO:0008525) |
| 2.1 | 2.1 | GO:0001013 | RNA polymerase I regulatory region DNA binding(GO:0001013) |
| 2.1 | 6.2 | GO:1990188 | euchromatin binding(GO:1990188) |
| 2.0 | 6.1 | GO:0042296 | ISG15 transferase activity(GO:0042296) |
| 2.0 | 6.0 | GO:0008597 | calcium-dependent protein serine/threonine phosphatase regulator activity(GO:0008597) |
| 2.0 | 13.9 | GO:1904264 | ubiquitin protein ligase activity involved in ERAD pathway(GO:1904264) |
| 2.0 | 2.0 | GO:0015924 | mannosyl-oligosaccharide mannosidase activity(GO:0015924) |
| 2.0 | 13.8 | GO:0005078 | MAP-kinase scaffold activity(GO:0005078) |
| 1.9 | 34.9 | GO:0003950 | NAD+ ADP-ribosyltransferase activity(GO:0003950) |
| 1.9 | 5.8 | GO:0005119 | smoothened binding(GO:0005119) |
| 1.9 | 7.6 | GO:0000340 | RNA 7-methylguanosine cap binding(GO:0000340) |
| 1.9 | 3.8 | GO:0016312 | inositol bisphosphate phosphatase activity(GO:0016312) |
| 1.9 | 5.6 | GO:0030350 | iron-responsive element binding(GO:0030350) |
| 1.9 | 14.9 | GO:0003810 | protein-glutamine gamma-glutamyltransferase activity(GO:0003810) |
| 1.8 | 5.5 | GO:0043546 | molybdopterin cofactor binding(GO:0043546) |
| 1.8 | 7.4 | GO:0031852 | mu-type opioid receptor binding(GO:0031852) |
| 1.8 | 5.4 | GO:0005157 | macrophage colony-stimulating factor receptor binding(GO:0005157) |
| 1.8 | 7.1 | GO:0098748 | clathrin adaptor activity(GO:0035615) endocytic adaptor activity(GO:0098748) |
| 1.7 | 5.2 | GO:0017116 | single-stranded DNA-dependent ATP-dependent DNA helicase activity(GO:0017116) |
| 1.7 | 13.9 | GO:0030235 | nitric-oxide synthase regulator activity(GO:0030235) |
| 1.7 | 3.4 | GO:0097200 | cysteine-type endopeptidase activity involved in execution phase of apoptosis(GO:0097200) |
| 1.7 | 6.8 | GO:0016972 | thiol oxidase activity(GO:0016972) |
| 1.7 | 1.7 | GO:0070538 | oleic acid binding(GO:0070538) |
| 1.7 | 6.7 | GO:0003956 | NAD(P)+-protein-arginine ADP-ribosyltransferase activity(GO:0003956) |
| 1.7 | 8.3 | GO:1990380 | Lys48-specific deubiquitinase activity(GO:1990380) |
| 1.6 | 6.6 | GO:0004558 | alpha-1,4-glucosidase activity(GO:0004558) |
| 1.6 | 6.5 | GO:0017162 | aryl hydrocarbon receptor binding(GO:0017162) |
| 1.6 | 9.7 | GO:1990247 | N6-methyladenosine-containing RNA binding(GO:1990247) |
| 1.6 | 3.2 | GO:0031711 | bradykinin receptor binding(GO:0031711) |
| 1.6 | 4.8 | GO:0047623 | AMP deaminase activity(GO:0003876) adenosine-phosphate deaminase activity(GO:0047623) |
| 1.6 | 4.8 | GO:0042284 | sphingolipid delta-4 desaturase activity(GO:0042284) |
| 1.6 | 10.9 | GO:0016714 | oxidoreductase activity, acting on paired donors, with incorporation or reduction of molecular oxygen, reduced pteridine as one donor, and incorporation of one atom of oxygen(GO:0016714) |
| 1.5 | 15.5 | GO:0035325 | Toll-like receptor binding(GO:0035325) |
| 1.5 | 4.6 | GO:0008732 | threonine aldolase activity(GO:0004793) L-allo-threonine aldolase activity(GO:0008732) |
| 1.5 | 4.6 | GO:0004616 | phosphogluconate dehydrogenase (decarboxylating) activity(GO:0004616) |
| 1.5 | 15.2 | GO:0005159 | insulin-like growth factor receptor binding(GO:0005159) |
| 1.5 | 7.6 | GO:0000405 | bubble DNA binding(GO:0000405) |
| 1.5 | 19.6 | GO:0030881 | beta-2-microglobulin binding(GO:0030881) |
| 1.5 | 7.5 | GO:0005131 | growth hormone receptor binding(GO:0005131) |
| 1.5 | 13.4 | GO:0070568 | guanylyltransferase activity(GO:0070568) |
| 1.5 | 4.4 | GO:0097493 | structural molecule activity conferring elasticity(GO:0097493) |
| 1.5 | 5.9 | GO:0070053 | thrombospondin receptor activity(GO:0070053) |
| 1.5 | 5.9 | GO:0005047 | signal recognition particle binding(GO:0005047) |
| 1.5 | 8.8 | GO:0048406 | nerve growth factor binding(GO:0048406) |
| 1.4 | 1.4 | GO:0005138 | interleukin-6 receptor binding(GO:0005138) |
| 1.4 | 11.5 | GO:0060229 | lipase activator activity(GO:0060229) |
| 1.4 | 4.3 | GO:0005220 | inositol 1,4,5-trisphosphate-sensitive calcium-release channel activity(GO:0005220) |
| 1.4 | 12.8 | GO:0031386 | protein tag(GO:0031386) |
| 1.4 | 5.7 | GO:0008532 | N-acetyllactosaminide beta-1,3-N-acetylglucosaminyltransferase activity(GO:0008532) |
| 1.4 | 11.3 | GO:0071933 | Arp2/3 complex binding(GO:0071933) |
| 1.4 | 5.6 | GO:0004308 | exo-alpha-sialidase activity(GO:0004308) alpha-sialidase activity(GO:0016997) exo-alpha-(2->3)-sialidase activity(GO:0052794) exo-alpha-(2->6)-sialidase activity(GO:0052795) exo-alpha-(2->8)-sialidase activity(GO:0052796) |
| 1.4 | 19.6 | GO:0043295 | glutathione binding(GO:0043295) oligopeptide binding(GO:1900750) |
| 1.4 | 4.2 | GO:0016635 | oxidoreductase activity, acting on the CH-CH group of donors, quinone or related compound as acceptor(GO:0016635) |
| 1.4 | 5.6 | GO:0052650 | NADP-retinol dehydrogenase activity(GO:0052650) |
| 1.4 | 16.5 | GO:0004694 | eukaryotic translation initiation factor 2alpha kinase activity(GO:0004694) |
| 1.4 | 2.7 | GO:0004698 | calcium-dependent protein kinase C activity(GO:0004698) |
| 1.3 | 8.1 | GO:0005381 | iron ion transmembrane transporter activity(GO:0005381) |
| 1.3 | 9.4 | GO:0016443 | bidentate ribonuclease III activity(GO:0016443) |
| 1.3 | 4.0 | GO:0004699 | calcium-independent protein kinase C activity(GO:0004699) |
| 1.3 | 4.0 | GO:0004311 | farnesyltranstransferase activity(GO:0004311) |
| 1.3 | 7.9 | GO:0016742 | hydroxymethyl-, formyl- and related transferase activity(GO:0016742) |
| 1.3 | 9.2 | GO:0050700 | CARD domain binding(GO:0050700) |
| 1.3 | 9.2 | GO:0019966 | interleukin-1 binding(GO:0019966) |
| 1.3 | 9.0 | GO:0003836 | beta-galactoside (CMP) alpha-2,3-sialyltransferase activity(GO:0003836) |
| 1.3 | 3.8 | GO:0016309 | 1-phosphatidylinositol-5-phosphate 4-kinase activity(GO:0016309) |
| 1.3 | 2.5 | GO:0071558 | histone demethylase activity (H3-K27 specific)(GO:0071558) |
| 1.3 | 3.8 | GO:0008503 | benzodiazepine receptor activity(GO:0008503) |
| 1.3 | 6.3 | GO:0002094 | polyprenyltransferase activity(GO:0002094) |
| 1.3 | 10.0 | GO:0051371 | muscle alpha-actinin binding(GO:0051371) |
| 1.2 | 2.5 | GO:1990715 | mRNA CDS binding(GO:1990715) |
| 1.2 | 4.9 | GO:0030984 | kininogen binding(GO:0030984) |
| 1.2 | 17.2 | GO:0034185 | apolipoprotein binding(GO:0034185) |
| 1.2 | 3.7 | GO:0004345 | glucose-6-phosphate dehydrogenase activity(GO:0004345) |
| 1.2 | 2.4 | GO:0071074 | eukaryotic initiation factor eIF2 binding(GO:0071074) |
| 1.2 | 6.0 | GO:0032050 | clathrin heavy chain binding(GO:0032050) |
| 1.2 | 3.5 | GO:0004477 | methenyltetrahydrofolate cyclohydrolase activity(GO:0004477) methylenetetrahydrofolate dehydrogenase (NAD+) activity(GO:0004487) |
| 1.2 | 12.9 | GO:0015279 | store-operated calcium channel activity(GO:0015279) |
| 1.2 | 3.5 | GO:0035515 | oxidative RNA demethylase activity(GO:0035515) |
| 1.2 | 7.0 | GO:0001609 | G-protein coupled adenosine receptor activity(GO:0001609) |
| 1.2 | 8.2 | GO:0004679 | AMP-activated protein kinase activity(GO:0004679) |
| 1.2 | 24.3 | GO:0005086 | ARF guanyl-nucleotide exchange factor activity(GO:0005086) |
| 1.2 | 4.6 | GO:0004551 | nucleotide diphosphatase activity(GO:0004551) |
| 1.2 | 17.3 | GO:0016290 | palmitoyl-CoA hydrolase activity(GO:0016290) |
| 1.1 | 20.6 | GO:0043325 | phosphatidylinositol-3,4-bisphosphate binding(GO:0043325) |
| 1.1 | 3.4 | GO:0004687 | myosin light chain kinase activity(GO:0004687) |
| 1.1 | 11.4 | GO:0005545 | 1-phosphatidylinositol binding(GO:0005545) |
| 1.1 | 4.5 | GO:0004740 | pyruvate dehydrogenase (acetyl-transferring) kinase activity(GO:0004740) |
| 1.1 | 8.8 | GO:1990405 | protein antigen binding(GO:1990405) |
| 1.1 | 3.3 | GO:0016532 | superoxide dismutase copper chaperone activity(GO:0016532) |
| 1.1 | 13.1 | GO:0043024 | ribosomal small subunit binding(GO:0043024) |
| 1.1 | 4.4 | GO:0009374 | biotin binding(GO:0009374) |
| 1.1 | 3.3 | GO:0004611 | phosphoenolpyruvate carboxykinase activity(GO:0004611) |
| 1.1 | 11.9 | GO:0017166 | vinculin binding(GO:0017166) |
| 1.1 | 4.3 | GO:0003945 | N-acetyllactosamine synthase activity(GO:0003945) |
| 1.1 | 1.1 | GO:0055056 | D-glucose transmembrane transporter activity(GO:0055056) |
| 1.1 | 1.1 | GO:0004706 | JUN kinase kinase kinase activity(GO:0004706) |
| 1.1 | 4.2 | GO:0031493 | nucleosomal histone binding(GO:0031493) |
| 1.0 | 7.3 | GO:0035005 | 1-phosphatidylinositol-4-phosphate 3-kinase activity(GO:0035005) |
| 1.0 | 21.7 | GO:0005070 | SH3/SH2 adaptor activity(GO:0005070) |
| 1.0 | 3.1 | GO:0004300 | enoyl-CoA hydratase activity(GO:0004300) |
| 1.0 | 24.6 | GO:0042805 | actinin binding(GO:0042805) |
| 1.0 | 2.1 | GO:0003986 | acetyl-CoA hydrolase activity(GO:0003986) |
| 1.0 | 5.1 | GO:1990239 | steroid hormone binding(GO:1990239) |
| 1.0 | 5.1 | GO:0001025 | RNA polymerase III transcription factor binding(GO:0001025) |
| 1.0 | 3.0 | GO:0004619 | bisphosphoglycerate mutase activity(GO:0004082) phosphoglycerate mutase activity(GO:0004619) 2,3-bisphosphoglycerate-dependent phosphoglycerate mutase activity(GO:0046538) |
| 1.0 | 3.0 | GO:0046976 | histone methyltransferase activity (H3-K27 specific)(GO:0046976) |
| 1.0 | 13.9 | GO:0016493 | C-C chemokine receptor activity(GO:0016493) |
| 1.0 | 7.9 | GO:0031545 | peptidyl-proline 4-dioxygenase activity(GO:0031545) |
| 1.0 | 4.9 | GO:0008603 | cAMP-dependent protein kinase regulator activity(GO:0008603) |
| 1.0 | 17.8 | GO:0016780 | phosphotransferase activity, for other substituted phosphate groups(GO:0016780) |
| 1.0 | 5.9 | GO:0030898 | actin-dependent ATPase activity(GO:0030898) |
| 1.0 | 2.9 | GO:0055100 | adiponectin binding(GO:0055100) |
| 1.0 | 7.8 | GO:0016846 | carbon-sulfur lyase activity(GO:0016846) |
| 1.0 | 2.9 | GO:0000171 | ribonuclease MRP activity(GO:0000171) |
| 1.0 | 4.9 | GO:0001515 | opioid peptide activity(GO:0001515) |
| 1.0 | 7.8 | GO:0070181 | small ribosomal subunit rRNA binding(GO:0070181) |
| 1.0 | 5.8 | GO:0004439 | phosphatidylinositol-4,5-bisphosphate 5-phosphatase activity(GO:0004439) |
| 1.0 | 1.0 | GO:0070883 | pre-miRNA binding(GO:0070883) |
| 1.0 | 4.8 | GO:0019784 | NEDD8-specific protease activity(GO:0019784) |
| 1.0 | 2.9 | GO:0016774 | phosphotransferase activity, carboxyl group as acceptor(GO:0016774) |
| 0.9 | 6.6 | GO:0032552 | deoxyribonucleotide binding(GO:0032552) |
| 0.9 | 5.7 | GO:0016778 | diphosphotransferase activity(GO:0016778) |
| 0.9 | 12.3 | GO:0001671 | ATPase activator activity(GO:0001671) |
| 0.9 | 6.5 | GO:0017070 | U6 snRNA binding(GO:0017070) |
| 0.9 | 4.6 | GO:0046975 | histone methyltransferase activity (H3-K36 specific)(GO:0046975) |
| 0.9 | 3.7 | GO:0015450 | P-P-bond-hydrolysis-driven protein transmembrane transporter activity(GO:0015450) |
| 0.9 | 10.1 | GO:0005123 | death receptor binding(GO:0005123) |
| 0.9 | 4.6 | GO:0051525 | NFAT protein binding(GO:0051525) |
| 0.9 | 11.9 | GO:0008143 | poly(A) binding(GO:0008143) |
| 0.9 | 2.7 | GO:0004174 | electron-transferring-flavoprotein dehydrogenase activity(GO:0004174) oxidoreductase activity, acting on the CH-NH group of donors, quinone or similar compound as acceptor(GO:0016649) |
| 0.9 | 3.6 | GO:0016721 | superoxide dismutase activity(GO:0004784) oxidoreductase activity, acting on superoxide radicals as acceptor(GO:0016721) |
| 0.9 | 1.8 | GO:0038181 | bile acid receptor activity(GO:0038181) |
| 0.9 | 8.1 | GO:0033170 | DNA clamp loader activity(GO:0003689) protein-DNA loading ATPase activity(GO:0033170) |
| 0.9 | 10.7 | GO:0008191 | metalloendopeptidase inhibitor activity(GO:0008191) |
| 0.9 | 16.8 | GO:0046961 | proton-transporting ATPase activity, rotational mechanism(GO:0046961) |
| 0.9 | 3.5 | GO:0000293 | ferric-chelate reductase activity(GO:0000293) |
| 0.9 | 6.1 | GO:0051864 | histone demethylase activity (H3-K36 specific)(GO:0051864) |
| 0.9 | 29.8 | GO:0051539 | 4 iron, 4 sulfur cluster binding(GO:0051539) |
| 0.9 | 3.5 | GO:0015057 | thrombin receptor activity(GO:0015057) |
| 0.9 | 3.5 | GO:0051434 | BH3 domain binding(GO:0051434) |
| 0.9 | 5.2 | GO:0016812 | hydrolase activity, acting on carbon-nitrogen (but not peptide) bonds, in cyclic amides(GO:0016812) |
| 0.9 | 0.9 | GO:0042054 | histone methyltransferase activity(GO:0042054) |
| 0.9 | 7.7 | GO:0042171 | lysophosphatidic acid acyltransferase activity(GO:0042171) |
| 0.9 | 4.3 | GO:0070290 | N-acylphosphatidylethanolamine-specific phospholipase D activity(GO:0070290) |
| 0.9 | 2.6 | GO:0000339 | RNA cap binding(GO:0000339) |
| 0.9 | 17.9 | GO:0042605 | peptide antigen binding(GO:0042605) |
| 0.8 | 0.8 | GO:0089720 | caspase binding(GO:0089720) |
| 0.8 | 0.8 | GO:0017098 | sulfonylurea receptor binding(GO:0017098) |
| 0.8 | 7.6 | GO:0008093 | cytoskeletal adaptor activity(GO:0008093) |
| 0.8 | 2.5 | GO:0016509 | long-chain-3-hydroxyacyl-CoA dehydrogenase activity(GO:0016509) |
| 0.8 | 8.3 | GO:0031996 | thioesterase binding(GO:0031996) |
| 0.8 | 2.5 | GO:0048027 | mRNA 5'-UTR binding(GO:0048027) |
| 0.8 | 4.9 | GO:0005114 | type II transforming growth factor beta receptor binding(GO:0005114) |
| 0.8 | 0.8 | GO:0051880 | G-quadruplex DNA binding(GO:0051880) |
| 0.8 | 13.9 | GO:0035259 | glucocorticoid receptor binding(GO:0035259) |
| 0.8 | 2.4 | GO:0071532 | ankyrin repeat binding(GO:0071532) |
| 0.8 | 4.1 | GO:0003847 | 1-alkyl-2-acetylglycerophosphocholine esterase activity(GO:0003847) |
| 0.8 | 12.2 | GO:0070577 | lysine-acetylated histone binding(GO:0070577) |
| 0.8 | 2.4 | GO:0042392 | sphingosine-1-phosphate phosphatase activity(GO:0042392) |
| 0.8 | 16.0 | GO:0003887 | DNA-directed DNA polymerase activity(GO:0003887) |
| 0.8 | 2.4 | GO:0030144 | alpha-1,6-mannosylglycoprotein 6-beta-N-acetylglucosaminyltransferase activity(GO:0030144) |
| 0.8 | 3.2 | GO:0004726 | non-membrane spanning protein tyrosine phosphatase activity(GO:0004726) |
| 0.8 | 3.2 | GO:0004566 | beta-glucuronidase activity(GO:0004566) |
| 0.8 | 2.4 | GO:0051033 | nucleic acid transmembrane transporter activity(GO:0051032) RNA transmembrane transporter activity(GO:0051033) |
| 0.8 | 3.2 | GO:0004035 | alkaline phosphatase activity(GO:0004035) |
| 0.8 | 3.2 | GO:0008526 | phosphatidylinositol transporter activity(GO:0008526) |
| 0.8 | 2.4 | GO:0045504 | dynein heavy chain binding(GO:0045504) |
| 0.8 | 2.4 | GO:0047276 | N-acetyllactosaminide 3-alpha-galactosyltransferase activity(GO:0047276) |
| 0.8 | 0.8 | GO:0031802 | type 5 metabotropic glutamate receptor binding(GO:0031802) |
| 0.8 | 2.3 | GO:0071253 | connexin binding(GO:0071253) |
| 0.8 | 3.1 | GO:0008349 | MAP kinase kinase kinase kinase activity(GO:0008349) |
| 0.8 | 2.3 | GO:0015526 | hexose phosphate transmembrane transporter activity(GO:0015119) organophosphate:inorganic phosphate antiporter activity(GO:0015315) hexose-phosphate:inorganic phosphate antiporter activity(GO:0015526) glucose 6-phosphate:inorganic phosphate antiporter activity(GO:0061513) |
| 0.8 | 43.0 | GO:0000979 | RNA polymerase II core promoter sequence-specific DNA binding(GO:0000979) |
| 0.8 | 4.6 | GO:0070097 | delta-catenin binding(GO:0070097) |
| 0.8 | 1.5 | GO:0005176 | ErbB-2 class receptor binding(GO:0005176) |
| 0.8 | 3.8 | GO:0005007 | fibroblast growth factor-activated receptor activity(GO:0005007) |
| 0.8 | 6.1 | GO:0004438 | phosphatidylinositol-3-phosphatase activity(GO:0004438) |
| 0.8 | 2.3 | GO:0031752 | D5 dopamine receptor binding(GO:0031752) |
| 0.8 | 3.1 | GO:0043515 | kinetochore binding(GO:0043515) |
| 0.8 | 3.0 | GO:0004305 | ethanolamine kinase activity(GO:0004305) |
| 0.8 | 0.8 | GO:0055106 | ligase regulator activity(GO:0055103) ubiquitin-protein transferase regulator activity(GO:0055106) |
| 0.8 | 6.8 | GO:0045294 | alpha-catenin binding(GO:0045294) |
| 0.8 | 2.3 | GO:0004017 | adenylate kinase activity(GO:0004017) |
| 0.8 | 1.5 | GO:0050692 | DBD domain binding(GO:0050692) |
| 0.8 | 3.0 | GO:0019788 | NEDD8 transferase activity(GO:0019788) |
| 0.8 | 59.7 | GO:0001047 | core promoter binding(GO:0001047) |
| 0.8 | 2.3 | GO:0050508 | glucuronosyl-N-acetylglucosaminyl-proteoglycan 4-alpha-N-acetylglucosaminyltransferase activity(GO:0050508) |
| 0.8 | 4.5 | GO:0004861 | cyclin-dependent protein serine/threonine kinase inhibitor activity(GO:0004861) |
| 0.8 | 6.8 | GO:0016857 | racemase and epimerase activity, acting on carbohydrates and derivatives(GO:0016857) |
| 0.7 | 6.0 | GO:0016922 | ligand-dependent nuclear receptor binding(GO:0016922) |
| 0.7 | 9.0 | GO:0001972 | retinoic acid binding(GO:0001972) |
| 0.7 | 2.2 | GO:0033300 | dehydroascorbic acid transporter activity(GO:0033300) |
| 0.7 | 2.2 | GO:0016842 | amidine-lyase activity(GO:0016842) |
| 0.7 | 8.2 | GO:0016813 | hydrolase activity, acting on carbon-nitrogen (but not peptide) bonds, in linear amidines(GO:0016813) |
| 0.7 | 3.0 | GO:0004430 | 1-phosphatidylinositol 4-kinase activity(GO:0004430) |
| 0.7 | 3.0 | GO:0003680 | AT DNA binding(GO:0003680) |
| 0.7 | 2.2 | GO:0003886 | DNA (cytosine-5-)-methyltransferase activity(GO:0003886) DNA (cytosine-5-)-methyltransferase activity, acting on CpG substrates(GO:0051718) |
| 0.7 | 5.2 | GO:0008113 | peptide-methionine (S)-S-oxide reductase activity(GO:0008113) |
| 0.7 | 2.2 | GO:0071535 | RING-like zinc finger domain binding(GO:0071535) |
| 0.7 | 15.4 | GO:0004298 | threonine-type endopeptidase activity(GO:0004298) threonine-type peptidase activity(GO:0070003) |
| 0.7 | 6.6 | GO:0052686 | 3-oxo-2-(2'-pentenyl)cyclopentane-1-octanoic acid CoA ligase activity(GO:0010435) 3-isopropenyl-6-oxoheptanoyl-CoA synthetase activity(GO:0018854) 2-oxo-delta3-4,5,5-trimethylcyclopentenylacetyl-CoA synthetase activity(GO:0018855) benzoyl acetate-CoA ligase activity(GO:0018856) 2,4-dichlorobenzoate-CoA ligase activity(GO:0018857) pivalate-CoA ligase activity(GO:0034783) cyclopropanecarboxylate-CoA ligase activity(GO:0034793) adipate-CoA ligase activity(GO:0034796) citronellyl-CoA ligase activity(GO:0034823) mentha-1,3-dione-CoA ligase activity(GO:0034841) thiophene-2-carboxylate-CoA ligase activity(GO:0034842) 2,4,4-trimethylpentanoate-CoA ligase activity(GO:0034865) cis-2-methyl-5-isopropylhexa-2,5-dienoate-CoA ligase activity(GO:0034942) trans-2-methyl-5-isopropylhexa-2,5-dienoate-CoA ligase activity(GO:0034943) branched-chain acyl-CoA synthetase (ADP-forming) activity(GO:0043759) aryl-CoA synthetase (ADP-forming) activity(GO:0043762) 3-hydroxypropionyl-CoA synthetase activity(GO:0043955) perillic acid:CoA ligase (ADP-forming) activity(GO:0052685) perillic acid:CoA ligase (AMP-forming) activity(GO:0052686) (3R)-3-isopropenyl-6-oxoheptanoate:CoA ligase (ADP-forming) activity(GO:0052687) (3R)-3-isopropenyl-6-oxoheptanoate:CoA ligase (AMP-forming) activity(GO:0052688) pristanate-CoA ligase activity(GO:0070251) malonyl-CoA synthetase activity(GO:0090409) |
| 0.7 | 5.9 | GO:0008889 | glycerophosphodiester phosphodiesterase activity(GO:0008889) |
| 0.7 | 0.7 | GO:0004000 | adenosine deaminase activity(GO:0004000) |
| 0.7 | 1.5 | GO:0015928 | fucosidase activity(GO:0015928) |
| 0.7 | 1.4 | GO:0042809 | vitamin D receptor binding(GO:0042809) |
| 0.7 | 2.2 | GO:0004920 | interleukin-10 receptor activity(GO:0004920) |
| 0.7 | 2.9 | GO:0004614 | phosphoglucomutase activity(GO:0004614) |
| 0.7 | 0.7 | GO:0052743 | inositol tetrakisphosphate phosphatase activity(GO:0052743) |
| 0.7 | 6.5 | GO:0034847 | pinocarveol dehydrogenase activity(GO:0018446) chloral hydrate dehydrogenase activity(GO:0018447) hydroxymethylmethylsilanediol oxidase activity(GO:0018448) 1-phenylethanol dehydrogenase activity(GO:0018449) myrtenol dehydrogenase activity(GO:0018450) cis-1,2-dihydroxy-1,2-dihydro-8-carboxynaphthalene dehydrogenase activity(GO:0034522) 3-hydroxy-4-methyloctanoyl-CoA dehydrogenase activity(GO:0034582) 2-hydroxy-4-isopropenylcyclohexane-1-carboxyl-CoA dehydrogenase activity(GO:0034778) cis-9,10-dihydroanthracene-9,10-diol dehydrogenase activity(GO:0034817) citronellol dehydrogenase activity(GO:0034821) naphthyl-2-hydroxymethyl-succinyl-CoA dehydrogenase activity(GO:0034847) 2,4,4-trimethyl-1-pentanol dehydrogenase activity(GO:0034863) 2,4,4-trimethyl-3-hydroxypentanoyl-CoA dehydrogenase activity(GO:0034868) 1-hydroxy-4,4-dimethylpentan-3-one dehydrogenase activity(GO:0034871) endosulfan diol dehydrogenase activity(GO:0034891) endosulfan hydroxyether dehydrogenase activity(GO:0034901) 3-hydroxy-2-methylhexanoyl-CoA dehydrogenase activity(GO:0034918) 3-hydroxy-2,6-dimethyl-5-methylene-heptanoyl-CoA dehydrogenase activity(GO:0034944) versicolorin reductase activity(GO:0042469) ketoreductase activity(GO:0045703) |
| 0.7 | 5.7 | GO:0042300 | pivalyl-CoA mutase activity(GO:0034784) o-hydroxylaminobenzoate mutase activity(GO:0034951) lupeol synthase activity(GO:0042299) beta-amyrin synthase activity(GO:0042300) baruol synthase activity(GO:0080011) |
| 0.7 | 0.7 | GO:0032452 | histone demethylase activity(GO:0032452) |
| 0.7 | 2.8 | GO:0102345 | 3-hydroxy-behenoyl-CoA dehydratase activity(GO:0102344) 3-hydroxy-lignoceroyl-CoA dehydratase activity(GO:0102345) |
| 0.7 | 0.7 | GO:0004809 | tRNA (guanine-N2-)-methyltransferase activity(GO:0004809) |
| 0.7 | 11.0 | GO:0070412 | R-SMAD binding(GO:0070412) |
| 0.7 | 10.9 | GO:0046966 | thyroid hormone receptor binding(GO:0046966) |
| 0.7 | 0.7 | GO:0031698 | beta-2 adrenergic receptor binding(GO:0031698) |
| 0.7 | 2.0 | GO:0031419 | cobalamin binding(GO:0031419) |
| 0.7 | 3.4 | GO:0016308 | 1-phosphatidylinositol-4-phosphate 5-kinase activity(GO:0016308) |
| 0.7 | 4.1 | GO:0005225 | volume-sensitive anion channel activity(GO:0005225) |
| 0.7 | 6.0 | GO:0001206 | transcriptional repressor activity, RNA polymerase II distal enhancer sequence-specific binding(GO:0001206) |
| 0.7 | 8.7 | GO:0008413 | 8-oxo-7,8-dihydroguanosine triphosphate pyrophosphatase activity(GO:0008413) |
| 0.7 | 31.2 | GO:0033613 | activating transcription factor binding(GO:0033613) |
| 0.7 | 7.3 | GO:0004806 | triglyceride lipase activity(GO:0004806) |
| 0.7 | 1.3 | GO:0004779 | sulfate adenylyltransferase activity(GO:0004779) |
| 0.7 | 2.0 | GO:0061676 | importin-alpha family protein binding(GO:0061676) |
| 0.7 | 2.0 | GO:0048248 | CXCR3 chemokine receptor binding(GO:0048248) |
| 0.7 | 2.0 | GO:0043891 | glyceraldehyde-3-phosphate dehydrogenase (NAD+) (phosphorylating) activity(GO:0004365) glyceraldehyde-3-phosphate dehydrogenase (NAD(P)+) (phosphorylating) activity(GO:0043891) |
| 0.7 | 1.3 | GO:0044769 | ATPase activity, coupled to transmembrane movement of ions, rotational mechanism(GO:0044769) |
| 0.6 | 0.6 | GO:0030792 | methylarsonite methyltransferase activity(GO:0030792) |
| 0.6 | 2.6 | GO:0004177 | aminopeptidase activity(GO:0004177) |
| 0.6 | 0.6 | GO:0032190 | acrosin binding(GO:0032190) |
| 0.6 | 6.4 | GO:0015651 | quaternary ammonium group transmembrane transporter activity(GO:0015651) |
| 0.6 | 18.5 | GO:0097472 | cyclin-dependent protein serine/threonine kinase activity(GO:0004693) cyclin-dependent protein kinase activity(GO:0097472) |
| 0.6 | 1.9 | GO:0005087 | Ran guanyl-nucleotide exchange factor activity(GO:0005087) |
| 0.6 | 3.2 | GO:0070891 | lipoteichoic acid binding(GO:0070891) |
| 0.6 | 4.4 | GO:0034894 | 3-(3-hydroxyphenyl)propionate hydroxylase activity(GO:0008688) 4-chlorobenzaldehyde oxidase activity(GO:0018471) 3,5-xylenol methylhydroxylase activity(GO:0018630) phenylacetate hydroxylase activity(GO:0018631) 4-nitrophenol 4-monooxygenase activity(GO:0018632) dimethyl sulfide monooxygenase activity(GO:0018633) alpha-pinene monooxygenase [NADH] activity(GO:0018634) 1-hydroxy-2-naphthoate hydroxylase activity(GO:0018637) toluene 4-monooxygenase activity(GO:0018638) xylene monooxygenase activity(GO:0018639) dibenzothiophene monooxygenase activity(GO:0018640) 6-hydroxy-3-methyl-2-oxo-1,2-dihydroquinoline 6-monooxygenase activity(GO:0018641) chlorophenol 4-monooxygenase activity(GO:0018642) carbon disulfide oxygenase activity(GO:0018643) toluene 2-monooxygenase activity(GO:0018644) 1-hydroxy-2-oxolimonene 1,2-monooxygenase activity(GO:0018646) phenanthrene 1,2-monooxygenase activity(GO:0018647) tetrahydrofuran hydroxylase activity(GO:0018649) styrene monooxygenase activity(GO:0018650) toluene-4-sulfonate monooxygenase activity(GO:0018651) toluene-sulfonate methyl-monooxygenase activity(GO:0018652) 3-methyl-2-oxo-1,2-dihydroquinoline 6-monooxygenase activity(GO:0018653) 2-hydroxy-phenylacetate hydroxylase activity(GO:0018654) 2-oxo-delta3-4,5,5-trimethylcyclopentenylacetyl-CoA 1,2-monooxygenase activity(GO:0018655) phenanthrene 3,4-monooxygenase activity(GO:0018656) toluene 3-monooxygenase activity(GO:0018657) 4-hydroxyphenylacetate,NADH:oxygen oxidoreductase (3-hydroxylating) activity(GO:0018660) limonene monooxygenase activity(GO:0019113) 2-methylnaphthalene hydroxylase activity(GO:0034526) 1-methylnaphthalene hydroxylase activity(GO:0034534) bisphenol A hydroxylase A activity(GO:0034560) salicylate 5-hydroxylase activity(GO:0034785) isobutylamine N-hydroxylase activity(GO:0034791) branched-chain dodecylbenzene sulfonate monooxygenase activity(GO:0034802) 3-HSA hydroxylase activity(GO:0034819) 4-hydroxypyridine-3-hydroxylase activity(GO:0034894) 2-octaprenyl-3-methyl-6-methoxy-1,4-benzoquinol hydroxylase activity(GO:0043719) 6-hydroxynicotinate 3-monooxygenase activity(GO:0043731) thalianol hydroxylase activity(GO:0080014) |
| 0.6 | 1.9 | GO:0004771 | sterol esterase activity(GO:0004771) |
| 0.6 | 3.7 | GO:0008821 | crossover junction endodeoxyribonuclease activity(GO:0008821) |
| 0.6 | 8.6 | GO:0017049 | GTP-Rho binding(GO:0017049) |
| 0.6 | 1.8 | GO:0003987 | acetate-CoA ligase activity(GO:0003987) |
| 0.6 | 9.8 | GO:0070008 | serine-type exopeptidase activity(GO:0070008) |
| 0.6 | 1.8 | GO:0003941 | L-serine ammonia-lyase activity(GO:0003941) |
| 0.6 | 8.0 | GO:0071949 | FAD binding(GO:0071949) |
| 0.6 | 1.2 | GO:0043262 | adenosine-diphosphatase activity(GO:0043262) |
| 0.6 | 2.4 | GO:0015375 | glycine:sodium symporter activity(GO:0015375) |
| 0.6 | 3.7 | GO:0051400 | BH domain binding(GO:0051400) |
| 0.6 | 0.6 | GO:0015440 | peptide-transporting ATPase activity(GO:0015440) |
| 0.6 | 0.6 | GO:0016428 | tRNA (cytosine) methyltransferase activity(GO:0016427) tRNA (cytosine-5-)-methyltransferase activity(GO:0016428) |
| 0.6 | 2.4 | GO:0070728 | leucine binding(GO:0070728) |
| 0.6 | 3.0 | GO:0070061 | fructose binding(GO:0070061) |
| 0.6 | 5.4 | GO:0019869 | chloride channel inhibitor activity(GO:0019869) |
| 0.6 | 4.7 | GO:0038036 | sphingosine-1-phosphate receptor activity(GO:0038036) |
| 0.6 | 10.6 | GO:0043027 | cysteine-type endopeptidase inhibitor activity involved in apoptotic process(GO:0043027) |
| 0.6 | 2.9 | GO:0008430 | selenium binding(GO:0008430) |
| 0.6 | 0.6 | GO:0032137 | guanine/thymine mispair binding(GO:0032137) |
| 0.6 | 4.1 | GO:0102391 | decanoate--CoA ligase activity(GO:0102391) |
| 0.6 | 1.2 | GO:0030519 | snoRNP binding(GO:0030519) |
| 0.6 | 4.1 | GO:0031702 | type 1 angiotensin receptor binding(GO:0031702) |
| 0.6 | 2.9 | GO:0004301 | epoxide hydrolase activity(GO:0004301) |
| 0.6 | 5.7 | GO:0070700 | BMP receptor binding(GO:0070700) |
| 0.6 | 4.6 | GO:0004571 | mannosyl-oligosaccharide 1,2-alpha-mannosidase activity(GO:0004571) |
| 0.6 | 4.0 | GO:0008097 | 5S rRNA binding(GO:0008097) |
| 0.6 | 2.3 | GO:0004045 | aminoacyl-tRNA hydrolase activity(GO:0004045) |
| 0.6 | 1.1 | GO:0015925 | galactosidase activity(GO:0015925) |
| 0.6 | 3.9 | GO:0004415 | hyalurononglucosaminidase activity(GO:0004415) |
| 0.6 | 10.0 | GO:0001848 | complement binding(GO:0001848) |
| 0.6 | 2.2 | GO:0005173 | stem cell factor receptor binding(GO:0005173) |
| 0.6 | 2.2 | GO:0016361 | activin receptor activity, type I(GO:0016361) |
| 0.5 | 5.5 | GO:0023026 | MHC class II protein complex binding(GO:0023026) |
| 0.5 | 2.2 | GO:0008934 | inositol monophosphate 1-phosphatase activity(GO:0008934) inositol monophosphate 3-phosphatase activity(GO:0052832) inositol monophosphate 4-phosphatase activity(GO:0052833) inositol monophosphate phosphatase activity(GO:0052834) |
| 0.5 | 1.1 | GO:0010997 | anaphase-promoting complex binding(GO:0010997) |
| 0.5 | 2.2 | GO:0034046 | poly(G) binding(GO:0034046) |
| 0.5 | 5.9 | GO:0015129 | lactate transmembrane transporter activity(GO:0015129) |
| 0.5 | 2.2 | GO:0004591 | oxoglutarate dehydrogenase (succinyl-transferring) activity(GO:0004591) |
| 0.5 | 15.5 | GO:0017112 | Rab guanyl-nucleotide exchange factor activity(GO:0017112) |
| 0.5 | 2.1 | GO:0016286 | small conductance calcium-activated potassium channel activity(GO:0016286) |
| 0.5 | 18.0 | GO:0004715 | non-membrane spanning protein tyrosine kinase activity(GO:0004715) |
| 0.5 | 5.8 | GO:0016307 | cobinamide kinase activity(GO:0008819) phytol kinase activity(GO:0010276) phosphatidylinositol phosphate kinase activity(GO:0016307) phenol kinase activity(GO:0018720) cyclin-dependent protein kinase activating kinase regulator activity(GO:0019914) inositol tetrakisphosphate 2-kinase activity(GO:0032942) heptose 7-phosphate kinase activity(GO:0033785) aminoglycoside phosphotransferase activity(GO:0034071) eukaryotic elongation factor-2 kinase regulator activity(GO:0042556) eukaryotic elongation factor-2 kinase activator activity(GO:0042557) LPPG:FO 2-phospho-L-lactate transferase activity(GO:0043743) cytidine kinase activity(GO:0043771) glycerate 2-kinase activity(GO:0043798) (S)-lactate 2-kinase activity(GO:0043841) phosphoserine:homoserine phosphotransferase activity(GO:0043899) L-seryl-tRNA(Sec) kinase activity(GO:0043915) phosphocholine transferase activity(GO:0044605) GTP-dependent polynucleotide kinase activity(GO:0051735) farnesol kinase activity(GO:0052668) CTP:2-trans,-6-trans-farnesol kinase activity(GO:0052669) geraniol kinase activity(GO:0052670) geranylgeraniol kinase activity(GO:0052671) CTP:geranylgeraniol kinase activity(GO:0052672) prenol kinase activity(GO:0052673) 1-phosphatidylinositol-5-kinase activity(GO:0052810) 1-phosphatidylinositol-3-phosphate 4-kinase activity(GO:0052811) phosphatidylinositol-3,4-bisphosphate 5-kinase activity(GO:0052812) inositol-3,4,6-trisphosphate 1-kinase activity(GO:0052835) inositol 5-diphosphate pentakisphosphate 5-kinase activity(GO:0052836) inositol diphosphate tetrakisphosphate kinase activity(GO:0052839) |
| 0.5 | 7.4 | GO:0008327 | methyl-CpG binding(GO:0008327) |
| 0.5 | 14.7 | GO:0070491 | repressing transcription factor binding(GO:0070491) |
| 0.5 | 0.5 | GO:0045322 | unmethylated CpG binding(GO:0045322) |
| 0.5 | 2.1 | GO:0016151 | nickel cation binding(GO:0016151) |
| 0.5 | 5.2 | GO:0044548 | S100 protein binding(GO:0044548) |
| 0.5 | 15.1 | GO:0030374 | ligand-dependent nuclear receptor transcription coactivator activity(GO:0030374) |
| 0.5 | 3.1 | GO:0047760 | butyrate-CoA ligase activity(GO:0047760) |
| 0.5 | 25.8 | GO:0038024 | cargo receptor activity(GO:0038024) |
| 0.5 | 1.5 | GO:0016401 | palmitoyl-CoA oxidase activity(GO:0016401) |
| 0.5 | 2.1 | GO:0017034 | Rap guanyl-nucleotide exchange factor activity(GO:0017034) |
| 0.5 | 1.5 | GO:0004748 | ribonucleoside-diphosphate reductase activity, thioredoxin disulfide as acceptor(GO:0004748) oxidoreductase activity, acting on CH or CH2 groups, disulfide as acceptor(GO:0016728) ribonucleoside-diphosphate reductase activity(GO:0061731) |
| 0.5 | 1.0 | GO:0043426 | MRF binding(GO:0043426) |
| 0.5 | 1.0 | GO:0034191 | apolipoprotein A-I receptor binding(GO:0034191) |
| 0.5 | 1.5 | GO:0035925 | mRNA 3'-UTR AU-rich region binding(GO:0035925) |
| 0.5 | 10.7 | GO:0043531 | ADP binding(GO:0043531) |
| 0.5 | 2.0 | GO:0004735 | pyrroline-5-carboxylate reductase activity(GO:0004735) |
| 0.5 | 0.5 | GO:0071987 | WD40-repeat domain binding(GO:0071987) |
| 0.5 | 1.0 | GO:0004359 | glutaminase activity(GO:0004359) |
| 0.5 | 82.5 | GO:0003924 | GTPase activity(GO:0003924) |
| 0.5 | 2.5 | GO:0004758 | serine C-palmitoyltransferase activity(GO:0004758) |
| 0.5 | 5.0 | GO:0004016 | adenylate cyclase activity(GO:0004016) |
| 0.5 | 3.4 | GO:0003964 | telomerase activity(GO:0003720) RNA-directed DNA polymerase activity(GO:0003964) |
| 0.5 | 3.9 | GO:0070182 | DNA polymerase binding(GO:0070182) |
| 0.5 | 8.8 | GO:0017025 | TBP-class protein binding(GO:0017025) |
| 0.5 | 0.5 | GO:0005134 | interleukin-2 receptor binding(GO:0005134) |
| 0.5 | 1.5 | GO:0080130 | L-phenylalanine aminotransferase activity(GO:0070546) L-phenylalanine:2-oxoglutarate aminotransferase activity(GO:0080130) |
| 0.5 | 15.0 | GO:0051723 | protein methylesterase activity(GO:0051723) |
| 0.5 | 1.5 | GO:0016880 | acid-ammonia (or amide) ligase activity(GO:0016880) |
| 0.5 | 1.0 | GO:0004677 | DNA-dependent protein kinase activity(GO:0004677) |
| 0.5 | 2.9 | GO:0004445 | inositol-polyphosphate 5-phosphatase activity(GO:0004445) |
| 0.5 | 3.8 | GO:0035497 | cAMP response element binding(GO:0035497) |
| 0.5 | 0.5 | GO:0071208 | histone pre-mRNA DCP binding(GO:0071208) |
| 0.5 | 1.0 | GO:0070548 | L-glutamine aminotransferase activity(GO:0070548) |
| 0.5 | 3.3 | GO:0016892 | endoribonuclease activity, producing 3'-phosphomonoesters(GO:0016892) |
| 0.5 | 7.6 | GO:0004709 | MAP kinase kinase kinase activity(GO:0004709) |
| 0.5 | 2.4 | GO:0036312 | phosphatidylinositol 3-kinase regulatory subunit binding(GO:0036312) |
| 0.5 | 5.7 | GO:0019206 | nucleoside kinase activity(GO:0019206) |
| 0.5 | 155.5 | GO:0004842 | ubiquitin-protein transferase activity(GO:0004842) |
| 0.5 | 2.8 | GO:0005021 | vascular endothelial growth factor-activated receptor activity(GO:0005021) |
| 0.5 | 0.5 | GO:0030942 | endoplasmic reticulum signal peptide binding(GO:0030942) |
| 0.5 | 19.6 | GO:0004722 | protein serine/threonine phosphatase activity(GO:0004722) |
| 0.5 | 2.8 | GO:0070300 | phosphatidic acid binding(GO:0070300) |
| 0.5 | 4.6 | GO:0015250 | water transmembrane transporter activity(GO:0005372) water channel activity(GO:0015250) |
| 0.5 | 1.4 | GO:0038100 | nodal binding(GO:0038100) |
| 0.5 | 3.7 | GO:1990446 | U1 snRNP binding(GO:1990446) |
| 0.5 | 6.9 | GO:0005149 | interleukin-1 receptor binding(GO:0005149) |
| 0.5 | 0.9 | GO:0036033 | mediator complex binding(GO:0036033) |
| 0.5 | 1.8 | GO:0070530 | K63-linked polyubiquitin binding(GO:0070530) |
| 0.5 | 22.3 | GO:0008138 | protein tyrosine/serine/threonine phosphatase activity(GO:0008138) |
| 0.5 | 4.5 | GO:0045028 | G-protein coupled nucleotide receptor activity(GO:0001608) G-protein coupled purinergic nucleotide receptor activity(GO:0045028) |
| 0.5 | 1.8 | GO:0015101 | organic cation transmembrane transporter activity(GO:0015101) |
| 0.4 | 1.3 | GO:0001205 | transcriptional activator activity, RNA polymerase II distal enhancer sequence-specific binding(GO:0001205) |
| 0.4 | 1.3 | GO:0047756 | chondroitin 4-sulfotransferase activity(GO:0047756) |
| 0.4 | 12.1 | GO:0008536 | Ran GTPase binding(GO:0008536) |
| 0.4 | 1.3 | GO:0043560 | insulin receptor substrate binding(GO:0043560) |
| 0.4 | 13.8 | GO:0005132 | type I interferon receptor binding(GO:0005132) |
| 0.4 | 1.3 | GO:0031730 | CCR5 chemokine receptor binding(GO:0031730) |
| 0.4 | 2.2 | GO:0047035 | testosterone dehydrogenase (NAD+) activity(GO:0047035) |
| 0.4 | 1.3 | GO:0016716 | oxidoreductase activity, acting on paired donors, with incorporation or reduction of molecular oxygen, another compound as one donor, and incorporation of one atom of oxygen(GO:0016716) |
| 0.4 | 2.7 | GO:0032794 | GTPase activating protein binding(GO:0032794) |
| 0.4 | 0.4 | GO:0008308 | voltage-gated anion channel activity(GO:0008308) |
| 0.4 | 1.3 | GO:0035251 | UDP-glucosyltransferase activity(GO:0035251) |
| 0.4 | 0.4 | GO:2001070 | starch binding(GO:2001070) |
| 0.4 | 1.7 | GO:0008429 | phosphatidylethanolamine binding(GO:0008429) |
| 0.4 | 3.5 | GO:0050681 | androgen receptor binding(GO:0050681) |
| 0.4 | 0.4 | GO:0019912 | cyclin-dependent protein kinase activating kinase activity(GO:0019912) |
| 0.4 | 1.3 | GO:1901612 | cardiolipin binding(GO:1901612) |
| 0.4 | 1.7 | GO:0043008 | ATP-dependent protein binding(GO:0043008) |
| 0.4 | 2.1 | GO:0016176 | superoxide-generating NADPH oxidase activator activity(GO:0016176) |
| 0.4 | 1.7 | GO:0015232 | heme transporter activity(GO:0015232) |
| 0.4 | 6.8 | GO:0017128 | phospholipid scramblase activity(GO:0017128) |
| 0.4 | 0.8 | GO:0030911 | TPR domain binding(GO:0030911) |
| 0.4 | 2.1 | GO:0019911 | structural constituent of myelin sheath(GO:0019911) |
| 0.4 | 5.0 | GO:0030742 | GTP-dependent protein binding(GO:0030742) |
| 0.4 | 3.3 | GO:0015321 | sodium-dependent phosphate transmembrane transporter activity(GO:0015321) |
| 0.4 | 1.3 | GO:0003747 | translation release factor activity(GO:0003747) translation termination factor activity(GO:0008079) |
| 0.4 | 0.4 | GO:0031701 | angiotensin receptor binding(GO:0031701) |
| 0.4 | 0.4 | GO:0019961 | interferon binding(GO:0019961) |
| 0.4 | 2.5 | GO:0004768 | stearoyl-CoA 9-desaturase activity(GO:0004768) |
| 0.4 | 2.9 | GO:0010314 | phosphatidylinositol-5-phosphate binding(GO:0010314) |
| 0.4 | 1.2 | GO:0008823 | cupric reductase activity(GO:0008823) ferric-chelate reductase (NADPH) activity(GO:0052851) |
| 0.4 | 0.4 | GO:0016531 | copper chaperone activity(GO:0016531) |
| 0.4 | 60.4 | GO:0005125 | cytokine activity(GO:0005125) |
| 0.4 | 1.6 | GO:0004062 | aryl sulfotransferase activity(GO:0004062) |
| 0.4 | 4.5 | GO:0048407 | platelet-derived growth factor binding(GO:0048407) |
| 0.4 | 0.8 | GO:0031750 | D3 dopamine receptor binding(GO:0031750) |
| 0.4 | 2.0 | GO:0004563 | beta-N-acetylhexosaminidase activity(GO:0004563) |
| 0.4 | 1.6 | GO:0005384 | manganese ion transmembrane transporter activity(GO:0005384) |
| 0.4 | 0.4 | GO:0016530 | metallochaperone activity(GO:0016530) |
| 0.4 | 2.0 | GO:0016208 | AMP binding(GO:0016208) |
| 0.4 | 1.2 | GO:0036122 | BMP binding(GO:0036122) |
| 0.4 | 1.2 | GO:0030492 | hemoglobin binding(GO:0030492) |
| 0.4 | 6.0 | GO:0010485 | H4 histone acetyltransferase activity(GO:0010485) |
| 0.4 | 1.2 | GO:1990226 | histone methyltransferase binding(GO:1990226) |
| 0.4 | 2.0 | GO:0015288 | porin activity(GO:0015288) |
| 0.4 | 2.4 | GO:0008266 | poly(U) RNA binding(GO:0008266) |
| 0.4 | 0.8 | GO:0009378 | four-way junction helicase activity(GO:0009378) |
| 0.4 | 1.6 | GO:0004594 | pantothenate kinase activity(GO:0004594) |
| 0.4 | 1.2 | GO:0042030 | ATPase inhibitor activity(GO:0042030) |
| 0.4 | 3.2 | GO:0010181 | FMN binding(GO:0010181) |
| 0.4 | 0.8 | GO:0000026 | alpha-1,2-mannosyltransferase activity(GO:0000026) |
| 0.4 | 2.8 | GO:0005229 | intracellular calcium activated chloride channel activity(GO:0005229) |
| 0.4 | 5.1 | GO:0001056 | RNA polymerase III activity(GO:0001056) |
| 0.4 | 0.8 | GO:0004332 | fructose-bisphosphate aldolase activity(GO:0004332) |
| 0.4 | 3.5 | GO:0050998 | nitric-oxide synthase binding(GO:0050998) |
| 0.4 | 6.2 | GO:0019865 | immunoglobulin binding(GO:0019865) |
| 0.4 | 1.2 | GO:0050252 | retinol O-fatty-acyltransferase activity(GO:0050252) |
| 0.4 | 6.5 | GO:0005527 | macrolide binding(GO:0005527) FK506 binding(GO:0005528) |
| 0.4 | 3.5 | GO:0015194 | L-serine transmembrane transporter activity(GO:0015194) serine transmembrane transporter activity(GO:0022889) |
| 0.4 | 2.3 | GO:0005388 | calcium-transporting ATPase activity(GO:0005388) |
| 0.4 | 0.8 | GO:0004630 | phospholipase D activity(GO:0004630) |
| 0.4 | 0.4 | GO:0030943 | mitochondrion targeting sequence binding(GO:0030943) |
| 0.4 | 11.8 | GO:0004540 | ribonuclease activity(GO:0004540) |
| 0.4 | 0.4 | GO:0070742 | C2H2 zinc finger domain binding(GO:0070742) |
| 0.4 | 0.8 | GO:0019145 | aminobutyraldehyde dehydrogenase activity(GO:0019145) 4-trimethylammoniobutyraldehyde dehydrogenase activity(GO:0047105) |
| 0.4 | 1.1 | GO:0019976 | interleukin-2 binding(GO:0019976) |
| 0.4 | 3.0 | GO:0019215 | intermediate filament binding(GO:0019215) |
| 0.4 | 1.5 | GO:0008242 | omega peptidase activity(GO:0008242) |
| 0.4 | 0.7 | GO:0031720 | haptoglobin binding(GO:0031720) |
| 0.4 | 1.5 | GO:0016888 | endodeoxyribonuclease activity, producing 5'-phosphomonoesters(GO:0016888) |
| 0.4 | 5.6 | GO:0015095 | magnesium ion transmembrane transporter activity(GO:0015095) |
| 0.4 | 13.9 | GO:0004812 | aminoacyl-tRNA ligase activity(GO:0004812) |
| 0.4 | 5.5 | GO:0070888 | E-box binding(GO:0070888) |
| 0.4 | 0.7 | GO:0016423 | tRNA (guanine) methyltransferase activity(GO:0016423) |
| 0.4 | 1.1 | GO:0046404 | ATP-dependent polydeoxyribonucleotide 5'-hydroxyl-kinase activity(GO:0046404) polydeoxyribonucleotide kinase activity(GO:0051733) |
| 0.4 | 6.2 | GO:0004029 | aldehyde dehydrogenase (NAD) activity(GO:0004029) |
| 0.4 | 5.1 | GO:0008422 | beta-glucosidase activity(GO:0008422) |
| 0.4 | 2.2 | GO:0030368 | interleukin-17 receptor activity(GO:0030368) |
| 0.4 | 1.1 | GO:0070139 | ubiquitin-like protein-specific endopeptidase activity(GO:0070137) SUMO-specific endopeptidase activity(GO:0070139) |
| 0.4 | 0.7 | GO:0015929 | hexosaminidase activity(GO:0015929) |
| 0.4 | 1.4 | GO:0070815 | peptidyl-lysine 5-dioxygenase activity(GO:0070815) |
| 0.4 | 11.1 | GO:0019209 | kinase activator activity(GO:0019209) |
| 0.4 | 0.7 | GO:0005168 | neurotrophin TRKA receptor binding(GO:0005168) |
| 0.4 | 4.3 | GO:0042162 | telomeric DNA binding(GO:0042162) |
| 0.4 | 1.1 | GO:0004126 | cytidine deaminase activity(GO:0004126) |
| 0.4 | 1.1 | GO:0072345 | NAADP-sensitive calcium-release channel activity(GO:0072345) |
| 0.4 | 1.4 | GO:0098847 | sequence-specific single stranded DNA binding(GO:0098847) |
| 0.4 | 0.7 | GO:0003997 | acyl-CoA oxidase activity(GO:0003997) |
| 0.4 | 1.8 | GO:0060590 | ATPase regulator activity(GO:0060590) |
| 0.4 | 1.1 | GO:0016494 | C-X-C chemokine receptor activity(GO:0016494) |
| 0.4 | 7.7 | GO:0045502 | dynein binding(GO:0045502) |
| 0.4 | 2.5 | GO:0008140 | cAMP response element binding protein binding(GO:0008140) |
| 0.3 | 1.7 | GO:0047372 | acylglycerol lipase activity(GO:0047372) |
| 0.3 | 1.4 | GO:0097642 | calcitonin family receptor activity(GO:0097642) |
| 0.3 | 0.7 | GO:0030899 | calcium-dependent ATPase activity(GO:0030899) |
| 0.3 | 2.4 | GO:0097027 | ubiquitin-protein transferase activator activity(GO:0097027) |
| 0.3 | 1.0 | GO:0004416 | hydroxyacylglutathione hydrolase activity(GO:0004416) |
| 0.3 | 1.7 | GO:0031078 | histone deacetylase activity (H3-K14 specific)(GO:0031078) NAD-dependent histone deacetylase activity (H3-K14 specific)(GO:0032041) |
| 0.3 | 0.7 | GO:0016262 | protein N-acetylglucosaminyltransferase activity(GO:0016262) |
| 0.3 | 0.7 | GO:0004013 | adenosylhomocysteinase activity(GO:0004013) trialkylsulfonium hydrolase activity(GO:0016802) |
| 0.3 | 1.0 | GO:0030544 | Hsp70 protein binding(GO:0030544) |
| 0.3 | 3.8 | GO:0071889 | 14-3-3 protein binding(GO:0071889) |
| 0.3 | 0.3 | GO:0043559 | insulin binding(GO:0043559) |
| 0.3 | 1.4 | GO:0043425 | bHLH transcription factor binding(GO:0043425) |
| 0.3 | 1.7 | GO:0070051 | fibrinogen binding(GO:0070051) |
| 0.3 | 1.4 | GO:0005534 | galactose binding(GO:0005534) |
| 0.3 | 1.3 | GO:0016833 | oxo-acid-lyase activity(GO:0016833) |
| 0.3 | 4.0 | GO:0004535 | poly(A)-specific ribonuclease activity(GO:0004535) |
| 0.3 | 2.7 | GO:0001055 | RNA polymerase II activity(GO:0001055) |
| 0.3 | 10.8 | GO:0048487 | beta-tubulin binding(GO:0048487) |
| 0.3 | 3.7 | GO:0051059 | NF-kappaB binding(GO:0051059) |
| 0.3 | 0.3 | GO:0015141 | succinate transmembrane transporter activity(GO:0015141) |
| 0.3 | 3.0 | GO:0008253 | 5'-nucleotidase activity(GO:0008253) |
| 0.3 | 1.3 | GO:0036374 | gamma-glutamyltransferase activity(GO:0003840) glutathione hydrolase activity(GO:0036374) |
| 0.3 | 26.8 | GO:0008171 | O-methyltransferase activity(GO:0008171) |
| 0.3 | 1.0 | GO:0070034 | telomerase RNA binding(GO:0070034) |
| 0.3 | 1.7 | GO:0046912 | transferase activity, transferring acyl groups, acyl groups converted into alkyl on transfer(GO:0046912) |
| 0.3 | 1.0 | GO:0004653 | polypeptide N-acetylgalactosaminyltransferase activity(GO:0004653) |
| 0.3 | 0.3 | GO:0042301 | phosphate ion binding(GO:0042301) |
| 0.3 | 4.9 | GO:0015145 | monosaccharide transmembrane transporter activity(GO:0015145) |
| 0.3 | 1.3 | GO:0004908 | interleukin-1 receptor activity(GO:0004908) |
| 0.3 | 5.9 | GO:0005158 | insulin receptor binding(GO:0005158) |
| 0.3 | 2.0 | GO:0050733 | RS domain binding(GO:0050733) |
| 0.3 | 27.4 | GO:0017137 | Rab GTPase binding(GO:0017137) |
| 0.3 | 28.6 | GO:0000149 | SNARE binding(GO:0000149) |
| 0.3 | 1.0 | GO:0031432 | titin binding(GO:0031432) |
| 0.3 | 0.3 | GO:0048030 | disaccharide binding(GO:0048030) |
| 0.3 | 1.9 | GO:0005487 | nucleocytoplasmic transporter activity(GO:0005487) |
| 0.3 | 1.6 | GO:0097322 | 7SK snRNA binding(GO:0097322) |
| 0.3 | 1.0 | GO:0033691 | sialic acid binding(GO:0033691) |
| 0.3 | 0.3 | GO:0016743 | carboxyl- or carbamoyltransferase activity(GO:0016743) |
| 0.3 | 3.2 | GO:0019825 | oxygen binding(GO:0019825) |
| 0.3 | 4.4 | GO:0008483 | transaminase activity(GO:0008483) |
| 0.3 | 3.5 | GO:0051019 | mitogen-activated protein kinase binding(GO:0051019) |
| 0.3 | 0.3 | GO:0019763 | immunoglobulin receptor activity(GO:0019763) |
| 0.3 | 8.8 | GO:0015485 | cholesterol binding(GO:0015485) |
| 0.3 | 12.8 | GO:0003725 | double-stranded RNA binding(GO:0003725) |
| 0.3 | 0.3 | GO:0045236 | CXCR chemokine receptor binding(GO:0045236) |
| 0.3 | 1.6 | GO:0000983 | transcription factor activity, RNA polymerase II core promoter sequence-specific(GO:0000983) |
| 0.3 | 0.9 | GO:0008506 | sucrose:proton symporter activity(GO:0008506) sucrose transmembrane transporter activity(GO:0008515) disaccharide transmembrane transporter activity(GO:0015154) oligosaccharide transmembrane transporter activity(GO:0015157) |
| 0.3 | 1.2 | GO:0004468 | lysine N-acetyltransferase activity, acting on acetyl phosphate as donor(GO:0004468) |
| 0.3 | 4.0 | GO:0008139 | nuclear localization sequence binding(GO:0008139) |
| 0.3 | 1.5 | GO:0035174 | histone serine kinase activity(GO:0035174) |
| 0.3 | 13.1 | GO:0016836 | hydro-lyase activity(GO:0016836) |
| 0.3 | 0.9 | GO:0004716 | receptor signaling protein tyrosine kinase activity(GO:0004716) |
| 0.3 | 19.3 | GO:0004197 | cysteine-type endopeptidase activity(GO:0004197) |
| 0.3 | 2.1 | GO:0005172 | vascular endothelial growth factor receptor binding(GO:0005172) |
| 0.3 | 1.2 | GO:0005280 | hydrogen:amino acid symporter activity(GO:0005280) |
| 0.3 | 1.2 | GO:0003873 | 6-phosphofructo-2-kinase activity(GO:0003873) |
| 0.3 | 1.5 | GO:0008190 | eukaryotic initiation factor 4E binding(GO:0008190) |
| 0.3 | 1.8 | GO:0016681 | ubiquinol-cytochrome-c reductase activity(GO:0008121) oxidoreductase activity, acting on diphenols and related substances as donors, cytochrome as acceptor(GO:0016681) |
| 0.3 | 14.2 | GO:0051082 | unfolded protein binding(GO:0051082) |
| 0.3 | 0.6 | GO:0003857 | 3-hydroxyacyl-CoA dehydrogenase activity(GO:0003857) |
| 0.3 | 2.1 | GO:0043274 | phospholipase binding(GO:0043274) |
| 0.3 | 0.6 | GO:0016838 | carbon-oxygen lyase activity, acting on phosphates(GO:0016838) |
| 0.3 | 0.9 | GO:0048038 | quinone binding(GO:0048038) |
| 0.3 | 35.9 | GO:0005525 | GTP binding(GO:0005525) |
| 0.3 | 7.0 | GO:0004869 | cysteine-type endopeptidase inhibitor activity(GO:0004869) |
| 0.3 | 0.3 | GO:0030371 | translation repressor activity(GO:0030371) |
| 0.3 | 9.6 | GO:0043022 | ribosome binding(GO:0043022) |
| 0.3 | 0.9 | GO:0003910 | DNA ligase activity(GO:0003909) DNA ligase (ATP) activity(GO:0003910) |
| 0.3 | 0.3 | GO:0031727 | CCR2 chemokine receptor binding(GO:0031727) |
| 0.3 | 0.3 | GO:0016679 | oxidoreductase activity, acting on diphenols and related substances as donors(GO:0016679) |
| 0.3 | 1.7 | GO:0008417 | fucosyltransferase activity(GO:0008417) |
| 0.3 | 0.6 | GO:0004939 | beta-adrenergic receptor activity(GO:0004939) |
| 0.3 | 0.9 | GO:0015266 | protein channel activity(GO:0015266) |
| 0.3 | 2.3 | GO:0004568 | chitinase activity(GO:0004568) |
| 0.3 | 1.4 | GO:0004859 | phospholipase inhibitor activity(GO:0004859) |
| 0.3 | 3.7 | GO:0030515 | snoRNA binding(GO:0030515) |
| 0.3 | 0.3 | GO:0031871 | proteinase activated receptor binding(GO:0031871) |
| 0.3 | 5.6 | GO:0016676 | cytochrome-c oxidase activity(GO:0004129) heme-copper terminal oxidase activity(GO:0015002) oxidoreductase activity, acting on a heme group of donors(GO:0016675) oxidoreductase activity, acting on a heme group of donors, oxygen as acceptor(GO:0016676) |
| 0.3 | 2.8 | GO:0031404 | chloride ion binding(GO:0031404) |
| 0.3 | 0.3 | GO:0000386 | second spliceosomal transesterification activity(GO:0000386) |
| 0.3 | 1.6 | GO:0045545 | syndecan binding(GO:0045545) |
| 0.3 | 0.3 | GO:0034714 | type III transforming growth factor beta receptor binding(GO:0034714) |
| 0.3 | 1.6 | GO:0005338 | nucleotide-sugar transmembrane transporter activity(GO:0005338) |
| 0.3 | 0.3 | GO:0008408 | 3'-5' exonuclease activity(GO:0008408) |
| 0.3 | 0.3 | GO:0071209 | U7 snRNA binding(GO:0071209) |
| 0.3 | 1.6 | GO:0016783 | sulfurtransferase activity(GO:0016783) |
| 0.3 | 0.8 | GO:0018555 | 2,3-dihydroxy DDT 1,2-dioxygenase activity(GO:0018542) phenanthrene dioxygenase activity(GO:0018555) 2,2',3-trihydroxybiphenyl dioxygenase activity(GO:0018556) 1,2-dihydroxyfluorene 1,1-alpha-dioxygenase activity(GO:0018557) 5,6-dihydroxy-3-methyl-2-oxo-1,2-dihydroquinoline dioxygenase activity(GO:0018558) 1,1-dichloro-2-(dihydroxy-4-chlorophenyl)-(4-chlorophenyl)ethene 1,2-dioxygenase activity(GO:0018559) protocatechuate 3,4-dioxygenase type II activity(GO:0018560) 2'-aminobiphenyl-2,3-diol 1,2-dioxygenase activity(GO:0018561) 3,4-dihydroxyfluorene 4,4-alpha-dioxygenase activity(GO:0018562) 2,3-dihydroxy-ethylbenzene 1,2-dioxygenase activity(GO:0018563) carbazole 1,9a-dioxygenase activity(GO:0018564) dihydroxydibenzothiophene dioxygenase activity(GO:0018565) 1,2-dihydroxynaphthalene-6-sulfonate 1,8a-dioxygenase activity(GO:0018566) styrene dioxygenase activity(GO:0018567) 3,4-dihydroxyphenanthrene dioxygenase activity(GO:0018568) hydroquinone 1,2-dioxygenase activity(GO:0018569) p-cumate 2,3-dioxygenase activity(GO:0018570) 2,3-dihydroxy-p-cumate dioxygenase activity(GO:0018571) 3,5-dichlorocatechol 1,2-dioxygenase activity(GO:0018572) 2-aminophenol 1,6-dioxygenase activity(GO:0018573) 2,6-dichloro-p-hydroquinone 1,2-dioxygenase activity(GO:0018574) chlorocatechol 1,2-dioxygenase activity(GO:0018575) catechol dioxygenase activity(GO:0019114) dihydroxyfluorene dioxygenase activity(GO:0019117) 5-aminosalicylate dioxygenase activity(GO:0034543) 3-hydroxy-2-naphthoate 2,3-dioxygenase activity(GO:0034803) benzo(a)pyrene 11,12-dioxygenase activity(GO:0034806) benzo(a)pyrene 4,5-dioxygenase activity(GO:0034808) 4,5-dihydroxybenzo(a)pyrene dioxygenase activity(GO:0034810) benzo(a)pyrene 9,10-dioxygenase activity(GO:0034811) 9,10-dihydroxybenzo(a)pyrene dioxygenase activity(GO:0034812) benzo(a)pyrene 7,8-dioxygenase activity(GO:0034813) 7,8-dihydroxy benzo(a)pyrene dioxygenase activity(GO:0034814) 1,2-dihydroxy-5,6,7,8-tetrahydronaphthalene extradiol dioxygenase activity(GO:0034827) 2-mercaptobenzothiazole dioxygenase activity(GO:0034834) pyridine-3,4-diol dioxygenase activity(GO:0034895) pyrene dioxygenase activity(GO:0034920) 4,5-dihydroxypyrene dioxygenase activity(GO:0034922) phenanthrene-4-carboxylate dioxygenase activity(GO:0034934) tetrachlorobenzene dioxygenase activity(GO:0034935) 4,6-dichloro-3-methylcatechol 1,2-dioxygenase activity(GO:0034936) 2,3-dihydroxydiphenyl ether dioxygenase activity(GO:0034955) diphenyl ether 1,2-dioxygenase activity(GO:0034956) arachidonate 8(S)-lipoxygenase activity(GO:0036403) 4-hydroxycatechol 1,2-dioxygenase activity(GO:0047074) |
| 0.3 | 0.3 | GO:0016300 | tRNA (uracil) methyltransferase activity(GO:0016300) |
| 0.3 | 1.1 | GO:0031782 | melanocortin receptor binding(GO:0031779) type 3 melanocortin receptor binding(GO:0031781) type 4 melanocortin receptor binding(GO:0031782) |
| 0.3 | 0.3 | GO:0004741 | [pyruvate dehydrogenase (lipoamide)] phosphatase activity(GO:0004741) |
| 0.3 | 0.3 | GO:0035514 | DNA demethylase activity(GO:0035514) |
| 0.3 | 0.5 | GO:0016854 | racemase and epimerase activity(GO:0016854) |
| 0.3 | 1.8 | GO:0031434 | mitogen-activated protein kinase kinase binding(GO:0031434) |
| 0.3 | 1.0 | GO:1990381 | ubiquitin-specific protease binding(GO:1990381) |
| 0.3 | 2.6 | GO:0008307 | structural constituent of muscle(GO:0008307) |
| 0.3 | 3.6 | GO:0001106 | RNA polymerase II transcription corepressor activity(GO:0001106) |
| 0.3 | 1.6 | GO:0008568 | microtubule-severing ATPase activity(GO:0008568) |
| 0.3 | 2.6 | GO:0045296 | cadherin binding(GO:0045296) |
| 0.3 | 0.3 | GO:0004663 | Rab geranylgeranyltransferase activity(GO:0004663) |
| 0.3 | 1.3 | GO:0019203 | carbohydrate phosphatase activity(GO:0019203) sugar-phosphatase activity(GO:0050308) |
| 0.3 | 1.0 | GO:0070064 | proline-rich region binding(GO:0070064) |
| 0.3 | 0.8 | GO:0017089 | glycolipid transporter activity(GO:0017089) |
| 0.3 | 8.8 | GO:0051020 | GTPase binding(GO:0051020) |
| 0.3 | 2.5 | GO:0016538 | cyclin-dependent protein serine/threonine kinase regulator activity(GO:0016538) |
| 0.2 | 1.0 | GO:0008239 | dipeptidyl-peptidase activity(GO:0008239) |
| 0.2 | 1.5 | GO:0008508 | bile acid:sodium symporter activity(GO:0008508) |
| 0.2 | 9.9 | GO:0008757 | S-adenosylmethionine-dependent methyltransferase activity(GO:0008757) |
| 0.2 | 0.2 | GO:0051021 | GDP-dissociation inhibitor binding(GO:0051021) |
| 0.2 | 0.7 | GO:0008199 | ferric iron binding(GO:0008199) |
| 0.2 | 16.1 | GO:0005178 | integrin binding(GO:0005178) |
| 0.2 | 0.2 | GO:0000064 | L-ornithine transmembrane transporter activity(GO:0000064) |
| 0.2 | 1.2 | GO:0052724 | inositol hexakisphosphate kinase activity(GO:0000828) inositol hexakisphosphate 5-kinase activity(GO:0000832) inositol hexakisphosphate 1-kinase activity(GO:0052723) inositol hexakisphosphate 3-kinase activity(GO:0052724) |
| 0.2 | 0.5 | GO:0019959 | interleukin-8 binding(GO:0019959) |
| 0.2 | 25.9 | GO:0005096 | GTPase activator activity(GO:0005096) |
| 0.2 | 0.2 | GO:0015927 | trehalase activity(GO:0015927) |
| 0.2 | 1.4 | GO:0004579 | dolichyl-diphosphooligosaccharide-protein glycotransferase activity(GO:0004579) |
| 0.2 | 1.0 | GO:0035586 | purinergic receptor activity(GO:0035586) |
| 0.2 | 13.5 | GO:0008026 | ATP-dependent helicase activity(GO:0008026) purine NTP-dependent helicase activity(GO:0070035) |
| 0.2 | 2.2 | GO:0004844 | uracil DNA N-glycosylase activity(GO:0004844) deaminated base DNA N-glycosylase activity(GO:0097506) |
| 0.2 | 1.7 | GO:0005542 | folic acid binding(GO:0005542) |
| 0.2 | 4.5 | GO:0016763 | transferase activity, transferring pentosyl groups(GO:0016763) |
| 0.2 | 11.2 | GO:0017048 | Rho GTPase binding(GO:0017048) |
| 0.2 | 0.2 | GO:0004583 | dolichyl-phosphate-glucose-glycolipid alpha-glucosyltransferase activity(GO:0004583) |
| 0.2 | 10.5 | GO:0016628 | oxidoreductase activity, acting on the CH-CH group of donors, NAD or NADP as acceptor(GO:0016628) |
| 0.2 | 0.7 | GO:0015220 | choline transmembrane transporter activity(GO:0015220) |
| 0.2 | 1.4 | GO:0017134 | fibroblast growth factor binding(GO:0017134) |
| 0.2 | 0.2 | GO:0050220 | prostaglandin-E synthase activity(GO:0050220) |
| 0.2 | 4.0 | GO:0030170 | pyridoxal phosphate binding(GO:0030170) |
| 0.2 | 10.6 | GO:0047485 | protein N-terminus binding(GO:0047485) |
| 0.2 | 0.2 | GO:0000009 | alpha-1,6-mannosyltransferase activity(GO:0000009) |
| 0.2 | 0.7 | GO:0016661 | oxidoreductase activity, acting on other nitrogenous compounds as donors(GO:0016661) |
| 0.2 | 1.9 | GO:0001530 | lipopolysaccharide binding(GO:0001530) |
| 0.2 | 0.2 | GO:0008251 | tRNA-specific adenosine deaminase activity(GO:0008251) |
| 0.2 | 0.5 | GO:0019103 | pyrimidine nucleotide binding(GO:0019103) |
| 0.2 | 1.6 | GO:0003796 | lysozyme activity(GO:0003796) |
| 0.2 | 0.9 | GO:0000150 | recombinase activity(GO:0000150) |
| 0.2 | 0.5 | GO:0005436 | sodium:phosphate symporter activity(GO:0005436) |
| 0.2 | 8.8 | GO:0016811 | hydrolase activity, acting on carbon-nitrogen (but not peptide) bonds, in linear amides(GO:0016811) |
| 0.2 | 0.9 | GO:0019213 | deacetylase activity(GO:0019213) |
| 0.2 | 3.2 | GO:0030145 | manganese ion binding(GO:0030145) |
| 0.2 | 1.8 | GO:0019841 | retinol binding(GO:0019841) |
| 0.2 | 2.3 | GO:0004602 | glutathione peroxidase activity(GO:0004602) |
| 0.2 | 2.5 | GO:0004745 | retinol dehydrogenase activity(GO:0004745) |
| 0.2 | 0.9 | GO:0019201 | nucleotide kinase activity(GO:0019201) |
| 0.2 | 3.6 | GO:0000049 | tRNA binding(GO:0000049) |
| 0.2 | 3.8 | GO:0050661 | NADP binding(GO:0050661) |
| 0.2 | 1.5 | GO:0050291 | sphingosine N-acyltransferase activity(GO:0050291) |
| 0.2 | 1.5 | GO:0048531 | beta-1,3-galactosyltransferase activity(GO:0048531) |
| 0.2 | 0.2 | GO:0001637 | G-protein coupled chemoattractant receptor activity(GO:0001637) chemokine receptor activity(GO:0004950) |
| 0.2 | 184.7 | GO:0003723 | RNA binding(GO:0003723) |
| 0.2 | 1.9 | GO:0034946 | 2-oxoglutaryl-CoA thioesterase activity(GO:0034843) 2,4,4-trimethyl-3-oxopentanoyl-CoA thioesterase activity(GO:0034869) 3-isopropylbut-3-enoyl-CoA thioesterase activity(GO:0034946) glutaryl-CoA hydrolase activity(GO:0044466) |
| 0.2 | 4.5 | GO:0005385 | zinc ion transmembrane transporter activity(GO:0005385) |
| 0.2 | 1.5 | GO:0070273 | phosphatidylinositol-4-phosphate binding(GO:0070273) |
| 0.2 | 11.6 | GO:0000978 | RNA polymerase II core promoter proximal region sequence-specific DNA binding(GO:0000978) |
| 0.2 | 0.9 | GO:0003993 | acid phosphatase activity(GO:0003993) |
| 0.2 | 0.4 | GO:0008545 | JUN kinase kinase activity(GO:0008545) |
| 0.2 | 1.1 | GO:0008454 | alpha-1,3-mannosylglycoprotein 4-beta-N-acetylglucosaminyltransferase activity(GO:0008454) |
| 0.2 | 2.5 | GO:0030507 | spectrin binding(GO:0030507) |
| 0.2 | 0.6 | GO:0016835 | carbon-oxygen lyase activity(GO:0016835) |
| 0.2 | 8.1 | GO:0015171 | amino acid transmembrane transporter activity(GO:0015171) |
| 0.2 | 0.4 | GO:0005350 | purine nucleobase transmembrane transporter activity(GO:0005345) pyrimidine nucleobase transmembrane transporter activity(GO:0005350) nucleobase transmembrane transporter activity(GO:0015205) |
| 0.2 | 0.6 | GO:0045134 | uridine-diphosphatase activity(GO:0045134) |
| 0.2 | 2.3 | GO:0043236 | laminin binding(GO:0043236) |
| 0.2 | 0.6 | GO:0016715 | oxidoreductase activity, acting on paired donors, with incorporation or reduction of molecular oxygen, reduced ascorbate as one donor, and incorporation of one atom of oxygen(GO:0016715) |
| 0.2 | 1.0 | GO:0015349 | thyroid hormone transmembrane transporter activity(GO:0015349) |
| 0.2 | 1.6 | GO:0016929 | SUMO-specific protease activity(GO:0016929) |
| 0.2 | 0.6 | GO:0036435 | K48-linked polyubiquitin binding(GO:0036435) |
| 0.2 | 0.8 | GO:0032036 | myosin heavy chain binding(GO:0032036) |
| 0.2 | 2.6 | GO:0005154 | epidermal growth factor receptor binding(GO:0005154) |
| 0.2 | 0.6 | GO:0017153 | sodium:dicarboxylate symporter activity(GO:0017153) |
| 0.2 | 0.2 | GO:0045182 | translation regulator activity(GO:0045182) |
| 0.2 | 2.1 | GO:0003755 | peptidyl-prolyl cis-trans isomerase activity(GO:0003755) |
| 0.2 | 1.7 | GO:0016776 | phosphotransferase activity, phosphate group as acceptor(GO:0016776) |
| 0.2 | 1.0 | GO:0004769 | steroid delta-isomerase activity(GO:0004769) |
| 0.2 | 0.4 | GO:0030169 | low-density lipoprotein particle binding(GO:0030169) |
| 0.2 | 0.8 | GO:1990841 | promoter-specific chromatin binding(GO:1990841) |
| 0.2 | 0.9 | GO:0015181 | arginine transmembrane transporter activity(GO:0015181) L-lysine transmembrane transporter activity(GO:0015189) |
| 0.2 | 0.4 | GO:0004667 | prostaglandin-D synthase activity(GO:0004667) |
| 0.2 | 26.9 | GO:0004252 | serine-type endopeptidase activity(GO:0004252) |
| 0.2 | 0.6 | GO:0030976 | thiamine pyrophosphate binding(GO:0030976) |
| 0.2 | 0.2 | GO:0004645 | phosphorylase activity(GO:0004645) |
| 0.2 | 3.3 | GO:0052634 | sulfonate dioxygenase activity(GO:0000907) 2,4-dichlorophenoxyacetate alpha-ketoglutarate dioxygenase activity(GO:0018602) hypophosphite dioxygenase activity(GO:0034792) DNA-N1-methyladenine dioxygenase activity(GO:0043734) gibberellin 2-beta-dioxygenase activity(GO:0045543) C-19 gibberellin 2-beta-dioxygenase activity(GO:0052634) C-20 gibberellin 2-beta-dioxygenase activity(GO:0052635) |
| 0.2 | 0.2 | GO:0016841 | ammonia-lyase activity(GO:0016841) |
| 0.2 | 0.9 | GO:0050431 | transforming growth factor beta binding(GO:0050431) |
| 0.2 | 0.2 | GO:0015662 | ATPase activity, coupled to transmembrane movement of ions, phosphorylative mechanism(GO:0015662) |
| 0.2 | 0.6 | GO:0003918 | DNA topoisomerase type II (ATP-hydrolyzing) activity(GO:0003918) DNA topoisomerase II activity(GO:0061505) |
| 0.2 | 0.5 | GO:1990050 | phosphatidic acid transporter activity(GO:1990050) |
| 0.2 | 0.4 | GO:0030983 | mismatched DNA binding(GO:0030983) |
| 0.2 | 0.7 | GO:0017127 | cholesterol transporter activity(GO:0017127) |
| 0.2 | 0.2 | GO:0016655 | oxidoreductase activity, acting on NAD(P)H, quinone or similar compound as acceptor(GO:0016655) |
| 0.2 | 2.9 | GO:0050136 | NADH dehydrogenase (ubiquinone) activity(GO:0008137) NADH dehydrogenase (quinone) activity(GO:0050136) |
| 0.2 | 0.5 | GO:0070016 | armadillo repeat domain binding(GO:0070016) |
| 0.2 | 3.9 | GO:0019706 | protein-cysteine S-palmitoyltransferase activity(GO:0019706) |
| 0.2 | 14.5 | GO:0005085 | guanyl-nucleotide exchange factor activity(GO:0005085) |
| 0.2 | 0.4 | GO:0051184 | cofactor transporter activity(GO:0051184) |
| 0.2 | 4.0 | GO:0042826 | histone deacetylase binding(GO:0042826) |
| 0.2 | 1.0 | GO:0043014 | alpha-tubulin binding(GO:0043014) |
| 0.2 | 0.3 | GO:0003696 | satellite DNA binding(GO:0003696) |
| 0.2 | 0.7 | GO:0043138 | 3'-5' DNA helicase activity(GO:0043138) |
| 0.2 | 0.5 | GO:0016668 | oxidoreductase activity, acting on a sulfur group of donors, NAD(P) as acceptor(GO:0016668) |
| 0.2 | 1.4 | GO:0008601 | protein phosphatase type 2A regulator activity(GO:0008601) |
| 0.2 | 0.2 | GO:0004176 | ATP-dependent peptidase activity(GO:0004176) |
| 0.2 | 3.5 | GO:0004222 | metalloendopeptidase activity(GO:0004222) |
| 0.2 | 0.5 | GO:0017110 | nucleoside-diphosphatase activity(GO:0017110) |
| 0.2 | 0.2 | GO:0032422 | purine-rich negative regulatory element binding(GO:0032422) |
| 0.2 | 0.5 | GO:0031005 | filamin binding(GO:0031005) |
| 0.2 | 2.1 | GO:0003697 | single-stranded DNA binding(GO:0003697) |
| 0.2 | 0.7 | GO:0005536 | glucose binding(GO:0005536) |
| 0.2 | 3.1 | GO:0005507 | copper ion binding(GO:0005507) |
| 0.2 | 2.3 | GO:0017022 | myosin binding(GO:0017022) |
| 0.2 | 0.2 | GO:0051373 | FATZ binding(GO:0051373) |
| 0.2 | 1.1 | GO:0036442 | hydrogen-exporting ATPase activity(GO:0036442) |
| 0.2 | 1.0 | GO:0050750 | low-density lipoprotein particle receptor binding(GO:0050750) |
| 0.2 | 1.1 | GO:0035258 | steroid hormone receptor binding(GO:0035258) |
| 0.2 | 0.8 | GO:0004994 | somatostatin receptor activity(GO:0004994) |
| 0.2 | 6.7 | GO:0005496 | steroid binding(GO:0005496) |
| 0.2 | 0.8 | GO:0001135 | transcription factor activity, RNA polymerase II transcription factor recruiting(GO:0001135) |
| 0.2 | 0.2 | GO:0090599 | alpha-glucosidase activity(GO:0090599) |
| 0.2 | 0.2 | GO:0001016 | RNA polymerase III regulatory region DNA binding(GO:0001016) RNA polymerase III type 1 promoter DNA binding(GO:0001030) RNA polymerase III type 2 promoter DNA binding(GO:0001031) RNA polymerase III type 3 promoter DNA binding(GO:0001032) 5S rDNA binding(GO:0080084) |
| 0.2 | 0.9 | GO:0050321 | tau-protein kinase activity(GO:0050321) |
| 0.2 | 7.0 | GO:0017124 | SH3 domain binding(GO:0017124) |
| 0.2 | 0.6 | GO:0015174 | basic amino acid transmembrane transporter activity(GO:0015174) |
| 0.2 | 10.2 | GO:0000287 | magnesium ion binding(GO:0000287) |
| 0.2 | 0.3 | GO:1902282 | voltage-gated potassium channel activity involved in ventricular cardiac muscle cell action potential repolarization(GO:1902282) |
| 0.2 | 11.9 | GO:0003774 | motor activity(GO:0003774) |
| 0.2 | 1.2 | GO:0001618 | virus receptor activity(GO:0001618) |
| 0.2 | 0.3 | GO:0008384 | IkappaB kinase activity(GO:0008384) |
| 0.2 | 0.3 | GO:0034235 | GPI anchor binding(GO:0034235) |
| 0.2 | 0.2 | GO:0008158 | hedgehog receptor activity(GO:0008158) |
| 0.1 | 0.6 | GO:0005391 | sodium:potassium-exchanging ATPase activity(GO:0005391) |
| 0.1 | 0.1 | GO:0008252 | nucleotidase activity(GO:0008252) |
| 0.1 | 2.8 | GO:0043130 | ubiquitin binding(GO:0043130) |
| 0.1 | 0.3 | GO:0016894 | endonuclease activity, active with either ribo- or deoxyribonucleic acids and producing 3'-phosphomonoesters(GO:0016894) |
| 0.1 | 0.4 | GO:0016868 | intramolecular transferase activity, phosphotransferases(GO:0016868) |
| 0.1 | 1.6 | GO:0070063 | RNA polymerase binding(GO:0070063) |
| 0.1 | 0.3 | GO:0010858 | calcium-dependent protein kinase inhibitor activity(GO:0008427) calcium-dependent protein kinase regulator activity(GO:0010858) |
| 0.1 | 0.1 | GO:0004886 | 9-cis retinoic acid receptor activity(GO:0004886) |
| 0.1 | 0.3 | GO:0018585 | fluorene oxygenase activity(GO:0018585) |
| 0.1 | 0.1 | GO:0070840 | dynein complex binding(GO:0070840) |
| 0.1 | 0.6 | GO:0070513 | death domain binding(GO:0070513) |
| 0.1 | 0.4 | GO:0016744 | transferase activity, transferring aldehyde or ketonic groups(GO:0016744) |
| 0.1 | 1.4 | GO:0031072 | heat shock protein binding(GO:0031072) |
| 0.1 | 0.8 | GO:0042288 | MHC class I protein binding(GO:0042288) |
| 0.1 | 0.3 | GO:0016801 | hydrolase activity, acting on ether bonds(GO:0016801) |
| 0.1 | 0.4 | GO:0004366 | glycerol-3-phosphate O-acyltransferase activity(GO:0004366) |
| 0.1 | 0.5 | GO:0004966 | galanin receptor activity(GO:0004966) |
| 0.1 | 0.8 | GO:0005548 | phospholipid transporter activity(GO:0005548) |
| 0.1 | 0.4 | GO:0019808 | polyamine binding(GO:0019808) |
| 0.1 | 0.9 | GO:0032451 | demethylase activity(GO:0032451) |
| 0.1 | 0.4 | GO:0050649 | testosterone 6-beta-hydroxylase activity(GO:0050649) |
| 0.1 | 0.5 | GO:0043522 | leucine zipper domain binding(GO:0043522) |
| 0.1 | 0.1 | GO:0015926 | glucosidase activity(GO:0015926) |
| 0.1 | 1.4 | GO:0050840 | extracellular matrix binding(GO:0050840) |
| 0.1 | 2.6 | GO:0008047 | enzyme activator activity(GO:0008047) |
| 0.1 | 0.3 | GO:0004800 | thyroxine 5'-deiodinase activity(GO:0004800) |
| 0.1 | 0.1 | GO:0000217 | DNA secondary structure binding(GO:0000217) |
| 0.1 | 3.0 | GO:0050660 | flavin adenine dinucleotide binding(GO:0050660) |
| 0.1 | 2.0 | GO:0002039 | p53 binding(GO:0002039) |
| 0.1 | 0.6 | GO:0004957 | prostaglandin E receptor activity(GO:0004957) |
| 0.1 | 0.2 | GO:0005143 | interleukin-12 receptor binding(GO:0005143) |
| 0.1 | 0.1 | GO:0048019 | receptor antagonist activity(GO:0048019) |
| 0.1 | 0.1 | GO:0070653 | high-density lipoprotein particle receptor binding(GO:0070653) |
| 0.1 | 0.5 | GO:0008276 | protein methyltransferase activity(GO:0008276) |
| 0.1 | 0.7 | GO:0047498 | calcium-dependent phospholipase A2 activity(GO:0047498) |
| 0.1 | 0.5 | GO:0016638 | oxidoreductase activity, acting on the CH-NH2 group of donors(GO:0016638) oxidoreductase activity, acting on the CH-NH2 group of donors, oxygen as acceptor(GO:0016641) |
| 0.1 | 6.5 | GO:0008375 | acetylglucosaminyltransferase activity(GO:0008375) |
| 0.1 | 2.5 | GO:0035064 | methylated histone binding(GO:0035064) |
| 0.1 | 0.5 | GO:0031210 | phosphatidylcholine binding(GO:0031210) |
| 0.1 | 0.2 | GO:0046848 | hydroxyapatite binding(GO:0046848) |
| 0.1 | 1.3 | GO:0016790 | thiolester hydrolase activity(GO:0016790) |
| 0.1 | 1.7 | GO:0001594 | trace-amine receptor activity(GO:0001594) |
| 0.1 | 2.3 | GO:0030674 | protein binding, bridging(GO:0030674) |
| 0.1 | 1.3 | GO:0042813 | Wnt-activated receptor activity(GO:0042813) |
| 0.1 | 0.3 | GO:0035014 | phosphatidylinositol 3-kinase regulator activity(GO:0035014) |
| 0.1 | 6.9 | GO:0016791 | phosphatase activity(GO:0016791) |
| 0.1 | 0.5 | GO:0004972 | NMDA glutamate receptor activity(GO:0004972) |
| 0.1 | 12.3 | GO:0030414 | peptidase inhibitor activity(GO:0030414) |
| 0.1 | 0.1 | GO:0004942 | anaphylatoxin receptor activity(GO:0004942) |
| 0.1 | 0.1 | GO:0008517 | folic acid transporter activity(GO:0008517) |
| 0.1 | 0.3 | GO:0004995 | tachykinin receptor activity(GO:0004995) |
| 0.1 | 0.3 | GO:0031705 | bombesin receptor binding(GO:0031705) |
| 0.1 | 0.3 | GO:0005484 | SNAP receptor activity(GO:0005484) |
| 0.1 | 0.4 | GO:0004945 | angiotensin type II receptor activity(GO:0004945) |
| 0.1 | 0.3 | GO:0001595 | angiotensin receptor activity(GO:0001595) |
| 0.1 | 0.1 | GO:0034618 | arginine binding(GO:0034618) |
| 0.1 | 1.5 | GO:0051087 | chaperone binding(GO:0051087) |
| 0.1 | 0.3 | GO:0003854 | 3-beta-hydroxy-delta5-steroid dehydrogenase activity(GO:0003854) |
| 0.1 | 0.6 | GO:0051879 | Hsp90 protein binding(GO:0051879) |
| 0.1 | 0.3 | GO:0004955 | prostaglandin receptor activity(GO:0004955) |
| 0.1 | 0.1 | GO:0031433 | telethonin binding(GO:0031433) |
| 0.1 | 0.2 | GO:0008147 | structural constituent of bone(GO:0008147) |
| 0.1 | 0.2 | GO:0001758 | retinal dehydrogenase activity(GO:0001758) |
| 0.1 | 0.3 | GO:0004090 | carbonyl reductase (NADPH) activity(GO:0004090) |
| 0.1 | 0.3 | GO:0047961 | glycine N-acyltransferase activity(GO:0047961) |
| 0.1 | 0.3 | GO:0046923 | ER retention sequence binding(GO:0046923) |
| 0.1 | 0.2 | GO:0061665 | SUMO ligase activity(GO:0061665) |
| 0.1 | 14.5 | GO:0046982 | protein heterodimerization activity(GO:0046982) |
| 0.1 | 0.4 | GO:0015036 | disulfide oxidoreductase activity(GO:0015036) |
| 0.1 | 0.1 | GO:0050253 | retinyl-palmitate esterase activity(GO:0050253) |
| 0.1 | 0.2 | GO:0005127 | ciliary neurotrophic factor receptor binding(GO:0005127) |
| 0.1 | 2.8 | GO:0035326 | enhancer binding(GO:0035326) |
| 0.1 | 0.1 | GO:0008061 | chitin binding(GO:0008061) |
| 0.1 | 0.4 | GO:0030247 | pattern binding(GO:0001871) polysaccharide binding(GO:0030247) |
| 0.1 | 0.9 | GO:0051219 | phosphoprotein binding(GO:0051219) |
| 0.1 | 0.1 | GO:0035870 | dITP diphosphatase activity(GO:0035870) XTP diphosphatase activity(GO:0036222) |
| 0.1 | 0.2 | GO:0031369 | translation initiation factor binding(GO:0031369) |
| 0.1 | 0.1 | GO:0042379 | chemokine receptor binding(GO:0042379) |
| 0.1 | 0.2 | GO:0050833 | pyruvate transmembrane transporter activity(GO:0050833) |
| 0.1 | 0.8 | GO:0015125 | bile acid transmembrane transporter activity(GO:0015125) |
| 0.1 | 0.2 | GO:0005547 | phosphatidylinositol-3,4,5-trisphosphate binding(GO:0005547) |
| 0.1 | 0.2 | GO:0004527 | exonuclease activity(GO:0004527) |
| 0.1 | 0.8 | GO:0016713 | oxidoreductase activity, acting on paired donors, with incorporation or reduction of molecular oxygen, reduced iron-sulfur protein as one donor, and incorporation of one atom of oxygen(GO:0016713) |
| 0.1 | 0.2 | GO:0016453 | acetyl-CoA C-acetyltransferase activity(GO:0003985) C-acetyltransferase activity(GO:0016453) |
| 0.1 | 0.6 | GO:0019842 | vitamin binding(GO:0019842) |
| 0.1 | 0.2 | GO:0015563 | uptake transmembrane transporter activity(GO:0015563) |
| 0.1 | 0.5 | GO:0034987 | immunoglobulin receptor binding(GO:0034987) |
| 0.1 | 0.2 | GO:0005092 | GDP-dissociation inhibitor activity(GO:0005092) |
| 0.1 | 0.1 | GO:0047045 | testosterone 17-beta-dehydrogenase (NADP+) activity(GO:0047045) |
| 0.1 | 4.2 | GO:0003714 | transcription corepressor activity(GO:0003714) |
| 0.1 | 0.2 | GO:0004967 | glucagon receptor activity(GO:0004967) |
| 0.1 | 0.2 | GO:0016520 | growth hormone-releasing hormone receptor activity(GO:0016520) |
| 0.1 | 0.1 | GO:0016832 | aldehyde-lyase activity(GO:0016832) |
| 0.1 | 1.5 | GO:0015078 | hydrogen ion transmembrane transporter activity(GO:0015078) |
| 0.1 | 0.1 | GO:0031690 | adrenergic receptor binding(GO:0031690) |
| 0.1 | 0.1 | GO:0015272 | ATP-activated inward rectifier potassium channel activity(GO:0015272) |
| 0.1 | 0.4 | GO:0016706 | oxidoreductase activity, acting on paired donors, with incorporation or reduction of molecular oxygen, 2-oxoglutarate as one donor, and incorporation of one atom each of oxygen into both donors(GO:0016706) |
| 0.1 | 0.9 | GO:0005520 | insulin-like growth factor binding(GO:0005520) |
| 0.1 | 0.1 | GO:0030249 | guanylate cyclase regulator activity(GO:0030249) |
| 0.1 | 0.1 | GO:0005275 | amine transmembrane transporter activity(GO:0005275) |
| 0.1 | 4.9 | GO:0044389 | ubiquitin-like protein ligase binding(GO:0044389) |
| 0.1 | 0.3 | GO:0004169 | dolichyl-phosphate-mannose-protein mannosyltransferase activity(GO:0004169) |
| 0.1 | 0.1 | GO:0004703 | G-protein coupled receptor kinase activity(GO:0004703) |
| 0.1 | 0.3 | GO:0004969 | histamine receptor activity(GO:0004969) |
| 0.1 | 0.1 | GO:0008310 | single-stranded DNA 3'-5' exodeoxyribonuclease activity(GO:0008310) |
| 0.1 | 0.1 | GO:0031685 | adenosine receptor binding(GO:0031685) |
| 0.1 | 0.1 | GO:0002046 | opsin binding(GO:0002046) |
| 0.1 | 0.2 | GO:0031013 | troponin I binding(GO:0031013) |
| 0.1 | 0.2 | GO:0039706 | co-receptor binding(GO:0039706) |
| 0.1 | 0.6 | GO:0004601 | peroxidase activity(GO:0004601) |
| 0.1 | 0.2 | GO:0016671 | oxidoreductase activity, acting on a sulfur group of donors, disulfide as acceptor(GO:0016671) |
| 0.1 | 5.6 | GO:0000989 | transcription factor activity, transcription factor binding(GO:0000989) |
| 0.1 | 0.1 | GO:0070410 | co-SMAD binding(GO:0070410) |
| 0.1 | 0.2 | GO:0004111 | creatine kinase activity(GO:0004111) |
| 0.1 | 0.2 | GO:0035591 | signaling adaptor activity(GO:0035591) |
| 0.1 | 0.1 | GO:0005501 | retinoid binding(GO:0005501) |
| 0.1 | 0.1 | GO:0004461 | lactose synthase activity(GO:0004461) |
| 0.1 | 0.1 | GO:0004704 | NF-kappaB-inducing kinase activity(GO:0004704) |
| 0.1 | 0.1 | GO:0097001 | ceramide binding(GO:0097001) |
| 0.1 | 0.1 | GO:0003916 | DNA topoisomerase activity(GO:0003916) DNA topoisomerase type I activity(GO:0003917) |
| 0.1 | 0.1 | GO:0004052 | arachidonate 12-lipoxygenase activity(GO:0004052) |
| 0.1 | 0.5 | GO:0000982 | transcription factor activity, RNA polymerase II core promoter proximal region sequence-specific binding(GO:0000982) |
| 0.0 | 0.1 | GO:0004060 | arylamine N-acetyltransferase activity(GO:0004060) |
| 0.0 | 0.0 | GO:0008309 | double-stranded DNA exodeoxyribonuclease activity(GO:0008309) |
| 0.0 | 0.1 | GO:0098639 | collagen binding involved in cell-matrix adhesion(GO:0098639) |
| 0.0 | 0.6 | GO:0004623 | phospholipase A2 activity(GO:0004623) |
| 0.0 | 0.2 | GO:0022820 | potassium:chloride symporter activity(GO:0015379) potassium ion symporter activity(GO:0022820) |
| 0.0 | 13.3 | GO:0005198 | structural molecule activity(GO:0005198) |
| 0.0 | 0.1 | GO:0097603 | temperature-gated ion channel activity(GO:0097603) |
| 0.0 | 0.2 | GO:0004596 | peptide alpha-N-acetyltransferase activity(GO:0004596) |
| 0.0 | 0.2 | GO:0005105 | type 1 fibroblast growth factor receptor binding(GO:0005105) |
| 0.0 | 0.7 | GO:0005452 | inorganic anion exchanger activity(GO:0005452) |
| 0.0 | 3.6 | GO:0005550 | pheromone binding(GO:0005550) |
| 0.0 | 0.0 | GO:0003988 | acetyl-CoA C-acyltransferase activity(GO:0003988) |
| 0.0 | 0.0 | GO:0050051 | leukotriene-B4 20-monooxygenase activity(GO:0050051) |
| 0.0 | 5.2 | GO:0001228 | transcriptional activator activity, RNA polymerase II transcription regulatory region sequence-specific binding(GO:0001228) |
| 0.0 | 0.2 | GO:0016709 | oxidoreductase activity, acting on paired donors, with incorporation or reduction of molecular oxygen, NAD(P)H as one donor, and incorporation of one atom of oxygen(GO:0016709) |
| 0.0 | 0.2 | GO:0003828 | alpha-N-acetylneuraminate alpha-2,8-sialyltransferase activity(GO:0003828) |
| 0.0 | 0.2 | GO:0050656 | 3'-phosphoadenosine 5'-phosphosulfate binding(GO:0050656) |
| 0.0 | 0.7 | GO:0015020 | glucuronosyltransferase activity(GO:0015020) |
| 0.0 | 0.2 | GO:0005000 | vasopressin receptor activity(GO:0005000) |
| 0.0 | 12.5 | GO:0046914 | transition metal ion binding(GO:0046914) |
| 0.0 | 0.8 | GO:0005518 | collagen binding(GO:0005518) |
| 0.0 | 1.8 | GO:0019902 | phosphatase binding(GO:0019902) |
| 0.0 | 0.0 | GO:0032407 | MutSalpha complex binding(GO:0032407) |
| 0.0 | 0.1 | GO:0009055 | electron carrier activity(GO:0009055) |
| 0.0 | 0.2 | GO:0001085 | RNA polymerase II transcription factor binding(GO:0001085) |
| 0.0 | 0.3 | GO:0004364 | glutathione transferase activity(GO:0004364) |
| 0.0 | 0.1 | GO:0051537 | 2 iron, 2 sulfur cluster binding(GO:0051537) |
| 0.0 | 0.1 | GO:0004974 | leukotriene receptor activity(GO:0004974) |
| 0.0 | 0.1 | GO:0003953 | NAD+ nucleosidase activity(GO:0003953) |
| 0.0 | 0.0 | GO:0001962 | alpha-1,3-galactosyltransferase activity(GO:0001962) |
| 0.0 | 0.0 | GO:0015252 | hydrogen ion channel activity(GO:0015252) |
| 0.0 | 0.1 | GO:0034604 | pyruvate dehydrogenase activity(GO:0004738) pyruvate dehydrogenase [NAD(P)+] activity(GO:0034603) pyruvate dehydrogenase (NAD+) activity(GO:0034604) |
| 0.0 | 0.2 | GO:0097602 | cullin family protein binding(GO:0097602) |
| 0.0 | 0.0 | GO:0005415 | nucleoside:sodium symporter activity(GO:0005415) |
| 0.0 | 0.2 | GO:0003684 | damaged DNA binding(GO:0003684) |
| 0.0 | 1.1 | GO:0008234 | cysteine-type peptidase activity(GO:0008234) |
| 0.0 | 0.2 | GO:0016884 | carbon-nitrogen ligase activity, with glutamine as amido-N-donor(GO:0016884) |
| 0.0 | 24.1 | GO:0004984 | olfactory receptor activity(GO:0004984) |
| 0.0 | 0.4 | GO:0016503 | pheromone receptor activity(GO:0016503) |
| 0.0 | 0.3 | GO:0005186 | pheromone activity(GO:0005186) |
| 0.0 | 0.1 | GO:0043021 | ribonucleoprotein complex binding(GO:0043021) |
| 0.0 | 0.0 | GO:0004582 | dolichyl-phosphate beta-D-mannosyltransferase activity(GO:0004582) |
| 0.0 | 0.0 | GO:0032813 | tumor necrosis factor receptor binding(GO:0005164) tumor necrosis factor receptor superfamily binding(GO:0032813) |
| 0.0 | 0.1 | GO:0015467 | G-protein activated inward rectifier potassium channel activity(GO:0015467) |
| 0.0 | 0.0 | GO:0047023 | androsterone dehydrogenase activity(GO:0047023) |
| 0.0 | 0.0 | GO:0016769 | transferase activity, transferring nitrogenous groups(GO:0016769) |
| 0.0 | 0.0 | GO:0050786 | RAGE receptor binding(GO:0050786) |
| 0.0 | 0.1 | GO:0005243 | gap junction channel activity(GO:0005243) |
| 0.0 | 0.0 | GO:0070403 | NAD+ binding(GO:0070403) |
| 0.0 | 0.0 | GO:0005219 | ryanodine-sensitive calcium-release channel activity(GO:0005219) |
| 0.0 | 0.0 | GO:0034713 | type I transforming growth factor beta receptor binding(GO:0034713) |
| 0.0 | 0.0 | GO:0004165 | dodecenoyl-CoA delta-isomerase activity(GO:0004165) |
| 0.0 | 0.0 | GO:0004937 | alpha1-adrenergic receptor activity(GO:0004937) |
Gene overrepresentation in curated gene sets: canonical pathways category:
| Log-likelihood per target | Total log-likelihood | Term | Description |
|---|---|---|---|
| 2.1 | 31.7 | PID CIRCADIAN PATHWAY | Circadian rhythm pathway |
| 2.1 | 26.7 | SA MMP CYTOKINE CONNECTION | Cytokines can induce activation of matrix metalloproteinases, which degrade extracellular matrix. |
| 1.8 | 10.9 | SIG INSULIN RECEPTOR PATHWAY IN CARDIAC MYOCYTES | Genes related to the insulin receptor pathway |
| 1.7 | 6.7 | PID PI3KCI PATHWAY | Class I PI3K signaling events |
| 1.5 | 96.9 | PID TELOMERASE PATHWAY | Regulation of Telomerase |
| 1.4 | 9.6 | ST PHOSPHOINOSITIDE 3 KINASE PATHWAY | PI3K Pathway |
| 1.4 | 4.1 | PID IGF1 PATHWAY | IGF1 pathway |
| 1.3 | 43.2 | PID IFNG PATHWAY | IFN-gamma pathway |
| 1.2 | 18.6 | ST WNT CA2 CYCLIC GMP PATHWAY | Wnt/Ca2+/cyclic GMP signaling. |
| 1.2 | 31.2 | PID TCPTP PATHWAY | Signaling events mediated by TCPTP |
| 1.1 | 4.5 | ST TYPE I INTERFERON PATHWAY | Type I Interferon (alpha/beta IFN) Pathway |
| 1.1 | 8.9 | PID IL8 CXCR2 PATHWAY | IL8- and CXCR2-mediated signaling events |
| 1.1 | 22.0 | PID INTEGRIN A9B1 PATHWAY | Alpha9 beta1 integrin signaling events |
| 1.1 | 22.8 | PID IL2 PI3K PATHWAY | IL2 signaling events mediated by PI3K |
| 1.0 | 35.3 | PID A6B1 A6B4 INTEGRIN PATHWAY | a6b1 and a6b4 Integrin signaling |
| 1.0 | 21.6 | PID P38 MKK3 6PATHWAY | p38 MAPK signaling pathway |
| 1.0 | 26.7 | PID HIF2PATHWAY | HIF-2-alpha transcription factor network |
| 1.0 | 7.0 | PID P38 GAMMA DELTA PATHWAY | Signaling mediated by p38-gamma and p38-delta |
| 1.0 | 9.0 | SA G1 AND S PHASES | Cdk2, 4, and 6 bind cyclin D in G1, while cdk2/cyclin E promotes the G1/S transition. |
| 1.0 | 37.7 | PID ILK PATHWAY | Integrin-linked kinase signaling |
| 1.0 | 21.7 | PID IL6 7 PATHWAY | IL6-mediated signaling events |
| 1.0 | 7.9 | PID IL2 STAT5 PATHWAY | IL2 signaling events mediated by STAT5 |
| 1.0 | 15.4 | PID GMCSF PATHWAY | GMCSF-mediated signaling events |
| 1.0 | 14.3 | PID IL1 PATHWAY | IL1-mediated signaling events |
| 0.9 | 17.4 | PID CERAMIDE PATHWAY | Ceramide signaling pathway |
| 0.9 | 2.7 | PID IL5 PATHWAY | IL5-mediated signaling events |
| 0.9 | 7.2 | PID TRAIL PATHWAY | TRAIL signaling pathway |
| 0.9 | 7.2 | PID LYMPH ANGIOGENESIS PATHWAY | VEGFR3 signaling in lymphatic endothelium |
| 0.9 | 0.9 | PID GLYPICAN 1PATHWAY | Glypican 1 network |
| 0.9 | 35.7 | SIG PIP3 SIGNALING IN CARDIAC MYOCTES | Genes related to PIP3 signaling in cardiac myocytes |
| 0.9 | 0.9 | ST JAK STAT PATHWAY | Jak-STAT Pathway |
| 0.9 | 1.8 | PID S1P S1P2 PATHWAY | S1P2 pathway |
| 0.9 | 3.5 | ST JNK MAPK PATHWAY | JNK MAPK Pathway |
| 0.9 | 6.0 | ST INTEGRIN SIGNALING PATHWAY | Integrin Signaling Pathway |
| 0.8 | 1.7 | ST INTERLEUKIN 4 PATHWAY | Interleukin 4 (IL-4) Pathway |
| 0.8 | 31.0 | PID HNF3B PATHWAY | FOXA2 and FOXA3 transcription factor networks |
| 0.8 | 31.8 | PID P53 REGULATION PATHWAY | p53 pathway |
| 0.8 | 26.1 | PID FANCONI PATHWAY | Fanconi anemia pathway |
| 0.8 | 11.4 | PID NFKAPPAB CANONICAL PATHWAY | Canonical NF-kappaB pathway |
| 0.8 | 2.4 | SA FAS SIGNALING | The TNF-type receptor Fas induces apoptosis on ligand binding. |
| 0.8 | 15.8 | PID IL8 CXCR1 PATHWAY | IL8- and CXCR1-mediated signaling events |
| 0.8 | 16.6 | PID MET PATHWAY | Signaling events mediated by Hepatocyte Growth Factor Receptor (c-Met) |
| 0.8 | 1.5 | SA B CELL RECEPTOR COMPLEXES | Antigen binding to B cell receptors activates protein tyrosine kinases, such as the Src family, which ultimate activate MAP kinases. |
| 0.7 | 26.7 | PID MYC REPRESS PATHWAY | Validated targets of C-MYC transcriptional repression |
| 0.7 | 12.6 | PID THROMBIN PAR1 PATHWAY | PAR1-mediated thrombin signaling events |
| 0.7 | 8.9 | ST P38 MAPK PATHWAY | p38 MAPK Pathway |
| 0.7 | 2.1 | PID HDAC CLASSIII PATHWAY | Signaling events mediated by HDAC Class III |
| 0.7 | 15.1 | PID RHOA PATHWAY | RhoA signaling pathway |
| 0.7 | 23.0 | PID PLK1 PATHWAY | PLK1 signaling events |
| 0.7 | 24.5 | PID AR PATHWAY | Coregulation of Androgen receptor activity |
| 0.6 | 3.2 | PID NFKAPPAB ATYPICAL PATHWAY | Atypical NF-kappaB pathway |
| 0.6 | 7.7 | PID VEGFR1 2 PATHWAY | Signaling events mediated by VEGFR1 and VEGFR2 |
| 0.6 | 1.3 | PID S1P S1P3 PATHWAY | S1P3 pathway |
| 0.6 | 6.2 | PID CXCR3 PATHWAY | CXCR3-mediated signaling events |
| 0.6 | 1.2 | SA PTEN PATHWAY | PTEN is a tumor suppressor that dephosphorylates the lipid messenger phosphatidylinositol triphosphate. |
| 0.6 | 4.9 | ST ERK1 ERK2 MAPK PATHWAY | ERK1/ERK2 MAPK Pathway |
| 0.6 | 7.2 | PID SYNDECAN 4 PATHWAY | Syndecan-4-mediated signaling events |
| 0.6 | 14.2 | PID CDC42 REG PATHWAY | Regulation of CDC42 activity |
| 0.6 | 18.2 | PID HIF1 TFPATHWAY | HIF-1-alpha transcription factor network |
| 0.6 | 10.5 | PID NFAT 3PATHWAY | Role of Calcineurin-dependent NFAT signaling in lymphocytes |
| 0.6 | 26.5 | PID CMYB PATHWAY | C-MYB transcription factor network |
| 0.6 | 6.7 | PID MYC PATHWAY | C-MYC pathway |
| 0.5 | 9.3 | PID FRA PATHWAY | Validated transcriptional targets of AP1 family members Fra1 and Fra2 |
| 0.5 | 12.6 | PID CD8 TCR DOWNSTREAM PATHWAY | Downstream signaling in naïve CD8+ T cells |
| 0.5 | 2.7 | PID ERBB NETWORK PATHWAY | ErbB receptor signaling network |
| 0.5 | 4.2 | SA CASPASE CASCADE | Apoptosis is mediated by caspases, cysteine proteases arranged in a proteolytic cascade. |
| 0.5 | 10.6 | PID INTEGRIN2 PATHWAY | Beta2 integrin cell surface interactions |
| 0.5 | 5.8 | PID ATF2 PATHWAY | ATF-2 transcription factor network |
| 0.5 | 8.3 | PID ARF6 PATHWAY | Arf6 signaling events |
| 0.5 | 8.2 | PID KIT PATHWAY | Signaling events mediated by Stem cell factor receptor (c-Kit) |
| 0.5 | 5.6 | PID FOXM1 PATHWAY | FOXM1 transcription factor network |
| 0.5 | 8.6 | PID FCER1 PATHWAY | Fc-epsilon receptor I signaling in mast cells |
| 0.5 | 21.2 | PID ERA GENOMIC PATHWAY | Validated nuclear estrogen receptor alpha network |
| 0.5 | 1.0 | PID ERB GENOMIC PATHWAY | Validated nuclear estrogen receptor beta network |
| 0.5 | 8.4 | PID TOLL ENDOGENOUS PATHWAY | Endogenous TLR signaling |
| 0.5 | 2.3 | PID BARD1 PATHWAY | BARD1 signaling events |
| 0.4 | 26.0 | PID P53 DOWNSTREAM PATHWAY | Direct p53 effectors |
| 0.4 | 0.4 | PID EPHA2 FWD PATHWAY | EPHA2 forward signaling |
| 0.4 | 2.7 | PID AMB2 NEUTROPHILS PATHWAY | amb2 Integrin signaling |
| 0.4 | 6.2 | PID REELIN PATHWAY | Reelin signaling pathway |
| 0.4 | 14.6 | PID E2F PATHWAY | E2F transcription factor network |
| 0.4 | 1.7 | PID HDAC CLASSII PATHWAY | Signaling events mediated by HDAC Class II |
| 0.4 | 7.3 | PID FAK PATHWAY | Signaling events mediated by focal adhesion kinase |
| 0.4 | 4.4 | PID WNT CANONICAL PATHWAY | Canonical Wnt signaling pathway |
| 0.4 | 8.8 | PID RAC1 PATHWAY | RAC1 signaling pathway |
| 0.4 | 12.6 | PID MYC ACTIV PATHWAY | Validated targets of C-MYC transcriptional activation |
| 0.4 | 3.4 | PID INTEGRIN A4B1 PATHWAY | Alpha4 beta1 integrin signaling events |
| 0.4 | 5.9 | PID AP1 PATHWAY | AP-1 transcription factor network |
| 0.4 | 4.1 | PID REG GR PATHWAY | Glucocorticoid receptor regulatory network |
| 0.4 | 10.5 | PID RHOA REG PATHWAY | Regulation of RhoA activity |
| 0.4 | 0.4 | PID SMAD2 3PATHWAY | Regulation of cytoplasmic and nuclear SMAD2/3 signaling |
| 0.4 | 2.1 | PID PTP1B PATHWAY | Signaling events mediated by PTP1B |
| 0.3 | 1.4 | PID P38 MK2 PATHWAY | p38 signaling mediated by MAPKAP kinases |
| 0.3 | 6.0 | PID NFAT TFPATHWAY | Calcineurin-regulated NFAT-dependent transcription in lymphocytes |
| 0.3 | 3.7 | PID TGFBR PATHWAY | TGF-beta receptor signaling |
| 0.3 | 0.3 | SA G2 AND M PHASES | Cdc25 activates the cdc2/cyclin B complex to induce the G2/M transition. |
| 0.3 | 5.6 | PID ERBB1 DOWNSTREAM PATHWAY | ErbB1 downstream signaling |
| 0.3 | 5.2 | PID ALK1 PATHWAY | ALK1 signaling events |
| 0.3 | 1.9 | ST G ALPHA S PATHWAY | G alpha s Pathway |
| 0.3 | 0.9 | SIG PIP3 SIGNALING IN B LYMPHOCYTES | Genes related to PIP3 signaling in B lymphocytes |
| 0.3 | 1.2 | PID VEGF VEGFR PATHWAY | VEGF and VEGFR signaling network |
| 0.3 | 2.4 | PID PRL SIGNALING EVENTS PATHWAY | Signaling events mediated by PRL |
| 0.3 | 3.0 | PID ARF 3PATHWAY | Arf1 pathway |
| 0.3 | 8.5 | PID HDAC CLASSI PATHWAY | Signaling events mediated by HDAC Class I |
| 0.3 | 3.7 | PID INTEGRIN3 PATHWAY | Beta3 integrin cell surface interactions |
| 0.3 | 0.6 | PID VEGFR1 PATHWAY | VEGFR1 specific signals |
| 0.3 | 8.8 | NABA PROTEOGLYCANS | Genes encoding proteoglycans |
| 0.3 | 3.8 | PID RAS PATHWAY | Regulation of Ras family activation |
| 0.3 | 1.8 | PID WNT NONCANONICAL PATHWAY | Noncanonical Wnt signaling pathway |
| 0.3 | 0.3 | PID PI3KCI AKT PATHWAY | Class I PI3K signaling events mediated by Akt |
| 0.3 | 2.0 | PID AURORA A PATHWAY | Aurora A signaling |
| 0.3 | 0.5 | ST IL 13 PATHWAY | Interleukin 13 (IL-13) Pathway |
| 0.2 | 46.0 | NABA ECM REGULATORS | Genes encoding enzymes and their regulators involved in the remodeling of the extracellular matrix |
| 0.2 | 3.5 | PID IL12 2PATHWAY | IL12-mediated signaling events |
| 0.2 | 1.9 | PID ECADHERIN NASCENT AJ PATHWAY | E-cadherin signaling in the nascent adherens junction |
| 0.2 | 2.9 | PID RXR VDR PATHWAY | RXR and RAR heterodimerization with other nuclear receptor |
| 0.2 | 4.5 | PID CONE PATHWAY | Visual signal transduction: Cones |
| 0.2 | 3.1 | PID ECADHERIN STABILIZATION PATHWAY | Stabilization and expansion of the E-cadherin adherens junction |
| 0.2 | 1.6 | PID SYNDECAN 3 PATHWAY | Syndecan-3-mediated signaling events |
| 0.2 | 2.8 | PID IL4 2PATHWAY | IL4-mediated signaling events |
| 0.2 | 0.4 | PID AR NONGENOMIC PATHWAY | Nongenotropic Androgen signaling |
| 0.2 | 0.4 | PID S1P S1P4 PATHWAY | S1P4 pathway |
| 0.2 | 4.7 | PID BMP PATHWAY | BMP receptor signaling |
| 0.2 | 3.5 | PID SMAD2 3NUCLEAR PATHWAY | Regulation of nuclear SMAD2/3 signaling |
| 0.2 | 3.3 | PID LYSOPHOSPHOLIPID PATHWAY | LPA receptor mediated events |
| 0.2 | 0.8 | PID CD8 TCR PATHWAY | TCR signaling in naïve CD8+ T cells |
| 0.2 | 1.3 | SIG BCR SIGNALING PATHWAY | Members of the BCR signaling pathway |
| 0.2 | 0.4 | PID ALK2 PATHWAY | ALK2 signaling events |
| 0.2 | 3.0 | SIG REGULATION OF THE ACTIN CYTOSKELETON BY RHO GTPASES | Genes related to regulation of the actin cytoskeleton |
| 0.2 | 0.8 | PID MAPK TRK PATHWAY | Trk receptor signaling mediated by the MAPK pathway |
| 0.2 | 0.3 | PID IL27 PATHWAY | IL27-mediated signaling events |
| 0.1 | 0.9 | PID PI3K PLC TRK PATHWAY | Trk receptor signaling mediated by PI3K and PLC-gamma |
| 0.1 | 0.3 | PID INTEGRIN CS PATHWAY | Integrin family cell surface interactions |
| 0.1 | 0.9 | PID SYNDECAN 2 PATHWAY | Syndecan-2-mediated signaling events |
| 0.1 | 2.2 | ST WNT BETA CATENIN PATHWAY | Wnt/beta-catenin Pathway |
| 0.1 | 1.7 | PID P75 NTR PATHWAY | p75(NTR)-mediated signaling |
| 0.1 | 0.8 | PID EPHRINB REV PATHWAY | Ephrin B reverse signaling |
| 0.1 | 0.1 | PID ARF6 DOWNSTREAM PATHWAY | Arf6 downstream pathway |
| 0.1 | 0.5 | ST B CELL ANTIGEN RECEPTOR | B Cell Antigen Receptor |
| 0.1 | 1.1 | PID ERBB2 ERBB3 PATHWAY | ErbB2/ErbB3 signaling events |
| 0.1 | 1.0 | ST MYOCYTE AD PATHWAY | Myocyte Adrenergic Pathway is a specific case of the generalized Adrenergic Pathway. |
| 0.1 | 0.2 | ST GRANULE CELL SURVIVAL PATHWAY | Granule Cell Survival Pathway is a specific case of more general PAC1 Receptor Pathway. |
| 0.1 | 1.8 | PID ARF6 TRAFFICKING PATHWAY | Arf6 trafficking events |
| 0.1 | 2.1 | PID INTEGRIN1 PATHWAY | Beta1 integrin cell surface interactions |
| 0.1 | 0.8 | PID IL23 PATHWAY | IL23-mediated signaling events |
| 0.1 | 0.4 | ST DIFFERENTIATION PATHWAY IN PC12 CELLS | Differentiation Pathway in PC12 Cells; this is a specific case of PAC1 Receptor Pathway. |
| 0.1 | 0.1 | PID FAS PATHWAY | FAS (CD95) signaling pathway |
| 0.1 | 0.5 | PID RHODOPSIN PATHWAY | Visual signal transduction: Rods |
| 0.1 | 0.4 | PID IL12 STAT4 PATHWAY | IL12 signaling mediated by STAT4 |
| 0.1 | 0.1 | PID AVB3 OPN PATHWAY | Osteopontin-mediated events |
| 0.1 | 0.2 | PID SYNDECAN 1 PATHWAY | Syndecan-1-mediated signaling events |
| 0.1 | 0.4 | PID CD40 PATHWAY | CD40/CD40L signaling |
| 0.1 | 1.1 | PID HEDGEHOG GLI PATHWAY | Hedgehog signaling events mediated by Gli proteins |
| 0.1 | 0.2 | PID ERBB4 PATHWAY | ErbB4 signaling events |
| 0.1 | 1.5 | PID DELTA NP63 PATHWAY | Validated transcriptional targets of deltaNp63 isoforms |
| 0.1 | 0.1 | ST INTERFERON GAMMA PATHWAY | Interferon gamma pathway. |
| 0.1 | 0.5 | PID UPA UPAR PATHWAY | Urokinase-type plasminogen activator (uPA) and uPAR-mediated signaling |
| 0.1 | 0.6 | PID PDGFRB PATHWAY | PDGFR-beta signaling pathway |
| 0.1 | 0.1 | SA TRKA RECEPTOR | The TrkA receptor binds nerve growth factor to activate MAP kinase pathways and promote cell growth. |
| 0.1 | 1.1 | PID CASPASE PATHWAY | Caspase cascade in apoptosis |
| 0.1 | 1.8 | WNT SIGNALING | Genes related to Wnt-mediated signal transduction |
| 0.0 | 0.7 | PID P73PATHWAY | p73 transcription factor network |
| 0.0 | 0.6 | PID FGF PATHWAY | FGF signaling pathway |
| 0.0 | 0.5 | NABA COLLAGENS | Genes encoding collagen proteins |
| 0.0 | 0.0 | ST TUMOR NECROSIS FACTOR PATHWAY | Tumor Necrosis Factor Pathway. |
| 0.0 | 0.1 | ST GA12 PATHWAY | G alpha 12 Pathway |
| 0.0 | 0.3 | PID AR TF PATHWAY | Regulation of Androgen receptor activity |
| 0.0 | 0.2 | PID AVB3 INTEGRIN PATHWAY | Integrins in angiogenesis |
Gene overrepresentation in curated gene sets: REACTOME pathways category:
| Log-likelihood per target | Total log-likelihood | Term | Description |
|---|---|---|---|
| 4.8 | 239.2 | REACTOME INTERFERON ALPHA BETA SIGNALING | Genes involved in Interferon alpha/beta signaling |
| 3.4 | 87.5 | REACTOME NEGATIVE REGULATORS OF RIG I MDA5 SIGNALING | Genes involved in Negative regulators of RIG-I/MDA5 signaling |
| 2.7 | 8.2 | REACTOME ENDOSOMAL VACUOLAR PATHWAY | Genes involved in Endosomal/Vacuolar pathway |
| 2.2 | 22.5 | REACTOME REGULATION OF COMPLEMENT CASCADE | Genes involved in Regulation of Complement cascade |
| 2.2 | 33.0 | REACTOME DOWNREGULATION OF SMAD2 3 SMAD4 TRANSCRIPTIONAL ACTIVITY | Genes involved in Downregulation of SMAD2/3:SMAD4 transcriptional activity |
| 2.2 | 23.8 | REACTOME MTORC1 MEDIATED SIGNALLING | Genes involved in mTORC1-mediated signalling |
| 2.0 | 2.0 | REACTOME SYNTHESIS OF BILE ACIDS AND BILE SALTS | Genes involved in Synthesis of bile acids and bile salts |
| 1.9 | 18.9 | REACTOME TRAFFICKING AND PROCESSING OF ENDOSOMAL TLR | Genes involved in Trafficking and processing of endosomal TLR |
| 1.8 | 7.2 | REACTOME RIG I MDA5 MEDIATED INDUCTION OF IFN ALPHA BETA PATHWAYS | Genes involved in RIG-I/MDA5 mediated induction of IFN-alpha/beta pathways |
| 1.8 | 8.9 | REACTOME TRAF6 MEDIATED IRF7 ACTIVATION IN TLR7 8 OR 9 SIGNALING | Genes involved in TRAF6 mediated IRF7 activation in TLR7/8 or 9 signaling |
| 1.8 | 8.9 | REACTOME IL 6 SIGNALING | Genes involved in Interleukin-6 signaling |
| 1.7 | 11.8 | REACTOME NEF MEDIATED DOWNREGULATION OF MHC CLASS I COMPLEX CELL SURFACE EXPRESSION | Genes involved in Nef mediated downregulation of MHC class I complex cell surface expression |
| 1.5 | 13.1 | REACTOME REGULATION OF RHEB GTPASE ACTIVITY BY AMPK | Genes involved in Regulation of Rheb GTPase activity by AMPK |
| 1.3 | 35.9 | REACTOME SPHINGOLIPID DE NOVO BIOSYNTHESIS | Genes involved in Sphingolipid de novo biosynthesis |
| 1.3 | 11.9 | REACTOME GAP JUNCTION DEGRADATION | Genes involved in Gap junction degradation |
| 1.3 | 14.3 | REACTOME ACTIVATED AMPK STIMULATES FATTY ACID OXIDATION IN MUSCLE | Genes involved in Activated AMPK stimulates fatty-acid oxidation in muscle |
| 1.3 | 17.9 | REACTOME DEADENYLATION OF MRNA | Genes involved in Deadenylation of mRNA |
| 1.3 | 2.5 | REACTOME PEPTIDE CHAIN ELONGATION | Genes involved in Peptide chain elongation |
| 1.3 | 12.6 | REACTOME THE NLRP3 INFLAMMASOME | Genes involved in The NLRP3 inflammasome |
| 1.2 | 21.2 | REACTOME SYNTHESIS AND INTERCONVERSION OF NUCLEOTIDE DI AND TRIPHOSPHATES | Genes involved in Synthesis and interconversion of nucleotide di- and triphosphates |
| 1.2 | 1.2 | REACTOME ACTIVATION OF CHAPERONE GENES BY ATF6 ALPHA | Genes involved in Activation of Chaperone Genes by ATF6-alpha |
| 1.2 | 2.4 | REACTOME ACTIVATED TAK1 MEDIATES P38 MAPK ACTIVATION | Genes involved in activated TAK1 mediates p38 MAPK activation |
| 1.1 | 14.9 | REACTOME POL SWITCHING | Genes involved in Polymerase switching |
| 1.1 | 17.1 | REACTOME REGULATION OF HYPOXIA INDUCIBLE FACTOR HIF BY OXYGEN | Genes involved in Regulation of Hypoxia-inducible Factor (HIF) by Oxygen |
| 1.1 | 5.5 | REACTOME RNA POL I PROMOTER OPENING | Genes involved in RNA Polymerase I Promoter Opening |
| 1.1 | 6.6 | REACTOME ERKS ARE INACTIVATED | Genes involved in ERKs are inactivated |
| 1.1 | 12.1 | REACTOME EXTRINSIC PATHWAY FOR APOPTOSIS | Genes involved in Extrinsic Pathway for Apoptosis |
| 1.0 | 14.4 | REACTOME METABOLISM OF PORPHYRINS | Genes involved in Metabolism of porphyrins |
| 1.0 | 2.1 | REACTOME REMOVAL OF THE FLAP INTERMEDIATE FROM THE C STRAND | Genes involved in Removal of the Flap Intermediate from the C-strand |
| 1.0 | 17.4 | REACTOME INTRINSIC PATHWAY | Genes involved in Intrinsic Pathway |
| 1.0 | 27.3 | REACTOME INTRINSIC PATHWAY FOR APOPTOSIS | Genes involved in Intrinsic Pathway for Apoptosis |
| 1.0 | 19.0 | REACTOME G0 AND EARLY G1 | Genes involved in G0 and Early G1 |
| 1.0 | 1.0 | REACTOME RORA ACTIVATES CIRCADIAN EXPRESSION | Genes involved in RORA Activates Circadian Expression |
| 1.0 | 7.9 | REACTOME TAK1 ACTIVATES NFKB BY PHOSPHORYLATION AND ACTIVATION OF IKKS COMPLEX | Genes involved in TAK1 activates NFkB by phosphorylation and activation of IKKs complex |
| 1.0 | 1.0 | REACTOME AUTODEGRADATION OF THE E3 UBIQUITIN LIGASE COP1 | Genes involved in Autodegradation of the E3 ubiquitin ligase COP1 |
| 1.0 | 1.0 | REACTOME P53 INDEPENDENT G1 S DNA DAMAGE CHECKPOINT | Genes involved in p53-Independent G1/S DNA damage checkpoint |
| 1.0 | 12.6 | REACTOME CELL EXTRACELLULAR MATRIX INTERACTIONS | Genes involved in Cell-extracellular matrix interactions |
| 1.0 | 8.7 | REACTOME ASSOCIATION OF LICENSING FACTORS WITH THE PRE REPLICATIVE COMPLEX | Genes involved in Association of licensing factors with the pre-replicative complex |
| 1.0 | 9.6 | REACTOME SYNTHESIS OF PE | Genes involved in Synthesis of PE |
| 0.9 | 3.8 | REACTOME DESTABILIZATION OF MRNA BY AUF1 HNRNP D0 | Genes involved in Destabilization of mRNA by AUF1 (hnRNP D0) |
| 0.9 | 21.5 | REACTOME SMOOTH MUSCLE CONTRACTION | Genes involved in Smooth Muscle Contraction |
| 0.9 | 5.6 | REACTOME REGULATION OF SIGNALING BY CBL | Genes involved in Regulation of signaling by CBL |
| 0.9 | 41.3 | REACTOME COSTIMULATION BY THE CD28 FAMILY | Genes involved in Costimulation by the CD28 family |
| 0.9 | 4.4 | REACTOME PLATELET SENSITIZATION BY LDL | Genes involved in Platelet sensitization by LDL |
| 0.9 | 9.8 | REACTOME THROMBIN SIGNALLING THROUGH PROTEINASE ACTIVATED RECEPTORS PARS | Genes involved in Thrombin signalling through proteinase activated receptors (PARs) |
| 0.9 | 20.3 | REACTOME TRANSFERRIN ENDOCYTOSIS AND RECYCLING | Genes involved in Transferrin endocytosis and recycling |
| 0.9 | 12.4 | REACTOME RIP MEDIATED NFKB ACTIVATION VIA DAI | Genes involved in RIP-mediated NFkB activation via DAI |
| 0.9 | 26.4 | REACTOME SYNTHESIS OF PIPS AT THE PLASMA MEMBRANE | Genes involved in Synthesis of PIPs at the plasma membrane |
| 0.9 | 9.6 | REACTOME MRNA DECAY BY 3 TO 5 EXORIBONUCLEASE | Genes involved in mRNA Decay by 3' to 5' Exoribonuclease |
| 0.9 | 42.4 | REACTOME ER PHAGOSOME PATHWAY | Genes involved in ER-Phagosome pathway |
| 0.9 | 7.7 | REACTOME APOPTOTIC CLEAVAGE OF CELL ADHESION PROTEINS | Genes involved in Apoptotic cleavage of cell adhesion proteins |
| 0.8 | 3.4 | REACTOME PTM GAMMA CARBOXYLATION HYPUSINE FORMATION AND ARYLSULFATASE ACTIVATION | Genes involved in PTM: gamma carboxylation, hypusine formation and arylsulfatase activation |
| 0.8 | 26.9 | REACTOME PURINE METABOLISM | Genes involved in Purine metabolism |
| 0.8 | 12.5 | REACTOME AMINO ACID SYNTHESIS AND INTERCONVERSION TRANSAMINATION | Genes involved in Amino acid synthesis and interconversion (transamination) |
| 0.8 | 14.0 | REACTOME PRE NOTCH TRANSCRIPTION AND TRANSLATION | Genes involved in Pre-NOTCH Transcription and Translation |
| 0.8 | 8.2 | REACTOME PASSIVE TRANSPORT BY AQUAPORINS | Genes involved in Passive Transport by Aquaporins |
| 0.8 | 10.6 | REACTOME SIGNALING BY FGFR1 FUSION MUTANTS | Genes involved in Signaling by FGFR1 fusion mutants |
| 0.8 | 24.4 | REACTOME AMINO ACID TRANSPORT ACROSS THE PLASMA MEMBRANE | Genes involved in Amino acid transport across the plasma membrane |
| 0.8 | 9.8 | REACTOME AUTODEGRADATION OF CDH1 BY CDH1 APC C | Genes involved in Autodegradation of Cdh1 by Cdh1:APC/C |
| 0.8 | 1.6 | REACTOME MITOTIC M M G1 PHASES | Genes involved in Mitotic M-M/G1 phases |
| 0.8 | 4.0 | REACTOME CTNNB1 PHOSPHORYLATION CASCADE | Genes involved in Beta-catenin phosphorylation cascade |
| 0.8 | 10.3 | REACTOME SMAD2 SMAD3 SMAD4 HETEROTRIMER REGULATES TRANSCRIPTION | Genes involved in SMAD2/SMAD3:SMAD4 heterotrimer regulates transcription |
| 0.8 | 29.1 | REACTOME PPARA ACTIVATES GENE EXPRESSION | Genes involved in PPARA Activates Gene Expression |
| 0.8 | 12.5 | REACTOME CHYLOMICRON MEDIATED LIPID TRANSPORT | Genes involved in Chylomicron-mediated lipid transport |
| 0.8 | 10.1 | REACTOME HOMOLOGOUS RECOMBINATION REPAIR OF REPLICATION INDEPENDENT DOUBLE STRAND BREAKS | Genes involved in Homologous recombination repair of replication-independent double-strand breaks |
| 0.7 | 6.7 | REACTOME PYRIMIDINE CATABOLISM | Genes involved in Pyrimidine catabolism |
| 0.7 | 3.7 | REACTOME APC C CDH1 MEDIATED DEGRADATION OF CDC20 AND OTHER APC C CDH1 TARGETED PROTEINS IN LATE MITOSIS EARLY G1 | Genes involved in APC/C:Cdh1 mediated degradation of Cdc20 and other APC/C:Cdh1 targeted proteins in late mitosis/early G1 |
| 0.7 | 16.1 | REACTOME GLUTATHIONE CONJUGATION | Genes involved in Glutathione conjugation |
| 0.7 | 29.2 | REACTOME ANTIVIRAL MECHANISM BY IFN STIMULATED GENES | Genes involved in Antiviral mechanism by IFN-stimulated genes |
| 0.7 | 2.9 | REACTOME INHIBITION OF THE PROTEOLYTIC ACTIVITY OF APC C REQUIRED FOR THE ONSET OF ANAPHASE BY MITOTIC SPINDLE CHECKPOINT COMPONENTS | Genes involved in Inhibition of the proteolytic activity of APC/C required for the onset of anaphase by mitotic spindle checkpoint components |
| 0.7 | 9.8 | REACTOME FANCONI ANEMIA PATHWAY | Genes involved in Fanconi Anemia pathway |
| 0.7 | 32.8 | REACTOME TRANSCRIPTIONAL REGULATION OF WHITE ADIPOCYTE DIFFERENTIATION | Genes involved in Transcriptional Regulation of White Adipocyte Differentiation |
| 0.7 | 11.0 | REACTOME TERMINATION OF O GLYCAN BIOSYNTHESIS | Genes involved in Termination of O-glycan biosynthesis |
| 0.7 | 11.0 | REACTOME REGULATION OF MRNA STABILITY BY PROTEINS THAT BIND AU RICH ELEMENTS | Genes involved in Regulation of mRNA Stability by Proteins that Bind AU-rich Elements |
| 0.7 | 7.5 | REACTOME P2Y RECEPTORS | Genes involved in P2Y receptors |
| 0.7 | 38.3 | REACTOME MITOTIC PROMETAPHASE | Genes involved in Mitotic Prometaphase |
| 0.7 | 20.0 | REACTOME TRANSPORT TO THE GOLGI AND SUBSEQUENT MODIFICATION | Genes involved in Transport to the Golgi and subsequent modification |
| 0.7 | 8.6 | REACTOME REGULATION OF INSULIN LIKE GROWTH FACTOR IGF ACTIVITY BY INSULIN LIKE GROWTH FACTOR BINDING PROTEINS IGFBPS | Genes involved in Regulation of Insulin-like Growth Factor (IGF) Activity by Insulin-like Growth Factor Binding Proteins (IGFBPs) |
| 0.6 | 13.8 | REACTOME CYTOSOLIC TRNA AMINOACYLATION | Genes involved in Cytosolic tRNA aminoacylation |
| 0.6 | 23.6 | REACTOME REGULATION OF WATER BALANCE BY RENAL AQUAPORINS | Genes involved in Regulation of Water Balance by Renal Aquaporins |
| 0.6 | 8.5 | REACTOME MEIOTIC RECOMBINATION | Genes involved in Meiotic Recombination |
| 0.6 | 4.8 | REACTOME REGULATED PROTEOLYSIS OF P75NTR | Genes involved in Regulated proteolysis of p75NTR |
| 0.6 | 4.8 | REACTOME EXTENSION OF TELOMERES | Genes involved in Extension of Telomeres |
| 0.6 | 11.8 | REACTOME METABOLISM OF NON CODING RNA | Genes involved in Metabolism of non-coding RNA |
| 0.6 | 2.3 | REACTOME NUCLEOTIDE LIKE PURINERGIC RECEPTORS | Genes involved in Nucleotide-like (purinergic) receptors |
| 0.6 | 18.9 | REACTOME MRNA 3 END PROCESSING | Genes involved in mRNA 3'-end processing |
| 0.6 | 7.4 | REACTOME REGULATION OF INSULIN SECRETION BY GLUCAGON LIKE PEPTIDE1 | Genes involved in Regulation of Insulin Secretion by Glucagon-like Peptide-1 |
| 0.6 | 4.5 | REACTOME VEGF LIGAND RECEPTOR INTERACTIONS | Genes involved in VEGF ligand-receptor interactions |
| 0.6 | 6.2 | REACTOME SYNTHESIS SECRETION AND DEACYLATION OF GHRELIN | Genes involved in Synthesis, Secretion, and Deacylation of Ghrelin |
| 0.6 | 4.4 | REACTOME NOD1 2 SIGNALING PATHWAY | Genes involved in NOD1/2 Signaling Pathway |
| 0.5 | 14.8 | REACTOME BMAL1 CLOCK NPAS2 ACTIVATES CIRCADIAN EXPRESSION | Genes involved in BMAL1:CLOCK/NPAS2 Activates Circadian Expression |
| 0.5 | 4.4 | REACTOME MRNA CAPPING | Genes involved in mRNA Capping |
| 0.5 | 9.6 | REACTOME IL1 SIGNALING | Genes involved in Interleukin-1 signaling |
| 0.5 | 36.1 | REACTOME FACTORS INVOLVED IN MEGAKARYOCYTE DEVELOPMENT AND PLATELET PRODUCTION | Genes involved in Factors involved in megakaryocyte development and platelet production |
| 0.5 | 5.8 | REACTOME PYRIMIDINE METABOLISM | Genes involved in Pyrimidine metabolism |
| 0.5 | 3.1 | REACTOME ACTIVATION OF GENES BY ATF4 | Genes involved in Activation of Genes by ATF4 |
| 0.5 | 7.3 | REACTOME BASIGIN INTERACTIONS | Genes involved in Basigin interactions |
| 0.5 | 9.4 | REACTOME PEROXISOMAL LIPID METABOLISM | Genes involved in Peroxisomal lipid metabolism |
| 0.5 | 31.6 | REACTOME MRNA SPLICING | Genes involved in mRNA Splicing |
| 0.5 | 2.6 | REACTOME HORMONE SENSITIVE LIPASE HSL MEDIATED TRIACYLGLYCEROL HYDROLYSIS | Genes involved in Hormone-sensitive lipase (HSL)-mediated triacylglycerol hydrolysis |
| 0.5 | 0.5 | REACTOME APC CDC20 MEDIATED DEGRADATION OF NEK2A | Genes involved in APC-Cdc20 mediated degradation of Nek2A |
| 0.5 | 4.6 | REACTOME TRYPTOPHAN CATABOLISM | Genes involved in Tryptophan catabolism |
| 0.5 | 1.0 | REACTOME SHC1 EVENTS IN EGFR SIGNALING | Genes involved in SHC1 events in EGFR signaling |
| 0.5 | 1.5 | REACTOME SCFSKP2 MEDIATED DEGRADATION OF P27 P21 | Genes involved in SCF(Skp2)-mediated degradation of p27/p21 |
| 0.5 | 9.3 | REACTOME ACTIVATION OF ATR IN RESPONSE TO REPLICATION STRESS | Genes involved in Activation of ATR in response to replication stress |
| 0.5 | 13.7 | REACTOME O LINKED GLYCOSYLATION OF MUCINS | Genes involved in O-linked glycosylation of mucins |
| 0.5 | 2.9 | REACTOME ETHANOL OXIDATION | Genes involved in Ethanol oxidation |
| 0.5 | 0.5 | REACTOME GLUCAGON SIGNALING IN METABOLIC REGULATION | Genes involved in Glucagon signaling in metabolic regulation |
| 0.5 | 2.4 | REACTOME BETA DEFENSINS | Genes involved in Beta defensins |
| 0.5 | 0.9 | REACTOME SYNTHESIS OF PIPS AT THE EARLY ENDOSOME MEMBRANE | Genes involved in Synthesis of PIPs at the early endosome membrane |
| 0.5 | 5.2 | REACTOME ANTIGEN ACTIVATES B CELL RECEPTOR LEADING TO GENERATION OF SECOND MESSENGERS | Genes involved in Antigen Activates B Cell Receptor Leading to Generation of Second Messengers |
| 0.5 | 3.7 | REACTOME HDL MEDIATED LIPID TRANSPORT | Genes involved in HDL-mediated lipid transport |
| 0.5 | 9.6 | REACTOME MEIOSIS | Genes involved in Meiosis |
| 0.5 | 5.5 | REACTOME ORGANIC CATION ANION ZWITTERION TRANSPORT | Genes involved in Organic cation/anion/zwitterion transport |
| 0.4 | 12.1 | REACTOME PHASE II CONJUGATION | Genes involved in Phase II conjugation |
| 0.4 | 1.3 | REACTOME DNA STRAND ELONGATION | Genes involved in DNA strand elongation |
| 0.4 | 1.8 | REACTOME DIGESTION OF DIETARY CARBOHYDRATE | Genes involved in Digestion of dietary carbohydrate |
| 0.4 | 3.5 | REACTOME P130CAS LINKAGE TO MAPK SIGNALING FOR INTEGRINS | Genes involved in p130Cas linkage to MAPK signaling for integrins |
| 0.4 | 2.6 | REACTOME SIGNAL REGULATORY PROTEIN SIRP FAMILY INTERACTIONS | Genes involved in Signal regulatory protein (SIRP) family interactions |
| 0.4 | 3.4 | REACTOME CALNEXIN CALRETICULIN CYCLE | Genes involved in Calnexin/calreticulin cycle |
| 0.4 | 13.0 | REACTOME IMMUNOREGULATORY INTERACTIONS BETWEEN A LYMPHOID AND A NON LYMPHOID CELL | Genes involved in Immunoregulatory interactions between a Lymphoid and a non-Lymphoid cell |
| 0.4 | 3.7 | REACTOME PIP3 ACTIVATES AKT SIGNALING | Genes involved in PIP3 activates AKT signaling |
| 0.4 | 0.4 | REACTOME DOWNSTREAM SIGNALING OF ACTIVATED FGFR | Genes involved in Downstream signaling of activated FGFR |
| 0.4 | 9.3 | REACTOME SEMA4D IN SEMAPHORIN SIGNALING | Genes involved in Sema4D in semaphorin signaling |
| 0.4 | 14.3 | REACTOME ACTIVATION OF CHAPERONE GENES BY XBP1S | Genes involved in Activation of Chaperone Genes by XBP1(S) |
| 0.4 | 2.3 | REACTOME S PHASE | Genes involved in S Phase |
| 0.4 | 15.6 | REACTOME CHEMOKINE RECEPTORS BIND CHEMOKINES | Genes involved in Chemokine receptors bind chemokines |
| 0.4 | 5.7 | REACTOME SIGNALING BY SCF KIT | Genes involved in Signaling by SCF-KIT |
| 0.4 | 1.9 | REACTOME GAMMA CARBOXYLATION TRANSPORT AND AMINO TERMINAL CLEAVAGE OF PROTEINS | Genes involved in Gamma-carboxylation, transport, and amino-terminal cleavage of proteins |
| 0.4 | 4.2 | REACTOME RNA POL I TRANSCRIPTION | Genes involved in RNA Polymerase I Transcription |
| 0.4 | 24.3 | REACTOME GLYCEROPHOSPHOLIPID BIOSYNTHESIS | Genes involved in Glycerophospholipid biosynthesis |
| 0.4 | 8.9 | REACTOME MHC CLASS II ANTIGEN PRESENTATION | Genes involved in MHC class II antigen presentation |
| 0.4 | 3.7 | REACTOME LATENT INFECTION OF HOMO SAPIENS WITH MYCOBACTERIUM TUBERCULOSIS | Genes involved in Latent infection of Homo sapiens with Mycobacterium tuberculosis |
| 0.4 | 0.7 | REACTOME DOWNREGULATION OF ERBB2 ERBB3 SIGNALING | Genes involved in Downregulation of ERBB2:ERBB3 signaling |
| 0.4 | 2.2 | REACTOME THE ROLE OF NEF IN HIV1 REPLICATION AND DISEASE PATHOGENESIS | Genes involved in The role of Nef in HIV-1 replication and disease pathogenesis |
| 0.4 | 1.1 | REACTOME SIGNAL TRANSDUCTION BY L1 | Genes involved in Signal transduction by L1 |
| 0.4 | 0.7 | REACTOME ADVANCED GLYCOSYLATION ENDPRODUCT RECEPTOR SIGNALING | Genes involved in Advanced glycosylation endproduct receptor signaling |
| 0.4 | 12.9 | REACTOME TRANS GOLGI NETWORK VESICLE BUDDING | Genes involved in trans-Golgi Network Vesicle Budding |
| 0.4 | 1.8 | REACTOME LIPID DIGESTION MOBILIZATION AND TRANSPORT | Genes involved in Lipid digestion, mobilization, and transport |
| 0.4 | 11.7 | REACTOME NRAGE SIGNALS DEATH THROUGH JNK | Genes involved in NRAGE signals death through JNK |
| 0.3 | 4.9 | REACTOME AMINE COMPOUND SLC TRANSPORTERS | Genes involved in Amine compound SLC transporters |
| 0.3 | 8.7 | REACTOME ASSOCIATION OF TRIC CCT WITH TARGET PROTEINS DURING BIOSYNTHESIS | Genes involved in Association of TriC/CCT with target proteins during biosynthesis |
| 0.3 | 3.8 | REACTOME RECYCLING PATHWAY OF L1 | Genes involved in Recycling pathway of L1 |
| 0.3 | 1.0 | REACTOME ALPHA LINOLENIC ACID ALA METABOLISM | Genes involved in alpha-linolenic acid (ALA) metabolism |
| 0.3 | 0.3 | REACTOME P75NTR SIGNALS VIA NFKB | Genes involved in p75NTR signals via NF-kB |
| 0.3 | 3.4 | REACTOME HYALURONAN UPTAKE AND DEGRADATION | Genes involved in Hyaluronan uptake and degradation |
| 0.3 | 2.7 | REACTOME GLOBAL GENOMIC NER GG NER | Genes involved in Global Genomic NER (GG-NER) |
| 0.3 | 5.7 | REACTOME CHOLESTEROL BIOSYNTHESIS | Genes involved in Cholesterol biosynthesis |
| 0.3 | 11.4 | REACTOME TRANSLATION | Genes involved in Translation |
| 0.3 | 35.4 | REACTOME METABOLISM OF AMINO ACIDS AND DERIVATIVES | Genes involved in Metabolism of amino acids and derivatives |
| 0.3 | 0.3 | REACTOME ABORTIVE ELONGATION OF HIV1 TRANSCRIPT IN THE ABSENCE OF TAT | Genes involved in Abortive elongation of HIV-1 transcript in the absence of Tat |
| 0.3 | 2.5 | REACTOME BILE SALT AND ORGANIC ANION SLC TRANSPORTERS | Genes involved in Bile salt and organic anion SLC transporters |
| 0.3 | 2.8 | REACTOME PI3K EVENTS IN ERBB2 SIGNALING | Genes involved in PI3K events in ERBB2 signaling |
| 0.3 | 4.3 | REACTOME SIGNALING BY HIPPO | Genes involved in Signaling by Hippo |
| 0.3 | 3.0 | REACTOME SYNTHESIS OF PIPS AT THE GOLGI MEMBRANE | Genes involved in Synthesis of PIPs at the Golgi membrane |
| 0.3 | 33.6 | REACTOME ANTIGEN PROCESSING UBIQUITINATION PROTEASOME DEGRADATION | Genes involved in Antigen processing: Ubiquitination & Proteasome degradation |
| 0.3 | 3.3 | REACTOME SYNTHESIS OF VERY LONG CHAIN FATTY ACYL COAS | Genes involved in Synthesis of very long-chain fatty acyl-CoAs |
| 0.3 | 1.2 | REACTOME PROLONGED ERK ACTIVATION EVENTS | Genes involved in Prolonged ERK activation events |
| 0.3 | 1.1 | REACTOME PLATELET ADHESION TO EXPOSED COLLAGEN | Genes involved in Platelet Adhesion to exposed collagen |
| 0.3 | 17.1 | REACTOME SIGNALING BY RHO GTPASES | Genes involved in Signaling by Rho GTPases |
| 0.3 | 0.5 | REACTOME INFLUENZA VIRAL RNA TRANSCRIPTION AND REPLICATION | Genes involved in Influenza Viral RNA Transcription and Replication |
| 0.3 | 1.3 | REACTOME TGF BETA RECEPTOR SIGNALING IN EMT EPITHELIAL TO MESENCHYMAL TRANSITION | Genes involved in TGF-beta receptor signaling in EMT (epithelial to mesenchymal transition) |
| 0.3 | 3.0 | REACTOME ENOS ACTIVATION AND REGULATION | Genes involved in eNOS activation and regulation |
| 0.2 | 0.7 | REACTOME COMMON PATHWAY | Genes involved in Common Pathway |
| 0.2 | 1.7 | REACTOME RECYCLING OF BILE ACIDS AND SALTS | Genes involved in Recycling of bile acids and salts |
| 0.2 | 2.6 | REACTOME VITAMIN B5 PANTOTHENATE METABOLISM | Genes involved in Vitamin B5 (pantothenate) metabolism |
| 0.2 | 0.2 | REACTOME PKB MEDIATED EVENTS | Genes involved in PKB-mediated events |
| 0.2 | 1.6 | REACTOME ANDROGEN BIOSYNTHESIS | Genes involved in Androgen biosynthesis |
| 0.2 | 3.0 | REACTOME SIGNALING BY NODAL | Genes involved in Signaling by NODAL |
| 0.2 | 19.3 | REACTOME NONSENSE MEDIATED DECAY ENHANCED BY THE EXON JUNCTION COMPLEX | Genes involved in Nonsense Mediated Decay Enhanced by the Exon Junction Complex |
| 0.2 | 1.5 | REACTOME MEMBRANE BINDING AND TARGETTING OF GAG PROTEINS | Genes involved in Membrane binding and targetting of GAG proteins |
| 0.2 | 5.8 | REACTOME TIGHT JUNCTION INTERACTIONS | Genes involved in Tight junction interactions |
| 0.2 | 2.5 | REACTOME RESOLUTION OF AP SITES VIA THE SINGLE NUCLEOTIDE REPLACEMENT PATHWAY | Genes involved in Resolution of AP sites via the single-nucleotide replacement pathway |
| 0.2 | 2.5 | REACTOME GLUCOSE TRANSPORT | Genes involved in Glucose transport |
| 0.2 | 0.6 | REACTOME CROSS PRESENTATION OF SOLUBLE EXOGENOUS ANTIGENS ENDOSOMES | Genes involved in Cross-presentation of soluble exogenous antigens (endosomes) |
| 0.2 | 3.0 | REACTOME G ALPHA Z SIGNALLING EVENTS | Genes involved in G alpha (z) signalling events |
| 0.2 | 1.6 | REACTOME MITOCHONDRIAL FATTY ACID BETA OXIDATION | Genes involved in Mitochondrial Fatty Acid Beta-Oxidation |
| 0.2 | 0.7 | REACTOME HYALURONAN METABOLISM | Genes involved in Hyaluronan metabolism |
| 0.2 | 0.5 | REACTOME PROCESSING OF CAPPED INTRONLESS PRE MRNA | Genes involved in Processing of Capped Intronless Pre-mRNA |
| 0.2 | 2.6 | REACTOME CITRIC ACID CYCLE TCA CYCLE | Genes involved in Citric acid cycle (TCA cycle) |
| 0.2 | 0.3 | REACTOME N GLYCAN TRIMMING IN THE ER AND CALNEXIN CALRETICULIN CYCLE | Genes involved in N-glycan trimming in the ER and Calnexin/Calreticulin cycle |
| 0.2 | 1.7 | REACTOME RNA POL III CHAIN ELONGATION | Genes involved in RNA Polymerase III Chain Elongation |
| 0.2 | 6.2 | REACTOME RESPONSE TO ELEVATED PLATELET CYTOSOLIC CA2 | Genes involved in Response to elevated platelet cytosolic Ca2+ |
| 0.2 | 0.5 | REACTOME ELONGATION ARREST AND RECOVERY | Genes involved in Elongation arrest and recovery |
| 0.2 | 1.9 | REACTOME PRE NOTCH EXPRESSION AND PROCESSING | Genes involved in Pre-NOTCH Expression and Processing |
| 0.2 | 0.9 | REACTOME REGULATION OF IFNG SIGNALING | Genes involved in Regulation of IFNG signaling |
| 0.1 | 2.4 | REACTOME RNA POL II TRANSCRIPTION PRE INITIATION AND PROMOTER OPENING | Genes involved in RNA Polymerase II Transcription Pre-Initiation And Promoter Opening |
| 0.1 | 0.3 | REACTOME ACTIVATION OF CHAPERONES BY ATF6 ALPHA | Genes involved in Activation of Chaperones by ATF6-alpha |
| 0.1 | 0.7 | REACTOME RNA POL III TRANSCRIPTION INITIATION FROM TYPE 2 PROMOTER | Genes involved in RNA Polymerase III Transcription Initiation From Type 2 Promoter |
| 0.1 | 0.3 | REACTOME PLATELET AGGREGATION PLUG FORMATION | Genes involved in Platelet Aggregation (Plug Formation) |
| 0.1 | 1.0 | REACTOME FACILITATIVE NA INDEPENDENT GLUCOSE TRANSPORTERS | Genes involved in Facilitative Na+-independent glucose transporters |
| 0.1 | 1.5 | REACTOME REGULATION OF PYRUVATE DEHYDROGENASE PDH COMPLEX | Genes involved in Regulation of pyruvate dehydrogenase (PDH) complex |
| 0.1 | 3.5 | REACTOME INTEGRATION OF ENERGY METABOLISM | Genes involved in Integration of energy metabolism |
| 0.1 | 0.9 | REACTOME IRON UPTAKE AND TRANSPORT | Genes involved in Iron uptake and transport |
| 0.1 | 1.5 | REACTOME PROTEOLYTIC CLEAVAGE OF SNARE COMPLEX PROTEINS | Genes involved in Proteolytic cleavage of SNARE complex proteins |
| 0.1 | 0.1 | REACTOME BOTULINUM NEUROTOXICITY | Genes involved in Botulinum neurotoxicity |
| 0.1 | 2.0 | REACTOME SYNTHESIS OF GLYCOSYLPHOSPHATIDYLINOSITOL GPI | Genes involved in Synthesis of glycosylphosphatidylinositol (GPI) |
| 0.1 | 1.3 | REACTOME PRESYNAPTIC NICOTINIC ACETYLCHOLINE RECEPTORS | Genes involved in Presynaptic nicotinic acetylcholine receptors |
| 0.1 | 0.7 | REACTOME REGULATION OF APOPTOSIS | Genes involved in Regulation of Apoptosis |
| 0.1 | 7.4 | REACTOME RESPIRATORY ELECTRON TRANSPORT ATP SYNTHESIS BY CHEMIOSMOTIC COUPLING AND HEAT PRODUCTION BY UNCOUPLING PROTEINS | Genes involved in Respiratory electron transport, ATP synthesis by chemiosmotic coupling, and heat production by uncoupling proteins. |
| 0.1 | 0.5 | REACTOME TCA CYCLE AND RESPIRATORY ELECTRON TRANSPORT | Genes involved in The citric acid (TCA) cycle and respiratory electron transport |
| 0.1 | 1.8 | REACTOME HS GAG BIOSYNTHESIS | Genes involved in HS-GAG biosynthesis |
| 0.1 | 0.4 | REACTOME INTERACTIONS OF VPR WITH HOST CELLULAR PROTEINS | Genes involved in Interactions of Vpr with host cellular proteins |
| 0.1 | 0.7 | REACTOME GROWTH HORMONE RECEPTOR SIGNALING | Genes involved in Growth hormone receptor signaling |
| 0.1 | 3.4 | REACTOME MITOCHONDRIAL PROTEIN IMPORT | Genes involved in Mitochondrial Protein Import |
| 0.1 | 2.0 | REACTOME REGULATION OF BETA CELL DEVELOPMENT | Genes involved in Regulation of beta-cell development |
| 0.1 | 0.6 | REACTOME KERATAN SULFATE DEGRADATION | Genes involved in Keratan sulfate degradation |
| 0.1 | 0.4 | REACTOME SYNTHESIS OF BILE ACIDS AND BILE SALTS VIA 7ALPHA HYDROXYCHOLESTEROL | Genes involved in Synthesis of bile acids and bile salts via 7alpha-hydroxycholesterol |
| 0.1 | 1.3 | REACTOME ZINC TRANSPORTERS | Genes involved in Zinc transporters |
| 0.1 | 2.2 | REACTOME BIOSYNTHESIS OF THE N GLYCAN PRECURSOR DOLICHOL LIPID LINKED OLIGOSACCHARIDE LLO AND TRANSFER TO A NASCENT PROTEIN | Genes involved in Biosynthesis of the N-glycan precursor (dolichol lipid-linked oligosaccharide, LLO) and transfer to a nascent protein |
| 0.1 | 1.4 | REACTOME HS GAG DEGRADATION | Genes involved in HS-GAG degradation |
| 0.1 | 1.2 | REACTOME DNA REPAIR | Genes involved in DNA Repair |
| 0.1 | 2.6 | REACTOME INTEGRIN CELL SURFACE INTERACTIONS | Genes involved in Integrin cell surface interactions |
| 0.1 | 0.4 | REACTOME NUCLEAR SIGNALING BY ERBB4 | Genes involved in Nuclear signaling by ERBB4 |
| 0.1 | 1.2 | REACTOME NOTCH1 INTRACELLULAR DOMAIN REGULATES TRANSCRIPTION | Genes involved in NOTCH1 Intracellular Domain Regulates Transcription |
| 0.1 | 0.3 | REACTOME G1 PHASE | Genes involved in G1 Phase |
| 0.1 | 0.1 | REACTOME RETROGRADE NEUROTROPHIN SIGNALLING | Genes involved in Retrograde neurotrophin signalling |
| 0.1 | 0.1 | REACTOME CYCLIN E ASSOCIATED EVENTS DURING G1 S TRANSITION | Genes involved in Cyclin E associated events during G1/S transition |
| 0.0 | 0.2 | REACTOME APOPTOSIS INDUCED DNA FRAGMENTATION | Genes involved in Apoptosis induced DNA fragmentation |
| 0.0 | 0.2 | REACTOME HOST INTERACTIONS OF HIV FACTORS | Genes involved in Host Interactions of HIV factors |
| 0.0 | 0.0 | REACTOME XENOBIOTICS | Genes involved in Xenobiotics |
| 0.0 | 4.2 | REACTOME PEPTIDE LIGAND BINDING RECEPTORS | Genes involved in Peptide ligand-binding receptors |
| 0.0 | 1.1 | REACTOME METABOLISM OF VITAMINS AND COFACTORS | Genes involved in Metabolism of vitamins and cofactors |
| 0.0 | 0.1 | REACTOME KERATAN SULFATE KERATIN METABOLISM | Genes involved in Keratan sulfate/keratin metabolism |
| 0.0 | 0.1 | REACTOME G ALPHA S SIGNALLING EVENTS | Genes involved in G alpha (s) signalling events |
| 0.0 | 0.0 | REACTOME CIRCADIAN CLOCK | Genes involved in Circadian Clock |
| 0.0 | 0.1 | REACTOME ASPARAGINE N LINKED GLYCOSYLATION | Genes involved in Asparagine N-linked glycosylation |
| 0.0 | 0.1 | REACTOME NUCLEOTIDE BINDING DOMAIN LEUCINE RICH REPEAT CONTAINING RECEPTOR NLR SIGNALING PATHWAYS | Genes involved in Nucleotide-binding domain, leucine rich repeat containing receptor (NLR) signaling pathways |
| 0.0 | 0.1 | REACTOME DOWNSTREAM TCR SIGNALING | Genes involved in Downstream TCR signaling |
| 0.0 | 0.5 | REACTOME METABOLISM OF STEROID HORMONES AND VITAMINS A AND D | Genes involved in Metabolism of steroid hormones and vitamins A and D |
| 0.0 | 0.2 | REACTOME PROSTANOID LIGAND RECEPTORS | Genes involved in Prostanoid ligand receptors |
| 0.0 | 0.1 | REACTOME DCC MEDIATED ATTRACTIVE SIGNALING | Genes involved in DCC mediated attractive signaling |
| 0.0 | 0.2 | REACTOME DOWNSTREAM SIGNAL TRANSDUCTION | Genes involved in Downstream signal transduction |
| 0.0 | 0.1 | REACTOME TRANSPORT OF GLUCOSE AND OTHER SUGARS BILE SALTS AND ORGANIC ACIDS METAL IONS AND AMINE COMPOUNDS | Genes involved in Transport of glucose and other sugars, bile salts and organic acids, metal ions and amine compounds |
| 0.0 | 0.3 | REACTOME GLUCONEOGENESIS | Genes involved in Gluconeogenesis |
| 0.0 | 0.3 | REACTOME AMINE LIGAND BINDING RECEPTORS | Genes involved in Amine ligand-binding receptors |