Project
ENCODE: ATAC-seq of different tissues during embryonic development
Navigation
Downloads

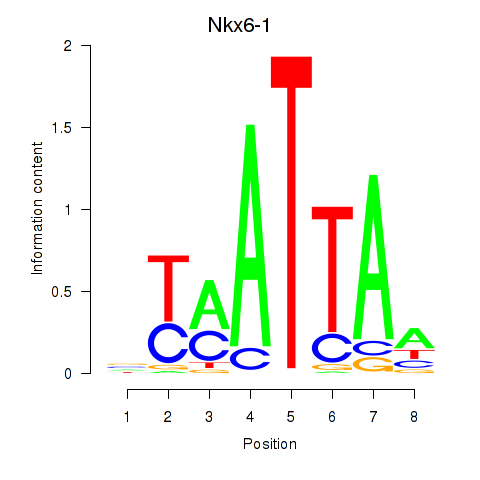
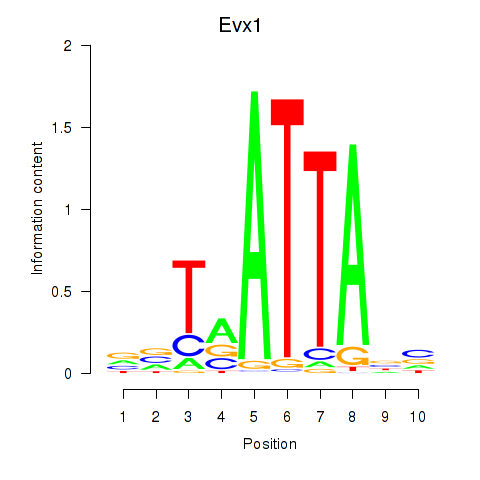
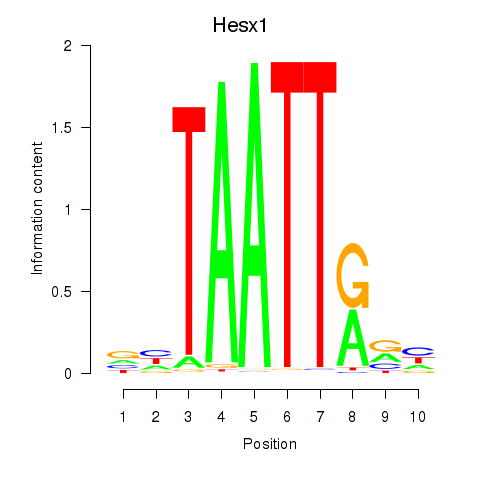
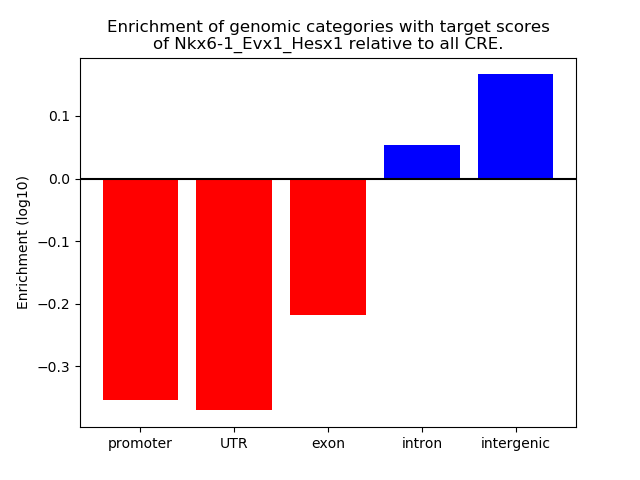
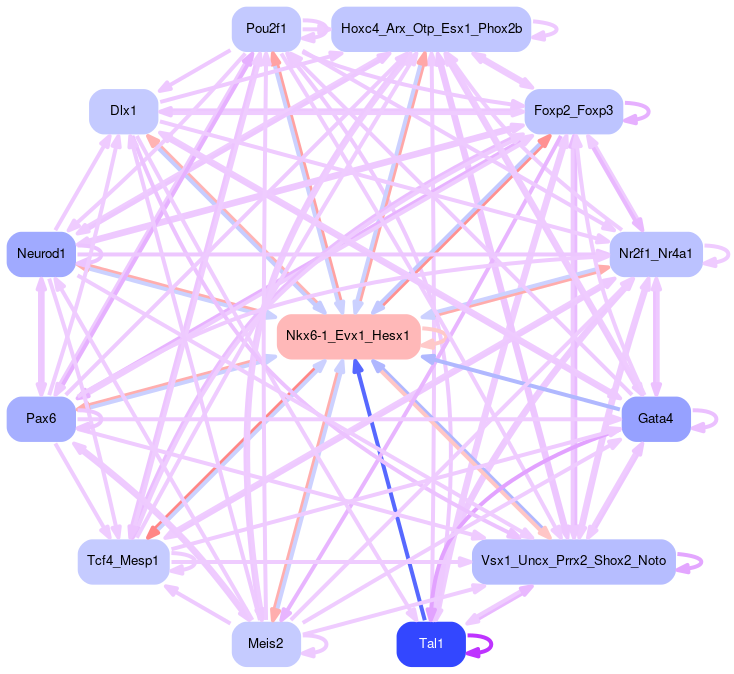
Results for Nkx6-1_Evx1_Hesx1
Z-value: 5.66
Motif logo
Transcription factors associated with Nkx6-1_Evx1_Hesx1
| Gene Symbol | Gene ID | Gene Info |
|---|---|---|
|
Nkx6-1
|
ENSMUSG00000035187.8 | NK6 homeobox 1 |
|
Evx1
|
ENSMUSG00000005503.8 | even-skipped homeobox 1 |
|
Hesx1
|
ENSMUSG00000040726.8 | homeobox gene expressed in ES cells |
Correlations of motif activity and signal intensity at CREs associated with the motif's TFs:
This plot shows correlation between observed signal intensity of a CRE associated with the transcription factor across all samples and activity of the motif.
For each TF, only the top 5 correlated CREs are shown.
| CRE | Gene | Distance | Association probability | Pearson corr. coef. | P-value | Plot |
|---|---|---|---|---|---|---|
| chr6_52305970_52306290 | Evx1 | 7368 | 0.084143 | 0.08 | 5.9e-01 | Click! |
| chr14_26994209_26994559 | Hesx1 | 32 | 0.976517 | -0.58 | 3.3e-06 | Click! |
| chr14_26994627_26994778 | Hesx1 | 286 | 0.905259 | -0.41 | 1.8e-03 | Click! |
| chr14_26991810_26991961 | Hesx1 | 2531 | 0.267844 | -0.22 | 1.1e-01 | Click! |
| chr14_27000625_27000792 | Hesx1 | 346 | 0.877379 | -0.08 | 5.4e-01 | Click! |
| chr14_27000375_27000536 | Hesx1 | 93 | 0.969576 | -0.06 | 6.7e-01 | Click! |
| chr5_101663283_101663528 | Nkx6-1 | 1591 | 0.382928 | -0.39 | 3.3e-03 | Click! |
| chr5_101665664_101665834 | Nkx6-1 | 753 | 0.656733 | 0.24 | 7.5e-02 | Click! |
| chr5_101665040_101665292 | Nkx6-1 | 170 | 0.951637 | 0.14 | 3.0e-01 | Click! |
| chr5_101664680_101664854 | Nkx6-1 | 229 | 0.931488 | 0.14 | 3.2e-01 | Click! |
| chr5_101663886_101664037 | Nkx6-1 | 1035 | 0.533796 | 0.07 | 6.1e-01 | Click! |
Activity of the Nkx6-1_Evx1_Hesx1 motif across conditions
Conditions sorted by the z-value of the Nkx6-1_Evx1_Hesx1 motif activity
Move your cursor over a bar to see sample name and corresponding Z-value.
Top target CREs of the motif:
| Cis Regulatory Element (CRE) | Target Score | Top associated gene | Gene Info | Distance of CRE to TSS | CRE/Gene association probability |
|---|---|---|---|---|---|
| chrX_169838405_169838582 | 60.14 |
Mid1 |
midline 1 |
10334 |
0.25 |
| chr17_11927079_11927230 | 60.05 |
Prkn |
parkin RBR E3 ubiquitin protein ligase |
81944 |
0.1 |
| chr13_99444397_99444879 | 58.25 |
Map1b |
microtubule-associated protein 1B |
171 |
0.95 |
| chr11_112501711_112502406 | 50.69 |
BC006965 |
cDNA sequence BC006965 |
167340 |
0.04 |
| chr18_23036938_23037296 | 49.51 |
Nol4 |
nucleolar protein 4 |
1539 |
0.55 |
| chr16_54195261_54195567 | 49.20 |
Gm49639 |
predicted gene, 49639 |
154914 |
0.04 |
| chr12_58670274_58670654 | 47.60 |
Gm18873 |
predicted gene, 18873 |
93442 |
0.08 |
| chr3_119021248_119021588 | 46.91 |
Gm43410 |
predicted gene 43410 |
153174 |
0.04 |
| chr4_70811006_70811333 | 46.64 |
Gm11227 |
predicted gene 11227 |
261504 |
0.02 |
| chr13_83750227_83750397 | 46.54 |
C130071C03Rik |
RIKEN cDNA C130071C03 gene |
11449 |
0.12 |
| chr6_54552680_54553127 | 46.15 |
Scrn1 |
secernin 1 |
1543 |
0.37 |
| chr14_55052295_55052661 | 45.85 |
Zfhx2os |
zinc finger homeobox 2, opposite strand |
1391 |
0.2 |
| chr3_3832009_3832194 | 44.68 |
Gm2071 |
predicted gene 2071 |
2817 |
0.34 |
| chr15_4378780_4379184 | 44.39 |
Plcxd3 |
phosphatidylinositol-specific phospholipase C, X domain containing 3 |
3478 |
0.36 |
| chr11_40624416_40624805 | 44.21 |
Gm12137 |
predicted gene 12137 |
11892 |
0.19 |
| chr12_84532163_84533007 | 43.66 |
Lin52 |
lin-52 homolog (C. elegans) |
2541 |
0.25 |
| chr3_66102086_66102567 | 43.14 |
Gm36973 |
predicted gene, 36973 |
2521 |
0.19 |
| chr2_72426764_72427187 | 42.99 |
Cdca7 |
cell division cycle associated 7 |
49184 |
0.13 |
| chr3_78792451_78792970 | 42.64 |
Gm18952 |
predicted gene, 18952 |
34091 |
0.19 |
| chr14_59737148_59737645 | 42.20 |
Gm19716 |
predicted gene, 19716 |
94848 |
0.07 |
| chr2_168343654_168344081 | 41.96 |
Gm22704 |
predicted gene, 22704 |
8167 |
0.18 |
| chr10_67559869_67560062 | 41.84 |
4930563J15Rik |
RIKEN cDNA 4930563J15 gene |
10073 |
0.12 |
| chr3_139885937_139886924 | 41.07 |
Gm43678 |
predicted gene 43678 |
73666 |
0.11 |
| chr6_12337029_12337231 | 40.75 |
Thsd7a |
thrombospondin, type I, domain containing 7A |
12437 |
0.3 |
| chr17_93377556_93377754 | 40.54 |
Gm50001 |
predicted gene, 50001 |
14043 |
0.22 |
| chr3_40673604_40673797 | 40.53 |
Intu |
inturned planar cell polarity protein |
1079 |
0.49 |
| chr13_83749857_83750036 | 39.96 |
C130071C03Rik |
RIKEN cDNA C130071C03 gene |
11083 |
0.12 |
| chr13_84751597_84751791 | 39.93 |
Gm26913 |
predicted gene, 26913 |
60753 |
0.15 |
| chr18_86158490_86158809 | 39.87 |
Gm50381 |
predicted gene, 50381 |
61405 |
0.14 |
| chr2_63669718_63669895 | 39.25 |
Gm23503 |
predicted gene, 23503 |
237612 |
0.02 |
| chr15_40114597_40115428 | 38.89 |
9330182O14Rik |
RIKEN cDNA 9330182O14 gene |
19353 |
0.17 |
| chr15_13989845_13990168 | 38.86 |
Gm49114 |
predicted gene, 49114 |
151949 |
0.04 |
| chr15_74194149_74194481 | 38.86 |
Gm15387 |
predicted gene 15387 |
99982 |
0.07 |
| chr16_7448068_7448264 | 38.70 |
Rbfox1 |
RNA binding protein, fox-1 homolog (C. elegans) 1 |
95196 |
0.1 |
| chr3_34561729_34562051 | 38.40 |
Sox2ot |
SOX2 overlapping transcript (non-protein coding) |
1498 |
0.34 |
| chr11_25696299_25696505 | 38.33 |
Gm23514 |
predicted gene, 23514 |
11262 |
0.27 |
| chr5_64476669_64477265 | 38.28 |
C030018K13Rik |
RIKEN cDNA C030018K13 gene |
41 |
0.96 |
| chr14_59819298_59819449 | 38.22 |
Gm19716 |
predicted gene, 19716 |
176825 |
0.03 |
| chr1_96346717_96347057 | 38.10 |
Gm37076 |
predicted gene, 37076 |
33645 |
0.18 |
| chr3_17795323_17795845 | 38.06 |
Mir124a-2 |
microRNA 124a-2 |
78 |
0.62 |
| chr1_167182388_167182722 | 37.85 |
Gm37994 |
predicted gene, 37994 |
3833 |
0.21 |
| chr2_150735739_150736543 | 37.84 |
Gm28450 |
predicted gene 28450 |
11520 |
0.12 |
| chr6_16727315_16727512 | 37.69 |
Gm36669 |
predicted gene, 36669 |
50111 |
0.17 |
| chr12_51002047_51002408 | 37.55 |
Gm40421 |
predicted gene, 40421 |
2646 |
0.28 |
| chr16_63806441_63806811 | 37.49 |
Epha3 |
Eph receptor A3 |
56787 |
0.15 |
| chr11_40456488_40456834 | 37.32 |
3110004A20Rik |
RIKEN cDNA 3110004A20 gene |
19016 |
0.17 |
| chr10_70458638_70458831 | 37.28 |
Fam13c |
family with sequence similarity 13, member C |
17808 |
0.19 |
| chr2_165076987_165077575 | 37.12 |
1700025C18Rik |
RIKEN cDNA 1700025C18 gene |
13469 |
0.14 |
| chr10_17479308_17479459 | 36.96 |
Gm47768 |
predicted gene, 47768 |
35347 |
0.16 |
| chr1_46830172_46830391 | 36.80 |
Slc39a10 |
solute carrier family 39 (zinc transporter), member 10 |
5618 |
0.22 |
| chr5_5134656_5134845 | 36.79 |
Gm43623 |
predicted gene 43623 |
5357 |
0.21 |
| chr4_39344820_39345025 | 36.76 |
Gm23607 |
predicted gene, 23607 |
49459 |
0.14 |
| chr7_74687903_74688273 | 36.61 |
Gm7726 |
predicted gene 7726 |
11768 |
0.26 |
| chr15_88468083_88468426 | 36.47 |
Zdhhc25 |
zinc finger, DHHC domain containing 25 |
132048 |
0.05 |
| chr13_29370907_29371310 | 35.95 |
Cdkal1 |
CDK5 regulatory subunit associated protein 1-like 1 |
103499 |
0.08 |
| chr10_16052455_16052829 | 35.88 |
C330004P14Rik |
RIKEN cDNA C330004P14 gene |
260865 |
0.02 |
| chr3_39048326_39048698 | 35.86 |
Gm43539 |
predicted gene 43539 |
38831 |
0.19 |
| chr2_56257440_56257969 | 35.83 |
Gm13518 |
predicted gene 13518 |
217851 |
0.02 |
| chr14_115082136_115082318 | 35.79 |
Gpc5 |
glypican 5 |
9988 |
0.13 |
| chr7_142902999_142903346 | 35.78 |
Th |
tyrosine hydroxylase |
3158 |
0.22 |
| chr13_83739197_83739995 | 35.55 |
C130071C03Rik |
RIKEN cDNA C130071C03 gene |
733 |
0.33 |
| chr14_12338097_12338549 | 35.43 |
Gm24578 |
predicted gene, 24578 |
4419 |
0.14 |
| chr7_96865260_96865776 | 35.40 |
Gm25712 |
predicted gene, 25712 |
2139 |
0.28 |
| chr6_107711195_107711474 | 35.37 |
4933431M02Rik |
RIKEN cDNA 4933431M02 gene |
83560 |
0.1 |
| chr17_84749518_84749672 | 35.12 |
Lrpprc |
leucine-rich PPR-motif containing |
1667 |
0.35 |
| chr13_116087410_116087561 | 34.98 |
Gm47893 |
predicted gene, 47893 |
8550 |
0.28 |
| chr10_87501180_87501623 | 34.87 |
Gm48120 |
predicted gene, 48120 |
6461 |
0.19 |
| chr16_67610911_67611282 | 34.87 |
Cadm2 |
cell adhesion molecule 2 |
9397 |
0.25 |
| chr11_21713646_21713804 | 34.82 |
Wdpcp |
WD repeat containing planar cell polarity effector |
18596 |
0.2 |
| chr15_95217343_95217494 | 34.79 |
1700129L04Rik |
RIKEN cDNA 1700129L04 gene |
55024 |
0.17 |
| chr15_18190602_18190753 | 34.75 |
Gm8318 |
predicted gene 8318 |
26796 |
0.22 |
| chr3_18456098_18456702 | 34.59 |
Gm30667 |
predicted gene, 30667 |
4854 |
0.24 |
| chr5_78622542_78622942 | 34.48 |
Gm43232 |
predicted gene 43232 |
82214 |
0.11 |
| chr6_6603963_6604155 | 34.44 |
Sem1 |
SEM1, 26S proteasome complex subunit |
25396 |
0.18 |
| chr7_72601928_72602360 | 34.41 |
Gm37620 |
predicted gene, 37620 |
155 |
0.96 |
| chr19_59866689_59867059 | 34.24 |
Gm17203 |
predicted gene 17203 |
34188 |
0.18 |
| chr6_17797574_17797931 | 34.17 |
Gm26738 |
predicted gene, 26738 |
37433 |
0.13 |
| chr6_137699415_137699798 | 34.17 |
Strap |
serine/threonine kinase receptor associated protein |
35472 |
0.16 |
| chr18_88785266_88785620 | 33.96 |
Socs6 |
suppressor of cytokine signaling 6 |
26952 |
0.17 |
| chr17_63807674_63808197 | 33.83 |
Fer |
fer (fms/fps related) protein kinase |
55127 |
0.13 |
| chr1_64066744_64067258 | 33.80 |
Gm13748 |
predicted gene 13748 |
11653 |
0.19 |
| chr12_33225655_33225815 | 33.73 |
Atxn7l1os1 |
ataxin 7-like 1, opposite strand 1 |
3119 |
0.29 |
| chr2_47834160_47834335 | 33.70 |
Gm25959 |
predicted gene, 25959 |
292263 |
0.01 |
| chr16_74191732_74191898 | 33.64 |
Gm49658 |
predicted gene, 49658 |
684 |
0.72 |
| chr13_43950070_43950222 | 33.56 |
Gm2233 |
predicted gene 2233 |
1267 |
0.5 |
| chr19_27904687_27904996 | 33.42 |
Rfx3 |
regulatory factor X, 3 (influences HLA class II expression) |
3946 |
0.29 |
| chr2_54265163_54265368 | 33.36 |
Gm14035 |
predicted gene 14035 |
18850 |
0.21 |
| chr1_176099027_176099243 | 33.21 |
Gm38081 |
predicted gene, 38081 |
66412 |
0.1 |
| chr11_26806852_26807151 | 33.12 |
Gm12070 |
predicted gene 12070 |
20368 |
0.19 |
| chr5_107497898_107498054 | 33.03 |
Btbd8 |
BTB (POZ) domain containing 8 |
197 |
0.9 |
| chr10_31551495_31551682 | 32.96 |
Gm47693 |
predicted gene, 47693 |
5852 |
0.19 |
| chrX_58445733_58445903 | 32.96 |
Gm14645 |
predicted gene 14645 |
17743 |
0.26 |
| chr2_152069243_152069466 | 32.93 |
AA387200 |
expressed sequence AA387200 |
7454 |
0.15 |
| chr1_6752243_6752413 | 32.91 |
St18 |
suppression of tumorigenicity 18 |
14753 |
0.25 |
| chr7_78887666_78887880 | 32.82 |
Mir7-2 |
microRNA 7-2 |
504 |
0.68 |
| chr12_90131976_90132183 | 32.61 |
Gm48700 |
predicted gene, 48700 |
63980 |
0.15 |
| chr1_138497460_138497658 | 32.50 |
Gm28501 |
predicted gene 28501 |
18056 |
0.2 |
| chr18_72725028_72725395 | 32.46 |
Gm31819 |
predicted gene, 31819 |
144 |
0.98 |
| chr11_93488029_93488206 | 32.42 |
Gm24856 |
predicted gene, 24856 |
74793 |
0.12 |
| chr2_57522938_57523151 | 32.34 |
Gm13531 |
predicted gene 13531 |
97335 |
0.07 |
| chr9_61102454_61102622 | 32.29 |
4933433G08Rik |
RIKEN cDNA 4933433G08 gene |
2847 |
0.2 |
| chr7_64884497_64884825 | 32.28 |
Nsmce3 |
NSE3 homolog, SMC5-SMC6 complex component |
11664 |
0.22 |
| chr10_15249538_15249689 | 32.17 |
Gm18188 |
predicted gene, 18188 |
21565 |
0.23 |
| chr10_32871097_32871256 | 32.16 |
Nkain2 |
Na+/K+ transporting ATPase interacting 2 |
18520 |
0.25 |
| chr12_44839950_44840386 | 32.06 |
Gm15901 |
predicted gene 15901 |
83012 |
0.1 |
| chr2_123364591_123364759 | 32.00 |
Gm13988 |
predicted gene 13988 |
90751 |
0.1 |
| chr2_146763416_146764171 | 31.96 |
Gm14111 |
predicted gene 14111 |
8088 |
0.27 |
| chr2_106512677_106513062 | 31.94 |
Gm14015 |
predicted gene 14015 |
10234 |
0.26 |
| chr6_15397521_15397861 | 31.94 |
Gm25470 |
predicted gene, 25470 |
7290 |
0.26 |
| chr7_16147163_16147320 | 31.87 |
Slc8a2 |
solute carrier family 8 (sodium/calcium exchanger), member 2 |
16893 |
0.11 |
| chr6_138754677_138754895 | 31.84 |
Igbp1b |
immunoglobulin (CD79A) binding protein 1b |
96242 |
0.08 |
| chr6_61066614_61066949 | 31.78 |
Gm43893 |
predicted gene, 43893 |
2474 |
0.28 |
| chr15_44705846_44706012 | 31.64 |
Sybu |
syntabulin (syntaxin-interacting) |
41859 |
0.15 |
| chr9_33630065_33630387 | 31.53 |
Gm47778 |
predicted gene, 47778 |
32861 |
0.21 |
| chr10_29143863_29144732 | 31.53 |
Gm9996 |
predicted gene 9996 |
103 |
0.69 |
| chr1_159015364_159015547 | 31.53 |
Pappa2 |
pappalysin 2 |
34965 |
0.17 |
| chr7_64579951_64580289 | 31.50 |
Gm44721 |
predicted gene 44721 |
50695 |
0.12 |
| chr11_32019966_32020621 | 31.31 |
Nsg2 |
neuron specific gene family member 2 |
19791 |
0.19 |
| chr9_10526392_10526546 | 31.25 |
Gm46103 |
predicted gene, 46103 |
50534 |
0.17 |
| chr2_28780313_28780498 | 31.20 |
Gm13385 |
predicted gene 13385 |
13164 |
0.13 |
| chr12_29789878_29790063 | 31.14 |
Myt1l |
myelin transcription factor 1-like |
50240 |
0.17 |
| chr4_28143160_28143344 | 31.03 |
Gm11911 |
predicted gene 11911 |
76075 |
0.11 |
| chr18_8044886_8045210 | 31.02 |
Gm4833 |
predicted gene 4833 |
6155 |
0.28 |
| chr13_52457883_52458068 | 30.94 |
Diras2 |
DIRAS family, GTP-binding RAS-like 2 |
73304 |
0.12 |
| chr2_123799511_123799723 | 30.87 |
Sema6d |
sema domain, transmembrane domain (TM), and cytoplasmic domain, (semaphorin) 6D |
290352 |
0.01 |
| chr8_13454338_13454755 | 30.82 |
Tmem255b |
transmembrane protein 255B |
932 |
0.51 |
| chr18_78455374_78455574 | 30.81 |
4931439C15Rik |
RIKEN cDNA 4931439C15 gene |
21404 |
0.24 |
| chr8_86961518_86961711 | 30.80 |
Gm24781 |
predicted gene, 24781 |
4005 |
0.19 |
| chr2_142335542_142335810 | 30.78 |
Macrod2 |
mono-ADP ribosylhydrolase 2 |
159069 |
0.04 |
| chr6_127449629_127449900 | 30.77 |
Parp11 |
poly (ADP-ribose) polymerase family, member 11 |
501 |
0.78 |
| chr4_24213358_24214284 | 30.72 |
Gm11892 |
predicted gene 11892 |
24279 |
0.27 |
| chr2_63669900_63670081 | 30.69 |
Gm23503 |
predicted gene, 23503 |
237796 |
0.02 |
| chr5_9044913_9045065 | 30.63 |
Gm40264 |
predicted gene, 40264 |
9865 |
0.15 |
| chr19_59697672_59697945 | 30.59 |
Gm50411 |
predicted gene, 50411 |
7074 |
0.25 |
| chr8_26677560_26678005 | 30.55 |
Gm32098 |
predicted gene, 32098 |
9476 |
0.18 |
| chr2_41498351_41498548 | 30.51 |
Lrp1b |
low density lipoprotein-related protein 1B |
290629 |
0.01 |
| chr5_13312689_13312966 | 30.48 |
Sema3a |
sema domain, immunoglobulin domain (Ig), short basic domain, secreted, (semaphorin) 3A |
83957 |
0.09 |
| chr3_47668909_47669138 | 30.48 |
Gm2229 |
predicted gene 2229 |
208685 |
0.03 |
| chr8_47642536_47642697 | 30.44 |
Gm8623 |
predicted gene 8623 |
9852 |
0.12 |
| chr7_111896291_111896806 | 30.41 |
Gm45588 |
predicted gene 45588 |
37993 |
0.17 |
| chr9_5752747_5752938 | 30.35 |
Gm48506 |
predicted gene, 48506 |
43937 |
0.19 |
| chr12_78987630_78988054 | 30.22 |
Tmem229b |
transmembrane protein 229B |
4364 |
0.21 |
| chr11_39596506_39596789 | 30.15 |
Gm12131 |
predicted gene 12131 |
131065 |
0.06 |
| chr4_24429638_24429836 | 30.11 |
Gm27243 |
predicted gene 27243 |
1153 |
0.54 |
| chr8_89135140_89135331 | 30.06 |
Gm6625 |
predicted gene 6625 |
11823 |
0.24 |
| chr17_8368820_8369004 | 30.06 |
T2 |
brachyury 2 |
3484 |
0.15 |
| chr13_84783651_84783837 | 30.05 |
Gm26913 |
predicted gene, 26913 |
92803 |
0.09 |
| chr6_23243851_23244662 | 30.00 |
Fezf1 |
Fez family zinc finger 1 |
4106 |
0.2 |
| chr11_47459324_47459525 | 29.99 |
Sgcd |
sarcoglycan, delta (dystrophin-associated glycoprotein) |
79902 |
0.11 |
| chr4_148291962_148292123 | 29.95 |
Disp3 |
dispatched RND transporter family member 3 |
4077 |
0.19 |
| chr1_135645775_135646042 | 29.92 |
Nav1 |
neuron navigator 1 |
42197 |
0.12 |
| chr13_24656992_24657522 | 29.85 |
Ripor2 |
RHO family interacting cell polarization regulator 2 |
15682 |
0.19 |
| chr13_101019238_101019730 | 29.84 |
Gm6114 |
predicted gene 6114 |
5498 |
0.21 |
| chr5_106577367_106577576 | 29.81 |
Gm29464 |
predicted gene 29464 |
2596 |
0.19 |
| chrX_60545622_60545821 | 29.70 |
Gm715 |
predicted gene 715 |
2298 |
0.23 |
| chr10_19396813_19397100 | 29.68 |
Olig3 |
oligodendrocyte transcription factor 3 |
40423 |
0.16 |
| chr15_59973915_59974066 | 29.67 |
Gm7083 |
predicted gene 7083 |
3732 |
0.23 |
| chr12_96114939_96115347 | 29.62 |
1700019M22Rik |
RIKEN cDNA 1700019M22 gene |
68023 |
0.13 |
| chr18_74956688_74957137 | 29.57 |
Lipg |
lipase, endothelial |
4350 |
0.11 |
| chr18_74907209_74907702 | 29.50 |
Gm24559 |
predicted gene, 24559 |
1021 |
0.37 |
| chr11_44785172_44785367 | 29.44 |
Gm12158 |
predicted gene 12158 |
122593 |
0.05 |
| chr1_157969609_157969781 | 29.26 |
Gm38256 |
predicted gene, 38256 |
29310 |
0.25 |
| chr7_129392977_129393128 | 29.13 |
Gm33027 |
predicted gene, 33027 |
10038 |
0.29 |
| chr2_132427639_132427949 | 29.13 |
4921508D12Rik |
RIKEN cDNA 4921508D12 gene |
3053 |
0.25 |
| chr17_76111639_76112128 | 29.12 |
Gm24126 |
predicted gene, 24126 |
37337 |
0.22 |
| chr3_75085844_75086059 | 29.12 |
Zbbx |
zinc finger, B-box domain containing |
57752 |
0.14 |
| chr6_40024235_40024578 | 29.02 |
Gm37995 |
predicted gene, 37995 |
2488 |
0.33 |
| chr13_82620860_82621103 | 29.01 |
Mir3961 |
microRNA 3961 |
77352 |
0.12 |
| chr1_165914170_165914334 | 28.93 |
Pou2f1 |
POU domain, class 2, transcription factor 1 |
969 |
0.48 |
| chr8_58372581_58372772 | 28.92 |
Gm45635 |
predicted gene 45635 |
126089 |
0.06 |
| chr6_127701185_127701975 | 28.88 |
Gm43634 |
predicted gene 43634 |
57140 |
0.08 |
| chr13_78181182_78181614 | 28.85 |
Gm38604 |
predicted gene, 38604 |
1761 |
0.26 |
| chr5_116895407_116895611 | 28.81 |
Gm43122 |
predicted gene 43122 |
64955 |
0.1 |
| chr2_50971381_50971555 | 28.74 |
Gm13498 |
predicted gene 13498 |
61784 |
0.14 |
| chr14_64233778_64233929 | 28.71 |
9630015K15Rik |
RIKEN cDNA 9630015K15 gene |
117539 |
0.05 |
| chr13_78100021_78100517 | 28.71 |
C130051F05Rik |
RIKEN cDNA C130051F05 gene |
12213 |
0.15 |
| chr4_87739581_87739778 | 28.70 |
Mllt3 |
myeloid/lymphoid or mixed-lineage leukemia; translocated to, 3 |
66615 |
0.13 |
| chr4_97235906_97236408 | 28.63 |
Gm12696 |
predicted gene 12696 |
286175 |
0.01 |
| chr18_17383276_17383802 | 28.52 |
4921533I20Rik |
Riken cDNA 4921533I20 gene |
63809 |
0.15 |
| chr17_69686012_69686193 | 28.49 |
Gm49895 |
predicted gene, 49895 |
89910 |
0.08 |
| chr7_67468944_67469359 | 28.48 |
Gm33926 |
predicted gene, 33926 |
25218 |
0.17 |
| chr16_59854456_59854822 | 28.46 |
Epha6 |
Eph receptor A6 |
151082 |
0.04 |
| chr13_64527016_64527226 | 28.41 |
Gm47190 |
predicted gene, 47190 |
11267 |
0.13 |
| chr14_78132773_78132953 | 28.39 |
Fam216b |
family with sequence similarity 216, member B |
43856 |
0.12 |
| chr3_34504632_34504783 | 28.35 |
Gm29135 |
predicted gene 29135 |
22500 |
0.16 |
| chr15_18190039_18190239 | 28.29 |
Gm8318 |
predicted gene 8318 |
26258 |
0.22 |
| chr2_57916465_57916651 | 28.28 |
Gm33594 |
predicted gene, 33594 |
69459 |
0.11 |
| chr6_61042953_61043250 | 28.20 |
Gm43892 |
predicted gene, 43892 |
1892 |
0.33 |
| chr15_66486114_66486277 | 28.15 |
Lrrc6 |
leucine rich repeat containing 6 (testis) |
14715 |
0.23 |
| chr1_69046688_69046868 | 28.11 |
Gm16076 |
predicted gene 16076 |
59962 |
0.13 |
| chr8_49462101_49462489 | 28.07 |
4930555F03Rik |
RIKEN cDNA 4930555F03 gene |
1028 |
0.5 |
| chr6_23280695_23281211 | 28.02 |
C130093G08Rik |
RIKEN cDNA C130093G08 gene |
29820 |
0.15 |
| chr8_97397028_97397210 | 27.97 |
Gm5913 |
predicted gene 5913 |
31991 |
0.2 |
| chr3_134605538_134605802 | 27.96 |
Gm26820 |
predicted gene, 26820 |
25095 |
0.24 |
| chr4_24429061_24429567 | 27.95 |
Gm27243 |
predicted gene 27243 |
1576 |
0.43 |
| chr4_6912973_6913331 | 27.85 |
Tox |
thymocyte selection-associated high mobility group box |
77331 |
0.11 |
| chr6_103514048_103514248 | 27.81 |
Chl1 |
cell adhesion molecule L1-like |
2818 |
0.24 |
| chr11_41532495_41533004 | 27.79 |
Hspd1-ps3 |
heat shock protein 1 (chaperonin), pseudogene 3 |
34012 |
0.2 |
| chr10_51153683_51154077 | 27.74 |
Gm26257 |
predicted gene, 26257 |
28419 |
0.22 |
| chr5_60599748_60600063 | 27.71 |
Gm43390 |
predicted gene 43390 |
21275 |
0.23 |
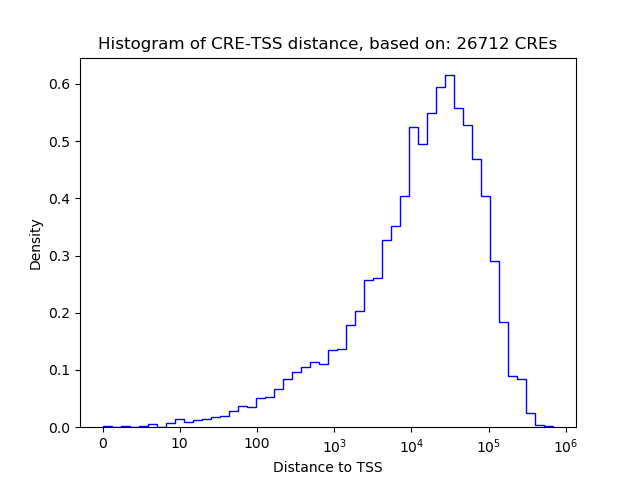
Histogram of CRE-TSS distances for CREs targeted by :
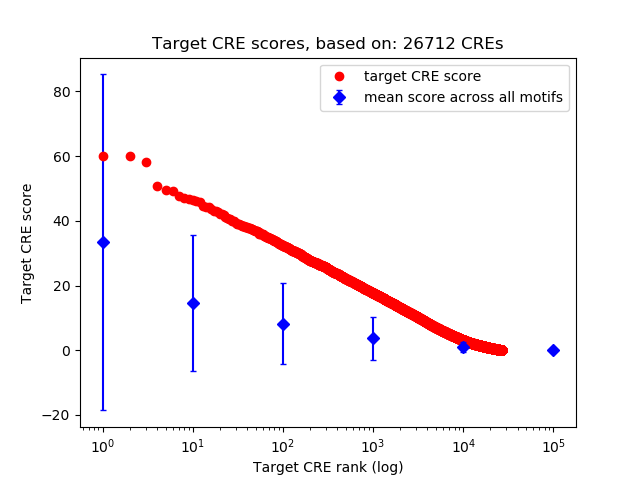
Rank distribution of CRE target scores:
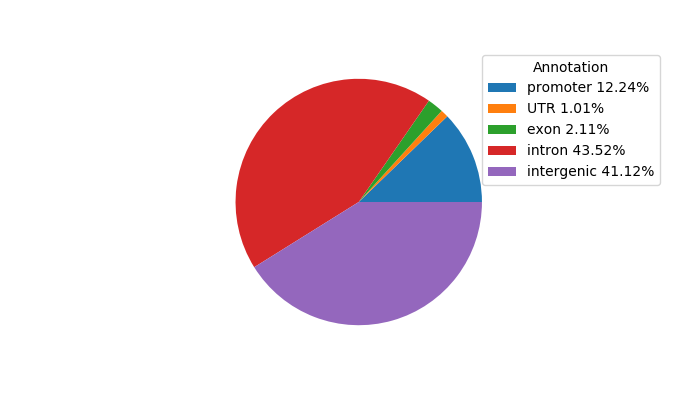
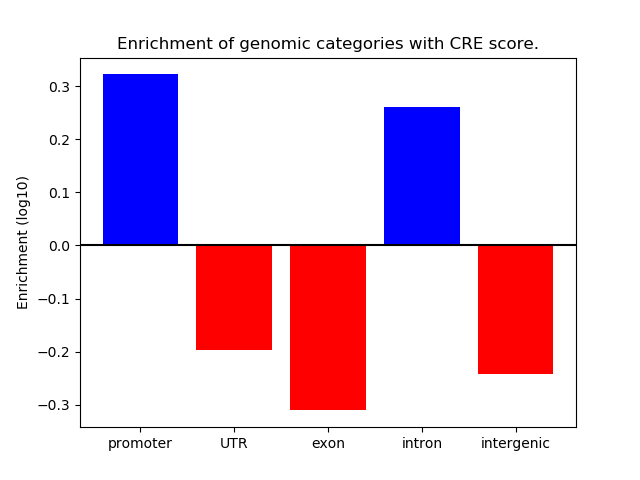
Distribution of target CREs across different genomic regions:
Network of associatons between targets according to the STRING database.

Gene Ontology Analysis
Gene overrepresentation in biological process category:
| Log-likelihood per target | Total log-likelihood | Term | Description |
|---|---|---|---|
| 29.9 | 89.8 | GO:0097118 | neuroligin clustering involved in postsynaptic membrane assembly(GO:0097118) |
| 14.8 | 88.7 | GO:0098598 | vocal learning(GO:0042297) imitative learning(GO:0098596) learned vocalization behavior or vocal learning(GO:0098598) |
| 13.9 | 41.8 | GO:0021530 | spinal cord oligodendrocyte cell differentiation(GO:0021529) spinal cord oligodendrocyte cell fate specification(GO:0021530) |
| 13.5 | 54.1 | GO:2001013 | epithelial cell proliferation involved in renal tubule morphogenesis(GO:2001013) |
| 12.2 | 24.3 | GO:0021780 | oligodendrocyte cell fate specification(GO:0021778) oligodendrocyte cell fate commitment(GO:0021779) glial cell fate specification(GO:0021780) |
| 11.6 | 11.6 | GO:2000302 | positive regulation of synaptic vesicle exocytosis(GO:2000302) |
| 10.9 | 76.0 | GO:0016198 | axon choice point recognition(GO:0016198) |
| 10.5 | 31.5 | GO:0006842 | tricarboxylic acid transport(GO:0006842) citrate transport(GO:0015746) |
| 10.5 | 42.0 | GO:0051611 | negative regulation of neurotransmitter uptake(GO:0051581) regulation of serotonin uptake(GO:0051611) negative regulation of serotonin uptake(GO:0051612) |
| 10.2 | 91.8 | GO:0021830 | interneuron migration from the subpallium to the cortex(GO:0021830) |
| 9.1 | 27.2 | GO:0032289 | central nervous system myelin formation(GO:0032289) |
| 8.9 | 26.8 | GO:0021882 | regulation of transcription from RNA polymerase II promoter involved in forebrain neuron fate commitment(GO:0021882) |
| 8.9 | 26.7 | GO:0043490 | malate-aspartate shuttle(GO:0043490) |
| 8.5 | 25.5 | GO:0035609 | C-terminal protein deglutamylation(GO:0035609) |
| 8.4 | 67.5 | GO:0021796 | cerebral cortex regionalization(GO:0021796) |
| 8.3 | 25.0 | GO:1901843 | positive regulation of high voltage-gated calcium channel activity(GO:1901843) |
| 8.0 | 8.0 | GO:0006106 | fumarate metabolic process(GO:0006106) |
| 8.0 | 32.1 | GO:1903818 | positive regulation of delayed rectifier potassium channel activity(GO:1902261) positive regulation of voltage-gated potassium channel activity(GO:1903818) |
| 8.0 | 40.1 | GO:0030910 | olfactory placode formation(GO:0030910) olfactory placode development(GO:0071698) olfactory placode morphogenesis(GO:0071699) |
| 7.7 | 30.6 | GO:0097476 | motor neuron migration(GO:0097475) spinal cord motor neuron migration(GO:0097476) |
| 7.6 | 30.3 | GO:0031117 | positive regulation of microtubule depolymerization(GO:0031117) |
| 7.5 | 82.3 | GO:0034643 | establishment of mitochondrion localization, microtubule-mediated(GO:0034643) mitochondrion transport along microtubule(GO:0047497) |
| 7.5 | 22.4 | GO:1902071 | regulation of hypoxia-inducible factor-1alpha signaling pathway(GO:1902071) |
| 7.4 | 22.1 | GO:0021847 | ventricular zone neuroblast division(GO:0021847) |
| 7.0 | 14.0 | GO:1903802 | L-glutamate(1-) import into cell(GO:1903802) L-glutamate import into cell(GO:1990123) |
| 6.7 | 20.0 | GO:0048677 | axon extension involved in regeneration(GO:0048677) sprouting of injured axon(GO:0048682) |
| 6.6 | 26.3 | GO:0060164 | regulation of timing of neuron differentiation(GO:0060164) |
| 6.5 | 19.4 | GO:0097112 | gamma-aminobutyric acid receptor clustering(GO:0097112) |
| 6.3 | 50.6 | GO:0045161 | neuronal ion channel clustering(GO:0045161) |
| 6.3 | 18.9 | GO:0097155 | fasciculation of sensory neuron axon(GO:0097155) |
| 6.2 | 43.2 | GO:0014054 | positive regulation of gamma-aminobutyric acid secretion(GO:0014054) |
| 6.0 | 18.1 | GO:0060178 | regulation of exocyst localization(GO:0060178) |
| 5.9 | 17.6 | GO:2000981 | negative regulation of mechanoreceptor differentiation(GO:0045632) negative regulation of inner ear receptor cell differentiation(GO:2000981) |
| 5.7 | 17.0 | GO:0021797 | forebrain anterior/posterior pattern specification(GO:0021797) |
| 5.4 | 43.6 | GO:0035881 | amacrine cell differentiation(GO:0035881) |
| 5.3 | 53.1 | GO:1900746 | regulation of vascular endothelial growth factor signaling pathway(GO:1900746) |
| 5.1 | 10.1 | GO:0048880 | sensory system development(GO:0048880) |
| 4.9 | 9.8 | GO:0051944 | positive regulation of neurotransmitter uptake(GO:0051582) positive regulation of dopamine uptake involved in synaptic transmission(GO:0051586) positive regulation of catecholamine uptake involved in synaptic transmission(GO:0051944) |
| 4.9 | 9.7 | GO:0003358 | noradrenergic neuron development(GO:0003358) |
| 4.8 | 24.1 | GO:0021957 | corticospinal tract morphogenesis(GO:0021957) |
| 4.8 | 14.4 | GO:0046684 | response to pyrethroid(GO:0046684) |
| 4.8 | 14.4 | GO:0030070 | insulin processing(GO:0030070) |
| 4.8 | 9.5 | GO:1902866 | regulation of retina development in camera-type eye(GO:1902866) |
| 4.7 | 9.5 | GO:0089700 | protein kinase D signaling(GO:0089700) |
| 4.7 | 14.1 | GO:1901841 | regulation of high voltage-gated calcium channel activity(GO:1901841) |
| 4.7 | 32.9 | GO:0050957 | equilibrioception(GO:0050957) |
| 4.7 | 14.1 | GO:0001661 | conditioned taste aversion(GO:0001661) |
| 4.7 | 18.8 | GO:0033563 | dorsal/ventral axon guidance(GO:0033563) |
| 4.6 | 13.9 | GO:0052422 | modulation of catalytic activity in other organism involved in symbiotic interaction(GO:0052203) modulation by host of symbiont catalytic activity(GO:0052422) |
| 4.6 | 13.7 | GO:0021960 | anterior commissure morphogenesis(GO:0021960) |
| 4.6 | 18.3 | GO:0006538 | glutamate catabolic process(GO:0006538) |
| 4.6 | 13.7 | GO:1900738 | positive regulation of phospholipase C-activating G-protein coupled receptor signaling pathway(GO:1900738) |
| 4.5 | 13.6 | GO:0007412 | axon target recognition(GO:0007412) |
| 4.5 | 27.1 | GO:0021631 | optic nerve morphogenesis(GO:0021631) |
| 4.5 | 22.6 | GO:1903887 | motile primary cilium assembly(GO:1903887) |
| 4.4 | 4.4 | GO:0061642 | chemoattraction of axon(GO:0061642) |
| 4.3 | 17.2 | GO:0051725 | protein de-ADP-ribosylation(GO:0051725) |
| 4.3 | 8.6 | GO:0009449 | gamma-aminobutyric acid biosynthetic process(GO:0009449) |
| 4.3 | 4.3 | GO:0021564 | vagus nerve development(GO:0021564) |
| 4.2 | 72.0 | GO:0071475 | cellular hyperosmotic salinity response(GO:0071475) |
| 4.2 | 12.5 | GO:0070649 | formin-nucleated actin cable assembly(GO:0070649) |
| 4.2 | 12.5 | GO:0090258 | negative regulation of mitochondrial fission(GO:0090258) |
| 4.2 | 20.8 | GO:0098814 | spontaneous neurotransmitter secretion(GO:0061669) spontaneous synaptic transmission(GO:0098814) |
| 4.1 | 24.9 | GO:0010649 | regulation of cell communication by electrical coupling(GO:0010649) |
| 4.1 | 20.6 | GO:0060287 | epithelial cilium movement involved in determination of left/right asymmetry(GO:0060287) |
| 4.1 | 8.2 | GO:0072282 | metanephric nephron tubule morphogenesis(GO:0072282) metanephric nephron tubule formation(GO:0072289) |
| 4.1 | 16.4 | GO:0007258 | JUN phosphorylation(GO:0007258) |
| 4.0 | 32.3 | GO:0021871 | forebrain regionalization(GO:0021871) |
| 4.0 | 8.0 | GO:0072221 | distal convoluted tubule development(GO:0072025) DCT cell differentiation(GO:0072069) metanephric distal convoluted tubule development(GO:0072221) metanephric distal tubule development(GO:0072235) metanephric DCT cell differentiation(GO:0072240) |
| 4.0 | 4.0 | GO:0097151 | positive regulation of inhibitory postsynaptic potential(GO:0097151) |
| 3.9 | 7.9 | GO:0021559 | trigeminal nerve development(GO:0021559) |
| 3.9 | 3.9 | GO:0060916 | mesenchymal cell proliferation involved in lung development(GO:0060916) |
| 3.9 | 7.7 | GO:0060174 | limb bud formation(GO:0060174) |
| 3.9 | 11.6 | GO:1903223 | positive regulation of oxidative stress-induced neuron death(GO:1903223) |
| 3.8 | 11.5 | GO:0044339 | canonical Wnt signaling pathway involved in osteoblast differentiation(GO:0044339) |
| 3.8 | 3.8 | GO:0021859 | pyramidal neuron differentiation(GO:0021859) |
| 3.6 | 14.6 | GO:0071947 | protein deubiquitination involved in ubiquitin-dependent protein catabolic process(GO:0071947) |
| 3.6 | 14.5 | GO:0070366 | regulation of hepatocyte differentiation(GO:0070366) |
| 3.6 | 10.9 | GO:0070634 | transepithelial ammonium transport(GO:0070634) |
| 3.6 | 28.8 | GO:0071625 | vocalization behavior(GO:0071625) |
| 3.6 | 32.3 | GO:0031536 | positive regulation of exit from mitosis(GO:0031536) |
| 3.6 | 3.6 | GO:0072309 | mesenchymal stem cell maintenance involved in metanephric nephron morphogenesis(GO:0072309) |
| 3.6 | 14.3 | GO:0006432 | phenylalanyl-tRNA aminoacylation(GO:0006432) |
| 3.6 | 3.6 | GO:2000807 | regulation of synaptic vesicle clustering(GO:2000807) |
| 3.5 | 14.1 | GO:0035934 | corticosterone secretion(GO:0035934) regulation of corticosterone secretion(GO:2000852) |
| 3.5 | 14.0 | GO:1903977 | positive regulation of glial cell migration(GO:1903977) |
| 3.5 | 7.0 | GO:0035696 | monocyte extravasation(GO:0035696) regulation of monocyte extravasation(GO:2000437) |
| 3.4 | 6.9 | GO:0021553 | olfactory nerve development(GO:0021553) |
| 3.4 | 6.8 | GO:0060594 | mammary gland specification(GO:0060594) |
| 3.4 | 13.5 | GO:0009957 | epidermal cell fate specification(GO:0009957) |
| 3.4 | 40.6 | GO:0016082 | synaptic vesicle priming(GO:0016082) |
| 3.4 | 10.1 | GO:0046959 | habituation(GO:0046959) |
| 3.3 | 6.7 | GO:0003330 | regulation of extracellular matrix constituent secretion(GO:0003330) positive regulation of extracellular matrix constituent secretion(GO:0003331) |
| 3.3 | 10.0 | GO:1903061 | positive regulation of protein lipidation(GO:1903061) |
| 3.3 | 10.0 | GO:0007196 | adenylate cyclase-inhibiting G-protein coupled glutamate receptor signaling pathway(GO:0007196) |
| 3.3 | 19.8 | GO:0006307 | DNA dealkylation involved in DNA repair(GO:0006307) |
| 3.3 | 19.7 | GO:0022605 | oogenesis stage(GO:0022605) |
| 3.2 | 13.0 | GO:0097105 | presynaptic membrane assembly(GO:0097105) |
| 3.2 | 9.7 | GO:2001170 | negative regulation of ATP biosynthetic process(GO:2001170) |
| 3.2 | 70.5 | GO:0007214 | gamma-aminobutyric acid signaling pathway(GO:0007214) |
| 3.2 | 9.6 | GO:1904694 | negative regulation of vascular smooth muscle contraction(GO:1904694) |
| 3.2 | 12.8 | GO:0072513 | positive regulation of secondary heart field cardioblast proliferation(GO:0072513) |
| 3.2 | 12.7 | GO:0034047 | regulation of protein phosphatase type 2A activity(GO:0034047) |
| 3.2 | 6.3 | GO:0070094 | positive regulation of glucagon secretion(GO:0070094) |
| 3.2 | 22.1 | GO:0002091 | negative regulation of receptor internalization(GO:0002091) |
| 3.1 | 12.6 | GO:0021914 | negative regulation of smoothened signaling pathway involved in ventral spinal cord patterning(GO:0021914) |
| 3.1 | 9.4 | GO:0060060 | post-embryonic retina morphogenesis in camera-type eye(GO:0060060) |
| 3.1 | 9.4 | GO:0032672 | regulation of interleukin-3 production(GO:0032672) |
| 3.1 | 25.1 | GO:0046069 | cGMP catabolic process(GO:0046069) |
| 3.1 | 25.1 | GO:0021952 | central nervous system projection neuron axonogenesis(GO:0021952) |
| 3.1 | 25.0 | GO:0060179 | male mating behavior(GO:0060179) |
| 3.1 | 9.3 | GO:1900245 | positive regulation of MDA-5 signaling pathway(GO:1900245) |
| 3.1 | 3.1 | GO:0097154 | GABAergic neuron differentiation(GO:0097154) |
| 3.1 | 15.3 | GO:0060666 | dichotomous subdivision of terminal units involved in salivary gland branching(GO:0060666) |
| 3.0 | 15.1 | GO:1903215 | negative regulation of protein targeting to mitochondrion(GO:1903215) |
| 3.0 | 15.0 | GO:0007256 | activation of JNKK activity(GO:0007256) |
| 2.9 | 8.8 | GO:1901475 | pyruvate transmembrane transport(GO:1901475) |
| 2.9 | 20.5 | GO:0006930 | substrate-dependent cell migration, cell extension(GO:0006930) |
| 2.9 | 8.7 | GO:0015803 | branched-chain amino acid transport(GO:0015803) leucine transport(GO:0015820) |
| 2.8 | 11.2 | GO:0001834 | trophectodermal cell proliferation(GO:0001834) |
| 2.8 | 16.8 | GO:0035641 | locomotory exploration behavior(GO:0035641) |
| 2.8 | 14.0 | GO:0048496 | maintenance of organ identity(GO:0048496) |
| 2.8 | 5.6 | GO:0002767 | immune response-inhibiting cell surface receptor signaling pathway(GO:0002767) |
| 2.7 | 8.2 | GO:0006553 | lysine metabolic process(GO:0006553) |
| 2.7 | 8.2 | GO:0038095 | Fc-epsilon receptor signaling pathway(GO:0038095) |
| 2.7 | 32.8 | GO:0002329 | pre-B cell differentiation(GO:0002329) |
| 2.7 | 13.6 | GO:0048681 | negative regulation of axon regeneration(GO:0048681) |
| 2.7 | 2.7 | GO:0021773 | striatal medium spiny neuron differentiation(GO:0021773) |
| 2.7 | 21.6 | GO:0002043 | blood vessel endothelial cell proliferation involved in sprouting angiogenesis(GO:0002043) |
| 2.7 | 156.8 | GO:0051965 | positive regulation of synapse assembly(GO:0051965) |
| 2.7 | 8.1 | GO:0019859 | pyrimidine nucleobase catabolic process(GO:0006208) thymine catabolic process(GO:0006210) thymine metabolic process(GO:0019859) |
| 2.7 | 8.0 | GO:0001927 | exocyst assembly(GO:0001927) |
| 2.6 | 10.6 | GO:0060279 | positive regulation of ovulation(GO:0060279) |
| 2.6 | 7.9 | GO:0002314 | germinal center B cell differentiation(GO:0002314) |
| 2.6 | 10.5 | GO:0048852 | diencephalon morphogenesis(GO:0048852) |
| 2.6 | 7.9 | GO:0072051 | juxtaglomerular apparatus development(GO:0072051) |
| 2.6 | 36.7 | GO:0010842 | retina layer formation(GO:0010842) |
| 2.6 | 10.5 | GO:0021785 | branchiomotor neuron axon guidance(GO:0021785) |
| 2.6 | 5.2 | GO:0090427 | activation of meiosis(GO:0090427) |
| 2.6 | 7.8 | GO:0032483 | regulation of Rab protein signal transduction(GO:0032483) |
| 2.6 | 10.4 | GO:0098904 | regulation of AV node cell action potential(GO:0098904) |
| 2.6 | 28.1 | GO:0035235 | ionotropic glutamate receptor signaling pathway(GO:0035235) |
| 2.5 | 2.5 | GO:0086066 | atrial cardiac muscle cell action potential(GO:0086014) atrial cardiac muscle cell to AV node cell signaling(GO:0086026) atrial cardiac muscle cell to AV node cell communication(GO:0086066) |
| 2.5 | 42.4 | GO:0001964 | startle response(GO:0001964) |
| 2.5 | 12.4 | GO:0090273 | regulation of somatostatin secretion(GO:0090273) |
| 2.5 | 7.4 | GO:0015014 | heparan sulfate proteoglycan biosynthetic process, polysaccharide chain biosynthetic process(GO:0015014) |
| 2.5 | 2.5 | GO:1901187 | regulation of ephrin receptor signaling pathway(GO:1901187) |
| 2.4 | 19.5 | GO:0002318 | myeloid progenitor cell differentiation(GO:0002318) |
| 2.4 | 4.9 | GO:0060005 | vestibular reflex(GO:0060005) |
| 2.4 | 7.3 | GO:0034184 | positive regulation of maintenance of sister chromatid cohesion(GO:0034093) positive regulation of maintenance of mitotic sister chromatid cohesion(GO:0034184) |
| 2.4 | 21.9 | GO:0006570 | tyrosine metabolic process(GO:0006570) |
| 2.4 | 7.3 | GO:1990035 | calcium ion import into cell(GO:1990035) |
| 2.4 | 14.4 | GO:0061732 | mitochondrial acetyl-CoA biosynthetic process from pyruvate(GO:0061732) |
| 2.4 | 12.0 | GO:2000271 | positive regulation of fibroblast apoptotic process(GO:2000271) |
| 2.4 | 12.0 | GO:0031339 | negative regulation of vesicle fusion(GO:0031339) |
| 2.4 | 7.2 | GO:2000680 | regulation of rubidium ion transport(GO:2000680) regulation of rubidium ion transmembrane transporter activity(GO:2000686) |
| 2.4 | 2.4 | GO:0021861 | forebrain radial glial cell differentiation(GO:0021861) |
| 2.4 | 9.4 | GO:0038108 | negative regulation of appetite by leptin-mediated signaling pathway(GO:0038108) |
| 2.3 | 9.4 | GO:0042997 | negative regulation of Golgi to plasma membrane protein transport(GO:0042997) |
| 2.3 | 18.8 | GO:0061003 | positive regulation of dendritic spine morphogenesis(GO:0061003) |
| 2.3 | 4.6 | GO:2000017 | positive regulation of determination of dorsal identity(GO:2000017) |
| 2.3 | 11.5 | GO:0002087 | regulation of respiratory gaseous exchange by neurological system process(GO:0002087) |
| 2.3 | 6.8 | GO:0030242 | pexophagy(GO:0030242) |
| 2.2 | 15.6 | GO:0050861 | positive regulation of B cell receptor signaling pathway(GO:0050861) |
| 2.2 | 2.2 | GO:0060221 | retinal rod cell differentiation(GO:0060221) |
| 2.2 | 13.3 | GO:0031290 | retinal ganglion cell axon guidance(GO:0031290) |
| 2.2 | 2.2 | GO:1902221 | L-phenylalanine metabolic process(GO:0006558) erythrose 4-phosphate/phosphoenolpyruvate family amino acid metabolic process(GO:1902221) |
| 2.2 | 166.0 | GO:0007156 | homophilic cell adhesion via plasma membrane adhesion molecules(GO:0007156) |
| 2.2 | 2.2 | GO:0046100 | hypoxanthine metabolic process(GO:0046100) hypoxanthine biosynthetic process(GO:0046101) |
| 2.2 | 6.5 | GO:0051964 | negative regulation of synapse assembly(GO:0051964) |
| 2.2 | 26.0 | GO:0048268 | clathrin coat assembly(GO:0048268) |
| 2.1 | 10.7 | GO:0045199 | maintenance of epithelial cell apical/basal polarity(GO:0045199) |
| 2.1 | 4.3 | GO:0021912 | regulation of transcription from RNA polymerase II promoter involved in spinal cord motor neuron fate specification(GO:0021912) |
| 2.1 | 6.4 | GO:0035582 | sequestering of BMP in extracellular matrix(GO:0035582) |
| 2.1 | 4.3 | GO:0072092 | ureteric bud invasion(GO:0072092) |
| 2.1 | 12.6 | GO:0060581 | ventral spinal cord interneuron fate commitment(GO:0060579) cell fate commitment involved in pattern specification(GO:0060581) |
| 2.1 | 4.2 | GO:0070779 | D-aspartate transport(GO:0070777) D-aspartate import(GO:0070779) |
| 2.1 | 4.2 | GO:0060166 | olfactory pit development(GO:0060166) |
| 2.1 | 10.3 | GO:0090244 | Wnt signaling pathway involved in somitogenesis(GO:0090244) |
| 2.1 | 6.2 | GO:0021542 | dentate gyrus development(GO:0021542) |
| 2.0 | 8.0 | GO:0000960 | mitochondrial RNA catabolic process(GO:0000957) regulation of mitochondrial RNA catabolic process(GO:0000960) |
| 2.0 | 6.0 | GO:0060478 | acrosomal vesicle exocytosis(GO:0060478) |
| 2.0 | 13.9 | GO:0051967 | negative regulation of synaptic transmission, glutamatergic(GO:0051967) |
| 2.0 | 9.9 | GO:0019532 | oxalate transport(GO:0019532) |
| 2.0 | 7.9 | GO:0045636 | positive regulation of melanocyte differentiation(GO:0045636) |
| 2.0 | 2.0 | GO:0021524 | visceral motor neuron differentiation(GO:0021524) |
| 1.9 | 5.8 | GO:0033564 | anterior/posterior axon guidance(GO:0033564) |
| 1.9 | 7.7 | GO:0048007 | antigen processing and presentation of lipid antigen via MHC class Ib(GO:0048003) antigen processing and presentation, exogenous lipid antigen via MHC class Ib(GO:0048007) |
| 1.9 | 9.6 | GO:2000980 | regulation of auditory receptor cell differentiation(GO:0045607) regulation of mechanoreceptor differentiation(GO:0045631) regulation of inner ear receptor cell differentiation(GO:2000980) |
| 1.9 | 3.8 | GO:0033693 | neurofilament bundle assembly(GO:0033693) |
| 1.9 | 3.8 | GO:0042322 | negative regulation of circadian sleep/wake cycle, REM sleep(GO:0042322) |
| 1.9 | 7.7 | GO:0051791 | medium-chain fatty acid metabolic process(GO:0051791) |
| 1.9 | 9.5 | GO:0098789 | pre-mRNA cleavage required for polyadenylation(GO:0098789) |
| 1.9 | 7.6 | GO:0060040 | retinal bipolar neuron differentiation(GO:0060040) |
| 1.9 | 7.6 | GO:0060244 | negative regulation of cell proliferation involved in contact inhibition(GO:0060244) |
| 1.9 | 3.8 | GO:0007158 | neuron cell-cell adhesion(GO:0007158) |
| 1.9 | 7.6 | GO:2000009 | negative regulation of protein localization to cell surface(GO:2000009) |
| 1.9 | 5.6 | GO:0019673 | GDP-mannose metabolic process(GO:0019673) |
| 1.9 | 7.4 | GO:0035627 | ceramide transport(GO:0035627) |
| 1.8 | 27.7 | GO:0090036 | regulation of protein kinase C signaling(GO:0090036) |
| 1.8 | 5.5 | GO:0048669 | collateral sprouting in absence of injury(GO:0048669) |
| 1.8 | 8.9 | GO:0071397 | cellular response to cholesterol(GO:0071397) |
| 1.8 | 3.6 | GO:0060741 | prostate gland stromal morphogenesis(GO:0060741) |
| 1.8 | 7.1 | GO:0015015 | heparan sulfate proteoglycan biosynthetic process, enzymatic modification(GO:0015015) |
| 1.8 | 3.5 | GO:0060125 | negative regulation of growth hormone secretion(GO:0060125) |
| 1.8 | 1.8 | GO:1900451 | positive regulation of glutamate receptor signaling pathway(GO:1900451) positive regulation of alpha-amino-3-hydroxy-5-methyl-4-isoxazole propionate selective glutamate receptor activity(GO:2000969) |
| 1.7 | 17.2 | GO:0071803 | positive regulation of podosome assembly(GO:0071803) |
| 1.7 | 5.2 | GO:1901301 | regulation of cargo loading into COPII-coated vesicle(GO:1901301) |
| 1.7 | 1.7 | GO:1901492 | positive regulation of lymphangiogenesis(GO:1901492) |
| 1.7 | 3.4 | GO:1900242 | regulation of synaptic vesicle endocytosis(GO:1900242) |
| 1.7 | 13.6 | GO:0071435 | potassium ion export(GO:0071435) |
| 1.7 | 3.4 | GO:0010982 | regulation of high-density lipoprotein particle clearance(GO:0010982) |
| 1.7 | 10.2 | GO:0050966 | detection of mechanical stimulus involved in sensory perception of pain(GO:0050966) |
| 1.7 | 8.5 | GO:0035331 | negative regulation of hippo signaling(GO:0035331) |
| 1.7 | 6.8 | GO:0021979 | hypothalamus cell differentiation(GO:0021979) |
| 1.7 | 5.1 | GO:0048388 | endosomal lumen acidification(GO:0048388) |
| 1.7 | 5.1 | GO:0060605 | tube lumen cavitation(GO:0060605) salivary gland cavitation(GO:0060662) |
| 1.7 | 3.4 | GO:0051654 | establishment of mitochondrion localization(GO:0051654) |
| 1.7 | 3.3 | GO:0036112 | medium-chain fatty-acyl-CoA metabolic process(GO:0036112) |
| 1.7 | 5.0 | GO:0021877 | forebrain neuron fate commitment(GO:0021877) |
| 1.7 | 1.7 | GO:0070858 | negative regulation of bile acid biosynthetic process(GO:0070858) negative regulation of bile acid metabolic process(GO:1904252) |
| 1.7 | 6.6 | GO:0006166 | purine ribonucleoside salvage(GO:0006166) |
| 1.7 | 5.0 | GO:0035526 | retrograde transport, plasma membrane to Golgi(GO:0035526) |
| 1.6 | 4.9 | GO:0032747 | positive regulation of interleukin-23 production(GO:0032747) |
| 1.6 | 4.8 | GO:0097119 | postsynaptic density protein 95 clustering(GO:0097119) |
| 1.6 | 6.4 | GO:0006627 | protein processing involved in protein targeting to mitochondrion(GO:0006627) |
| 1.6 | 4.8 | GO:2000574 | regulation of microtubule motor activity(GO:2000574) |
| 1.6 | 8.0 | GO:0006348 | chromatin silencing at telomere(GO:0006348) |
| 1.6 | 3.2 | GO:0001994 | norepinephrine-epinephrine vasoconstriction involved in regulation of systemic arterial blood pressure(GO:0001994) |
| 1.6 | 4.8 | GO:0042126 | nitrate metabolic process(GO:0042126) |
| 1.6 | 6.4 | GO:0000160 | phosphorelay signal transduction system(GO:0000160) |
| 1.6 | 1.6 | GO:0046864 | retinol transport(GO:0034633) isoprenoid transport(GO:0046864) terpenoid transport(GO:0046865) |
| 1.6 | 4.7 | GO:0006562 | proline catabolic process(GO:0006562) |
| 1.6 | 4.7 | GO:0003105 | negative regulation of glomerular filtration(GO:0003105) |
| 1.6 | 4.7 | GO:0033387 | putrescine biosynthetic process from ornithine(GO:0033387) |
| 1.6 | 4.7 | GO:0014826 | vein smooth muscle contraction(GO:0014826) |
| 1.6 | 6.2 | GO:0014816 | skeletal muscle satellite cell differentiation(GO:0014816) |
| 1.5 | 3.1 | GO:0014834 | skeletal muscle satellite cell maintenance involved in skeletal muscle regeneration(GO:0014834) |
| 1.5 | 4.6 | GO:0061589 | calcium activated phosphatidylserine scrambling(GO:0061589) |
| 1.5 | 1.5 | GO:1900019 | regulation of protein kinase C activity(GO:1900019) positive regulation of protein kinase C activity(GO:1900020) |
| 1.5 | 1.5 | GO:0070571 | negative regulation of neuron projection regeneration(GO:0070571) |
| 1.5 | 4.6 | GO:1903265 | positive regulation of tumor necrosis factor-mediated signaling pathway(GO:1903265) |
| 1.5 | 3.0 | GO:0046532 | regulation of photoreceptor cell differentiation(GO:0046532) |
| 1.5 | 3.0 | GO:0009629 | response to gravity(GO:0009629) |
| 1.5 | 13.3 | GO:0048280 | vesicle fusion with Golgi apparatus(GO:0048280) |
| 1.5 | 17.8 | GO:0016486 | peptide hormone processing(GO:0016486) |
| 1.5 | 5.9 | GO:1903546 | protein localization to photoreceptor outer segment(GO:1903546) |
| 1.5 | 7.4 | GO:0045053 | protein retention in Golgi apparatus(GO:0045053) |
| 1.5 | 5.8 | GO:0019919 | peptidyl-arginine methylation, to asymmetrical-dimethyl arginine(GO:0019919) |
| 1.5 | 2.9 | GO:0061156 | pulmonary artery morphogenesis(GO:0061156) |
| 1.5 | 5.8 | GO:0030091 | protein repair(GO:0030091) |
| 1.5 | 4.4 | GO:0042723 | thiamine metabolic process(GO:0006772) thiamine-containing compound metabolic process(GO:0042723) |
| 1.4 | 4.3 | GO:1903999 | negative regulation of eating behavior(GO:1903999) |
| 1.4 | 5.7 | GO:0045650 | negative regulation of macrophage differentiation(GO:0045650) |
| 1.4 | 8.5 | GO:0018344 | protein geranylgeranylation(GO:0018344) |
| 1.4 | 4.3 | GO:0014051 | gamma-aminobutyric acid secretion(GO:0014051) |
| 1.4 | 7.1 | GO:0032962 | positive regulation of inositol trisphosphate biosynthetic process(GO:0032962) |
| 1.4 | 5.6 | GO:0090148 | membrane fission(GO:0090148) |
| 1.4 | 5.6 | GO:0044336 | canonical Wnt signaling pathway involved in negative regulation of apoptotic process(GO:0044336) |
| 1.4 | 4.2 | GO:0002034 | regulation of blood vessel size by renin-angiotensin(GO:0002034) renal control of peripheral vascular resistance involved in regulation of systemic arterial blood pressure(GO:0003072) |
| 1.4 | 4.2 | GO:0071596 | ubiquitin-dependent protein catabolic process via the N-end rule pathway(GO:0071596) |
| 1.4 | 4.1 | GO:0035701 | hematopoietic stem cell migration(GO:0035701) |
| 1.4 | 8.2 | GO:0060831 | smoothened signaling pathway involved in dorsal/ventral neural tube patterning(GO:0060831) |
| 1.4 | 5.5 | GO:0048341 | paraxial mesoderm formation(GO:0048341) |
| 1.4 | 4.1 | GO:0006177 | GMP biosynthetic process(GO:0006177) |
| 1.4 | 1.4 | GO:1903935 | response to sodium arsenite(GO:1903935) |
| 1.4 | 1.4 | GO:0097374 | sensory neuron axon guidance(GO:0097374) |
| 1.4 | 2.7 | GO:1901529 | positive regulation of anion channel activity(GO:1901529) |
| 1.4 | 2.7 | GO:0045634 | regulation of melanocyte differentiation(GO:0045634) |
| 1.3 | 9.4 | GO:0048672 | positive regulation of collateral sprouting(GO:0048672) |
| 1.3 | 2.7 | GO:0031394 | positive regulation of prostaglandin biosynthetic process(GO:0031394) positive regulation of unsaturated fatty acid biosynthetic process(GO:2001280) |
| 1.3 | 2.7 | GO:0000101 | sulfur amino acid transport(GO:0000101) |
| 1.3 | 1.3 | GO:0086013 | membrane repolarization during cardiac muscle cell action potential(GO:0086013) |
| 1.3 | 2.7 | GO:0060648 | mammary gland bud morphogenesis(GO:0060648) |
| 1.3 | 7.8 | GO:0060158 | phospholipase C-activating dopamine receptor signaling pathway(GO:0060158) |
| 1.3 | 1.3 | GO:0061196 | fungiform papilla development(GO:0061196) |
| 1.3 | 3.8 | GO:1903899 | positive regulation of PERK-mediated unfolded protein response(GO:1903899) |
| 1.3 | 15.2 | GO:0009226 | nucleotide-sugar biosynthetic process(GO:0009226) |
| 1.3 | 3.8 | GO:0003219 | cardiac right ventricle formation(GO:0003219) |
| 1.3 | 3.8 | GO:0014075 | response to amine(GO:0014075) |
| 1.2 | 5.0 | GO:0051461 | positive regulation of corticotropin secretion(GO:0051461) |
| 1.2 | 6.2 | GO:0035948 | positive regulation of gluconeogenesis by positive regulation of transcription from RNA polymerase II promoter(GO:0035948) |
| 1.2 | 1.2 | GO:0014722 | regulation of skeletal muscle contraction by calcium ion signaling(GO:0014722) |
| 1.2 | 7.4 | GO:2000254 | regulation of male germ cell proliferation(GO:2000254) |
| 1.2 | 3.7 | GO:0060468 | prevention of polyspermy(GO:0060468) |
| 1.2 | 6.1 | GO:0060124 | positive regulation of growth hormone secretion(GO:0060124) |
| 1.2 | 34.2 | GO:0043252 | sodium-independent organic anion transport(GO:0043252) |
| 1.2 | 3.6 | GO:1902564 | negative regulation of neutrophil activation(GO:1902564) |
| 1.2 | 2.4 | GO:0060112 | generation of ovulation cycle rhythm(GO:0060112) |
| 1.2 | 4.8 | GO:0035426 | extracellular matrix-cell signaling(GO:0035426) |
| 1.2 | 2.4 | GO:0002930 | trabecular meshwork development(GO:0002930) |
| 1.2 | 7.2 | GO:0007262 | STAT protein import into nucleus(GO:0007262) |
| 1.2 | 1.2 | GO:0035826 | rubidium ion transport(GO:0035826) |
| 1.2 | 25.1 | GO:0006376 | mRNA splice site selection(GO:0006376) |
| 1.2 | 4.8 | GO:0070365 | hepatocyte differentiation(GO:0070365) |
| 1.2 | 1.2 | GO:2000275 | regulation of oxidative phosphorylation uncoupler activity(GO:2000275) |
| 1.2 | 1.2 | GO:0007529 | establishment of synaptic specificity at neuromuscular junction(GO:0007529) |
| 1.2 | 1.2 | GO:0010996 | response to auditory stimulus(GO:0010996) |
| 1.2 | 7.1 | GO:0032224 | positive regulation of synaptic transmission, cholinergic(GO:0032224) |
| 1.2 | 1.2 | GO:1902956 | regulation of mitochondrial electron transport, NADH to ubiquinone(GO:1902956) |
| 1.2 | 1.2 | GO:1902255 | positive regulation of intrinsic apoptotic signaling pathway by p53 class mediator(GO:1902255) |
| 1.2 | 4.7 | GO:0016557 | peroxisome membrane biogenesis(GO:0016557) |
| 1.2 | 14.1 | GO:0060576 | intestinal epithelial cell development(GO:0060576) |
| 1.2 | 10.4 | GO:2000269 | regulation of fibroblast apoptotic process(GO:2000269) |
| 1.1 | 8.0 | GO:0006072 | glycerol-3-phosphate metabolic process(GO:0006072) |
| 1.1 | 4.6 | GO:2000623 | regulation of nuclear-transcribed mRNA catabolic process, nonsense-mediated decay(GO:2000622) negative regulation of nuclear-transcribed mRNA catabolic process, nonsense-mediated decay(GO:2000623) |
| 1.1 | 5.7 | GO:0051970 | negative regulation of transmission of nerve impulse(GO:0051970) |
| 1.1 | 2.3 | GO:0046098 | guanine metabolic process(GO:0046098) |
| 1.1 | 2.3 | GO:0060825 | fibroblast growth factor receptor signaling pathway involved in neural plate anterior/posterior pattern formation(GO:0060825) regulation of fibroblast growth factor receptor signaling pathway involved in neural plate anterior/posterior pattern formation(GO:2000313) |
| 1.1 | 3.4 | GO:0070900 | mitochondrial tRNA modification(GO:0070900) mitochondrial RNA modification(GO:1900864) |
| 1.1 | 4.5 | GO:0034239 | regulation of macrophage fusion(GO:0034239) |
| 1.1 | 4.4 | GO:0005513 | detection of calcium ion(GO:0005513) |
| 1.1 | 1.1 | GO:0008065 | establishment of blood-nerve barrier(GO:0008065) |
| 1.1 | 8.8 | GO:0097120 | receptor localization to synapse(GO:0097120) |
| 1.1 | 5.4 | GO:2000811 | negative regulation of anoikis(GO:2000811) |
| 1.1 | 5.3 | GO:0010519 | negative regulation of phospholipase activity(GO:0010519) |
| 1.1 | 2.1 | GO:0030035 | microspike assembly(GO:0030035) |
| 1.1 | 5.3 | GO:1900113 | negative regulation of histone H3-K9 trimethylation(GO:1900113) |
| 1.1 | 1.1 | GO:0097195 | pilomotor reflex(GO:0097195) |
| 1.1 | 5.3 | GO:0090050 | positive regulation of cell migration involved in sprouting angiogenesis(GO:0090050) |
| 1.1 | 7.4 | GO:0001504 | neurotransmitter uptake(GO:0001504) |
| 1.1 | 2.1 | GO:0060872 | semicircular canal development(GO:0060872) |
| 1.0 | 1.0 | GO:0014045 | establishment of endothelial blood-brain barrier(GO:0014045) |
| 1.0 | 1.0 | GO:0006524 | alanine catabolic process(GO:0006524) pyruvate family amino acid catabolic process(GO:0009080) |
| 1.0 | 8.2 | GO:0060736 | prostate gland growth(GO:0060736) |
| 1.0 | 1.0 | GO:0042253 | granulocyte macrophage colony-stimulating factor biosynthetic process(GO:0042253) regulation of granulocyte macrophage colony-stimulating factor biosynthetic process(GO:0045423) |
| 1.0 | 2.0 | GO:0071873 | response to norepinephrine(GO:0071873) |
| 1.0 | 2.0 | GO:1900157 | regulation of bone mineralization involved in bone maturation(GO:1900157) |
| 1.0 | 2.0 | GO:0038128 | ERBB2 signaling pathway(GO:0038128) |
| 1.0 | 3.0 | GO:2000774 | positive regulation of cellular senescence(GO:2000774) |
| 1.0 | 4.0 | GO:0007406 | negative regulation of neuroblast proliferation(GO:0007406) |
| 1.0 | 1.0 | GO:0090135 | actin filament branching(GO:0090135) |
| 1.0 | 4.0 | GO:0048755 | branching morphogenesis of a nerve(GO:0048755) |
| 1.0 | 5.9 | GO:1900016 | negative regulation of cytokine production involved in inflammatory response(GO:1900016) |
| 1.0 | 3.0 | GO:0072318 | clathrin coat disassembly(GO:0072318) |
| 1.0 | 4.9 | GO:0043987 | histone H3-S10 phosphorylation(GO:0043987) |
| 1.0 | 2.0 | GO:0035983 | response to trichostatin A(GO:0035983) cellular response to trichostatin A(GO:0035984) |
| 1.0 | 1.9 | GO:0007638 | mechanosensory behavior(GO:0007638) |
| 1.0 | 2.9 | GO:0030432 | peristalsis(GO:0030432) |
| 1.0 | 3.8 | GO:0036289 | peptidyl-serine autophosphorylation(GO:0036289) |
| 0.9 | 2.8 | GO:0006203 | dGTP catabolic process(GO:0006203) |
| 0.9 | 17.1 | GO:0003407 | neural retina development(GO:0003407) |
| 0.9 | 3.8 | GO:0030050 | vesicle transport along actin filament(GO:0030050) |
| 0.9 | 0.9 | GO:0071692 | protein localization to extracellular region(GO:0071692) maintenance of protein location in extracellular region(GO:0071694) |
| 0.9 | 2.8 | GO:0045897 | regulation of transcription during mitosis(GO:0045896) positive regulation of transcription during mitosis(GO:0045897) |
| 0.9 | 2.8 | GO:0051541 | elastin metabolic process(GO:0051541) |
| 0.9 | 4.6 | GO:0015808 | L-alanine transport(GO:0015808) |
| 0.9 | 6.5 | GO:0048149 | behavioral response to ethanol(GO:0048149) |
| 0.9 | 3.7 | GO:0018211 | protein C-linked glycosylation(GO:0018103) peptidyl-tryptophan modification(GO:0018211) protein C-linked glycosylation via tryptophan(GO:0018317) protein C-linked glycosylation via 2'-alpha-mannosyl-L-tryptophan(GO:0018406) |
| 0.9 | 9.2 | GO:0033089 | positive regulation of T cell differentiation in thymus(GO:0033089) positive regulation of thymocyte aggregation(GO:2000400) |
| 0.9 | 1.8 | GO:0014042 | positive regulation of neuron maturation(GO:0014042) |
| 0.9 | 3.7 | GO:1904263 | positive regulation of TORC1 signaling(GO:1904263) |
| 0.9 | 2.7 | GO:2000118 | regulation of sodium-dependent phosphate transport(GO:2000118) |
| 0.9 | 3.6 | GO:0002669 | positive regulation of T cell anergy(GO:0002669) positive regulation of lymphocyte anergy(GO:0002913) |
| 0.9 | 0.9 | GO:1901859 | negative regulation of mitochondrial DNA metabolic process(GO:1901859) |
| 0.9 | 3.6 | GO:0006642 | triglyceride mobilization(GO:0006642) |
| 0.9 | 2.7 | GO:1904742 | regulation of telomeric DNA binding(GO:1904742) |
| 0.9 | 10.9 | GO:0048488 | synaptic vesicle endocytosis(GO:0048488) |
| 0.9 | 8.1 | GO:0006983 | ER overload response(GO:0006983) |
| 0.9 | 0.9 | GO:0061209 | cell proliferation involved in mesonephros development(GO:0061209) |
| 0.9 | 1.8 | GO:0097212 | lysosomal membrane organization(GO:0097212) |
| 0.9 | 2.7 | GO:0009173 | UMP biosynthetic process(GO:0006222) pyrimidine ribonucleoside monophosphate metabolic process(GO:0009173) pyrimidine ribonucleoside monophosphate biosynthetic process(GO:0009174) UMP metabolic process(GO:0046049) |
| 0.9 | 4.5 | GO:0048840 | otolith development(GO:0048840) |
| 0.9 | 5.3 | GO:0017121 | phospholipid scrambling(GO:0017121) |
| 0.9 | 3.5 | GO:0016322 | neuron remodeling(GO:0016322) |
| 0.9 | 7.9 | GO:0045779 | negative regulation of bone resorption(GO:0045779) |
| 0.9 | 2.6 | GO:0036092 | phosphatidylinositol-3-phosphate biosynthetic process(GO:0036092) |
| 0.9 | 1.7 | GO:0042538 | hyperosmotic salinity response(GO:0042538) |
| 0.9 | 0.9 | GO:0014734 | skeletal muscle hypertrophy(GO:0014734) |
| 0.9 | 1.7 | GO:0014050 | negative regulation of glutamate secretion(GO:0014050) |
| 0.9 | 4.3 | GO:2001214 | positive regulation of vasculogenesis(GO:2001214) |
| 0.9 | 14.8 | GO:0099601 | regulation of neurotransmitter receptor activity(GO:0099601) |
| 0.9 | 5.2 | GO:0035721 | intraciliary retrograde transport(GO:0035721) |
| 0.9 | 0.9 | GO:0050932 | regulation of pigment cell differentiation(GO:0050932) |
| 0.8 | 2.5 | GO:0019805 | quinolinate biosynthetic process(GO:0019805) |
| 0.8 | 3.4 | GO:0070126 | mitochondrial translational termination(GO:0070126) |
| 0.8 | 1.7 | GO:0010273 | detoxification of copper ion(GO:0010273) stress response to copper ion(GO:1990169) |
| 0.8 | 0.8 | GO:0072199 | mesenchymal cell proliferation involved in ureter development(GO:0072198) regulation of mesenchymal cell proliferation involved in ureter development(GO:0072199) |
| 0.8 | 5.7 | GO:0032308 | positive regulation of prostaglandin secretion(GO:0032308) |
| 0.8 | 1.6 | GO:2001274 | negative regulation of glucose import in response to insulin stimulus(GO:2001274) |
| 0.8 | 5.6 | GO:0015816 | glycine transport(GO:0015816) |
| 0.8 | 5.6 | GO:0048630 | skeletal muscle tissue growth(GO:0048630) |
| 0.8 | 1.6 | GO:0060449 | bud elongation involved in lung branching(GO:0060449) |
| 0.8 | 2.4 | GO:0010956 | negative regulation of calcidiol 1-monooxygenase activity(GO:0010956) |
| 0.8 | 1.6 | GO:0003348 | cardiac endothelial cell differentiation(GO:0003348) |
| 0.8 | 4.0 | GO:0021854 | hypothalamus development(GO:0021854) |
| 0.8 | 0.8 | GO:0010578 | regulation of adenylate cyclase activity involved in G-protein coupled receptor signaling pathway(GO:0010578) positive regulation of adenylate cyclase activity involved in G-protein coupled receptor signaling pathway(GO:0010579) |
| 0.8 | 1.6 | GO:0072600 | establishment of protein localization to Golgi(GO:0072600) |
| 0.8 | 0.8 | GO:0052405 | negative regulation by host of symbiont molecular function(GO:0052405) modification by host of symbiont molecular function(GO:0052428) |
| 0.8 | 1.6 | GO:2000598 | regulation of cyclin catabolic process(GO:2000598) negative regulation of cyclin catabolic process(GO:2000599) |
| 0.8 | 5.5 | GO:0003356 | regulation of cilium beat frequency(GO:0003356) |
| 0.8 | 1.6 | GO:0036493 | positive regulation of translation in response to endoplasmic reticulum stress(GO:0036493) |
| 0.8 | 4.7 | GO:0002093 | auditory receptor cell morphogenesis(GO:0002093) |
| 0.8 | 0.8 | GO:2000040 | regulation of planar cell polarity pathway involved in axis elongation(GO:2000040) negative regulation of planar cell polarity pathway involved in axis elongation(GO:2000041) |
| 0.8 | 7.0 | GO:0032119 | sequestering of zinc ion(GO:0032119) regulation of sequestering of zinc ion(GO:0061088) |
| 0.8 | 0.8 | GO:0045048 | protein insertion into ER membrane(GO:0045048) tail-anchored membrane protein insertion into ER membrane(GO:0071816) |
| 0.8 | 3.8 | GO:1901894 | regulation of calcium-transporting ATPase activity(GO:1901894) |
| 0.8 | 1.5 | GO:0061418 | regulation of transcription from RNA polymerase II promoter in response to hypoxia(GO:0061418) |
| 0.8 | 2.3 | GO:1901977 | negative regulation of cell cycle checkpoint(GO:1901977) |
| 0.8 | 2.3 | GO:0090382 | phagosome maturation(GO:0090382) |
| 0.8 | 1.5 | GO:0060024 | rhythmic synaptic transmission(GO:0060024) |
| 0.8 | 6.8 | GO:0006490 | oligosaccharide-lipid intermediate biosynthetic process(GO:0006490) |
| 0.8 | 3.0 | GO:0046784 | viral mRNA export from host cell nucleus(GO:0046784) |
| 0.8 | 3.0 | GO:0042491 | auditory receptor cell differentiation(GO:0042491) |
| 0.8 | 1.5 | GO:2000821 | regulation of grooming behavior(GO:2000821) |
| 0.7 | 3.7 | GO:0016339 | calcium-dependent cell-cell adhesion via plasma membrane cell adhesion molecules(GO:0016339) |
| 0.7 | 2.2 | GO:0090074 | negative regulation of protein homodimerization activity(GO:0090074) |
| 0.7 | 4.4 | GO:0007207 | adenylate cyclase-inhibiting G-protein coupled acetylcholine receptor signaling pathway(GO:0007197) phospholipase C-activating G-protein coupled acetylcholine receptor signaling pathway(GO:0007207) |
| 0.7 | 1.5 | GO:0099515 | actin filament-based transport(GO:0099515) |
| 0.7 | 2.2 | GO:0045200 | establishment or maintenance of neuroblast polarity(GO:0045196) establishment of neuroblast polarity(GO:0045200) |
| 0.7 | 0.7 | GO:0071673 | positive regulation of smooth muscle cell chemotaxis(GO:0071673) |
| 0.7 | 5.1 | GO:0099500 | synaptic vesicle fusion to presynaptic active zone membrane(GO:0031629) vesicle fusion to plasma membrane(GO:0099500) |
| 0.7 | 2.9 | GO:0017182 | peptidyl-diphthamide metabolic process(GO:0017182) peptidyl-diphthamide biosynthetic process from peptidyl-histidine(GO:0017183) |
| 0.7 | 2.9 | GO:0006517 | protein deglycosylation(GO:0006517) |
| 0.7 | 3.6 | GO:0016255 | attachment of GPI anchor to protein(GO:0016255) |
| 0.7 | 0.7 | GO:0036301 | macrophage colony-stimulating factor production(GO:0036301) granulocyte colony-stimulating factor production(GO:0071611) regulation of granulocyte colony-stimulating factor production(GO:0071655) regulation of macrophage colony-stimulating factor production(GO:1901256) |
| 0.7 | 2.9 | GO:0045743 | positive regulation of fibroblast growth factor receptor signaling pathway(GO:0045743) |
| 0.7 | 2.9 | GO:2000609 | regulation of thyroid hormone generation(GO:2000609) |
| 0.7 | 1.4 | GO:0072385 | minus-end-directed organelle transport along microtubule(GO:0072385) |
| 0.7 | 4.9 | GO:0007216 | G-protein coupled glutamate receptor signaling pathway(GO:0007216) |
| 0.7 | 1.4 | GO:0044034 | negative stranded viral RNA replication(GO:0039689) multi-organism biosynthetic process(GO:0044034) |
| 0.7 | 2.8 | GO:0018342 | protein prenylation(GO:0018342) prenylation(GO:0097354) |
| 0.7 | 2.1 | GO:0036506 | maintenance of unfolded protein(GO:0036506) maintenance of unfolded protein involved in ERAD pathway(GO:1904378) |
| 0.7 | 2.1 | GO:0051204 | protein insertion into mitochondrial membrane(GO:0051204) |
| 0.7 | 4.9 | GO:0006450 | regulation of translational fidelity(GO:0006450) |
| 0.7 | 2.8 | GO:1902902 | negative regulation of autophagosome assembly(GO:1902902) |
| 0.7 | 0.7 | GO:0009750 | response to fructose(GO:0009750) |
| 0.7 | 20.1 | GO:0001755 | neural crest cell migration(GO:0001755) |
| 0.7 | 1.4 | GO:0046070 | dGTP metabolic process(GO:0046070) |
| 0.7 | 4.1 | GO:0043569 | negative regulation of insulin-like growth factor receptor signaling pathway(GO:0043569) |
| 0.7 | 3.4 | GO:1901341 | activation of store-operated calcium channel activity(GO:0032237) positive regulation of store-operated calcium channel activity(GO:1901341) |
| 0.7 | 9.6 | GO:0008210 | estrogen metabolic process(GO:0008210) |
| 0.7 | 2.0 | GO:0097384 | ether lipid biosynthetic process(GO:0008611) glycerol ether biosynthetic process(GO:0046504) cellular lipid biosynthetic process(GO:0097384) ether biosynthetic process(GO:1901503) |
| 0.7 | 3.4 | GO:0031915 | positive regulation of synaptic plasticity(GO:0031915) |
| 0.7 | 2.0 | GO:0035262 | gonad morphogenesis(GO:0035262) |
| 0.7 | 2.0 | GO:0023041 | neuronal signal transduction(GO:0023041) |
| 0.7 | 0.7 | GO:0031392 | regulation of prostaglandin biosynthetic process(GO:0031392) regulation of unsaturated fatty acid biosynthetic process(GO:2001279) |
| 0.7 | 4.1 | GO:0061051 | positive regulation of cell growth involved in cardiac muscle cell development(GO:0061051) |
| 0.7 | 2.0 | GO:1904222 | regulation of CDP-diacylglycerol-serine O-phosphatidyltransferase activity(GO:1904217) positive regulation of CDP-diacylglycerol-serine O-phosphatidyltransferase activity(GO:1904219) regulation of serine C-palmitoyltransferase activity(GO:1904220) positive regulation of serine C-palmitoyltransferase activity(GO:1904222) |
| 0.7 | 23.5 | GO:0061178 | regulation of insulin secretion involved in cellular response to glucose stimulus(GO:0061178) |
| 0.7 | 8.0 | GO:0010839 | negative regulation of keratinocyte proliferation(GO:0010839) |
| 0.7 | 0.7 | GO:0035469 | determination of pancreatic left/right asymmetry(GO:0035469) |
| 0.7 | 2.7 | GO:0051823 | regulation of synapse structural plasticity(GO:0051823) |
| 0.7 | 7.3 | GO:0043496 | regulation of protein homodimerization activity(GO:0043496) |
| 0.7 | 2.0 | GO:0019478 | D-amino acid catabolic process(GO:0019478) |
| 0.7 | 0.7 | GO:0048242 | epinephrine secretion(GO:0048242) |
| 0.7 | 2.0 | GO:0051684 | maintenance of Golgi location(GO:0051684) |
| 0.7 | 0.7 | GO:2000384 | regulation of ectoderm development(GO:2000383) negative regulation of ectoderm development(GO:2000384) |
| 0.7 | 1.3 | GO:0070681 | glutaminyl-tRNAGln biosynthesis via transamidation(GO:0070681) |
| 0.6 | 2.6 | GO:1902774 | late endosome to lysosome transport(GO:1902774) |
| 0.6 | 1.3 | GO:0033326 | cerebrospinal fluid secretion(GO:0033326) |
| 0.6 | 1.3 | GO:0014724 | regulation of twitch skeletal muscle contraction(GO:0014724) |
| 0.6 | 1.9 | GO:0060839 | endothelial cell fate commitment(GO:0060839) |
| 0.6 | 10.6 | GO:0021954 | central nervous system neuron development(GO:0021954) |
| 0.6 | 1.9 | GO:0001827 | inner cell mass cell fate commitment(GO:0001827) |
| 0.6 | 5.0 | GO:0051386 | regulation of neurotrophin TRK receptor signaling pathway(GO:0051386) |
| 0.6 | 4.3 | GO:0000055 | ribosomal large subunit export from nucleus(GO:0000055) |
| 0.6 | 11.1 | GO:0007616 | long-term memory(GO:0007616) |
| 0.6 | 1.8 | GO:2001023 | regulation of response to drug(GO:2001023) |
| 0.6 | 0.6 | GO:0046668 | regulation of retinal cell programmed cell death(GO:0046668) |
| 0.6 | 15.2 | GO:0016601 | Rac protein signal transduction(GO:0016601) |
| 0.6 | 1.2 | GO:0009204 | deoxyribonucleoside triphosphate catabolic process(GO:0009204) |
| 0.6 | 1.2 | GO:0033085 | negative regulation of T cell differentiation in thymus(GO:0033085) negative regulation of thymocyte aggregation(GO:2000399) |
| 0.6 | 1.7 | GO:0071670 | smooth muscle cell chemotaxis(GO:0071670) |
| 0.6 | 1.7 | GO:0007215 | glutamate receptor signaling pathway(GO:0007215) |
| 0.6 | 0.6 | GO:0071481 | cellular response to X-ray(GO:0071481) |
| 0.6 | 1.7 | GO:0045410 | positive regulation of interleukin-6 biosynthetic process(GO:0045410) |
| 0.6 | 0.6 | GO:1903748 | negative regulation of establishment of protein localization to mitochondrion(GO:1903748) |
| 0.6 | 2.3 | GO:0051697 | protein delipidation(GO:0051697) |
| 0.6 | 3.4 | GO:0042989 | sequestering of actin monomers(GO:0042989) |
| 0.6 | 3.4 | GO:0006108 | malate metabolic process(GO:0006108) |
| 0.6 | 1.7 | GO:0009212 | dTTP biosynthetic process(GO:0006235) pyrimidine deoxyribonucleoside triphosphate biosynthetic process(GO:0009212) dTTP metabolic process(GO:0046075) |
| 0.6 | 2.2 | GO:0032516 | positive regulation of phosphoprotein phosphatase activity(GO:0032516) |
| 0.6 | 10.0 | GO:0051931 | regulation of sensory perception of pain(GO:0051930) regulation of sensory perception(GO:0051931) |
| 0.5 | 2.7 | GO:0009052 | pentose-phosphate shunt, non-oxidative branch(GO:0009052) |
| 0.5 | 1.1 | GO:1900103 | positive regulation of endoplasmic reticulum unfolded protein response(GO:1900103) |
| 0.5 | 1.1 | GO:0002322 | B cell proliferation involved in immune response(GO:0002322) |
| 0.5 | 4.4 | GO:1901409 | regulation of phosphorylation of RNA polymerase II C-terminal domain(GO:1901407) positive regulation of phosphorylation of RNA polymerase II C-terminal domain(GO:1901409) |
| 0.5 | 0.5 | GO:0090494 | catecholamine uptake(GO:0090493) dopamine uptake(GO:0090494) |
| 0.5 | 1.6 | GO:0048549 | positive regulation of pinocytosis(GO:0048549) |
| 0.5 | 4.3 | GO:0098719 | sodium ion import across plasma membrane(GO:0098719) sodium ion import into cell(GO:1990118) |
| 0.5 | 30.9 | GO:0007612 | learning(GO:0007612) |
| 0.5 | 3.2 | GO:0051451 | myoblast migration(GO:0051451) |
| 0.5 | 1.1 | GO:0050427 | 3'-phosphoadenosine 5'-phosphosulfate metabolic process(GO:0050427) |
| 0.5 | 4.8 | GO:0001710 | mesodermal cell fate commitment(GO:0001710) |
| 0.5 | 1.1 | GO:0010046 | response to mycotoxin(GO:0010046) |
| 0.5 | 0.5 | GO:0019065 | receptor-mediated endocytosis of virus by host cell(GO:0019065) endocytosis involved in viral entry into host cell(GO:0075509) |
| 0.5 | 7.4 | GO:0035855 | megakaryocyte development(GO:0035855) |
| 0.5 | 1.0 | GO:2000832 | negative regulation of steroid hormone secretion(GO:2000832) negative regulation of corticosteroid hormone secretion(GO:2000847) negative regulation of glucocorticoid secretion(GO:2000850) |
| 0.5 | 15.7 | GO:0006998 | nuclear envelope organization(GO:0006998) |
| 0.5 | 2.1 | GO:0007221 | positive regulation of transcription of Notch receptor target(GO:0007221) |
| 0.5 | 0.5 | GO:0021554 | optic nerve development(GO:0021554) |
| 0.5 | 1.5 | GO:0018002 | N-terminal peptidyl-serine acetylation(GO:0017198) N-terminal peptidyl-glutamic acid acetylation(GO:0018002) peptidyl-serine acetylation(GO:0030920) |
| 0.5 | 1.0 | GO:0035315 | hair cell differentiation(GO:0035315) |
| 0.5 | 4.5 | GO:0035428 | hexose transmembrane transport(GO:0035428) |
| 0.5 | 2.5 | GO:0018231 | peptidyl-L-cysteine S-palmitoylation(GO:0018230) peptidyl-S-diacylglycerol-L-cysteine biosynthetic process from peptidyl-cysteine(GO:0018231) |
| 0.5 | 3.5 | GO:1902018 | negative regulation of cilium assembly(GO:1902018) |
| 0.5 | 2.5 | GO:0009235 | cobalamin metabolic process(GO:0009235) |
| 0.5 | 5.9 | GO:0008045 | motor neuron axon guidance(GO:0008045) |
| 0.5 | 3.4 | GO:0097094 | craniofacial suture morphogenesis(GO:0097094) |
| 0.5 | 1.0 | GO:0097694 | establishment of RNA localization to telomere(GO:0097694) |
| 0.5 | 8.2 | GO:0032292 | myelination in peripheral nervous system(GO:0022011) peripheral nervous system axon ensheathment(GO:0032292) |
| 0.5 | 1.9 | GO:0050910 | detection of mechanical stimulus involved in sensory perception of sound(GO:0050910) |
| 0.5 | 1.4 | GO:0043615 | astrocyte cell migration(GO:0043615) |
| 0.5 | 1.9 | GO:0051481 | negative regulation of cytosolic calcium ion concentration(GO:0051481) |
| 0.5 | 1.9 | GO:0003157 | endocardium development(GO:0003157) |
| 0.5 | 1.9 | GO:0042780 | tRNA 3'-end processing(GO:0042780) |
| 0.5 | 0.9 | GO:0071288 | cellular response to mercury ion(GO:0071288) |
| 0.5 | 1.4 | GO:0048478 | replication fork protection(GO:0048478) |
| 0.5 | 0.5 | GO:0032058 | positive regulation of translation in response to stress(GO:0032056) positive regulation of translational initiation in response to stress(GO:0032058) |
| 0.5 | 1.4 | GO:0002282 | microglial cell activation involved in immune response(GO:0002282) |
| 0.5 | 0.9 | GO:1904996 | positive regulation of leukocyte adhesion to vascular endothelial cell(GO:1904996) |
| 0.5 | 0.9 | GO:0044065 | regulation of respiratory system process(GO:0044065) |
| 0.5 | 1.8 | GO:1900028 | negative regulation of ruffle assembly(GO:1900028) |
| 0.5 | 1.4 | GO:0015812 | gamma-aminobutyric acid transport(GO:0015812) |
| 0.5 | 1.4 | GO:0070120 | ciliary neurotrophic factor-mediated signaling pathway(GO:0070120) |
| 0.5 | 2.3 | GO:2000615 | regulation of histone H3-K9 acetylation(GO:2000615) |
| 0.5 | 10.0 | GO:0030204 | chondroitin sulfate metabolic process(GO:0030204) |
| 0.5 | 0.5 | GO:0051562 | negative regulation of mitochondrial calcium ion concentration(GO:0051562) |
| 0.5 | 0.9 | GO:2001206 | positive regulation of osteoclast development(GO:2001206) |
| 0.5 | 0.5 | GO:1903358 | regulation of Golgi organization(GO:1903358) |
| 0.4 | 0.9 | GO:0061046 | regulation of branching involved in lung morphogenesis(GO:0061046) |
| 0.4 | 0.4 | GO:0090360 | platelet-derived growth factor production(GO:0090360) regulation of platelet-derived growth factor production(GO:0090361) |
| 0.4 | 1.8 | GO:0060484 | lung-associated mesenchyme development(GO:0060484) |
| 0.4 | 6.7 | GO:0043268 | positive regulation of potassium ion transport(GO:0043268) |
| 0.4 | 1.3 | GO:0034085 | establishment of sister chromatid cohesion(GO:0034085) cohesin loading(GO:0071921) regulation of cohesin loading(GO:0071922) |
| 0.4 | 1.3 | GO:0034214 | protein hexamerization(GO:0034214) |
| 0.4 | 2.2 | GO:0042074 | cell migration involved in gastrulation(GO:0042074) |
| 0.4 | 1.3 | GO:0033860 | regulation of NAD(P)H oxidase activity(GO:0033860) |
| 0.4 | 3.1 | GO:0045956 | positive regulation of calcium ion-dependent exocytosis(GO:0045956) |
| 0.4 | 3.5 | GO:0043249 | erythrocyte maturation(GO:0043249) |
| 0.4 | 8.3 | GO:0006491 | N-glycan processing(GO:0006491) |
| 0.4 | 1.7 | GO:0036093 | germ cell proliferation(GO:0036093) |
| 0.4 | 1.3 | GO:0006556 | S-adenosylmethionine biosynthetic process(GO:0006556) |
| 0.4 | 1.3 | GO:0006597 | spermine biosynthetic process(GO:0006597) |
| 0.4 | 0.4 | GO:0021698 | cerebellar cortex structural organization(GO:0021698) |
| 0.4 | 1.3 | GO:0002924 | negative regulation of humoral immune response mediated by circulating immunoglobulin(GO:0002924) |
| 0.4 | 0.4 | GO:0051665 | membrane raft localization(GO:0051665) |
| 0.4 | 3.7 | GO:0021766 | hippocampus development(GO:0021766) |
| 0.4 | 5.3 | GO:0006516 | glycoprotein catabolic process(GO:0006516) |
| 0.4 | 1.2 | GO:0019276 | UDP-N-acetylgalactosamine metabolic process(GO:0019276) |
| 0.4 | 6.1 | GO:0044550 | secondary metabolite biosynthetic process(GO:0044550) |
| 0.4 | 1.2 | GO:0032914 | positive regulation of transforming growth factor beta1 production(GO:0032914) |
| 0.4 | 0.8 | GO:0060467 | negative regulation of fertilization(GO:0060467) |
| 0.4 | 1.2 | GO:0032066 | nucleolus to nucleoplasm transport(GO:0032066) |
| 0.4 | 0.4 | GO:0048842 | positive regulation of axon extension involved in axon guidance(GO:0048842) positive regulation of axon guidance(GO:1902669) |
| 0.4 | 9.1 | GO:0006270 | DNA replication initiation(GO:0006270) |
| 0.4 | 0.4 | GO:0042713 | sperm ejaculation(GO:0042713) |
| 0.4 | 2.0 | GO:0045002 | double-strand break repair via single-strand annealing(GO:0045002) |
| 0.4 | 1.2 | GO:0036444 | calcium ion transmembrane import into mitochondrion(GO:0036444) |
| 0.4 | 1.9 | GO:0010917 | negative regulation of mitochondrial membrane potential(GO:0010917) |
| 0.4 | 0.8 | GO:0048254 | snoRNA localization(GO:0048254) |
| 0.4 | 0.4 | GO:0002434 | immune complex clearance(GO:0002434) |
| 0.4 | 2.2 | GO:0051415 | interphase microtubule nucleation by interphase microtubule organizing center(GO:0051415) microtubule nucleation by microtubule organizing center(GO:0051418) |
| 0.4 | 4.4 | GO:0006895 | Golgi to endosome transport(GO:0006895) |
| 0.4 | 1.1 | GO:0060732 | positive regulation of inositol phosphate biosynthetic process(GO:0060732) |
| 0.4 | 0.7 | GO:0006015 | 5-phosphoribose 1-diphosphate biosynthetic process(GO:0006015) 5-phosphoribose 1-diphosphate metabolic process(GO:0046391) |
| 0.4 | 6.6 | GO:0032008 | positive regulation of TOR signaling(GO:0032008) |
| 0.4 | 2.5 | GO:0070570 | regulation of neuron projection regeneration(GO:0070570) |
| 0.4 | 0.4 | GO:0032252 | secretory granule localization(GO:0032252) |
| 0.4 | 5.8 | GO:0021591 | ventricular system development(GO:0021591) |
| 0.4 | 10.4 | GO:0006891 | intra-Golgi vesicle-mediated transport(GO:0006891) |
| 0.4 | 2.9 | GO:0009312 | oligosaccharide biosynthetic process(GO:0009312) |
| 0.4 | 1.4 | GO:0010499 | proteasomal ubiquitin-independent protein catabolic process(GO:0010499) |
| 0.4 | 4.7 | GO:0030497 | fatty acid elongation(GO:0030497) |
| 0.4 | 0.7 | GO:0045085 | negative regulation of interleukin-2 biosynthetic process(GO:0045085) |
| 0.4 | 1.1 | GO:0014717 | regulation of satellite cell activation involved in skeletal muscle regeneration(GO:0014717) satellite cell activation involved in skeletal muscle regeneration(GO:0014901) |
| 0.3 | 1.0 | GO:0032026 | response to magnesium ion(GO:0032026) |
| 0.3 | 0.7 | GO:0048703 | embryonic viscerocranium morphogenesis(GO:0048703) |
| 0.3 | 0.7 | GO:1902953 | positive regulation of ER to Golgi vesicle-mediated transport(GO:1902953) |
| 0.3 | 1.0 | GO:0048014 | Tie signaling pathway(GO:0048014) |
| 0.3 | 6.2 | GO:0048873 | homeostasis of number of cells within a tissue(GO:0048873) |
| 0.3 | 0.3 | GO:0032661 | regulation of interleukin-18 production(GO:0032661) |
| 0.3 | 1.3 | GO:0002423 | natural killer cell mediated cytotoxicity directed against tumor cell target(GO:0002420) natural killer cell mediated immune response to tumor cell(GO:0002423) regulation of natural killer cell mediated immune response to tumor cell(GO:0002855) regulation of natural killer cell mediated cytotoxicity directed against tumor cell target(GO:0002858) |
| 0.3 | 1.3 | GO:0070535 | histone H2A K63-linked ubiquitination(GO:0070535) |
| 0.3 | 1.3 | GO:0035995 | detection of muscle stretch(GO:0035995) |
| 0.3 | 0.7 | GO:0007442 | hindgut morphogenesis(GO:0007442) |
| 0.3 | 1.6 | GO:0097066 | response to thyroid hormone(GO:0097066) |
| 0.3 | 3.0 | GO:0051127 | positive regulation of actin nucleation(GO:0051127) |
| 0.3 | 0.7 | GO:0060307 | regulation of ventricular cardiac muscle cell membrane repolarization(GO:0060307) ventricular cardiac muscle cell membrane repolarization(GO:0099625) |
| 0.3 | 5.5 | GO:0032981 | NADH dehydrogenase complex assembly(GO:0010257) mitochondrial respiratory chain complex I assembly(GO:0032981) mitochondrial respiratory chain complex I biogenesis(GO:0097031) |
| 0.3 | 0.7 | GO:0033603 | positive regulation of dopamine secretion(GO:0033603) |
| 0.3 | 1.3 | GO:0006449 | regulation of translational termination(GO:0006449) |
| 0.3 | 0.6 | GO:1903336 | negative regulation of vacuolar transport(GO:1903336) |
| 0.3 | 0.6 | GO:0042796 | snRNA transcription from RNA polymerase III promoter(GO:0042796) |
| 0.3 | 2.6 | GO:0006183 | GTP biosynthetic process(GO:0006183) |
| 0.3 | 3.2 | GO:0003016 | respiratory system process(GO:0003016) |
| 0.3 | 2.2 | GO:0006699 | bile acid biosynthetic process(GO:0006699) |
| 0.3 | 0.3 | GO:0060013 | righting reflex(GO:0060013) |
| 0.3 | 0.9 | GO:1900368 | regulation of RNA interference(GO:1900368) |
| 0.3 | 1.3 | GO:0070125 | mitochondrial translational elongation(GO:0070125) |
| 0.3 | 0.3 | GO:0010966 | regulation of phosphate transport(GO:0010966) |
| 0.3 | 0.3 | GO:2000370 | positive regulation of clathrin-mediated endocytosis(GO:2000370) |
| 0.3 | 0.6 | GO:0060042 | retina morphogenesis in camera-type eye(GO:0060042) |
| 0.3 | 0.6 | GO:0031133 | regulation of axon diameter(GO:0031133) |
| 0.3 | 0.9 | GO:0046208 | spermine catabolic process(GO:0046208) |
| 0.3 | 1.5 | GO:0042754 | negative regulation of circadian rhythm(GO:0042754) |
| 0.3 | 2.4 | GO:1904871 | protein localization to nuclear body(GO:1903405) protein localization to Cajal body(GO:1904867) regulation of protein localization to Cajal body(GO:1904869) positive regulation of protein localization to Cajal body(GO:1904871) protein localization to nucleoplasm(GO:1990173) |
| 0.3 | 0.6 | GO:0002430 | complement receptor mediated signaling pathway(GO:0002430) |
| 0.3 | 2.1 | GO:0035773 | insulin secretion involved in cellular response to glucose stimulus(GO:0035773) |
| 0.3 | 3.5 | GO:0006359 | regulation of transcription from RNA polymerase III promoter(GO:0006359) |
| 0.3 | 1.5 | GO:1904667 | negative regulation of ubiquitin protein ligase activity(GO:1904667) |
| 0.3 | 1.7 | GO:0060294 | cilium movement involved in cell motility(GO:0060294) |
| 0.3 | 0.3 | GO:0070460 | thyroid-stimulating hormone secretion(GO:0070460) |
| 0.3 | 4.0 | GO:0060046 | regulation of acrosome reaction(GO:0060046) |
| 0.3 | 0.3 | GO:1900147 | Schwann cell migration(GO:0036135) regulation of Schwann cell migration(GO:1900147) |
| 0.3 | 0.6 | GO:0048148 | behavioral response to cocaine(GO:0048148) |
| 0.3 | 0.9 | GO:1904479 | negative regulation of intestinal absorption(GO:1904479) |
| 0.3 | 3.4 | GO:0042462 | eye photoreceptor cell development(GO:0042462) |
| 0.3 | 0.8 | GO:0051106 | regulation of DNA ligation(GO:0051105) positive regulation of DNA ligation(GO:0051106) |
| 0.3 | 2.0 | GO:0007252 | I-kappaB phosphorylation(GO:0007252) |
| 0.3 | 1.1 | GO:0051968 | positive regulation of synaptic transmission, glutamatergic(GO:0051968) |
| 0.3 | 0.8 | GO:0043382 | positive regulation of memory T cell differentiation(GO:0043382) |
| 0.3 | 0.8 | GO:0043576 | regulation of respiratory gaseous exchange(GO:0043576) |
| 0.3 | 1.8 | GO:0006120 | mitochondrial electron transport, NADH to ubiquinone(GO:0006120) |
| 0.3 | 0.8 | GO:0003032 | detection of oxygen(GO:0003032) |
| 0.3 | 0.5 | GO:0001922 | B-1 B cell homeostasis(GO:0001922) |
| 0.3 | 0.3 | GO:1903659 | regulation of complement-dependent cytotoxicity(GO:1903659) negative regulation of complement-dependent cytotoxicity(GO:1903660) |
| 0.2 | 0.7 | GO:2001271 | negative regulation of cysteine-type endopeptidase activity involved in execution phase of apoptosis(GO:2001271) |
| 0.2 | 1.0 | GO:0042473 | outer ear morphogenesis(GO:0042473) |
| 0.2 | 4.6 | GO:0086010 | membrane depolarization during action potential(GO:0086010) |
| 0.2 | 0.5 | GO:0097527 | necroptotic signaling pathway(GO:0097527) |
| 0.2 | 0.7 | GO:1902308 | regulation of peptidyl-serine dephosphorylation(GO:1902308) |
| 0.2 | 1.7 | GO:0072505 | divalent inorganic anion homeostasis(GO:0072505) |
| 0.2 | 0.7 | GO:0009233 | menaquinone metabolic process(GO:0009233) |
| 0.2 | 0.7 | GO:0006551 | leucine metabolic process(GO:0006551) |
| 0.2 | 0.2 | GO:0060051 | negative regulation of protein glycosylation(GO:0060051) |
| 0.2 | 18.5 | GO:0071805 | potassium ion transmembrane transport(GO:0071805) |
| 0.2 | 0.5 | GO:0060012 | synaptic transmission, glycinergic(GO:0060012) |
| 0.2 | 0.5 | GO:1901858 | regulation of mitochondrial DNA metabolic process(GO:1901858) |
| 0.2 | 0.5 | GO:0044341 | sodium-dependent phosphate transport(GO:0044341) |
| 0.2 | 1.6 | GO:0018026 | peptidyl-lysine monomethylation(GO:0018026) |
| 0.2 | 1.1 | GO:0090080 | positive regulation of MAPKKK cascade by fibroblast growth factor receptor signaling pathway(GO:0090080) |
| 0.2 | 0.9 | GO:0071043 | CUT catabolic process(GO:0071034) CUT metabolic process(GO:0071043) |
| 0.2 | 0.6 | GO:0006269 | DNA replication, synthesis of RNA primer(GO:0006269) |
| 0.2 | 0.2 | GO:0042420 | dopamine catabolic process(GO:0042420) |
| 0.2 | 0.2 | GO:0060762 | regulation of branching involved in mammary gland duct morphogenesis(GO:0060762) |
| 0.2 | 0.6 | GO:0070427 | nucleotide-binding oligomerization domain containing 1 signaling pathway(GO:0070427) |
| 0.2 | 0.2 | GO:0002408 | myeloid dendritic cell chemotaxis(GO:0002408) |
| 0.2 | 1.2 | GO:0061158 | 3'-UTR-mediated mRNA destabilization(GO:0061158) |
| 0.2 | 0.8 | GO:0034773 | histone H4-K20 trimethylation(GO:0034773) |
| 0.2 | 0.2 | GO:0003057 | regulation of the force of heart contraction by chemical signal(GO:0003057) |
| 0.2 | 0.6 | GO:0060316 | positive regulation of ryanodine-sensitive calcium-release channel activity(GO:0060316) |
| 0.2 | 0.6 | GO:0022417 | protein maturation by protein folding(GO:0022417) |
| 0.2 | 0.8 | GO:0070257 | positive regulation of mucus secretion(GO:0070257) |
| 0.2 | 0.6 | GO:1900273 | positive regulation of long-term synaptic potentiation(GO:1900273) |
| 0.2 | 0.6 | GO:0060011 | Sertoli cell proliferation(GO:0060011) |
| 0.2 | 0.2 | GO:2000664 | positive regulation of interleukin-5 secretion(GO:2000664) positive regulation of interleukin-13 secretion(GO:2000667) |
| 0.2 | 1.1 | GO:0031119 | tRNA pseudouridine synthesis(GO:0031119) |
| 0.2 | 0.2 | GO:0045356 | positive regulation of interferon-alpha biosynthetic process(GO:0045356) |
| 0.2 | 0.2 | GO:0060447 | bud outgrowth involved in lung branching(GO:0060447) |
| 0.2 | 2.2 | GO:0042149 | cellular response to glucose starvation(GO:0042149) |
| 0.2 | 0.5 | GO:0000733 | DNA strand renaturation(GO:0000733) |
| 0.2 | 0.5 | GO:0061370 | testosterone biosynthetic process(GO:0061370) |
| 0.2 | 0.2 | GO:0061091 | regulation of phospholipid translocation(GO:0061091) positive regulation of phospholipid translocation(GO:0061092) |
| 0.2 | 0.5 | GO:0000492 | small nucleolar ribonucleoprotein complex assembly(GO:0000491) box C/D snoRNP assembly(GO:0000492) |
| 0.2 | 0.4 | GO:0030382 | sperm mitochondrion organization(GO:0030382) |
| 0.2 | 2.5 | GO:0034587 | piRNA metabolic process(GO:0034587) |
| 0.2 | 0.5 | GO:0048550 | negative regulation of pinocytosis(GO:0048550) |
| 0.2 | 0.5 | GO:0051790 | short-chain fatty acid biosynthetic process(GO:0051790) |
| 0.2 | 1.2 | GO:0001542 | ovulation from ovarian follicle(GO:0001542) |
| 0.2 | 0.2 | GO:0030421 | defecation(GO:0030421) |
| 0.2 | 2.8 | GO:0007029 | endoplasmic reticulum organization(GO:0007029) |
| 0.2 | 4.1 | GO:0007019 | microtubule depolymerization(GO:0007019) |
| 0.2 | 0.2 | GO:1903975 | regulation of glial cell migration(GO:1903975) |
| 0.2 | 1.5 | GO:0007076 | mitotic chromosome condensation(GO:0007076) |
| 0.2 | 1.2 | GO:0006610 | ribosomal protein import into nucleus(GO:0006610) |
| 0.2 | 4.5 | GO:0006958 | complement activation, classical pathway(GO:0006958) |
| 0.1 | 0.7 | GO:0071044 | histone mRNA catabolic process(GO:0071044) |
| 0.1 | 1.2 | GO:0034497 | protein localization to pre-autophagosomal structure(GO:0034497) |
| 0.1 | 2.0 | GO:0097352 | autophagosome maturation(GO:0097352) |
| 0.1 | 0.1 | GO:0071866 | regulation of apoptotic process in bone marrow(GO:0071865) negative regulation of apoptotic process in bone marrow(GO:0071866) |
| 0.1 | 0.8 | GO:0009143 | nucleoside triphosphate catabolic process(GO:0009143) |
| 0.1 | 0.4 | GO:0090283 | regulation of protein glycosylation in Golgi(GO:0090283) |
| 0.1 | 0.5 | GO:0046113 | nucleobase catabolic process(GO:0046113) |
| 0.1 | 0.4 | GO:0006435 | threonyl-tRNA aminoacylation(GO:0006435) |
| 0.1 | 0.4 | GO:0039530 | MDA-5 signaling pathway(GO:0039530) |
| 0.1 | 0.4 | GO:0006420 | arginyl-tRNA aminoacylation(GO:0006420) |
| 0.1 | 4.0 | GO:0007040 | lysosome organization(GO:0007040) lytic vacuole organization(GO:0080171) |
| 0.1 | 0.6 | GO:0072540 | T-helper 17 cell lineage commitment(GO:0072540) |
| 0.1 | 2.1 | GO:0010259 | multicellular organism aging(GO:0010259) |
| 0.1 | 0.1 | GO:1902445 | regulation of mitochondrial membrane permeability involved in programmed necrotic cell death(GO:1902445) |
| 0.1 | 0.3 | GO:0007089 | traversing start control point of mitotic cell cycle(GO:0007089) |
| 0.1 | 2.6 | GO:0006813 | potassium ion transport(GO:0006813) |
| 0.1 | 0.1 | GO:0009189 | dUDP biosynthetic process(GO:0006227) pyrimidine nucleoside diphosphate biosynthetic process(GO:0009139) deoxyribonucleoside diphosphate biosynthetic process(GO:0009189) pyrimidine deoxyribonucleoside diphosphate metabolic process(GO:0009196) pyrimidine deoxyribonucleoside diphosphate biosynthetic process(GO:0009197) dUDP metabolic process(GO:0046077) |
| 0.1 | 0.1 | GO:0071280 | cellular response to copper ion(GO:0071280) |
| 0.1 | 0.2 | GO:1901724 | positive regulation of cell proliferation involved in kidney development(GO:1901724) |
| 0.1 | 0.1 | GO:0010919 | regulation of inositol phosphate biosynthetic process(GO:0010919) |
| 0.1 | 0.4 | GO:0072161 | mesenchymal cell differentiation involved in kidney development(GO:0072161) mesenchymal cell differentiation involved in renal system development(GO:2001012) |
| 0.1 | 0.7 | GO:0016074 | snoRNA metabolic process(GO:0016074) |
| 0.1 | 0.3 | GO:0002254 | kinin cascade(GO:0002254) |
| 0.1 | 0.7 | GO:0048245 | eosinophil chemotaxis(GO:0048245) |
| 0.1 | 0.2 | GO:0036481 | intrinsic apoptotic signaling pathway in response to hydrogen peroxide(GO:0036481) |
| 0.1 | 0.2 | GO:0009448 | gamma-aminobutyric acid metabolic process(GO:0009448) |
| 0.1 | 0.1 | GO:0060315 | negative regulation of ryanodine-sensitive calcium-release channel activity(GO:0060315) |
| 0.1 | 0.2 | GO:1903441 | protein localization to ciliary membrane(GO:1903441) |
| 0.1 | 1.6 | GO:0071108 | protein K48-linked deubiquitination(GO:0071108) |
| 0.1 | 0.2 | GO:0070973 | protein localization to endoplasmic reticulum exit site(GO:0070973) |
| 0.1 | 0.7 | GO:0002089 | lens morphogenesis in camera-type eye(GO:0002089) |
| 0.1 | 0.2 | GO:0019086 | late viral transcription(GO:0019086) |
| 0.1 | 0.7 | GO:0006032 | chitin metabolic process(GO:0006030) chitin catabolic process(GO:0006032) |
| 0.1 | 0.3 | GO:2000676 | positive regulation of type B pancreatic cell apoptotic process(GO:2000676) |
| 0.1 | 0.3 | GO:0016338 | calcium-independent cell-cell adhesion via plasma membrane cell-adhesion molecules(GO:0016338) |
| 0.1 | 0.4 | GO:2000060 | positive regulation of protein ubiquitination involved in ubiquitin-dependent protein catabolic process(GO:2000060) |
| 0.1 | 0.2 | GO:0007210 | serotonin receptor signaling pathway(GO:0007210) |
| 0.1 | 0.2 | GO:0010624 | regulation of Schwann cell proliferation(GO:0010624) negative regulation of Schwann cell proliferation(GO:0010626) |
| 0.1 | 0.8 | GO:0043552 | positive regulation of phosphatidylinositol 3-kinase activity(GO:0043552) |
| 0.1 | 0.2 | GO:0042795 | snRNA transcription from RNA polymerase II promoter(GO:0042795) |
| 0.1 | 1.2 | GO:0007528 | neuromuscular junction development(GO:0007528) |
| 0.1 | 0.5 | GO:0007253 | cytoplasmic sequestering of NF-kappaB(GO:0007253) |
| 0.1 | 0.1 | GO:0008090 | retrograde axonal transport(GO:0008090) |
| 0.1 | 0.2 | GO:0072695 | negative regulation of DNA recombination at telomere(GO:0048239) regulation of DNA recombination at telomere(GO:0072695) |
| 0.1 | 0.2 | GO:2000209 | regulation of anoikis(GO:2000209) |
| 0.1 | 0.3 | GO:0080009 | mRNA methylation(GO:0080009) |
| 0.1 | 0.1 | GO:0016560 | protein import into peroxisome matrix, docking(GO:0016560) |
| 0.1 | 0.1 | GO:0035523 | protein K29-linked deubiquitination(GO:0035523) protein K33-linked deubiquitination(GO:1990168) |
| 0.1 | 0.4 | GO:0051703 | social behavior(GO:0035176) intraspecies interaction between organisms(GO:0051703) |
| 0.1 | 0.2 | GO:0006659 | phosphatidylserine biosynthetic process(GO:0006659) |
| 0.1 | 0.1 | GO:0009301 | snRNA transcription(GO:0009301) |
| 0.1 | 0.2 | GO:0010796 | regulation of multivesicular body size(GO:0010796) |
| 0.1 | 0.1 | GO:0002949 | tRNA threonylcarbamoyladenosine modification(GO:0002949) |
| 0.1 | 0.2 | GO:0070863 | positive regulation of protein exit from endoplasmic reticulum(GO:0070863) |
| 0.1 | 0.3 | GO:0017196 | N-terminal peptidyl-methionine acetylation(GO:0017196) |
| 0.1 | 0.2 | GO:0070268 | cornification(GO:0070268) |
| 0.1 | 0.1 | GO:1902744 | negative regulation of lamellipodium organization(GO:1902744) |
| 0.1 | 0.1 | GO:0061309 | cardiac neural crest cell development involved in outflow tract morphogenesis(GO:0061309) |
| 0.1 | 0.1 | GO:0010446 | response to alkaline pH(GO:0010446) |
| 0.0 | 0.0 | GO:0018364 | peptidyl-glutamine methylation(GO:0018364) |
| 0.0 | 0.4 | GO:0060122 | inner ear receptor stereocilium organization(GO:0060122) |
| 0.0 | 0.1 | GO:0043562 | cellular response to nitrogen starvation(GO:0006995) cellular response to nitrogen levels(GO:0043562) |
| 0.0 | 0.1 | GO:0060004 | reflex(GO:0060004) |
| 0.0 | 0.1 | GO:0042276 | error-prone translesion synthesis(GO:0042276) |
| 0.0 | 0.0 | GO:0060830 | ciliary receptor clustering involved in smoothened signaling pathway(GO:0060830) |
| 0.0 | 0.2 | GO:0001867 | complement activation, lectin pathway(GO:0001867) |
| 0.0 | 0.0 | GO:2000381 | negative regulation of mesoderm development(GO:2000381) |
| 0.0 | 0.0 | GO:0038001 | paracrine signaling(GO:0038001) |
| 0.0 | 0.2 | GO:0046348 | amino sugar catabolic process(GO:0046348) |
| 0.0 | 0.0 | GO:1902630 | regulation of membrane hyperpolarization(GO:1902630) |
| 0.0 | 0.4 | GO:0010758 | regulation of macrophage chemotaxis(GO:0010758) |
| 0.0 | 0.2 | GO:0097240 | meiotic telomere tethering at nuclear periphery(GO:0044821) meiotic attachment of telomere to nuclear envelope(GO:0070197) chromosome attachment to the nuclear envelope(GO:0097240) |
| 0.0 | 0.3 | GO:0006123 | mitochondrial electron transport, cytochrome c to oxygen(GO:0006123) |
| 0.0 | 1.3 | GO:0050911 | detection of chemical stimulus involved in sensory perception of smell(GO:0050911) |
| 0.0 | 0.2 | GO:2000001 | regulation of DNA damage checkpoint(GO:2000001) |
| 0.0 | 0.2 | GO:0016973 | poly(A)+ mRNA export from nucleus(GO:0016973) |
| 0.0 | 0.0 | GO:0033083 | regulation of immature T cell proliferation(GO:0033083) |
| 0.0 | 0.1 | GO:1903333 | negative regulation of protein folding(GO:1903333) |
| 0.0 | 0.2 | GO:0003376 | sphingosine-1-phosphate signaling pathway(GO:0003376) |
| 0.0 | 0.1 | GO:0042760 | very long-chain fatty acid catabolic process(GO:0042760) |
| 0.0 | 0.1 | GO:0010613 | positive regulation of cardiac muscle hypertrophy(GO:0010613) positive regulation of muscle hypertrophy(GO:0014742) |
| 0.0 | 0.0 | GO:0018171 | peptidyl-cysteine oxidation(GO:0018171) |
| 0.0 | 0.0 | GO:0006598 | polyamine catabolic process(GO:0006598) |
| 0.0 | 0.0 | GO:0006241 | CTP biosynthetic process(GO:0006241) CTP metabolic process(GO:0046036) |
| 0.0 | 0.0 | GO:0070601 | centromeric sister chromatid cohesion(GO:0070601) |
| 0.0 | 0.0 | GO:0016188 | synaptic vesicle maturation(GO:0016188) |
| 0.0 | 0.0 | GO:0060054 | positive regulation of epithelial cell proliferation involved in wound healing(GO:0060054) |
Gene overrepresentation in cellular component category:
| Log-likelihood per target | Total log-likelihood | Term | Description |
|---|---|---|---|
| 13.6 | 40.7 | GO:0014701 | junctional sarcoplasmic reticulum membrane(GO:0014701) |
| 8.1 | 8.1 | GO:0038037 | G-protein coupled receptor dimeric complex(GO:0038037) G-protein coupled receptor complex(GO:0097648) |
| 7.7 | 77.2 | GO:0044224 | juxtaparanode region of axon(GO:0044224) |
| 7.2 | 50.7 | GO:0030285 | integral component of synaptic vesicle membrane(GO:0030285) intrinsic component of synaptic vesicle membrane(GO:0098563) |
| 7.2 | 35.8 | GO:0097433 | dense body(GO:0097433) |
| 7.1 | 42.4 | GO:0016012 | sarcoglycan complex(GO:0016012) |
| 5.7 | 22.9 | GO:0033010 | paranodal junction(GO:0033010) |
| 5.1 | 15.3 | GO:0072534 | perineuronal net(GO:0072534) |
| 4.9 | 24.6 | GO:0032983 | kainate selective glutamate receptor complex(GO:0032983) |
| 4.9 | 14.6 | GO:1990761 | growth cone lamellipodium(GO:1990761) |
| 4.7 | 51.9 | GO:0043194 | axon initial segment(GO:0043194) |
| 4.7 | 23.4 | GO:0044294 | dendritic growth cone(GO:0044294) |
| 4.3 | 59.9 | GO:0043196 | varicosity(GO:0043196) |
| 4.2 | 63.1 | GO:0048786 | presynaptic active zone(GO:0048786) |
| 4.1 | 99.2 | GO:0044295 | axonal growth cone(GO:0044295) |
| 4.0 | 36.2 | GO:0032045 | guanyl-nucleotide exchange factor complex(GO:0032045) |
| 4.0 | 32.0 | GO:0042788 | polysomal ribosome(GO:0042788) |
| 3.9 | 15.6 | GO:1990696 | USH2 complex(GO:1990696) |
| 3.9 | 19.4 | GO:0044300 | cerebellar mossy fiber(GO:0044300) |
| 3.5 | 173.9 | GO:0042734 | presynaptic membrane(GO:0042734) |
| 3.5 | 35.1 | GO:0030673 | axolemma(GO:0030673) |
| 3.3 | 19.6 | GO:0032584 | growth cone membrane(GO:0032584) |
| 3.2 | 22.7 | GO:0036056 | filtration diaphragm(GO:0036056) slit diaphragm(GO:0036057) |
| 3.1 | 9.4 | GO:0097441 | basilar dendrite(GO:0097441) |
| 3.1 | 34.2 | GO:0032426 | stereocilium tip(GO:0032426) |
| 3.1 | 18.4 | GO:1990454 | L-type voltage-gated calcium channel complex(GO:1990454) |
| 3.1 | 12.2 | GO:0045009 | melanosome membrane(GO:0033162) chitosome(GO:0045009) |
| 2.8 | 8.4 | GO:0048179 | activin receptor complex(GO:0048179) |
| 2.8 | 11.0 | GO:0044322 | endoplasmic reticulum quality control compartment(GO:0044322) |
| 2.7 | 8.2 | GO:0031233 | intrinsic component of external side of plasma membrane(GO:0031233) |
| 2.6 | 5.1 | GO:0070044 | synaptobrevin 2-SNAP-25-syntaxin-1a complex(GO:0070044) |
| 2.6 | 10.3 | GO:0031466 | Cul5-RING ubiquitin ligase complex(GO:0031466) |
| 2.5 | 7.6 | GO:0000015 | phosphopyruvate hydratase complex(GO:0000015) |
| 2.5 | 2.5 | GO:0070033 | synaptobrevin 2-SNAP-25-syntaxin-1a-complexin II complex(GO:0070033) |
| 2.4 | 16.8 | GO:0035253 | ciliary rootlet(GO:0035253) |
| 2.3 | 9.3 | GO:0043083 | synaptic cleft(GO:0043083) |
| 2.3 | 9.3 | GO:0005968 | Rab-protein geranylgeranyltransferase complex(GO:0005968) |
| 2.3 | 30.1 | GO:0031045 | dense core granule(GO:0031045) |
| 2.2 | 4.5 | GO:0097025 | MPP7-DLG1-LIN7 complex(GO:0097025) |
| 2.2 | 8.8 | GO:1990851 | Wnt-Frizzled-LRP5/6 complex(GO:1990851) |
| 2.1 | 6.2 | GO:0033269 | internode region of axon(GO:0033269) |
| 2.0 | 2.0 | GO:0034666 | integrin alpha2-beta1 complex(GO:0034666) |
| 2.0 | 7.9 | GO:1990131 | EGO complex(GO:0034448) Gtr1-Gtr2 GTPase complex(GO:1990131) |
| 2.0 | 50.8 | GO:0032281 | AMPA glutamate receptor complex(GO:0032281) |
| 1.9 | 76.2 | GO:0043198 | dendritic shaft(GO:0043198) |
| 1.8 | 5.4 | GO:0005658 | alpha DNA polymerase:primase complex(GO:0005658) |
| 1.8 | 28.1 | GO:1902711 | GABA receptor complex(GO:1902710) GABA-A receptor complex(GO:1902711) |
| 1.7 | 5.0 | GO:0000836 | ER ubiquitin ligase complex(GO:0000835) Hrd1p ubiquitin ligase complex(GO:0000836) |
| 1.7 | 18.3 | GO:0043656 | host cell cytoplasm(GO:0030430) host intracellular part(GO:0033646) host cell cytoplasm part(GO:0033655) intracellular region of host(GO:0043656) |
| 1.7 | 5.0 | GO:0009331 | glycerol-3-phosphate dehydrogenase complex(GO:0009331) |
| 1.6 | 9.6 | GO:0071437 | invadopodium(GO:0071437) |
| 1.6 | 17.6 | GO:0042555 | MCM complex(GO:0042555) |
| 1.6 | 4.8 | GO:0005594 | collagen type IX trimer(GO:0005594) |
| 1.6 | 1.6 | GO:0035867 | alphav-beta3 integrin-IGF-1-IGF1R complex(GO:0035867) |
| 1.5 | 12.1 | GO:0045254 | pyruvate dehydrogenase complex(GO:0045254) |
| 1.4 | 4.3 | GO:0030289 | protein phosphatase 4 complex(GO:0030289) |
| 1.4 | 2.9 | GO:0044326 | dendritic spine neck(GO:0044326) |
| 1.4 | 7.0 | GO:0005672 | transcription factor TFIIA complex(GO:0005672) |
| 1.4 | 7.0 | GO:0032009 | early phagosome(GO:0032009) |
| 1.4 | 4.2 | GO:0032937 | SREBP-SCAP-Insig complex(GO:0032937) |
| 1.4 | 5.5 | GO:0005947 | mitochondrial alpha-ketoglutarate dehydrogenase complex(GO:0005947) |
| 1.3 | 7.7 | GO:0016010 | dystrophin-associated glycoprotein complex(GO:0016010) glycoprotein complex(GO:0090665) |
| 1.3 | 7.5 | GO:0035032 | phosphatidylinositol 3-kinase complex, class III(GO:0035032) |
| 1.3 | 11.3 | GO:0030061 | mitochondrial crista(GO:0030061) |
| 1.2 | 17.4 | GO:0031527 | filopodium membrane(GO:0031527) |
| 1.2 | 1.2 | GO:0070110 | ciliary neurotrophic factor receptor complex(GO:0070110) |
| 1.2 | 12.3 | GO:0001518 | voltage-gated sodium channel complex(GO:0001518) |
| 1.2 | 12.1 | GO:0060077 | inhibitory synapse(GO:0060077) |
| 1.1 | 6.8 | GO:0001674 | female germ cell nucleus(GO:0001674) |
| 1.1 | 4.4 | GO:1990716 | axonemal central apparatus(GO:1990716) |
| 1.1 | 102.3 | GO:0045211 | postsynaptic membrane(GO:0045211) |
| 1.1 | 16.5 | GO:0032809 | neuronal cell body membrane(GO:0032809) |
| 1.1 | 62.6 | GO:0008076 | voltage-gated potassium channel complex(GO:0008076) |
| 1.1 | 8.7 | GO:0030991 | intraciliary transport particle A(GO:0030991) |
| 1.1 | 161.4 | GO:0060076 | excitatory synapse(GO:0060076) |
| 1.1 | 2.1 | GO:0032280 | symmetric synapse(GO:0032280) |
| 1.0 | 1.0 | GO:0044615 | nuclear pore nuclear basket(GO:0044615) |
| 1.0 | 23.3 | GO:0005891 | voltage-gated calcium channel complex(GO:0005891) |
| 1.0 | 4.0 | GO:0051286 | cell tip(GO:0051286) |
| 1.0 | 4.0 | GO:0016602 | CCAAT-binding factor complex(GO:0016602) |
| 1.0 | 58.6 | GO:0031463 | Cul3-RING ubiquitin ligase complex(GO:0031463) |
| 0.9 | 5.6 | GO:0097449 | astrocyte projection(GO:0097449) |
| 0.9 | 2.8 | GO:1990075 | periciliary membrane compartment(GO:1990075) |
| 0.9 | 5.1 | GO:0005890 | sodium:potassium-exchanging ATPase complex(GO:0005890) |
| 0.9 | 2.6 | GO:0055087 | Ski complex(GO:0055087) |
| 0.8 | 1.6 | GO:0033263 | CORVET complex(GO:0033263) |
| 0.8 | 4.0 | GO:0045098 | type III intermediate filament(GO:0045098) |
| 0.8 | 2.4 | GO:0070939 | Dsl1p complex(GO:0070939) |
| 0.8 | 2.3 | GO:0008275 | gamma-tubulin small complex(GO:0008275) |
| 0.8 | 0.8 | GO:0072558 | NLRP1 inflammasome complex(GO:0072558) |
| 0.8 | 2.3 | GO:0016600 | flotillin complex(GO:0016600) |
| 0.8 | 8.3 | GO:0017119 | Golgi transport complex(GO:0017119) |
| 0.7 | 3.6 | GO:0042765 | GPI-anchor transamidase complex(GO:0042765) |
| 0.7 | 14.6 | GO:0044447 | axoneme part(GO:0044447) |
| 0.7 | 3.5 | GO:0033588 | Elongator holoenzyme complex(GO:0033588) |
| 0.7 | 0.7 | GO:0005593 | FACIT collagen trimer(GO:0005593) |
| 0.6 | 1.9 | GO:0032299 | ribonuclease H2 complex(GO:0032299) |
| 0.6 | 1.3 | GO:0097169 | AIM2 inflammasome complex(GO:0097169) |
| 0.6 | 1.9 | GO:0005899 | insulin receptor complex(GO:0005899) |
| 0.6 | 84.5 | GO:0031225 | anchored component of membrane(GO:0031225) |
| 0.6 | 1.8 | GO:0097504 | Gemini of coiled bodies(GO:0097504) |
| 0.6 | 1.8 | GO:0097427 | microtubule bundle(GO:0097427) |
| 0.6 | 3.6 | GO:0000445 | THO complex(GO:0000347) THO complex part of transcription export complex(GO:0000445) |
| 0.6 | 28.0 | GO:0008021 | synaptic vesicle(GO:0008021) |
| 0.6 | 13.6 | GO:0034451 | centriolar satellite(GO:0034451) |
| 0.6 | 7.0 | GO:0043240 | Fanconi anaemia nuclear complex(GO:0043240) |
| 0.6 | 2.8 | GO:0000796 | condensin complex(GO:0000796) |
| 0.6 | 6.1 | GO:0042405 | nuclear inclusion body(GO:0042405) |
| 0.5 | 2.2 | GO:0070695 | FHF complex(GO:0070695) |
| 0.5 | 0.5 | GO:0044393 | microspike(GO:0044393) |
| 0.5 | 6.5 | GO:0005847 | mRNA cleavage and polyadenylation specificity factor complex(GO:0005847) |
| 0.5 | 12.5 | GO:0032420 | stereocilium(GO:0032420) |
| 0.5 | 6.3 | GO:0031597 | cytosolic proteasome complex(GO:0031597) |
| 0.5 | 4.6 | GO:0002116 | semaphorin receptor complex(GO:0002116) |
| 0.5 | 5.3 | GO:0030123 | AP-3 adaptor complex(GO:0030123) |
| 0.5 | 0.9 | GO:0071797 | LUBAC complex(GO:0071797) |
| 0.5 | 2.3 | GO:0061617 | MICOS complex(GO:0061617) |
| 0.5 | 0.9 | GO:0005892 | acetylcholine-gated channel complex(GO:0005892) |
| 0.4 | 2.7 | GO:0090571 | RNA polymerase II transcription repressor complex(GO:0090571) |
| 0.4 | 24.5 | GO:0043195 | terminal bouton(GO:0043195) |
| 0.4 | 1.3 | GO:1990909 | Wnt signalosome(GO:1990909) |
| 0.4 | 1.3 | GO:0005958 | DNA-dependent protein kinase-DNA ligase 4 complex(GO:0005958) |
| 0.4 | 7.3 | GO:0005868 | cytoplasmic dynein complex(GO:0005868) |
| 0.4 | 0.9 | GO:0044462 | cell outer membrane(GO:0009279) cell envelope(GO:0030313) external encapsulating structure part(GO:0044462) |
| 0.4 | 10.2 | GO:0032391 | photoreceptor connecting cilium(GO:0032391) |
| 0.4 | 1.6 | GO:1990246 | uniplex complex(GO:1990246) |
| 0.4 | 6.4 | GO:0042101 | T cell receptor complex(GO:0042101) |
| 0.4 | 5.5 | GO:0070382 | exocytic vesicle(GO:0070382) |
| 0.4 | 60.7 | GO:0030424 | axon(GO:0030424) |
| 0.4 | 2.3 | GO:0071986 | Ragulator complex(GO:0071986) |
| 0.4 | 4.1 | GO:0045277 | respiratory chain complex IV(GO:0045277) |
| 0.4 | 0.4 | GO:0044299 | C-fiber(GO:0044299) |
| 0.4 | 4.9 | GO:0070822 | Sin3-type complex(GO:0070822) |
| 0.4 | 1.1 | GO:0002193 | MAML1-RBP-Jkappa- ICN1 complex(GO:0002193) |
| 0.4 | 2.2 | GO:0031415 | NatA complex(GO:0031415) |
| 0.4 | 11.9 | GO:0098794 | postsynapse(GO:0098794) |
| 0.4 | 22.7 | GO:0030426 | growth cone(GO:0030426) |
| 0.4 | 1.1 | GO:1990130 | Iml1 complex(GO:1990130) |
| 0.3 | 3.1 | GO:0005832 | chaperonin-containing T-complex(GO:0005832) |
| 0.3 | 0.7 | GO:1990923 | PET complex(GO:1990923) |
| 0.3 | 9.0 | GO:0005763 | organellar small ribosomal subunit(GO:0000314) mitochondrial small ribosomal subunit(GO:0005763) |
| 0.3 | 1.0 | GO:0005863 | striated muscle myosin thick filament(GO:0005863) |
| 0.3 | 1.0 | GO:0032541 | cortical endoplasmic reticulum(GO:0032541) |
| 0.3 | 0.9 | GO:0043511 | inhibin complex(GO:0043511) |
| 0.3 | 33.2 | GO:0035068 | micro-ribonucleoprotein complex(GO:0035068) |
| 0.3 | 1.9 | GO:0000137 | Golgi cis cisterna(GO:0000137) |
| 0.3 | 23.3 | GO:0043025 | neuronal cell body(GO:0043025) |
| 0.3 | 0.9 | GO:0043293 | apoptosome(GO:0043293) |
| 0.3 | 2.6 | GO:0008074 | guanylate cyclase complex, soluble(GO:0008074) |
| 0.3 | 3.1 | GO:0035631 | CD40 receptor complex(GO:0035631) |
| 0.3 | 1.9 | GO:0017101 | aminoacyl-tRNA synthetase multienzyme complex(GO:0017101) |
| 0.3 | 1.9 | GO:0000808 | origin recognition complex(GO:0000808) nuclear origin of replication recognition complex(GO:0005664) |
| 0.3 | 8.0 | GO:0000307 | cyclin-dependent protein kinase holoenzyme complex(GO:0000307) |
| 0.3 | 9.1 | GO:0005871 | kinesin complex(GO:0005871) |
| 0.2 | 0.7 | GO:0042583 | chromaffin granule(GO:0042583) |
| 0.2 | 0.7 | GO:0097543 | ciliary inversin compartment(GO:0097543) |
| 0.2 | 0.9 | GO:0071546 | pi-body(GO:0071546) |
| 0.2 | 1.1 | GO:0031428 | box C/D snoRNP complex(GO:0031428) |
| 0.2 | 0.4 | GO:0020018 | ciliary pocket(GO:0020016) ciliary pocket membrane(GO:0020018) |
| 0.2 | 0.6 | GO:0000802 | transverse filament(GO:0000802) |
| 0.2 | 1.5 | GO:0033180 | proton-transporting V-type ATPase, V1 domain(GO:0033180) |
| 0.2 | 1.0 | GO:0071547 | piP-body(GO:0071547) |
| 0.2 | 1.2 | GO:0002177 | manchette(GO:0002177) |
| 0.2 | 1.4 | GO:0097546 | ciliary base(GO:0097546) |
| 0.2 | 0.7 | GO:0044530 | supraspliceosomal complex(GO:0044530) |
| 0.2 | 0.7 | GO:0005784 | Sec61 translocon complex(GO:0005784) translocon complex(GO:0071256) |
| 0.2 | 0.5 | GO:0030689 | Noc complex(GO:0030689) |
| 0.2 | 0.5 | GO:0000931 | gamma-tubulin large complex(GO:0000931) gamma-tubulin ring complex(GO:0008274) |
| 0.2 | 0.2 | GO:0097386 | glial cell projection(GO:0097386) |
| 0.1 | 0.4 | GO:0008290 | F-actin capping protein complex(GO:0008290) |
| 0.1 | 1.2 | GO:0043020 | NADPH oxidase complex(GO:0043020) |
| 0.1 | 0.7 | GO:0030877 | beta-catenin destruction complex(GO:0030877) |
| 0.1 | 0.7 | GO:0005849 | mRNA cleavage factor complex(GO:0005849) |
| 0.1 | 1.8 | GO:0030914 | STAGA complex(GO:0030914) |
| 0.1 | 8.0 | GO:0022625 | cytosolic large ribosomal subunit(GO:0022625) |
| 0.1 | 6.6 | GO:0005791 | rough endoplasmic reticulum(GO:0005791) |
| 0.1 | 1.1 | GO:0000778 | condensed nuclear chromosome kinetochore(GO:0000778) |
| 0.1 | 0.6 | GO:0070531 | BRCA1-A complex(GO:0070531) |
| 0.1 | 0.7 | GO:0005859 | muscle myosin complex(GO:0005859) |
| 0.1 | 0.6 | GO:0033063 | Rad51B-Rad51C-Rad51D-XRCC2 complex(GO:0033063) |
| 0.1 | 1.2 | GO:0005687 | U4 snRNP(GO:0005687) |
| 0.1 | 0.8 | GO:0071014 | post-mRNA release spliceosomal complex(GO:0071014) |
| 0.1 | 0.3 | GO:0070688 | MLL5-L complex(GO:0070688) |
| 0.1 | 0.2 | GO:0005642 | annulate lamellae(GO:0005642) |
| 0.1 | 0.7 | GO:0005885 | Arp2/3 protein complex(GO:0005885) |
| 0.1 | 0.1 | GO:0010009 | cytoplasmic side of endosome membrane(GO:0010009) |
| 0.1 | 0.9 | GO:0072546 | ER membrane protein complex(GO:0072546) |
| 0.1 | 0.2 | GO:0017071 | intracellular cyclic nucleotide activated cation channel complex(GO:0017071) |
| 0.1 | 0.5 | GO:0005869 | dynactin complex(GO:0005869) |
| 0.1 | 0.5 | GO:0031512 | motile primary cilium(GO:0031512) |
| 0.1 | 0.3 | GO:0044292 | dendrite terminus(GO:0044292) |
| 0.1 | 1.3 | GO:0048770 | melanosome(GO:0042470) pigment granule(GO:0048770) |
| 0.1 | 0.6 | GO:0098793 | presynapse(GO:0098793) |
| 0.1 | 2.6 | GO:0045271 | mitochondrial respiratory chain complex I(GO:0005747) NADH dehydrogenase complex(GO:0030964) respiratory chain complex I(GO:0045271) |
| 0.1 | 0.4 | GO:0016593 | Cdc73/Paf1 complex(GO:0016593) |
| 0.1 | 0.5 | GO:0061700 | GATOR2 complex(GO:0061700) |
| 0.1 | 0.3 | GO:0070545 | PeBoW complex(GO:0070545) |
| 0.1 | 0.4 | GO:0034719 | SMN-Sm protein complex(GO:0034719) |
| 0.1 | 0.3 | GO:0072357 | PTW/PP1 phosphatase complex(GO:0072357) |
| 0.1 | 1.1 | GO:0005839 | proteasome core complex(GO:0005839) |
| 0.1 | 0.4 | GO:0045239 | tricarboxylic acid cycle enzyme complex(GO:0045239) |
| 0.1 | 0.2 | GO:0042719 | mitochondrial intermembrane space protein transporter complex(GO:0042719) |
| 0.0 | 0.0 | GO:0000923 | equatorial microtubule organizing center(GO:0000923) |
| 0.0 | 0.1 | GO:0033553 | rDNA heterochromatin(GO:0033553) |
| 0.0 | 0.1 | GO:0071817 | MMXD complex(GO:0071817) |
| 0.0 | 1.8 | GO:0005643 | nuclear pore(GO:0005643) |
| 0.0 | 0.1 | GO:0002079 | inner acrosomal membrane(GO:0002079) |
| 0.0 | 0.2 | GO:0000124 | SAGA complex(GO:0000124) |
| 0.0 | 0.1 | GO:0034518 | mRNA cap binding complex(GO:0005845) RNA cap binding complex(GO:0034518) |
| 0.0 | 0.1 | GO:0042571 | immunoglobulin complex, circulating(GO:0042571) |
| 0.0 | 4.2 | GO:0043005 | neuron projection(GO:0043005) |
Gene overrepresentation in molecular function category:
| Log-likelihood per target | Total log-likelihood | Term | Description |
|---|---|---|---|
| 36.8 | 110.4 | GO:0005519 | cytoskeletal regulatory protein binding(GO:0005519) |
| 15.5 | 46.6 | GO:0097109 | neuroligin family protein binding(GO:0097109) |
| 10.5 | 31.5 | GO:0015142 | citrate transmembrane transporter activity(GO:0015137) tricarboxylic acid transmembrane transporter activity(GO:0015142) |
| 10.0 | 30.0 | GO:0070699 | type II activin receptor binding(GO:0070699) |
| 9.9 | 49.5 | GO:0044323 | retinoic acid-responsive element binding(GO:0044323) |
| 9.2 | 36.7 | GO:0035727 | lysophosphatidic acid binding(GO:0035727) |
| 8.9 | 26.8 | GO:0005176 | ErbB-2 class receptor binding(GO:0005176) |
| 8.7 | 26.0 | GO:0048101 | calcium- and calmodulin-regulated 3',5'-cyclic-GMP phosphodiesterase activity(GO:0048101) |
| 8.2 | 24.7 | GO:0008503 | benzodiazepine receptor activity(GO:0008503) |
| 7.4 | 22.2 | GO:0015183 | L-aspartate transmembrane transporter activity(GO:0015183) |
| 7.3 | 36.6 | GO:0015277 | kainate selective glutamate receptor activity(GO:0015277) |
| 7.2 | 28.9 | GO:0005332 | gamma-aminobutyric acid:sodium symporter activity(GO:0005332) |
| 7.2 | 36.0 | GO:0086080 | protein binding involved in heterotypic cell-cell adhesion(GO:0086080) |
| 7.0 | 21.1 | GO:0004505 | phenylalanine 4-monooxygenase activity(GO:0004505) |
| 6.6 | 26.3 | GO:0032051 | clathrin light chain binding(GO:0032051) |
| 6.3 | 44.1 | GO:0005004 | GPI-linked ephrin receptor activity(GO:0005004) |
| 6.0 | 6.0 | GO:0005219 | ryanodine-sensitive calcium-release channel activity(GO:0005219) calcium-induced calcium release activity(GO:0048763) |
| 5.8 | 17.5 | GO:0004351 | glutamate decarboxylase activity(GO:0004351) |
| 5.7 | 17.2 | GO:0050816 | phosphothreonine binding(GO:0050816) |
| 5.5 | 21.8 | GO:0005025 | transforming growth factor beta receptor activity, type I(GO:0005025) |
| 5.1 | 20.5 | GO:0008502 | melatonin receptor activity(GO:0008502) |
| 5.0 | 15.1 | GO:0004739 | pyruvate dehydrogenase (acetyl-transferring) activity(GO:0004739) |
| 4.9 | 34.3 | GO:0008046 | axon guidance receptor activity(GO:0008046) |
| 4.9 | 43.7 | GO:0001091 | RNA polymerase II basal transcription factor binding(GO:0001091) |
| 4.5 | 31.6 | GO:0003680 | AT DNA binding(GO:0003680) |
| 4.4 | 13.3 | GO:0097108 | hedgehog family protein binding(GO:0097108) |
| 4.4 | 8.7 | GO:0045503 | dynein light chain binding(GO:0045503) |
| 4.2 | 25.4 | GO:0001640 | adenylate cyclase inhibiting G-protein coupled glutamate receptor activity(GO:0001640) |
| 4.2 | 38.0 | GO:0001206 | transcriptional repressor activity, RNA polymerase II distal enhancer sequence-specific binding(GO:0001206) |
| 4.1 | 12.2 | GO:0030158 | protein xylosyltransferase activity(GO:0030158) |
| 4.0 | 23.9 | GO:0004385 | guanylate kinase activity(GO:0004385) |
| 3.8 | 7.7 | GO:0098988 | G-protein coupled glutamate receptor activity(GO:0098988) |
| 3.6 | 10.8 | GO:0015018 | galactosylgalactosylxylosylprotein 3-beta-glucuronosyltransferase activity(GO:0015018) |
| 3.5 | 10.4 | GO:0016842 | amidine-lyase activity(GO:0016842) |
| 3.4 | 3.4 | GO:0015185 | gamma-aminobutyric acid transmembrane transporter activity(GO:0015185) |
| 3.4 | 6.8 | GO:0019871 | sodium channel inhibitor activity(GO:0019871) |
| 3.3 | 20.0 | GO:0016933 | extracellular-glycine-gated ion channel activity(GO:0016933) extracellular-glycine-gated chloride channel activity(GO:0016934) |
| 3.3 | 13.2 | GO:0004566 | beta-glucuronidase activity(GO:0004566) |
| 3.3 | 13.1 | GO:0015016 | [heparan sulfate]-glucosamine N-sulfotransferase activity(GO:0015016) |
| 3.3 | 16.3 | GO:0003828 | alpha-N-acetylneuraminate alpha-2,8-sialyltransferase activity(GO:0003828) |
| 3.1 | 43.7 | GO:0008179 | adenylate cyclase binding(GO:0008179) |
| 3.1 | 18.6 | GO:0034190 | apolipoprotein receptor binding(GO:0034190) |
| 3.1 | 12.4 | GO:0016714 | oxidoreductase activity, acting on paired donors, with incorporation or reduction of molecular oxygen, reduced pteridine as one donor, and incorporation of one atom of oxygen(GO:0016714) |
| 2.9 | 8.8 | GO:0050833 | pyruvate transmembrane transporter activity(GO:0050833) |
| 2.9 | 8.7 | GO:0004965 | G-protein coupled GABA receptor activity(GO:0004965) |
| 2.8 | 24.9 | GO:0005313 | L-glutamate transmembrane transporter activity(GO:0005313) acidic amino acid transmembrane transporter activity(GO:0015172) |
| 2.7 | 13.7 | GO:0004634 | phosphopyruvate hydratase activity(GO:0004634) |
| 2.7 | 8.2 | GO:0016015 | morphogen activity(GO:0016015) |
| 2.7 | 2.7 | GO:0030350 | iron-responsive element binding(GO:0030350) |
| 2.7 | 10.7 | GO:0015467 | G-protein activated inward rectifier potassium channel activity(GO:0015467) |
| 2.7 | 18.7 | GO:0031821 | G-protein coupled serotonin receptor binding(GO:0031821) |
| 2.7 | 8.0 | GO:0004427 | inorganic diphosphatase activity(GO:0004427) |
| 2.6 | 13.2 | GO:0004826 | phenylalanine-tRNA ligase activity(GO:0004826) |
| 2.6 | 15.8 | GO:0043140 | ATP-dependent 3'-5' DNA helicase activity(GO:0043140) |
| 2.5 | 7.5 | GO:0008184 | glycogen phosphorylase activity(GO:0008184) |
| 2.5 | 47.4 | GO:0017075 | syntaxin-1 binding(GO:0017075) |
| 2.5 | 9.9 | GO:0005042 | netrin receptor activity(GO:0005042) |
| 2.5 | 9.8 | GO:0070878 | primary miRNA binding(GO:0070878) |
| 2.4 | 56.1 | GO:0045499 | chemorepellent activity(GO:0045499) |
| 2.4 | 4.8 | GO:0035373 | chondroitin sulfate proteoglycan binding(GO:0035373) |
| 2.4 | 14.4 | GO:0016421 | CoA carboxylase activity(GO:0016421) |
| 2.4 | 7.1 | GO:0015222 | serotonin transmembrane transporter activity(GO:0015222) |
| 2.4 | 9.4 | GO:0005250 | A-type (transient outward) potassium channel activity(GO:0005250) |
| 2.3 | 18.8 | GO:0015271 | outward rectifier potassium channel activity(GO:0015271) |
| 2.3 | 11.6 | GO:0004690 | cyclic nucleotide-dependent protein kinase activity(GO:0004690) |
| 2.3 | 4.6 | GO:0004971 | AMPA glutamate receptor activity(GO:0004971) |
| 2.3 | 11.5 | GO:0008467 | [heparan sulfate]-glucosamine 3-sulfotransferase 1 activity(GO:0008467) |
| 2.3 | 9.0 | GO:0005095 | GTPase inhibitor activity(GO:0005095) |
| 2.2 | 6.7 | GO:0016647 | oxidoreductase activity, acting on the CH-NH group of donors, oxygen as acceptor(GO:0016647) |
| 2.1 | 25.4 | GO:0050811 | GABA receptor binding(GO:0050811) |
| 2.1 | 48.6 | GO:0004181 | metallocarboxypeptidase activity(GO:0004181) |
| 2.1 | 14.5 | GO:0046790 | virion binding(GO:0046790) |
| 2.1 | 4.1 | GO:0097016 | L27 domain binding(GO:0097016) |
| 2.0 | 8.1 | GO:0015349 | thyroid hormone transmembrane transporter activity(GO:0015349) |
| 2.0 | 6.0 | GO:0001075 | transcription factor activity, RNA polymerase II core promoter sequence-specific binding involved in preinitiation complex assembly(GO:0001075) |
| 2.0 | 10.0 | GO:0000268 | peroxisome targeting sequence binding(GO:0000268) |
| 1.9 | 9.6 | GO:0048495 | Roundabout binding(GO:0048495) |
| 1.9 | 5.7 | GO:0005483 | soluble NSF attachment protein activity(GO:0005483) |
| 1.9 | 5.7 | GO:0004937 | alpha1-adrenergic receptor activity(GO:0004937) |
| 1.9 | 9.5 | GO:0070883 | pre-miRNA binding(GO:0070883) |
| 1.9 | 7.5 | GO:0015272 | ATP-activated inward rectifier potassium channel activity(GO:0015272) |
| 1.8 | 7.3 | GO:0043262 | adenosine-diphosphatase activity(GO:0043262) |
| 1.8 | 10.6 | GO:0004128 | cytochrome-b5 reductase activity, acting on NAD(P)H(GO:0004128) |
| 1.7 | 19.1 | GO:0016909 | JUN kinase activity(GO:0004705) SAP kinase activity(GO:0016909) |
| 1.7 | 8.6 | GO:0005432 | calcium:sodium antiporter activity(GO:0005432) |
| 1.7 | 6.8 | GO:0070579 | methylcytosine dioxygenase activity(GO:0070579) |
| 1.7 | 6.8 | GO:1904288 | BAT3 complex binding(GO:1904288) |
| 1.7 | 8.5 | GO:0005283 | sodium:amino acid symporter activity(GO:0005283) |
| 1.7 | 6.8 | GO:0016901 | oxidoreductase activity, acting on the CH-OH group of donors, quinone or similar compound as acceptor(GO:0016901) |
| 1.6 | 3.3 | GO:0043125 | ErbB-3 class receptor binding(GO:0043125) |
| 1.6 | 31.2 | GO:0003950 | NAD+ ADP-ribosyltransferase activity(GO:0003950) |
| 1.6 | 32.7 | GO:0003785 | actin monomer binding(GO:0003785) |
| 1.6 | 6.5 | GO:0031694 | alpha-2A adrenergic receptor binding(GO:0031694) |
| 1.6 | 4.9 | GO:0051880 | G-quadruplex DNA binding(GO:0051880) |
| 1.6 | 1.6 | GO:0038191 | neuropilin binding(GO:0038191) |
| 1.6 | 1.6 | GO:0047023 | androsterone dehydrogenase activity(GO:0047023) |
| 1.6 | 9.3 | GO:0001588 | dopamine neurotransmitter receptor activity, coupled via Gs(GO:0001588) |
| 1.5 | 17.0 | GO:0017065 | single-strand selective uracil DNA N-glycosylase activity(GO:0017065) nicotinamide riboside hydrolase activity(GO:0070635) nicotinic acid riboside hydrolase activity(GO:0070636) deoxyribonucleoside 5'-monophosphate N-glycosidase activity(GO:0070694) |
| 1.5 | 18.4 | GO:0004000 | adenosine deaminase activity(GO:0004000) |
| 1.5 | 21.5 | GO:0045295 | gamma-catenin binding(GO:0045295) |
| 1.5 | 4.6 | GO:0008309 | double-stranded DNA exodeoxyribonuclease activity(GO:0008309) |
| 1.5 | 4.5 | GO:0043423 | 3-phosphoinositide-dependent protein kinase binding(GO:0043423) |
| 1.5 | 8.7 | GO:0032027 | myosin light chain binding(GO:0032027) |
| 1.4 | 29.0 | GO:0080025 | phosphatidylinositol-3,5-bisphosphate binding(GO:0080025) |
| 1.4 | 5.8 | GO:0004127 | cytidylate kinase activity(GO:0004127) |
| 1.4 | 7.1 | GO:0004565 | beta-galactosidase activity(GO:0004565) |
| 1.4 | 14.1 | GO:0008066 | glutamate receptor activity(GO:0008066) |
| 1.4 | 7.1 | GO:0000155 | phosphorelay sensor kinase activity(GO:0000155) |
| 1.4 | 5.6 | GO:0016286 | small conductance calcium-activated potassium channel activity(GO:0016286) |
| 1.4 | 5.6 | GO:0097001 | ceramide binding(GO:0097001) |
| 1.4 | 1.4 | GO:0003905 | alkylbase DNA N-glycosylase activity(GO:0003905) DNA-3-methylbase glycosylase activity(GO:0043733) |
| 1.4 | 8.3 | GO:0015198 | oligopeptide transporter activity(GO:0015198) |
| 1.4 | 5.5 | GO:0015173 | aromatic amino acid transmembrane transporter activity(GO:0015173) |
| 1.4 | 2.7 | GO:0016361 | activin receptor activity, type I(GO:0016361) |
| 1.4 | 1.4 | GO:0005502 | 11-cis retinal binding(GO:0005502) |
| 1.3 | 12.1 | GO:0016920 | pyroglutamyl-peptidase activity(GO:0016920) |
| 1.3 | 13.4 | GO:0005041 | low-density lipoprotein receptor activity(GO:0005041) |
| 1.3 | 2.7 | GO:0000099 | sulfur amino acid transmembrane transporter activity(GO:0000099) |
| 1.3 | 4.0 | GO:0003987 | acetate-CoA ligase activity(GO:0003987) |
| 1.3 | 18.1 | GO:0016500 | protein-hormone receptor activity(GO:0016500) |
| 1.3 | 17.8 | GO:0004890 | GABA-A receptor activity(GO:0004890) |
| 1.3 | 19.0 | GO:0016863 | intramolecular oxidoreductase activity, transposing C=C bonds(GO:0016863) |
| 1.3 | 3.8 | GO:0019166 | trans-2-enoyl-CoA reductase (NADPH) activity(GO:0019166) |
| 1.3 | 18.8 | GO:0016805 | dipeptidase activity(GO:0016805) |
| 1.3 | 7.5 | GO:0032050 | clathrin heavy chain binding(GO:0032050) |
| 1.2 | 2.5 | GO:0008240 | tripeptidyl-peptidase activity(GO:0008240) |
| 1.2 | 3.7 | GO:0004471 | malic enzyme activity(GO:0004470) malate dehydrogenase (decarboxylating) (NAD+) activity(GO:0004471) |
| 1.2 | 9.6 | GO:0016861 | intramolecular oxidoreductase activity, interconverting aldoses and ketoses(GO:0016861) |
| 1.2 | 5.9 | GO:0042609 | CD4 receptor binding(GO:0042609) |
| 1.2 | 23.5 | GO:0005540 | hyaluronic acid binding(GO:0005540) |
| 1.2 | 20.8 | GO:0071837 | HMG box domain binding(GO:0071837) |
| 1.1 | 6.9 | GO:0046974 | histone methyltransferase activity (H3-K9 specific)(GO:0046974) |
| 1.1 | 4.6 | GO:0043495 | protein anchor(GO:0043495) |
| 1.1 | 3.4 | GO:0004980 | melanocyte-stimulating hormone receptor activity(GO:0004980) |
| 1.1 | 1.1 | GO:0016880 | acid-ammonia (or amide) ligase activity(GO:0016880) |
| 1.1 | 21.0 | GO:0042813 | Wnt-activated receptor activity(GO:0042813) |
| 1.1 | 2.2 | GO:0005030 | neurotrophin receptor activity(GO:0005030) |
| 1.1 | 3.3 | GO:0017162 | aryl hydrocarbon receptor binding(GO:0017162) |
| 1.1 | 4.3 | GO:0052832 | inositol monophosphate 1-phosphatase activity(GO:0008934) inositol monophosphate 3-phosphatase activity(GO:0052832) inositol monophosphate 4-phosphatase activity(GO:0052833) inositol monophosphate phosphatase activity(GO:0052834) |
| 1.1 | 18.4 | GO:0008157 | protein phosphatase 1 binding(GO:0008157) |
| 1.1 | 10.8 | GO:0004983 | neuropeptide Y receptor activity(GO:0004983) |
| 1.1 | 32.8 | GO:0070888 | E-box binding(GO:0070888) |
| 1.1 | 3.2 | GO:0035939 | microsatellite binding(GO:0035939) |
| 1.0 | 2.1 | GO:0098632 | protein binding involved in cell-cell adhesion(GO:0098632) |
| 1.0 | 8.3 | GO:0009931 | calcium-dependent protein serine/threonine kinase activity(GO:0009931) |
| 1.0 | 5.1 | GO:0002054 | nucleobase binding(GO:0002054) |
| 1.0 | 6.2 | GO:0016624 | oxidoreductase activity, acting on the aldehyde or oxo group of donors, disulfide as acceptor(GO:0016624) |
| 1.0 | 3.9 | GO:0033142 | progesterone receptor binding(GO:0033142) |
| 1.0 | 2.9 | GO:0035650 | AP-1 adaptor complex binding(GO:0035650) |
| 1.0 | 24.3 | GO:0005251 | delayed rectifier potassium channel activity(GO:0005251) |
| 1.0 | 13.6 | GO:0017128 | phospholipid scramblase activity(GO:0017128) |
| 1.0 | 1.0 | GO:0048408 | epidermal growth factor binding(GO:0048408) |
| 1.0 | 1.0 | GO:0070991 | medium-chain-acyl-CoA dehydrogenase activity(GO:0070991) |
| 1.0 | 2.9 | GO:0016149 | translation release factor activity, codon specific(GO:0016149) |
| 1.0 | 8.6 | GO:0005068 | transmembrane receptor protein tyrosine kinase adaptor activity(GO:0005068) |
| 0.9 | 19.0 | GO:0030332 | cyclin binding(GO:0030332) |
| 0.9 | 4.7 | GO:0005167 | neurotrophin TRK receptor binding(GO:0005167) |
| 0.9 | 2.8 | GO:0000403 | Y-form DNA binding(GO:0000403) |
| 0.9 | 6.5 | GO:0032454 | histone demethylase activity (H3-K9 specific)(GO:0032454) |
| 0.9 | 2.8 | GO:0030899 | calcium-dependent ATPase activity(GO:0030899) |
| 0.9 | 1.8 | GO:1990430 | extracellular matrix protein binding(GO:1990430) |
| 0.9 | 5.4 | GO:0004716 | receptor signaling protein tyrosine kinase activity(GO:0004716) |
| 0.9 | 1.8 | GO:0086008 | voltage-gated potassium channel activity involved in cardiac muscle cell action potential repolarization(GO:0086008) |
| 0.9 | 4.4 | GO:0035184 | histone threonine kinase activity(GO:0035184) |
| 0.9 | 3.5 | GO:1990932 | 5.8S rRNA binding(GO:1990932) |
| 0.9 | 5.3 | GO:0035242 | protein-arginine omega-N asymmetric methyltransferase activity(GO:0035242) |
| 0.9 | 19.2 | GO:0015347 | sodium-independent organic anion transmembrane transporter activity(GO:0015347) |
| 0.9 | 11.2 | GO:0030676 | Rac guanyl-nucleotide exchange factor activity(GO:0030676) |
| 0.9 | 29.9 | GO:0017095 | N-acetylglucosamine 6-O-sulfotransferase activity(GO:0001517) heparan sulfate 2-O-sulfotransferase activity(GO:0004394) HNK-1 sulfotransferase activity(GO:0016232) heparan sulfate 6-O-sulfotransferase activity(GO:0017095) trans-9R,10R-dihydrodiolphenanthrene sulfotransferase activity(GO:0018721) 1-phenanthrol sulfotransferase activity(GO:0018722) 3-phenanthrol sulfotransferase activity(GO:0018723) 4-phenanthrol sulfotransferase activity(GO:0018724) trans-3,4-dihydrodiolphenanthrene sulfotransferase activity(GO:0018725) 9-phenanthrol sulfotransferase activity(GO:0018726) 2-phenanthrol sulfotransferase activity(GO:0018727) phenanthrol sulfotransferase activity(GO:0019111) 1-hydroxypyrene sulfotransferase activity(GO:0034930) proteoglycan sulfotransferase activity(GO:0050698) cholesterol sulfotransferase activity(GO:0051922) hydroxyjasmonate sulfotransferase activity(GO:0080131) |
| 0.9 | 9.4 | GO:0035255 | ionotropic glutamate receptor binding(GO:0035255) |
| 0.8 | 3.4 | GO:0034235 | GPI anchor binding(GO:0034235) |
| 0.8 | 5.9 | GO:0001162 | RNA polymerase II intronic transcription regulatory region sequence-specific DNA binding(GO:0001162) |
| 0.8 | 10.0 | GO:0035198 | miRNA binding(GO:0035198) |
| 0.8 | 14.6 | GO:0031420 | alkali metal ion binding(GO:0031420) |
| 0.8 | 2.4 | GO:0005148 | prolactin receptor binding(GO:0005148) |
| 0.8 | 5.6 | GO:0008239 | dipeptidyl-peptidase activity(GO:0008239) |
| 0.8 | 10.4 | GO:0008553 | hydrogen-exporting ATPase activity, phosphorylative mechanism(GO:0008553) |
| 0.8 | 3.9 | GO:0004985 | opioid receptor activity(GO:0004985) |
| 0.8 | 1.6 | GO:0050309 | glucose-6-phosphatase activity(GO:0004346) sugar-terminal-phosphatase activity(GO:0050309) |
| 0.8 | 2.3 | GO:0051425 | PTB domain binding(GO:0051425) |
| 0.8 | 6.3 | GO:0008113 | peptide-methionine (S)-S-oxide reductase activity(GO:0008113) |
| 0.8 | 8.5 | GO:0008331 | high voltage-gated calcium channel activity(GO:0008331) |
| 0.8 | 16.2 | GO:0005537 | mannose binding(GO:0005537) |
| 0.8 | 12.3 | GO:0015035 | protein disulfide oxidoreductase activity(GO:0015035) |
| 0.8 | 1.5 | GO:0004703 | G-protein coupled receptor kinase activity(GO:0004703) |
| 0.7 | 10.5 | GO:0004993 | G-protein coupled serotonin receptor activity(GO:0004993) serotonin receptor activity(GO:0099589) |
| 0.7 | 1.5 | GO:0004999 | vasoactive intestinal polypeptide receptor activity(GO:0004999) |
| 0.7 | 4.3 | GO:0004908 | interleukin-1 receptor activity(GO:0004908) |
| 0.7 | 10.8 | GO:0004653 | polypeptide N-acetylgalactosaminyltransferase activity(GO:0004653) |
| 0.7 | 3.6 | GO:0070728 | leucine binding(GO:0070728) |
| 0.7 | 7.8 | GO:0070016 | armadillo repeat domain binding(GO:0070016) |
| 0.7 | 5.6 | GO:0005452 | inorganic anion exchanger activity(GO:0005452) |
| 0.7 | 3.4 | GO:0018812 | 3-hydroxyacyl-CoA dehydratase activity(GO:0018812) |
| 0.7 | 3.3 | GO:0001515 | opioid peptide activity(GO:0001515) |
| 0.7 | 2.0 | GO:0004833 | tryptophan 2,3-dioxygenase activity(GO:0004833) |
| 0.7 | 2.7 | GO:0016174 | NAD(P)H oxidase activity(GO:0016174) |
| 0.7 | 14.6 | GO:0017091 | AU-rich element binding(GO:0017091) |
| 0.7 | 8.6 | GO:0008413 | 8-oxo-7,8-dihydroguanosine triphosphate pyrophosphatase activity(GO:0008413) |
| 0.6 | 3.2 | GO:0036310 | annealing helicase activity(GO:0036310) |
| 0.6 | 2.5 | GO:0004969 | histamine receptor activity(GO:0004969) |
| 0.6 | 0.6 | GO:0098748 | clathrin adaptor activity(GO:0035615) endocytic adaptor activity(GO:0098748) |
| 0.6 | 1.2 | GO:0016262 | protein N-acetylglucosaminyltransferase activity(GO:0016262) |
| 0.6 | 3.1 | GO:0051428 | peptide hormone receptor binding(GO:0051428) |
| 0.6 | 2.4 | GO:0016907 | G-protein coupled acetylcholine receptor activity(GO:0016907) |
| 0.6 | 1.2 | GO:0004376 | glycolipid mannosyltransferase activity(GO:0004376) |
| 0.6 | 1.8 | GO:0016882 | cyclo-ligase activity(GO:0016882) |
| 0.6 | 1.8 | GO:0016716 | oxidoreductase activity, acting on paired donors, with incorporation or reduction of molecular oxygen, another compound as one donor, and incorporation of one atom of oxygen(GO:0016716) |
| 0.6 | 16.5 | GO:0015459 | potassium channel regulator activity(GO:0015459) |
| 0.6 | 5.3 | GO:0008568 | microtubule-severing ATPase activity(GO:0008568) |
| 0.6 | 1.7 | GO:0043546 | molybdopterin cofactor binding(GO:0043546) |
| 0.6 | 1.7 | GO:0004359 | glutaminase activity(GO:0004359) |
| 0.6 | 1.7 | GO:0098821 | BMP receptor activity(GO:0098821) |
| 0.6 | 2.8 | GO:0008559 | xenobiotic-transporting ATPase activity(GO:0008559) |
| 0.6 | 5.0 | GO:0030159 | receptor signaling complex scaffold activity(GO:0030159) |
| 0.6 | 16.5 | GO:0005245 | voltage-gated calcium channel activity(GO:0005245) |
| 0.5 | 5.5 | GO:0004143 | diacylglycerol kinase activity(GO:0004143) |
| 0.5 | 10.9 | GO:0043395 | heparan sulfate proteoglycan binding(GO:0043395) |
| 0.5 | 1.6 | GO:0061629 | RNA polymerase II sequence-specific DNA binding transcription factor binding(GO:0061629) |
| 0.5 | 11.7 | GO:0005385 | zinc ion transmembrane transporter activity(GO:0005385) |
| 0.5 | 10.0 | GO:0030742 | GTP-dependent protein binding(GO:0030742) |
| 0.5 | 5.8 | GO:0031404 | chloride ion binding(GO:0031404) |
| 0.5 | 1.5 | GO:1990189 | peptide-serine-N-acetyltransferase activity(GO:1990189) peptide-glutamate-N-acetyltransferase activity(GO:1990190) |
| 0.5 | 14.0 | GO:0019894 | kinesin binding(GO:0019894) |
| 0.5 | 2.4 | GO:0030250 | cyclase activator activity(GO:0010853) guanylate cyclase activator activity(GO:0030250) |
| 0.5 | 2.8 | GO:0048531 | beta-1,3-galactosyltransferase activity(GO:0048531) |
| 0.5 | 1.4 | GO:0008310 | single-stranded DNA 3'-5' exodeoxyribonuclease activity(GO:0008310) |
| 0.5 | 1.4 | GO:0031735 | CCR10 chemokine receptor binding(GO:0031735) |
| 0.5 | 0.9 | GO:0035851 | Krueppel-associated box domain binding(GO:0035851) |
| 0.5 | 0.5 | GO:0070915 | lysophosphatidic acid receptor activity(GO:0070915) |
| 0.5 | 0.5 | GO:0036435 | K48-linked polyubiquitin binding(GO:0036435) |
| 0.4 | 1.3 | GO:0050508 | glucuronosyl-N-acetylglucosaminyl-proteoglycan 4-alpha-N-acetylglucosaminyltransferase activity(GO:0050508) |
| 0.4 | 1.3 | GO:0004942 | anaphylatoxin receptor activity(GO:0004942) |
| 0.4 | 1.8 | GO:0043842 | Kdo transferase activity(GO:0043842) |
| 0.4 | 1.3 | GO:0032190 | acrosin binding(GO:0032190) |
| 0.4 | 7.8 | GO:0008235 | metalloexopeptidase activity(GO:0008235) |
| 0.4 | 4.7 | GO:0031005 | filamin binding(GO:0031005) |
| 0.4 | 2.1 | GO:0008556 | potassium-transporting ATPase activity(GO:0008556) |
| 0.4 | 1.3 | GO:0030144 | alpha-1,6-mannosylglycoprotein 6-beta-N-acetylglucosaminyltransferase activity(GO:0030144) |
| 0.4 | 0.4 | GO:0004731 | purine-nucleoside phosphorylase activity(GO:0004731) |
| 0.4 | 2.9 | GO:0004534 | 5'-3' exoribonuclease activity(GO:0004534) |
| 0.4 | 4.2 | GO:0042043 | neurexin family protein binding(GO:0042043) |
| 0.4 | 2.1 | GO:0071723 | lipopeptide binding(GO:0071723) |
| 0.4 | 1.7 | GO:0004488 | methylenetetrahydrofolate dehydrogenase (NADP+) activity(GO:0004488) |
| 0.4 | 1.2 | GO:0071074 | eukaryotic initiation factor eIF2 binding(GO:0071074) |
| 0.4 | 0.8 | GO:0030297 | transmembrane receptor protein tyrosine kinase activator activity(GO:0030297) |
| 0.4 | 4.7 | GO:0015279 | store-operated calcium channel activity(GO:0015279) |
| 0.4 | 2.4 | GO:0019957 | C-C chemokine binding(GO:0019957) |
| 0.4 | 1.6 | GO:0031544 | peptidyl-proline 3-dioxygenase activity(GO:0031544) |
| 0.4 | 1.2 | GO:0089720 | caspase binding(GO:0089720) |
| 0.4 | 5.4 | GO:0022842 | leak channel activity(GO:0022840) narrow pore channel activity(GO:0022842) |
| 0.4 | 3.5 | GO:0098599 | palmitoyl-(protein) hydrolase activity(GO:0008474) palmitoyl hydrolase activity(GO:0098599) |
| 0.4 | 0.4 | GO:0004367 | glycerol-3-phosphate dehydrogenase [NAD+] activity(GO:0004367) |
| 0.4 | 1.9 | GO:0008454 | alpha-1,3-mannosylglycoprotein 4-beta-N-acetylglucosaminyltransferase activity(GO:0008454) |
| 0.4 | 1.5 | GO:0036137 | kynurenine-oxoglutarate transaminase activity(GO:0016212) kynurenine aminotransferase activity(GO:0036137) |
| 0.4 | 3.7 | GO:0016655 | oxidoreductase activity, acting on NAD(P)H, quinone or similar compound as acceptor(GO:0016655) |
| 0.4 | 1.5 | GO:0004035 | alkaline phosphatase activity(GO:0004035) |
| 0.4 | 1.4 | GO:0004849 | uridine kinase activity(GO:0004849) |
| 0.4 | 6.9 | GO:0046875 | ephrin receptor binding(GO:0046875) |
| 0.4 | 1.4 | GO:0034056 | estrogen response element binding(GO:0034056) |
| 0.4 | 12.5 | GO:0051018 | protein kinase A binding(GO:0051018) |
| 0.4 | 1.8 | GO:0019784 | NEDD8-specific protease activity(GO:0019784) |
| 0.4 | 1.1 | GO:0097506 | uracil DNA N-glycosylase activity(GO:0004844) deaminated base DNA N-glycosylase activity(GO:0097506) |
| 0.3 | 0.7 | GO:0016671 | oxidoreductase activity, acting on a sulfur group of donors, disulfide as acceptor(GO:0016671) |
| 0.3 | 0.3 | GO:0001591 | dopamine neurotransmitter receptor activity, coupled via Gi/Go(GO:0001591) |
| 0.3 | 0.7 | GO:0071532 | ankyrin repeat binding(GO:0071532) |
| 0.3 | 1.0 | GO:0016309 | 1-phosphatidylinositol-5-phosphate 4-kinase activity(GO:0016309) |
| 0.3 | 0.7 | GO:0051185 | coenzyme transporter activity(GO:0051185) |
| 0.3 | 0.3 | GO:0030249 | cyclase regulator activity(GO:0010851) guanylate cyclase regulator activity(GO:0030249) |
| 0.3 | 1.6 | GO:0004652 | polynucleotide adenylyltransferase activity(GO:0004652) |
| 0.3 | 8.3 | GO:0005184 | neuropeptide hormone activity(GO:0005184) |
| 0.3 | 6.7 | GO:0070003 | threonine-type endopeptidase activity(GO:0004298) threonine-type peptidase activity(GO:0070003) |
| 0.3 | 3.5 | GO:0005522 | profilin binding(GO:0005522) |
| 0.3 | 0.3 | GO:0034483 | heparan sulfate sulfotransferase activity(GO:0034483) |
| 0.3 | 1.0 | GO:0004719 | protein-L-isoaspartate (D-aspartate) O-methyltransferase activity(GO:0004719) |
| 0.3 | 6.0 | GO:0016667 | oxidoreductase activity, acting on a sulfur group of donors(GO:0016667) |
| 0.3 | 0.3 | GO:0032356 | oxidized DNA binding(GO:0032356) oxidized purine DNA binding(GO:0032357) |
| 0.3 | 0.9 | GO:0008260 | 3-oxoacid CoA-transferase activity(GO:0008260) |
| 0.3 | 1.2 | GO:0071614 | linoleic acid epoxygenase activity(GO:0071614) |
| 0.3 | 3.3 | GO:0019531 | oxalate transmembrane transporter activity(GO:0019531) |
| 0.3 | 1.2 | GO:1990226 | histone methyltransferase binding(GO:1990226) |
| 0.3 | 7.1 | GO:0001106 | RNA polymerase II transcription corepressor activity(GO:0001106) |
| 0.3 | 2.9 | GO:0035173 | histone kinase activity(GO:0035173) |
| 0.3 | 6.4 | GO:0044688 | calmodulin-dependent cyclic-nucleotide phosphodiesterase activity(GO:0004117) cGMP-stimulated cyclic-nucleotide phosphodiesterase activity(GO:0004118) cGMP-inhibited cyclic-nucleotide phosphodiesterase activity(GO:0004119) photoreceptor cyclic-nucleotide phosphodiesterase activity(GO:0004120) 7,8-dihydro-D-neopterin 2',3'-cyclic phosphate phosphodiesterase activity(GO:0044688) inositol phosphosphingolipid phospholipase activity(GO:0052712) inositol phosphorylceramide phospholipase activity(GO:0052713) mannosyl-inositol phosphorylceramide phospholipase activity(GO:0052714) mannosyl-diinositol phosphorylceramide phospholipase activity(GO:0052715) |
| 0.3 | 2.9 | GO:0015386 | sodium:proton antiporter activity(GO:0015385) potassium:proton antiporter activity(GO:0015386) |
| 0.3 | 2.6 | GO:0004383 | guanylate cyclase activity(GO:0004383) |
| 0.3 | 0.9 | GO:0008486 | diphosphoinositol-polyphosphate diphosphatase activity(GO:0008486) |
| 0.3 | 2.3 | GO:0031386 | protein tag(GO:0031386) |
| 0.3 | 0.9 | GO:0033192 | calmodulin-dependent protein phosphatase activity(GO:0033192) |
| 0.3 | 1.7 | GO:0004415 | hyalurononglucosaminidase activity(GO:0004415) |
| 0.3 | 1.1 | GO:0051434 | BH3 domain binding(GO:0051434) |
| 0.3 | 3.0 | GO:0017154 | semaphorin receptor activity(GO:0017154) |
| 0.3 | 0.8 | GO:0015562 | efflux transmembrane transporter activity(GO:0015562) |
| 0.3 | 0.8 | GO:0008495 | 4-hydroxybenzoate octaprenyltransferase activity(GO:0008412) protoheme IX farnesyltransferase activity(GO:0008495) (S)-2,3-di-O-geranylgeranylglyceryl phosphate synthase activity(GO:0043888) cadaverine aminopropyltransferase activity(GO:0043918) agmatine aminopropyltransferase activity(GO:0043919) 1,4-dihydroxy-2-naphthoate octaprenyltransferase activity(GO:0046428) trans-pentaprenyltranstransferase activity(GO:0048045) ATP dimethylallyltransferase activity(GO:0052622) ADP dimethylallyltransferase activity(GO:0052623) |
| 0.3 | 1.3 | GO:0001665 | alpha-N-acetylgalactosaminide alpha-2,6-sialyltransferase activity(GO:0001665) |
| 0.3 | 0.8 | GO:0032767 | copper-dependent protein binding(GO:0032767) |
| 0.2 | 0.7 | GO:0070139 | ubiquitin-like protein-specific endopeptidase activity(GO:0070137) SUMO-specific endopeptidase activity(GO:0070139) |
| 0.2 | 1.7 | GO:0001135 | transcription factor activity, RNA polymerase II transcription factor recruiting(GO:0001135) |
| 0.2 | 0.7 | GO:0016823 | hydrolase activity, acting on acid carbon-carbon bonds(GO:0016822) hydrolase activity, acting on acid carbon-carbon bonds, in ketonic substances(GO:0016823) |
| 0.2 | 2.5 | GO:0016713 | oxidoreductase activity, acting on paired donors, with incorporation or reduction of molecular oxygen, reduced iron-sulfur protein as one donor, and incorporation of one atom of oxygen(GO:0016713) |
| 0.2 | 0.9 | GO:0004449 | isocitrate dehydrogenase (NAD+) activity(GO:0004449) |
| 0.2 | 0.7 | GO:1990829 | C-rich single-stranded DNA binding(GO:1990829) |
| 0.2 | 1.1 | GO:0042301 | phosphate ion binding(GO:0042301) |
| 0.2 | 5.8 | GO:0052770 | coenzyme F390-A hydrolase activity(GO:0052770) coenzyme F390-G hydrolase activity(GO:0052771) |
| 0.2 | 1.7 | GO:0034784 | pivalyl-CoA mutase activity(GO:0034784) o-hydroxylaminobenzoate mutase activity(GO:0034951) lupeol synthase activity(GO:0042299) beta-amyrin synthase activity(GO:0042300) baruol synthase activity(GO:0080011) |
| 0.2 | 0.2 | GO:0051378 | serotonin binding(GO:0051378) |
| 0.2 | 4.7 | GO:0005104 | fibroblast growth factor receptor binding(GO:0005104) |
| 0.2 | 0.2 | GO:0098518 | polynucleotide phosphatase activity(GO:0098518) |
| 0.2 | 0.6 | GO:0004946 | bombesin receptor activity(GO:0004946) |
| 0.2 | 2.2 | GO:0001671 | ATPase activator activity(GO:0001671) |
| 0.2 | 1.8 | GO:0004176 | ATP-dependent peptidase activity(GO:0004176) |
| 0.2 | 7.5 | GO:0017022 | myosin binding(GO:0017022) |
| 0.2 | 0.8 | GO:0031727 | CCR2 chemokine receptor binding(GO:0031727) |
| 0.2 | 1.0 | GO:0016937 | short-branched-chain-acyl-CoA dehydrogenase activity(GO:0016937) |
| 0.2 | 4.8 | GO:0001205 | transcriptional activator activity, RNA polymerase II distal enhancer sequence-specific binding(GO:0001205) |
| 0.2 | 3.8 | GO:0005484 | SNAP receptor activity(GO:0005484) |
| 0.2 | 0.9 | GO:0022820 | potassium:chloride symporter activity(GO:0015379) potassium ion symporter activity(GO:0022820) |
| 0.2 | 0.9 | GO:0004523 | RNA-DNA hybrid ribonuclease activity(GO:0004523) |
| 0.2 | 3.8 | GO:0003954 | NADH dehydrogenase activity(GO:0003954) |
| 0.2 | 0.3 | GO:0042895 | antibiotic transporter activity(GO:0042895) |
| 0.2 | 0.5 | GO:0004365 | glyceraldehyde-3-phosphate dehydrogenase (NAD+) (phosphorylating) activity(GO:0004365) glyceraldehyde-3-phosphate dehydrogenase (NAD(P)+) (phosphorylating) activity(GO:0043891) |
| 0.2 | 0.3 | GO:0008427 | calcium-dependent protein kinase inhibitor activity(GO:0008427) |
| 0.2 | 5.2 | GO:0033038 | bitter taste receptor activity(GO:0033038) |
| 0.2 | 0.3 | GO:2001070 | starch binding(GO:2001070) |
| 0.2 | 0.6 | GO:0016018 | cyclosporin A binding(GO:0016018) |
| 0.2 | 0.8 | GO:0010997 | anaphase-promoting complex binding(GO:0010997) |
| 0.2 | 0.2 | GO:0005006 | epidermal growth factor-activated receptor activity(GO:0005006) |
| 0.2 | 0.6 | GO:0004897 | ciliary neurotrophic factor receptor activity(GO:0004897) |
| 0.1 | 5.0 | GO:0005546 | phosphatidylinositol-4,5-bisphosphate binding(GO:0005546) |
| 0.1 | 0.4 | GO:0031493 | nucleosomal histone binding(GO:0031493) |
| 0.1 | 1.4 | GO:0042577 | lipid phosphatase activity(GO:0042577) |
| 0.1 | 1.5 | GO:0004312 | fatty acid synthase activity(GO:0004312) |
| 0.1 | 0.3 | GO:0016520 | growth hormone-releasing hormone receptor activity(GO:0016520) |
| 0.1 | 0.9 | GO:0033130 | acetylcholine receptor binding(GO:0033130) |
| 0.1 | 1.2 | GO:0001972 | retinoic acid binding(GO:0001972) |
| 0.1 | 0.4 | GO:0004829 | threonine-tRNA ligase activity(GO:0004829) |
| 0.1 | 1.4 | GO:1990841 | promoter-specific chromatin binding(GO:1990841) |
| 0.1 | 0.9 | GO:0015211 | purine nucleoside transmembrane transporter activity(GO:0015211) |
| 0.1 | 11.1 | GO:0004725 | protein tyrosine phosphatase activity(GO:0004725) |
| 0.1 | 2.0 | GO:0015095 | magnesium ion transmembrane transporter activity(GO:0015095) |
| 0.1 | 0.4 | GO:0004814 | arginine-tRNA ligase activity(GO:0004814) |
| 0.1 | 0.7 | GO:0005223 | intracellular cGMP activated cation channel activity(GO:0005223) |
| 0.1 | 0.1 | GO:0001030 | RNA polymerase III type 1 promoter DNA binding(GO:0001030) RNA polymerase III type 2 promoter DNA binding(GO:0001031) RNA polymerase III type 3 promoter DNA binding(GO:0001032) 5S rDNA binding(GO:0080084) |
| 0.1 | 0.3 | GO:0010484 | H3 histone acetyltransferase activity(GO:0010484) |
| 0.1 | 0.6 | GO:0016308 | 1-phosphatidylinositol-4-phosphate 5-kinase activity(GO:0016308) |
| 0.1 | 1.2 | GO:0017160 | Ral GTPase binding(GO:0017160) |
| 0.1 | 5.0 | GO:0008081 | phosphoric diester hydrolase activity(GO:0008081) |
| 0.1 | 0.1 | GO:0010857 | calcium-dependent protein kinase activity(GO:0010857) |
| 0.1 | 0.6 | GO:0047498 | calcium-dependent phospholipase A2 activity(GO:0047498) |
| 0.1 | 1.7 | GO:0071855 | neuropeptide receptor binding(GO:0071855) |
| 0.1 | 0.1 | GO:0009041 | uridylate kinase activity(GO:0009041) |
| 0.1 | 0.9 | GO:0004697 | protein kinase C activity(GO:0004697) |
| 0.1 | 0.6 | GO:0035325 | Toll-like receptor binding(GO:0035325) |
| 0.1 | 0.4 | GO:0034584 | piRNA binding(GO:0034584) |
| 0.1 | 2.8 | GO:0051539 | 4 iron, 4 sulfur cluster binding(GO:0051539) |
| 0.1 | 0.4 | GO:0030346 | protein phosphatase 2B binding(GO:0030346) |
| 0.1 | 3.3 | GO:0008907 | integrase activity(GO:0008907) T/G mismatch-specific endonuclease activity(GO:0043765) retroviral integrase activity(GO:0044823) retroviral 3' processing activity(GO:0044824) |
| 0.1 | 0.4 | GO:0005337 | nucleoside transmembrane transporter activity(GO:0005337) |
| 0.1 | 1.0 | GO:0015026 | coreceptor activity(GO:0015026) |
| 0.1 | 0.2 | GO:0019961 | interferon binding(GO:0019961) |
| 0.1 | 0.2 | GO:0042392 | sphingosine-1-phosphate phosphatase activity(GO:0042392) |
| 0.1 | 0.4 | GO:0004563 | beta-N-acetylhexosaminidase activity(GO:0004563) |
| 0.1 | 0.5 | GO:0004596 | peptide alpha-N-acetyltransferase activity(GO:0004596) |
| 0.1 | 0.4 | GO:0052723 | inositol hexakisphosphate kinase activity(GO:0000828) inositol hexakisphosphate 5-kinase activity(GO:0000832) inositol hexakisphosphate 1-kinase activity(GO:0052723) inositol hexakisphosphate 3-kinase activity(GO:0052724) |
| 0.1 | 3.1 | GO:0042281 | dolichyl pyrophosphate Man9GlcNAc2 alpha-1,3-glucosyltransferase activity(GO:0042281) |
| 0.1 | 0.4 | GO:0033695 | oxidoreductase activity, acting on CH or CH2 groups, quinone or similar compound as acceptor(GO:0033695) caffeine oxidase activity(GO:0034875) |
| 0.1 | 0.7 | GO:0000146 | microfilament motor activity(GO:0000146) |
| 0.1 | 0.7 | GO:0009881 | photoreceptor activity(GO:0009881) |
| 0.1 | 0.1 | GO:0035870 | dITP diphosphatase activity(GO:0035870) |
| 0.1 | 0.4 | GO:0033691 | sialic acid binding(GO:0033691) |
| 0.1 | 1.8 | GO:0043022 | ribosome binding(GO:0043022) |
| 0.1 | 0.1 | GO:0004673 | protein histidine kinase activity(GO:0004673) |
| 0.1 | 2.5 | GO:0051219 | phosphoprotein binding(GO:0051219) |
| 0.1 | 0.7 | GO:0031210 | phosphatidylcholine binding(GO:0031210) |
| 0.0 | 0.0 | GO:0001016 | RNA polymerase III regulatory region DNA binding(GO:0001016) |
| 0.0 | 0.3 | GO:0005229 | intracellular calcium activated chloride channel activity(GO:0005229) |
| 0.0 | 0.1 | GO:0042296 | ISG15 transferase activity(GO:0042296) |
| 0.0 | 0.2 | GO:0097027 | ubiquitin-protein transferase activator activity(GO:0097027) |
| 0.0 | 0.8 | GO:0042056 | chemoattractant activity(GO:0042056) |
| 0.0 | 0.2 | GO:0004525 | ribonuclease III activity(GO:0004525) double-stranded RNA-specific ribonuclease activity(GO:0032296) |
| 0.0 | 0.4 | GO:0051787 | misfolded protein binding(GO:0051787) |
| 0.0 | 0.5 | GO:0005186 | pheromone activity(GO:0005186) |
| 0.0 | 15.0 | GO:0005549 | odorant binding(GO:0005549) |
| 0.0 | 0.5 | GO:0042923 | neuropeptide binding(GO:0042923) |
| 0.0 | 0.3 | GO:0008376 | acetylgalactosaminyltransferase activity(GO:0008376) |
| 0.0 | 0.1 | GO:0019136 | deoxynucleoside kinase activity(GO:0019136) |
| 0.0 | 0.2 | GO:0043023 | ribosomal large subunit binding(GO:0043023) |
| 0.0 | 0.1 | GO:0004370 | glycerol kinase activity(GO:0004370) |
| 0.0 | 0.2 | GO:0005000 | vasopressin receptor activity(GO:0005000) |
| 0.0 | 0.1 | GO:1904264 | ubiquitin protein ligase activity involved in ERAD pathway(GO:1904264) |
| 0.0 | 0.1 | GO:0004556 | alpha-amylase activity(GO:0004556) |
| 0.0 | 0.0 | GO:0003986 | acetyl-CoA hydrolase activity(GO:0003986) |
| 0.0 | 0.0 | GO:0016774 | phosphotransferase activity, carboxyl group as acceptor(GO:0016774) |
| 0.0 | 0.6 | GO:0051117 | ATPase binding(GO:0051117) |
| 0.0 | 0.1 | GO:0005049 | nuclear export signal receptor activity(GO:0005049) |
| 0.0 | 0.6 | GO:0019905 | syntaxin binding(GO:0019905) |
| 0.0 | 0.0 | GO:0047751 | 3-oxo-5-alpha-steroid 4-dehydrogenase activity(GO:0003865) cholestenone 5-alpha-reductase activity(GO:0047751) |
Gene overrepresentation in curated gene sets: canonical pathways category:
| Log-likelihood per target | Total log-likelihood | Term | Description |
|---|---|---|---|
| 6.0 | 17.9 | PID TCR CALCIUM PATHWAY | Calcium signaling in the CD4+ TCR pathway |
| 3.7 | 117.0 | PID NETRIN PATHWAY | Netrin-mediated signaling events |
| 2.6 | 2.6 | PID IGF1 PATHWAY | IGF1 pathway |
| 2.3 | 7.0 | ST G ALPHA I PATHWAY | G alpha i Pathway |
| 2.2 | 8.7 | PID INTEGRIN5 PATHWAY | Beta5 beta6 beta7 and beta8 integrin cell surface interactions |
| 1.7 | 1.7 | PID REELIN PATHWAY | Reelin signaling pathway |
| 1.5 | 3.0 | PID MET PATHWAY | Signaling events mediated by Hepatocyte Growth Factor Receptor (c-Met) |
| 1.4 | 12.9 | PID S1P S1P4 PATHWAY | S1P4 pathway |
| 1.0 | 13.3 | PID SYNDECAN 3 PATHWAY | Syndecan-3-mediated signaling events |
| 1.0 | 15.1 | PID ERBB NETWORK PATHWAY | ErbB receptor signaling network |
| 1.0 | 1.9 | SA B CELL RECEPTOR COMPLEXES | Antigen binding to B cell receptors activates protein tyrosine kinases, such as the Src family, which ultimate activate MAP kinases. |
| 0.9 | 33.9 | PID HNF3A PATHWAY | FOXA1 transcription factor network |
| 0.9 | 3.4 | PID IL2 1PATHWAY | IL2-mediated signaling events |
| 0.8 | 20.2 | ST ADRENERGIC | Adrenergic Pathway |
| 0.8 | 20.9 | PID NCADHERIN PATHWAY | N-cadherin signaling events |
| 0.8 | 24.5 | ST WNT BETA CATENIN PATHWAY | Wnt/beta-catenin Pathway |
| 0.8 | 1.5 | SIG PIP3 SIGNALING IN B LYMPHOCYTES | Genes related to PIP3 signaling in B lymphocytes |
| 0.7 | 24.7 | PID HEDGEHOG GLI PATHWAY | Hedgehog signaling events mediated by Gli proteins |
| 0.7 | 24.1 | ST T CELL SIGNAL TRANSDUCTION | T Cell Signal Transduction |
| 0.5 | 11.3 | PID PS1 PATHWAY | Presenilin action in Notch and Wnt signaling |
| 0.5 | 2.8 | PID CXCR3 PATHWAY | CXCR3-mediated signaling events |
| 0.5 | 5.0 | SA PROGRAMMED CELL DEATH | Programmed cell death, or apoptosis, eliminates damaged or unneeded cells. |
| 0.5 | 0.5 | PID S1P S1P1 PATHWAY | S1P1 pathway |
| 0.4 | 3.1 | ST G ALPHA S PATHWAY | G alpha s Pathway |
| 0.4 | 3.0 | PID NFKAPPAB ATYPICAL PATHWAY | Atypical NF-kappaB pathway |
| 0.4 | 23.8 | PID BETA CATENIN NUC PATHWAY | Regulation of nuclear beta catenin signaling and target gene transcription |
| 0.4 | 55.4 | NABA ECM AFFILIATED | Genes encoding proteins affiliated structurally or functionally to extracellular matrix proteins |
| 0.4 | 13.8 | PID SHP2 PATHWAY | SHP2 signaling |
| 0.3 | 11.1 | PID RAC1 REG PATHWAY | Regulation of RAC1 activity |
| 0.3 | 0.3 | SA REG CASCADE OF CYCLIN EXPR | Expression of cyclins regulates progression through the cell cycle by activating cyclin-dependent kinases. |
| 0.3 | 1.9 | PID KIT PATHWAY | Signaling events mediated by Stem cell factor receptor (c-Kit) |
| 0.3 | 0.6 | PID IL12 STAT4 PATHWAY | IL12 signaling mediated by STAT4 |
| 0.3 | 4.0 | SIG CD40PATHWAYMAP | Genes related to CD40 signaling |
| 0.3 | 5.0 | PID EPHA FWDPATHWAY | EPHA forward signaling |
| 0.2 | 0.2 | ST TUMOR NECROSIS FACTOR PATHWAY | Tumor Necrosis Factor Pathway. |
| 0.2 | 5.0 | PID ERBB1 INTERNALIZATION PATHWAY | Internalization of ErbB1 |
| 0.2 | 4.1 | PID P38 ALPHA BETA PATHWAY | Regulation of p38-alpha and p38-beta |
| 0.2 | 0.9 | SIG CHEMOTAXIS | Genes related to chemotaxis |
| 0.2 | 0.3 | SA G2 AND M PHASES | Cdc25 activates the cdc2/cyclin B complex to induce the G2/M transition. |
| 0.2 | 0.5 | PID AVB3 OPN PATHWAY | Osteopontin-mediated events |
| 0.1 | 1.5 | PID ALPHA SYNUCLEIN PATHWAY | Alpha-synuclein signaling |
| 0.0 | 0.0 | PID S1P S1P2 PATHWAY | S1P2 pathway |
| 0.0 | 0.1 | SA TRKA RECEPTOR | The TrkA receptor binds nerve growth factor to activate MAP kinase pathways and promote cell growth. |
| 0.0 | 0.1 | PID TCR JNK PATHWAY | JNK signaling in the CD4+ TCR pathway |
| 0.0 | 0.1 | PID IL6 7 PATHWAY | IL6-mediated signaling events |
Gene overrepresentation in curated gene sets: REACTOME pathways category:
| Log-likelihood per target | Total log-likelihood | Term | Description |
|---|---|---|---|
| 3.8 | 46.0 | REACTOME GABA A RECEPTOR ACTIVATION | Genes involved in GABA A receptor activation |
| 3.6 | 83.9 | REACTOME ADHERENS JUNCTIONS INTERACTIONS | Genes involved in Adherens junctions interactions |
| 3.4 | 24.1 | REACTOME CREATION OF C4 AND C2 ACTIVATORS | Genes involved in Creation of C4 and C2 activators |
| 3.2 | 54.3 | REACTOME GABA SYNTHESIS RELEASE REUPTAKE AND DEGRADATION | Genes involved in GABA synthesis, release, reuptake and degradation |
| 2.8 | 22.4 | REACTOME DSCAM INTERACTIONS | Genes involved in DSCAM interactions |
| 2.8 | 58.7 | REACTOME MYOGENESIS | Genes involved in Myogenesis |
| 2.7 | 29.9 | REACTOME IONOTROPIC ACTIVITY OF KAINATE RECEPTORS | Genes involved in Ionotropic activity of Kainate Receptors |
| 2.7 | 37.7 | REACTOME CRMPS IN SEMA3A SIGNALING | Genes involved in CRMPs in Sema3A signaling |
| 2.5 | 10.2 | REACTOME DOPAMINE NEUROTRANSMITTER RELEASE CYCLE | Genes involved in Dopamine Neurotransmitter Release Cycle |
| 2.5 | 35.6 | REACTOME CLASS C 3 METABOTROPIC GLUTAMATE PHEROMONE RECEPTORS | Genes involved in Class C/3 (Metabotropic glutamate/pheromone receptors) |
| 2.5 | 5.1 | REACTOME SOS MEDIATED SIGNALLING | Genes involved in SOS-mediated signalling |
| 2.4 | 18.8 | REACTOME LIGAND GATED ION CHANNEL TRANSPORT | Genes involved in Ligand-gated ion channel transport |
| 2.1 | 16.9 | REACTOME DOWNREGULATION OF ERBB2 ERBB3 SIGNALING | Genes involved in Downregulation of ERBB2:ERBB3 signaling |
| 2.1 | 51.9 | REACTOME SIGNALING BY ROBO RECEPTOR | Genes involved in Signaling by Robo receptor |
| 2.0 | 30.7 | REACTOME UNBLOCKING OF NMDA RECEPTOR GLUTAMATE BINDING AND ACTIVATION | Genes involved in Unblocking of NMDA receptor, glutamate binding and activation |
| 1.9 | 31.1 | REACTOME INSULIN SYNTHESIS AND PROCESSING | Genes involved in Insulin Synthesis and Processing |
| 1.9 | 36.8 | REACTOME REGULATION OF GENE EXPRESSION IN BETA CELLS | Genes involved in Regulation of gene expression in beta cells |
| 1.9 | 24.4 | REACTOME NEPHRIN INTERACTIONS | Genes involved in Nephrin interactions |
| 1.8 | 5.5 | REACTOME INHIBITION OF THE PROTEOLYTIC ACTIVITY OF APC C REQUIRED FOR THE ONSET OF ANAPHASE BY MITOTIC SPINDLE CHECKPOINT COMPONENTS | Genes involved in Inhibition of the proteolytic activity of APC/C required for the onset of anaphase by mitotic spindle checkpoint components |
| 1.7 | 15.6 | REACTOME HORMONE LIGAND BINDING RECEPTORS | Genes involved in Hormone ligand-binding receptors |
| 1.7 | 11.9 | REACTOME ACTIVATION OF THE AP1 FAMILY OF TRANSCRIPTION FACTORS | Genes involved in Activation of the AP-1 family of transcription factors |
| 1.7 | 21.9 | REACTOME OTHER SEMAPHORIN INTERACTIONS | Genes involved in Other semaphorin interactions |
| 1.7 | 72.0 | REACTOME VOLTAGE GATED POTASSIUM CHANNELS | Genes involved in Voltage gated Potassium channels |
| 1.6 | 19.4 | REACTOME CS DS DEGRADATION | Genes involved in CS/DS degradation |
| 1.5 | 1.5 | REACTOME APC C CDC20 MEDIATED DEGRADATION OF MITOTIC PROTEINS | Genes involved in APC/C:Cdc20 mediated degradation of mitotic proteins |
| 1.3 | 41.1 | REACTOME RNA POL III TRANSCRIPTION | Genes involved in RNA Polymerase III Transcription |
| 1.3 | 9.0 | REACTOME A TETRASACCHARIDE LINKER SEQUENCE IS REQUIRED FOR GAG SYNTHESIS | Genes involved in A tetrasaccharide linker sequence is required for GAG synthesis |
| 1.3 | 24.1 | REACTOME INTERACTION BETWEEN L1 AND ANKYRINS | Genes involved in Interaction between L1 and Ankyrins |
| 1.2 | 4.8 | REACTOME NEGATIVE REGULATION OF THE PI3K AKT NETWORK | Genes involved in Negative regulation of the PI3K/AKT network |
| 1.2 | 33.6 | REACTOME HS GAG BIOSYNTHESIS | Genes involved in HS-GAG biosynthesis |
| 1.1 | 13.2 | REACTOME G PROTEIN ACTIVATION | Genes involved in G-protein activation |
| 1.1 | 9.5 | REACTOME G ALPHA Z SIGNALLING EVENTS | Genes involved in G alpha (z) signalling events |
| 1.0 | 8.4 | REACTOME TRANSPORT OF ORGANIC ANIONS | Genes involved in Transport of organic anions |
| 0.9 | 10.2 | REACTOME SEROTONIN RECEPTORS | Genes involved in Serotonin receptors |
| 0.9 | 8.2 | REACTOME AMINE LIGAND BINDING RECEPTORS | Genes involved in Amine ligand-binding receptors |
| 0.9 | 10.3 | REACTOME NA CL DEPENDENT NEUROTRANSMITTER TRANSPORTERS | Genes involved in Na+/Cl- dependent neurotransmitter transporters |
| 0.9 | 8.5 | REACTOME SYNTHESIS OF PIPS AT THE LATE ENDOSOME MEMBRANE | Genes involved in Synthesis of PIPs at the late endosome membrane |
| 0.8 | 16.1 | REACTOME CGMP EFFECTS | Genes involved in cGMP effects |
| 0.8 | 5.8 | REACTOME THE ACTIVATION OF ARYLSULFATASES | Genes involved in The activation of arylsulfatases |
| 0.8 | 7.3 | REACTOME PHOSPHORYLATION OF CD3 AND TCR ZETA CHAINS | Genes involved in Phosphorylation of CD3 and TCR zeta chains |
| 0.8 | 14.7 | REACTOME GPVI MEDIATED ACTIVATION CASCADE | Genes involved in GPVI-mediated activation cascade |
| 0.8 | 20.9 | REACTOME NETRIN1 SIGNALING | Genes involved in Netrin-1 signaling |
| 0.8 | 2.3 | REACTOME ACETYLCHOLINE NEUROTRANSMITTER RELEASE CYCLE | Genes involved in Acetylcholine Neurotransmitter Release Cycle |
| 0.8 | 3.0 | REACTOME SIGNALING BY WNT | Genes involved in Signaling by Wnt |
| 0.7 | 9.6 | REACTOME METABOLISM OF POLYAMINES | Genes involved in Metabolism of polyamines |
| 0.7 | 0.7 | REACTOME CDT1 ASSOCIATION WITH THE CDC6 ORC ORIGIN COMPLEX | Genes involved in CDT1 association with the CDC6:ORC:origin complex |
| 0.7 | 2.2 | REACTOME REGULATED PROTEOLYSIS OF P75NTR | Genes involved in Regulated proteolysis of p75NTR |
| 0.7 | 25.9 | REACTOME NCAM1 INTERACTIONS | Genes involved in NCAM1 interactions |
| 0.7 | 0.7 | REACTOME REGULATION OF GLUCOKINASE BY GLUCOKINASE REGULATORY PROTEIN | Genes involved in Regulation of Glucokinase by Glucokinase Regulatory Protein |
| 0.7 | 21.5 | REACTOME TRANSPORT TO THE GOLGI AND SUBSEQUENT MODIFICATION | Genes involved in Transport to the Golgi and subsequent modification |
| 0.7 | 4.0 | REACTOME ADP SIGNALLING THROUGH P2RY1 | Genes involved in ADP signalling through P2Y purinoceptor 1 |
| 0.6 | 6.9 | REACTOME TRAFFICKING OF AMPA RECEPTORS | Genes involved in Trafficking of AMPA receptors |
| 0.6 | 7.4 | REACTOME EGFR DOWNREGULATION | Genes involved in EGFR downregulation |
| 0.6 | 8.5 | REACTOME AMINO ACID SYNTHESIS AND INTERCONVERSION TRANSAMINATION | Genes involved in Amino acid synthesis and interconversion (transamination) |
| 0.6 | 6.1 | REACTOME TANDEM PORE DOMAIN POTASSIUM CHANNELS | Genes involved in Tandem pore domain potassium channels |
| 0.6 | 1.7 | REACTOME BINDING AND ENTRY OF HIV VIRION | Genes involved in Binding and entry of HIV virion |
| 0.6 | 7.2 | REACTOME ZINC TRANSPORTERS | Genes involved in Zinc transporters |
| 0.5 | 2.7 | REACTOME GRB2 EVENTS IN ERBB2 SIGNALING | Genes involved in GRB2 events in ERBB2 signaling |
| 0.5 | 7.0 | REACTOME ENDOGENOUS STEROLS | Genes involved in Endogenous sterols |
| 0.5 | 3.7 | REACTOME CA DEPENDENT EVENTS | Genes involved in Ca-dependent events |
| 0.5 | 6.4 | REACTOME PYRIMIDINE CATABOLISM | Genes involved in Pyrimidine catabolism |
| 0.5 | 1.6 | REACTOME SIGNALLING TO P38 VIA RIT AND RIN | Genes involved in Signalling to p38 via RIT and RIN |
| 0.5 | 5.5 | REACTOME COMPLEMENT CASCADE | Genes involved in Complement cascade |
| 0.5 | 2.5 | REACTOME INITIAL TRIGGERING OF COMPLEMENT | Genes involved in Initial triggering of complement |
| 0.5 | 6.4 | REACTOME MITOCHONDRIAL FATTY ACID BETA OXIDATION | Genes involved in Mitochondrial Fatty Acid Beta-Oxidation |
| 0.5 | 1.4 | REACTOME SIGNALING BY SCF KIT | Genes involved in Signaling by SCF-KIT |
| 0.4 | 6.5 | REACTOME GLUCAGON TYPE LIGAND RECEPTORS | Genes involved in Glucagon-type ligand receptors |
| 0.4 | 5.9 | REACTOME SYNTHESIS SECRETION AND INACTIVATION OF GLP1 | Genes involved in Synthesis, Secretion, and Inactivation of Glucagon-like Peptide-1 (GLP-1) |
| 0.4 | 0.4 | REACTOME OLFACTORY SIGNALING PATHWAY | Genes involved in Olfactory Signaling Pathway |
| 0.4 | 3.1 | REACTOME PLATELET CALCIUM HOMEOSTASIS | Genes involved in Platelet calcium homeostasis |
| 0.4 | 15.2 | REACTOME G ALPHA1213 SIGNALLING EVENTS | Genes involved in G alpha (12/13) signalling events |
| 0.4 | 8.3 | REACTOME INHIBITION OF VOLTAGE GATED CA2 CHANNELS VIA GBETA GAMMA SUBUNITS | Genes involved in Inhibition of voltage gated Ca2+ channels via Gbeta/gamma subunits |
| 0.4 | 6.4 | REACTOME EFFECTS OF PIP2 HYDROLYSIS | Genes involved in Effects of PIP2 hydrolysis |
| 0.4 | 6.3 | REACTOME BRANCHED CHAIN AMINO ACID CATABOLISM | Genes involved in Branched-chain amino acid catabolism |
| 0.3 | 7.9 | REACTOME ACTIVATED NOTCH1 TRANSMITS SIGNAL TO THE NUCLEUS | Genes involved in Activated NOTCH1 Transmits Signal to the Nucleus |
| 0.3 | 3.8 | REACTOME GLYCOGEN BREAKDOWN GLYCOGENOLYSIS | Genes involved in Glycogen breakdown (glycogenolysis) |
| 0.3 | 4.7 | REACTOME PROCESSING OF INTRONLESS PRE MRNAS | Genes involved in Processing of Intronless Pre-mRNAs |
| 0.3 | 1.7 | REACTOME SHC MEDIATED SIGNALLING | Genes involved in SHC-mediated signalling |
| 0.3 | 5.3 | REACTOME FANCONI ANEMIA PATHWAY | Genes involved in Fanconi Anemia pathway |
| 0.3 | 10.3 | REACTOME ION TRANSPORT BY P TYPE ATPASES | Genes involved in Ion transport by P-type ATPases |
| 0.3 | 6.2 | REACTOME MITOCHONDRIAL TRNA AMINOACYLATION | Genes involved in Mitochondrial tRNA aminoacylation |
| 0.3 | 1.2 | REACTOME DOWNSTREAM TCR SIGNALING | Genes involved in Downstream TCR signaling |
| 0.3 | 6.2 | REACTOME SIGNALING BY HIPPO | Genes involved in Signaling by Hippo |
| 0.3 | 8.6 | REACTOME ACTIVATION OF THE PRE REPLICATIVE COMPLEX | Genes involved in Activation of the pre-replicative complex |
| 0.2 | 1.5 | REACTOME ANDROGEN BIOSYNTHESIS | Genes involved in Androgen biosynthesis |
| 0.2 | 11.5 | REACTOME CLASS B 2 SECRETIN FAMILY RECEPTORS | Genes involved in Class B/2 (Secretin family receptors) |
| 0.2 | 0.2 | REACTOME NOREPINEPHRINE NEUROTRANSMITTER RELEASE CYCLE | Genes involved in Norepinephrine Neurotransmitter Release Cycle |
| 0.2 | 2.2 | REACTOME RESOLUTION OF AP SITES VIA THE SINGLE NUCLEOTIDE REPLACEMENT PATHWAY | Genes involved in Resolution of AP sites via the single-nucleotide replacement pathway |
| 0.2 | 4.0 | REACTOME SIGNALING BY BMP | Genes involved in Signaling by BMP |
| 0.2 | 1.6 | REACTOME CASPASE MEDIATED CLEAVAGE OF CYTOSKELETAL PROTEINS | Genes involved in Caspase-mediated cleavage of cytoskeletal proteins |
| 0.2 | 2.4 | REACTOME POTASSIUM CHANNELS | Genes involved in Potassium Channels |
| 0.2 | 0.2 | REACTOME CREB PHOSPHORYLATION THROUGH THE ACTIVATION OF CAMKII | Genes involved in CREB phosphorylation through the activation of CaMKII |
| 0.2 | 1.6 | REACTOME REGULATION OF BETA CELL DEVELOPMENT | Genes involved in Regulation of beta-cell development |
| 0.2 | 1.8 | REACTOME FGFR2C LIGAND BINDING AND ACTIVATION | Genes involved in FGFR2c ligand binding and activation |
| 0.1 | 0.1 | REACTOME NRIF SIGNALS CELL DEATH FROM THE NUCLEUS | Genes involved in NRIF signals cell death from the nucleus |
| 0.1 | 2.0 | REACTOME ABCA TRANSPORTERS IN LIPID HOMEOSTASIS | Genes involved in ABCA transporters in lipid homeostasis |
| 0.1 | 5.7 | REACTOME G ALPHA S SIGNALLING EVENTS | Genes involved in G alpha (s) signalling events |
| 0.1 | 3.1 | REACTOME POST TRANSLATIONAL MODIFICATION SYNTHESIS OF GPI ANCHORED PROTEINS | Genes involved in Post-translational modification: synthesis of GPI-anchored proteins |
| 0.1 | 0.1 | REACTOME CTLA4 INHIBITORY SIGNALING | Genes involved in CTLA4 inhibitory signaling |
| 0.1 | 1.2 | REACTOME TIE2 SIGNALING | Genes involved in Tie2 Signaling |
| 0.1 | 1.5 | REACTOME AMYLOIDS | Genes involved in Amyloids |
| 0.1 | 0.1 | REACTOME NCAM SIGNALING FOR NEURITE OUT GROWTH | Genes involved in NCAM signaling for neurite out-growth |
| 0.1 | 0.7 | REACTOME CHONDROITIN SULFATE BIOSYNTHESIS | Genes involved in Chondroitin sulfate biosynthesis |
| 0.0 | 1.6 | REACTOME NOTCH1 INTRACELLULAR DOMAIN REGULATES TRANSCRIPTION | Genes involved in NOTCH1 Intracellular Domain Regulates Transcription |
| 0.0 | 0.0 | REACTOME CONVERSION FROM APC C CDC20 TO APC C CDH1 IN LATE ANAPHASE | Genes involved in Conversion from APC/C:Cdc20 to APC/C:Cdh1 in late anaphase |
| 0.0 | 0.1 | REACTOME NITRIC OXIDE STIMULATES GUANYLATE CYCLASE | Genes involved in Nitric oxide stimulates guanylate cyclase |
| 0.0 | 0.4 | REACTOME ACETYLCHOLINE BINDING AND DOWNSTREAM EVENTS | Genes involved in Acetylcholine Binding And Downstream Events |
| 0.0 | 0.0 | REACTOME P53 INDEPENDENT G1 S DNA DAMAGE CHECKPOINT | Genes involved in p53-Independent G1/S DNA damage checkpoint |
| 0.0 | 0.2 | REACTOME AMINE DERIVED HORMONES | Genes involved in Amine-derived hormones |
| 0.0 | 0.1 | REACTOME ACTIVATION OF ATR IN RESPONSE TO REPLICATION STRESS | Genes involved in Activation of ATR in response to replication stress |