Project
ENCODE: ATAC-seq of different tissues during embryonic development
Navigation
Downloads

Results for Onecut2_Onecut3
Z-value: 3.69
Motif logo
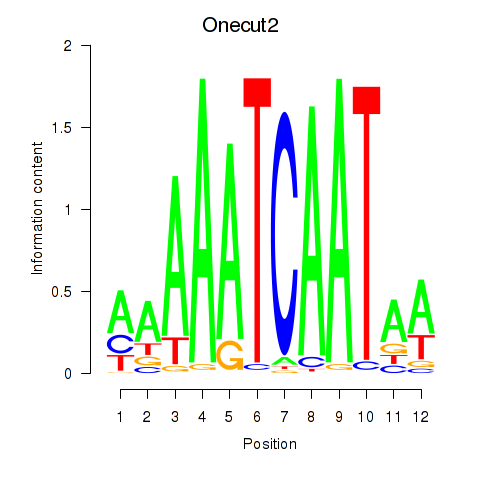
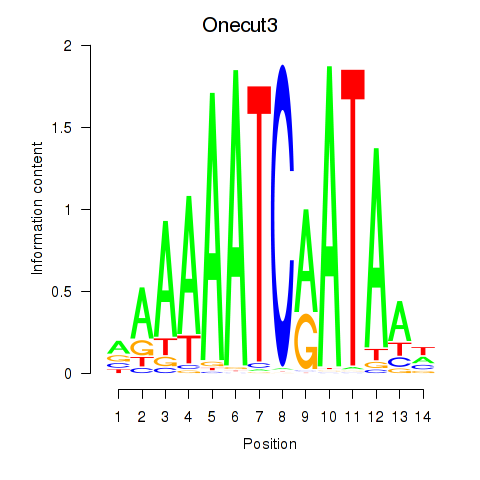
Transcription factors associated with Onecut2_Onecut3
| Gene Symbol | Gene ID | Gene Info |
|---|---|---|
|
Onecut2
|
ENSMUSG00000045991.12 | one cut domain, family member 2 |
|
Onecut3
|
ENSMUSG00000045518.8 | one cut domain, family member 3 |
Correlations of motif activity and signal intensity at CREs associated with the motif's TFs:
This plot shows correlation between observed signal intensity of a CRE associated with the transcription factor across all samples and activity of the motif.
For each TF, only the top 5 correlated CREs are shown.
| CRE | Gene | Distance | Association probability | Pearson corr. coef. | P-value | Plot |
|---|---|---|---|---|---|---|
| chr18_64350212_64350455 | Onecut2 | 10313 | 0.166845 | 0.57 | 5.0e-06 | Click! |
| chr18_64350576_64350996 | Onecut2 | 10766 | 0.166067 | 0.56 | 1.1e-05 | Click! |
| chr18_64339353_64339817 | Onecut2 | 435 | 0.808099 | -0.53 | 3.0e-05 | Click! |
| chr18_64342523_64342684 | Onecut2 | 2583 | 0.244673 | -0.51 | 5.9e-05 | Click! |
| chr18_64340169_64340496 | Onecut2 | 312 | 0.880196 | -0.47 | 2.8e-04 | Click! |
| chr10_80490364_80490515 | Onecut3 | 4396 | 0.106456 | -0.13 | 3.5e-01 | Click! |
| chr10_80490140_80490309 | Onecut3 | 4611 | 0.104768 | -0.02 | 9.0e-01 | Click! |
Activity of the Onecut2_Onecut3 motif across conditions
Conditions sorted by the z-value of the Onecut2_Onecut3 motif activity
Move your cursor over a bar to see sample name and corresponding Z-value.
Top target CREs of the motif:
| Cis Regulatory Element (CRE) | Target Score | Top associated gene | Gene Info | Distance of CRE to TSS | CRE/Gene association probability |
|---|---|---|---|---|---|
| chr14_64193921_64194220 | 25.79 |
9630015K15Rik |
RIKEN cDNA 9630015K15 gene |
77756 |
0.08 |
| chr2_22587496_22588353 | 23.54 |
Gm13341 |
predicted gene 13341 |
38 |
0.95 |
| chr4_41129904_41130072 | 22.30 |
Gm12402 |
predicted gene 12402 |
2856 |
0.14 |
| chr4_140701770_140702866 | 20.93 |
Rcc2 |
regulator of chromosome condensation 2 |
845 |
0.47 |
| chr10_128790514_128790671 | 20.44 |
Mmp19 |
matrix metallopeptidase 19 |
318 |
0.75 |
| chr12_80976041_80976212 | 19.67 |
Slc10a1 |
solute carrier family 10 (sodium/bile acid cotransporter family), member 1 |
7421 |
0.15 |
| chr5_115775514_115775677 | 19.27 |
Gm13841 |
predicted gene 13841 |
26564 |
0.14 |
| chr5_114558159_114558686 | 18.69 |
Gm13790 |
predicted gene 13790 |
7133 |
0.17 |
| chr19_37442831_37443030 | 18.44 |
Hhex |
hematopoietically expressed homeobox |
6191 |
0.13 |
| chr7_26303634_26303785 | 18.28 |
Cyp2a4 |
cytochrome P450, family 2, subfamily a, polypeptide 4 |
3460 |
0.16 |
| chr17_66881067_66881230 | 18.19 |
Gm49940 |
predicted gene, 49940 |
18908 |
0.16 |
| chr5_112001700_112002600 | 17.99 |
Gm42488 |
predicted gene 42488 |
57915 |
0.13 |
| chr9_113833592_113833892 | 17.57 |
Clasp2 |
CLIP associating protein 2 |
21142 |
0.2 |
| chr12_103737920_103738559 | 17.52 |
Serpina1b |
serine (or cysteine) preptidase inhibitor, clade A, member 1B |
81 |
0.95 |
| chr11_70730309_70730460 | 17.02 |
Mir6925 |
microRNA 6925 |
24394 |
0.06 |
| chr10_127367988_127368139 | 17.00 |
Inhbc |
inhibin beta-C |
2368 |
0.14 |
| chr14_74952360_74952511 | 16.13 |
Lrch1 |
leucine-rich repeats and calponin homology (CH) domain containing 1 |
4559 |
0.21 |
| chr15_67143595_67143753 | 15.44 |
St3gal1 |
ST3 beta-galactoside alpha-2,3-sialyltransferase 1 |
14651 |
0.25 |
| chr19_41275697_41275882 | 15.41 |
Tm9sf3 |
transmembrane 9 superfamily member 3 |
11792 |
0.24 |
| chr7_4792408_4793492 | 15.35 |
Rpl28 |
ribosomal protein L28 |
40 |
0.93 |
| chr6_38929161_38929494 | 15.26 |
Tbxas1 |
thromboxane A synthase 1, platelet |
10303 |
0.2 |
| chr11_83562559_83562715 | 15.08 |
Ccl9 |
chemokine (C-C motif) ligand 9 |
14505 |
0.09 |
| chr9_64049464_64049751 | 15.06 |
Gm25606 |
predicted gene, 25606 |
1111 |
0.4 |
| chr4_88893311_88893479 | 14.99 |
Ifne |
interferon epsilon |
13194 |
0.08 |
| chr9_61813330_61813486 | 14.97 |
Gm19208 |
predicted gene, 19208 |
38296 |
0.16 |
| chr11_95357123_95357338 | 14.87 |
Fam117a |
family with sequence similarity 117, member A |
17268 |
0.11 |
| chr13_34299446_34299869 | 14.83 |
Gm47086 |
predicted gene, 47086 |
19151 |
0.18 |
| chr7_128289110_128289522 | 14.50 |
BC017158 |
cDNA sequence BC017158 |
611 |
0.44 |
| chr11_110010816_110011149 | 14.48 |
Abca8b |
ATP-binding cassette, sub-family A (ABC1), member 8b |
15137 |
0.2 |
| chrX_136211985_136212136 | 14.40 |
Tceal7 |
transcription elongation factor A (SII)-like 7 |
2719 |
0.14 |
| chr14_12073815_12074036 | 14.26 |
Ptprg |
protein tyrosine phosphatase, receptor type, G |
17235 |
0.23 |
| chr8_122317511_122318419 | 14.20 |
Zfpm1 |
zinc finger protein, multitype 1 |
10645 |
0.13 |
| chr5_36726254_36726643 | 14.08 |
Gm43701 |
predicted gene 43701 |
22170 |
0.11 |
| chr6_88066031_88066182 | 13.92 |
Rpn1 |
ribophorin I |
18376 |
0.11 |
| chr13_101861969_101862287 | 13.88 |
Gm47007 |
predicted gene, 47007 |
6637 |
0.22 |
| chr14_47522145_47522364 | 13.74 |
Fbxo34 |
F-box protein 34 |
3825 |
0.15 |
| chr3_104572058_104572210 | 13.67 |
Gm26091 |
predicted gene, 26091 |
29105 |
0.1 |
| chr1_82836684_82836853 | 13.66 |
Gm22396 |
predicted gene, 22396 |
2678 |
0.14 |
| chr7_103865311_103865713 | 13.53 |
Hbb-y |
hemoglobin Y, beta-like embryonic chain |
12296 |
0.06 |
| chr1_40254413_40254682 | 13.41 |
Il1r1 |
interleukin 1 receptor, type I |
12039 |
0.19 |
| chr2_60410183_60410334 | 13.39 |
Gm13580 |
predicted gene 13580 |
1267 |
0.43 |
| chr5_123067867_123068018 | 13.35 |
Tmem120b |
transmembrane protein 120B |
473 |
0.61 |
| chr18_74767812_74768083 | 13.20 |
Scarna17 |
small Cajal body-specific RNA 17 |
10522 |
0.15 |
| chr15_11726187_11726411 | 13.12 |
Gm41271 |
predicted gene, 41271 |
22596 |
0.22 |
| chr16_55816469_55816872 | 13.01 |
Nfkbiz |
nuclear factor of kappa light polypeptide gene enhancer in B cells inhibitor, zeta |
1845 |
0.33 |
| chr1_193399134_193399286 | 12.93 |
Camk1g |
calcium/calmodulin-dependent protein kinase I gamma |
28912 |
0.13 |
| chr11_69366461_69367262 | 12.74 |
Chd3 |
chromodomain helicase DNA binding protein 3 |
2082 |
0.14 |
| chr15_77746271_77746422 | 12.72 |
Gm49410 |
predicted gene, 49410 |
5585 |
0.11 |
| chr2_32527726_32527877 | 12.50 |
Gm13412 |
predicted gene 13412 |
2770 |
0.14 |
| chr17_33712557_33712833 | 12.28 |
Marchf2 |
membrane associated ring-CH-type finger 2 |
686 |
0.51 |
| chr1_194610410_194610808 | 12.14 |
Plxna2 |
plexin A2 |
7609 |
0.21 |
| chr16_24254692_24254872 | 12.07 |
Gm31814 |
predicted gene, 31814 |
8377 |
0.22 |
| chr11_78981943_78982094 | 11.98 |
Lgals9 |
lectin, galactose binding, soluble 9 |
2813 |
0.25 |
| chr5_88797202_88797491 | 11.61 |
Gm42912 |
predicted gene 42912 |
3450 |
0.19 |
| chr5_142920434_142920596 | 11.61 |
Actb |
actin, beta |
13761 |
0.14 |
| chr1_131638611_131638779 | 11.57 |
Ctse |
cathepsin E |
201 |
0.93 |
| chr4_129386351_129386502 | 11.53 |
Gm12980 |
predicted gene 12980 |
6582 |
0.12 |
| chr15_86075407_86075558 | 11.46 |
Gramd4 |
GRAM domain containing 4 |
749 |
0.65 |
| chr13_50283423_50283640 | 11.38 |
Gm31126 |
predicted gene, 31126 |
15555 |
0.14 |
| chr3_66485697_66486012 | 11.36 |
Gm17952 |
predicted gene, 17952 |
77697 |
0.1 |
| chr5_145464425_145464576 | 11.27 |
Cyp3a16 |
cytochrome P450, family 3, subfamily a, polypeptide 16 |
5223 |
0.19 |
| chr18_62211148_62211299 | 11.13 |
Gm9949 |
predicted gene 9949 |
31097 |
0.17 |
| chr5_90229829_90229980 | 11.13 |
Ankrd17 |
ankyrin repeat domain 17 |
2560 |
0.3 |
| chr3_18429033_18429189 | 11.13 |
Gm30667 |
predicted gene, 30667 |
32143 |
0.18 |
| chr2_172841020_172841171 | 11.12 |
Gm22773 |
predicted gene, 22773 |
23246 |
0.22 |
| chrX_42012827_42012989 | 11.11 |
Xiap |
X-linked inhibitor of apoptosis |
46771 |
0.13 |
| chr5_73311488_73311911 | 11.10 |
Gm42732 |
predicted gene 42732 |
335 |
0.78 |
| chr12_70707601_70707898 | 11.04 |
Gm32369 |
predicted gene, 32369 |
25899 |
0.14 |
| chr14_121425553_121425718 | 11.01 |
Gm33299 |
predicted gene, 33299 |
30127 |
0.14 |
| chr12_103863072_103863984 | 10.96 |
Serpina1a |
serine (or cysteine) peptidase inhibitor, clade A, member 1A |
23 |
0.95 |
| chr7_132939241_132939396 | 10.89 |
1500002F19Rik |
RIKEN cDNA 1500002F19 gene |
8121 |
0.14 |
| chr13_50578976_50579188 | 10.86 |
Gm20789 |
predicted gene, 20789 |
17609 |
0.14 |
| chr2_73505044_73505323 | 10.83 |
Wipf1 |
WAS/WASL interacting protein family, member 1 |
18714 |
0.16 |
| chr2_58557261_58557459 | 10.80 |
Acvr1 |
activin A receptor, type 1 |
9466 |
0.21 |
| chr6_67149940_67150209 | 10.69 |
A430010J10Rik |
RIKEN cDNA A430010J10 gene |
14850 |
0.15 |
| chr17_84728372_84728523 | 10.64 |
Lrpprc |
leucine-rich PPR-motif containing |
2737 |
0.24 |
| chr11_72027961_72028119 | 10.63 |
Gm23226 |
predicted gene, 23226 |
5285 |
0.16 |
| chr4_107899249_107899588 | 10.58 |
Czib |
CXXC motif containing zinc binding protein |
6048 |
0.13 |
| chr11_6430278_6430429 | 10.52 |
H2az2 |
H2A.Z histone variant 2 |
13999 |
0.08 |
| chr3_31133572_31133723 | 10.51 |
Cldn11 |
claudin 11 |
16273 |
0.19 |
| chr4_117055827_117056105 | 10.49 |
Eif2b3 |
eukaryotic translation initiation factor 2B, subunit 3 |
10505 |
0.09 |
| chr2_78882606_78882766 | 10.48 |
Ube2e3 |
ubiquitin-conjugating enzyme E2E 3 |
13008 |
0.23 |
| chr11_112720530_112720814 | 10.45 |
BC006965 |
cDNA sequence BC006965 |
9309 |
0.26 |
| chr1_189985650_189985801 | 10.43 |
Smyd2 |
SET and MYND domain containing 2 |
63362 |
0.11 |
| chr2_153680788_153680939 | 10.42 |
Dnmt3b |
DNA methyltransferase 3B |
11493 |
0.15 |
| chr11_8510326_8510660 | 10.27 |
Tns3 |
tensin 3 |
34858 |
0.23 |
| chr2_168105310_168105473 | 10.24 |
AL831766.1 |
breast carcinoma amplified sequence 4 (BCAS4) pseudogene |
9486 |
0.13 |
| chr17_85025573_85025724 | 10.20 |
Slc3a1 |
solute carrier family 3, member 1 |
2728 |
0.26 |
| chr1_4810604_4810755 | 10.19 |
Lypla1 |
lysophospholipase 1 |
2442 |
0.17 |
| chr8_120475161_120475434 | 10.10 |
Gse1 |
genetic suppressor element 1, coiled-coil protein |
13150 |
0.15 |
| chr6_51178100_51178499 | 10.09 |
Mir148a |
microRNA 148a |
91611 |
0.08 |
| chr1_190928111_190928332 | 10.08 |
Angel2 |
angel homolog 2 |
271 |
0.89 |
| chr2_72179925_72180079 | 10.05 |
Rapgef4 |
Rap guanine nucleotide exchange factor (GEF) 4 |
309 |
0.9 |
| chr12_62769651_62769802 | 10.03 |
Tspyl-ps |
testis-specific protein, Y-encoded-like, pseudogene |
65450 |
0.1 |
| chr17_25886958_25887109 | 9.96 |
Wfikkn1 |
WAP, FS, Ig, KU, and NTR-containing protein 1 |
6175 |
0.06 |
| chr2_32361053_32361204 | 9.94 |
Ciz1 |
CDKN1A interacting zinc finger protein 1 |
1882 |
0.17 |
| chr17_74489622_74490192 | 9.88 |
Yipf4 |
Yip1 domain family, member 4 |
29 |
0.97 |
| chr6_67034912_67035078 | 9.78 |
E230016M11Rik |
RIKEN cDNA E230016M11 gene |
1604 |
0.23 |
| chr13_28925838_28925989 | 9.78 |
Gm34639 |
predicted gene, 34639 |
27237 |
0.15 |
| chr16_97643859_97644010 | 9.77 |
Tmprss2 |
transmembrane protease, serine 2 |
32739 |
0.17 |
| chr12_4837063_4837214 | 9.76 |
Fkbp1b |
FK506 binding protein 1b |
4297 |
0.12 |
| chr7_81587259_81587432 | 9.74 |
Gm45698 |
predicted gene 45698 |
3549 |
0.13 |
| chr8_68038798_68038949 | 9.72 |
Psd3 |
pleckstrin and Sec7 domain containing 3 |
23354 |
0.2 |
| chr17_84895487_84895638 | 9.71 |
Gm49982 |
predicted gene, 49982 |
7007 |
0.18 |
| chr11_110101531_110101687 | 9.62 |
Abca8a |
ATP-binding cassette, sub-family A (ABC1), member 8a |
5631 |
0.27 |
| chr16_38432871_38433026 | 9.62 |
Pla1a |
phospholipase A1 member A |
197 |
0.91 |
| chr8_23167432_23167862 | 9.59 |
Gpat4 |
glycerol-3-phosphate acyltransferase 4 |
12580 |
0.1 |
| chr1_87779270_87779454 | 9.56 |
Atg16l1 |
autophagy related 16-like 1 (S. cerevisiae) |
904 |
0.43 |
| chr3_36606488_36606678 | 9.54 |
Bbs7 |
Bardet-Biedl syndrome 7 (human) |
6702 |
0.15 |
| chr10_76576116_76576382 | 9.53 |
Ftcd |
formiminotransferase cyclodeaminase |
597 |
0.61 |
| chr4_139179928_139180623 | 9.52 |
Gm16287 |
predicted gene 16287 |
380 |
0.82 |
| chr5_51591998_51592180 | 9.51 |
Ppargc1a |
peroxisome proliferative activated receptor, gamma, coactivator 1 alpha |
24363 |
0.21 |
| chr8_46750506_46750809 | 9.49 |
Irf2 |
interferon regulatory factor 2 |
10391 |
0.14 |
| chr6_82088207_82088404 | 9.48 |
Gm15864 |
predicted gene 15864 |
35724 |
0.14 |
| chr7_144040361_144040517 | 9.44 |
Shank2 |
SH3 and multiple ankyrin repeat domains 2 |
9175 |
0.21 |
| chr13_51991454_51991605 | 9.43 |
Gm26651 |
predicted gene, 26651 |
18315 |
0.2 |
| chr5_8928690_8928841 | 9.42 |
Abcb4 |
ATP-binding cassette, sub-family B (MDR/TAP), member 4 |
39 |
0.97 |
| chr6_5287440_5287910 | 9.42 |
Pon2 |
paraoxonase 2 |
1393 |
0.4 |
| chr15_7160278_7160429 | 9.32 |
Lifr |
LIF receptor alpha |
6000 |
0.29 |
| chr1_185731219_185731388 | 9.32 |
Gm38093 |
predicted gene, 38093 |
13500 |
0.27 |
| chr3_9020250_9020401 | 9.32 |
Tpd52 |
tumor protein D52 |
15602 |
0.17 |
| chr9_61379334_61379499 | 9.30 |
Tle3 |
transducin-like enhancer of split 3 |
3887 |
0.22 |
| chr4_123968744_123968901 | 9.28 |
Gm12902 |
predicted gene 12902 |
42588 |
0.1 |
| chr12_71932516_71932675 | 9.27 |
Daam1 |
dishevelled associated activator of morphogenesis 1 |
42865 |
0.15 |
| chr7_68917182_68917333 | 9.25 |
Gm34664 |
predicted gene, 34664 |
1241 |
0.53 |
| chr19_53247701_53247859 | 9.18 |
1700001K23Rik |
RIKEN cDNA 1700001K23 gene |
7410 |
0.16 |
| chr16_21359520_21359922 | 9.14 |
Magef1 |
melanoma antigen family F, 1 |
26365 |
0.17 |
| chr12_80103218_80103381 | 9.13 |
Zfp36l1 |
zinc finger protein 36, C3H type-like 1 |
9695 |
0.12 |
| chr6_143530796_143531033 | 9.11 |
4930579D09Rik |
RIKEN cDNA 4930579D09 gene |
4594 |
0.3 |
| chr16_77029757_77029908 | 9.08 |
Usp25 |
ubiquitin specific peptidase 25 |
16045 |
0.21 |
| chr3_130689587_130689738 | 9.05 |
Ostc |
oligosaccharyltransferase complex subunit (non-catalytic) |
6960 |
0.14 |
| chr3_66576634_66576949 | 9.03 |
Gm17952 |
predicted gene, 17952 |
13240 |
0.29 |
| chr2_163506695_163506887 | 9.02 |
Hnf4a |
hepatic nuclear factor 4, alpha |
17 |
0.96 |
| chr2_129226173_129226353 | 9.02 |
9830144P21Rik |
RIKEN cDNA 9830144P21 gene |
175 |
0.88 |
| chr15_59830971_59831141 | 9.00 |
Gm19510 |
predicted gene, 19510 |
36097 |
0.19 |
| chr4_134813985_134814148 | 9.00 |
Maco1 |
macoilin 1 |
2853 |
0.26 |
| chr4_109467814_109467980 | 8.99 |
Rnf11 |
ring finger protein 11 |
8778 |
0.18 |
| chr3_87540142_87540293 | 8.93 |
ETV3L |
ets variant 3-like |
9882 |
0.16 |
| chr18_36802121_36802422 | 8.90 |
Zmat2 |
zinc finger, matrin type 2 |
6516 |
0.09 |
| chr5_52828071_52828225 | 8.87 |
Anapc4 |
anaphase promoting complex subunit 4 |
5864 |
0.21 |
| chr13_113168382_113168574 | 8.86 |
Gzmk |
granzyme K |
12419 |
0.12 |
| chr19_39741029_39741187 | 8.84 |
Cyp2c68 |
cytochrome P450, family 2, subfamily c, polypeptide 68 |
54 |
0.98 |
| chr4_103934476_103934627 | 8.78 |
Gm12719 |
predicted gene 12719 |
4990 |
0.26 |
| chr2_166246513_166246665 | 8.72 |
Gm11468 |
predicted gene 11468 |
27319 |
0.15 |
| chr15_97036057_97036208 | 8.69 |
Slc38a4 |
solute carrier family 38, member 4 |
4921 |
0.31 |
| chr16_94508853_94509130 | 8.66 |
Vps26c |
VPS26 endosomal protein sorting factor C |
4604 |
0.19 |
| chrX_113160621_113160772 | 8.65 |
Chm |
choroidermia (RAB escort protein 1) |
24813 |
0.2 |
| chr4_137304908_137305141 | 8.63 |
Gm25772 |
predicted gene, 25772 |
20535 |
0.13 |
| chr13_37870255_37870420 | 8.63 |
Rreb1 |
ras responsive element binding protein 1 |
12403 |
0.21 |
| chr4_141513884_141514158 | 8.61 |
Spen |
spen family transcription repressor |
2888 |
0.19 |
| chr17_45972288_45972439 | 8.60 |
Gm49805 |
predicted gene, 49805 |
10504 |
0.18 |
| chr10_80423982_80424244 | 8.58 |
Tcf3 |
transcription factor 3 |
2253 |
0.14 |
| chr3_60167575_60168076 | 8.54 |
Gm24382 |
predicted gene, 24382 |
40078 |
0.17 |
| chr4_150853712_150854009 | 8.52 |
Errfi1 |
ERBB receptor feedback inhibitor 1 |
59 |
0.94 |
| chr12_84304058_84304308 | 8.51 |
Zfp410 |
zinc finger protein 410 |
12669 |
0.11 |
| chr7_118699015_118699188 | 8.48 |
Gde1 |
glycerophosphodiester phosphodiesterase 1 |
6279 |
0.13 |
| chr10_87546434_87546625 | 8.46 |
Pah |
phenylalanine hydroxylase |
144 |
0.97 |
| chr17_45702413_45702591 | 8.43 |
Mrpl14 |
mitochondrial ribosomal protein L14 |
7086 |
0.12 |
| chr7_14438643_14438820 | 8.42 |
Sult2a8 |
sulfotransferase family 2A, dehydroepiandrosterone (DHEA)-preferring, member 8 |
170 |
0.94 |
| chr1_43485316_43485471 | 8.39 |
Gm37536 |
predicted gene, 37536 |
3054 |
0.27 |
| chr9_21225095_21225659 | 8.39 |
Gm16754 |
predicted gene, 16754 |
6 |
0.95 |
| chr1_85597937_85598178 | 8.32 |
Sp110 |
Sp110 nuclear body protein |
692 |
0.42 |
| chr5_90414232_90414383 | 8.31 |
Gm43363 |
predicted gene 43363 |
17034 |
0.15 |
| chr17_28761774_28761925 | 8.28 |
Mapk13 |
mitogen-activated protein kinase 13 |
7448 |
0.12 |
| chr5_15019515_15019782 | 8.21 |
Gm17019 |
predicted gene 17019 |
13350 |
0.22 |
| chr1_178330123_178330310 | 8.19 |
Hnrnpu |
heterogeneous nuclear ribonucleoprotein U |
104 |
0.94 |
| chr15_83523977_83524208 | 8.16 |
Bik |
BCL2-interacting killer |
2770 |
0.16 |
| chr6_41044425_41044576 | 8.16 |
2210010C04Rik |
RIKEN cDNA 2210010C04 gene |
8991 |
0.07 |
| chr8_109579830_109579981 | 8.13 |
Hp |
haptoglobin |
733 |
0.57 |
| chr7_4630674_4630889 | 8.13 |
Tmem86b |
transmembrane protein 86B |
299 |
0.74 |
| chr9_89606103_89606254 | 8.09 |
Minar1 |
membrane integral NOTCH2 associated receptor 1 |
2787 |
0.26 |
| chr3_19962855_19963059 | 8.09 |
Cp |
ceruloplasmin |
5673 |
0.19 |
| chr16_92712536_92712713 | 8.04 |
Runx1 |
runt related transcription factor 1 |
15296 |
0.25 |
| chr9_35127680_35127831 | 7.98 |
St3gal4 |
ST3 beta-galactoside alpha-2,3-sialyltransferase 4 |
8487 |
0.13 |
| chr7_103909517_103909932 | 7.97 |
Olfr65 |
olfactory receptor 65 |
3382 |
0.08 |
| chr7_49525114_49525265 | 7.95 |
Nav2 |
neuron navigator 2 |
23003 |
0.22 |
| chr16_32610917_32611081 | 7.94 |
Tfrc |
transferrin receptor |
1749 |
0.28 |
| chr18_8966820_8967020 | 7.91 |
Gm7523 |
predicted gene 7523 |
824 |
0.71 |
| chr17_27056546_27056697 | 7.90 |
Itpr3 |
inositol 1,4,5-triphosphate receptor 3 |
683 |
0.5 |
| chr1_184645271_184645605 | 7.90 |
Gm37800 |
predicted gene, 37800 |
15965 |
0.15 |
| chr11_30210200_30210515 | 7.90 |
Sptbn1 |
spectrin beta, non-erythrocytic 1 |
9415 |
0.25 |
| chr12_76580414_76580565 | 7.87 |
Sptb |
spectrin beta, erythrocytic |
3597 |
0.19 |
| chr19_42722452_42722956 | 7.81 |
Gm25216 |
predicted gene, 25216 |
22802 |
0.13 |
| chr6_51272464_51272626 | 7.80 |
Mir148a |
microRNA 148a |
2635 |
0.3 |
| chr8_84970733_84970960 | 7.77 |
Prdx2 |
peroxiredoxin 2 |
607 |
0.36 |
| chr3_154193534_154193819 | 7.76 |
Slc44a5 |
solute carrier family 44, member 5 |
28806 |
0.16 |
| chr13_100863631_100863783 | 7.72 |
Gm37830 |
predicted gene, 37830 |
9073 |
0.14 |
| chr8_26349980_26350131 | 7.71 |
Gm31784 |
predicted gene, 31784 |
37721 |
0.12 |
| chr1_67221438_67221589 | 7.69 |
Gm15668 |
predicted gene 15668 |
27687 |
0.19 |
| chr17_34455911_34456062 | 7.67 |
BC051142 |
cDNA sequence BC051142 |
1592 |
0.2 |
| chr6_6149833_6150198 | 7.67 |
Slc25a13 |
solute carrier family 25 (mitochondrial carrier, adenine nucleotide translocator), member 13 |
23936 |
0.23 |
| chr14_122901322_122901473 | 7.67 |
4930594M22Rik |
RIKEN cDNA 4930594M22 gene |
11633 |
0.16 |
| chr8_89097539_89097690 | 7.67 |
Gm6625 |
predicted gene 6625 |
49444 |
0.14 |
| chr3_98917143_98917294 | 7.60 |
Hao2 |
hydroxyacid oxidase 2 |
23979 |
0.12 |
| chr2_131235176_131235354 | 7.59 |
Mavs |
mitochondrial antiviral signaling protein |
1160 |
0.34 |
| chr5_137674858_137675009 | 7.57 |
Agfg2 |
ArfGAP with FG repeats 2 |
9747 |
0.08 |
| chr11_79281404_79281715 | 7.57 |
Gm44787 |
predicted gene 44787 |
7666 |
0.16 |
| chr2_152808203_152808632 | 7.57 |
Bcl2l1 |
BCL2-like 1 |
20118 |
0.11 |
| chr9_57071901_57072093 | 7.56 |
Gm10658 |
predicted gene 10658 |
31 |
0.5 |
| chr6_114897295_114897446 | 7.56 |
Vgll4 |
vestigial like family member 4 |
22263 |
0.19 |
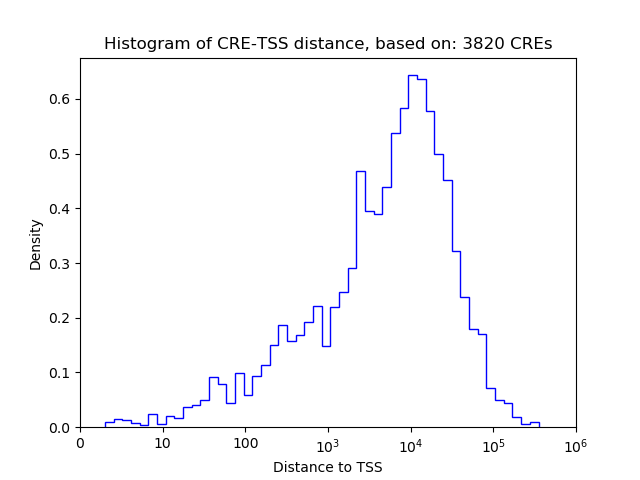
Histogram of CRE-TSS distances for CREs targeted by :
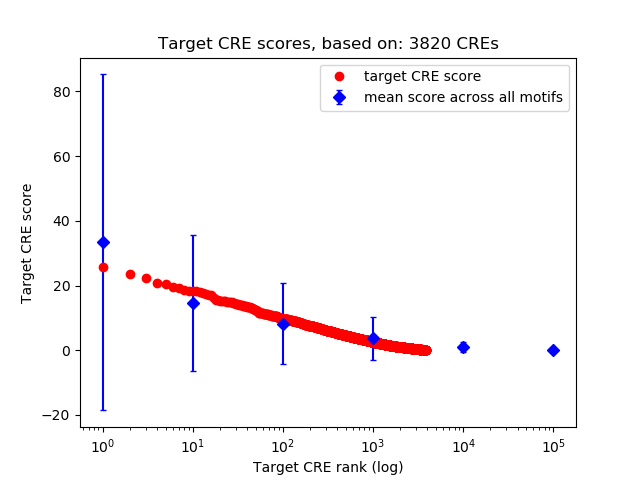
Rank distribution of CRE target scores:
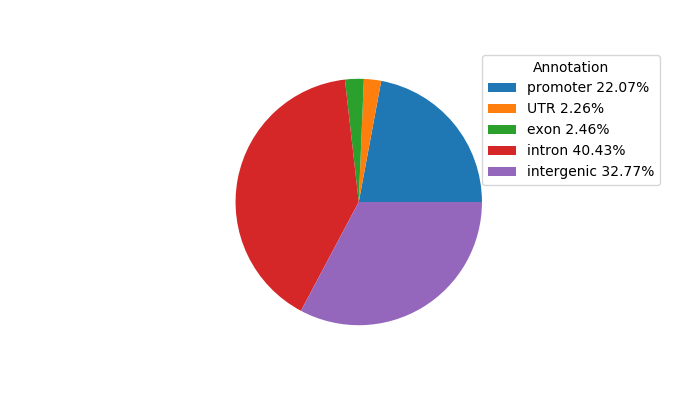
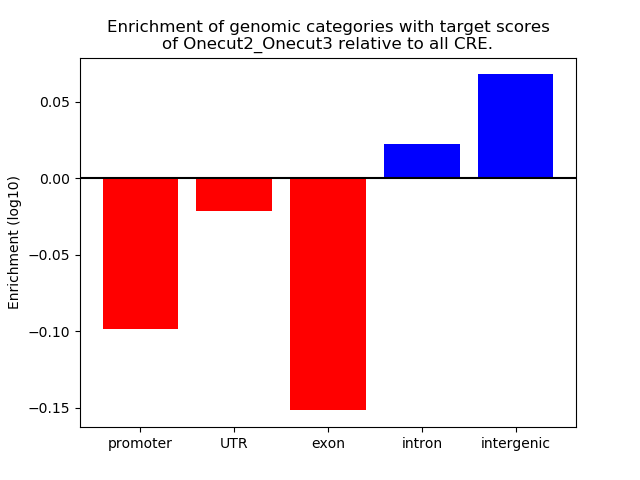
Distribution of target CREs across different genomic regions:
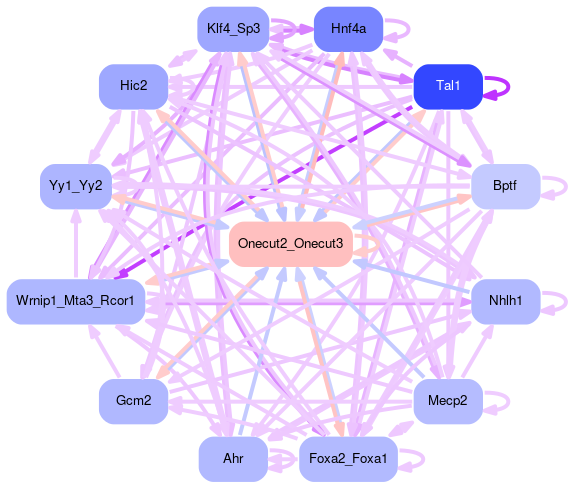
Network of associatons between targets according to the STRING database.

Gene Ontology Analysis
Gene overrepresentation in biological process category:
| Log-likelihood per target | Total log-likelihood | Term | Description |
|---|---|---|---|
| 4.2 | 12.5 | GO:0045472 | response to ether(GO:0045472) |
| 3.0 | 12.1 | GO:0033159 | negative regulation of protein import into nucleus, translocation(GO:0033159) |
| 2.9 | 14.5 | GO:0071918 | urea transmembrane transport(GO:0071918) |
| 2.6 | 15.9 | GO:1902222 | L-phenylalanine catabolic process(GO:0006559) erythrose 4-phosphate/phosphoenolpyruvate family amino acid catabolic process(GO:1902222) |
| 2.5 | 12.3 | GO:0010612 | regulation of cardiac muscle adaptation(GO:0010612) regulation of cardiac muscle hypertrophy in response to stress(GO:1903242) |
| 2.2 | 6.6 | GO:0010911 | regulation of isomerase activity(GO:0010911) positive regulation of isomerase activity(GO:0010912) |
| 2.0 | 6.1 | GO:0000432 | regulation of transcription from RNA polymerase II promoter by glucose(GO:0000430) positive regulation of transcription from RNA polymerase II promoter by glucose(GO:0000432) |
| 2.0 | 10.2 | GO:0051987 | positive regulation of attachment of spindle microtubules to kinetochore(GO:0051987) |
| 2.0 | 5.9 | GO:1903690 | negative regulation of wound healing, spreading of epidermal cells(GO:1903690) |
| 1.9 | 9.7 | GO:0052805 | histidine catabolic process(GO:0006548) imidazole-containing compound catabolic process(GO:0052805) |
| 1.8 | 5.5 | GO:0052203 | modulation of catalytic activity in other organism involved in symbiotic interaction(GO:0052203) modulation by host of symbiont catalytic activity(GO:0052422) |
| 1.8 | 5.3 | GO:0034395 | regulation of transcription from RNA polymerase II promoter in response to iron(GO:0034395) |
| 1.6 | 4.9 | GO:0030951 | establishment or maintenance of microtubule cytoskeleton polarity(GO:0030951) |
| 1.6 | 10.9 | GO:1900246 | positive regulation of RIG-I signaling pathway(GO:1900246) |
| 1.5 | 6.1 | GO:0031860 | telomeric 3' overhang formation(GO:0031860) |
| 1.4 | 4.3 | GO:1901097 | negative regulation of autophagosome maturation(GO:1901097) |
| 1.4 | 4.2 | GO:1901420 | negative regulation of response to alcohol(GO:1901420) |
| 1.4 | 4.2 | GO:2000346 | negative regulation of hepatocyte proliferation(GO:2000346) |
| 1.4 | 5.5 | GO:0044034 | negative stranded viral RNA replication(GO:0039689) multi-organism biosynthetic process(GO:0044034) |
| 1.3 | 9.2 | GO:0098908 | regulation of neuronal action potential(GO:0098908) |
| 1.3 | 1.3 | GO:0001732 | formation of cytoplasmic translation initiation complex(GO:0001732) |
| 1.2 | 5.0 | GO:0046499 | S-adenosylmethioninamine metabolic process(GO:0046499) |
| 1.2 | 2.5 | GO:0060125 | negative regulation of growth hormone secretion(GO:0060125) |
| 1.2 | 2.5 | GO:1903689 | regulation of wound healing, spreading of epidermal cells(GO:1903689) |
| 1.2 | 3.7 | GO:0061470 | T follicular helper cell differentiation(GO:0061470) |
| 1.2 | 1.2 | GO:0071947 | protein deubiquitination involved in ubiquitin-dependent protein catabolic process(GO:0071947) |
| 1.2 | 3.6 | GO:0009051 | pentose-phosphate shunt, oxidative branch(GO:0009051) |
| 1.2 | 3.6 | GO:0043974 | histone H3-K27 acetylation(GO:0043974) regulation of histone H3-K27 acetylation(GO:1901674) |
| 1.2 | 4.8 | GO:0010727 | negative regulation of hydrogen peroxide metabolic process(GO:0010727) |
| 1.2 | 13.1 | GO:0016540 | protein autoprocessing(GO:0016540) |
| 1.2 | 5.9 | GO:2001171 | positive regulation of ATP biosynthetic process(GO:2001171) |
| 1.2 | 5.8 | GO:0046485 | ether lipid metabolic process(GO:0046485) |
| 1.2 | 6.9 | GO:0002457 | T cell antigen processing and presentation(GO:0002457) |
| 1.1 | 3.4 | GO:0061209 | cell proliferation involved in mesonephros development(GO:0061209) |
| 1.1 | 2.2 | GO:2000017 | positive regulation of determination of dorsal identity(GO:2000017) |
| 1.1 | 4.3 | GO:0046125 | pyrimidine deoxyribonucleoside metabolic process(GO:0046125) |
| 1.1 | 2.1 | GO:0007597 | blood coagulation, intrinsic pathway(GO:0007597) |
| 1.0 | 5.2 | GO:0061158 | 3'-UTR-mediated mRNA destabilization(GO:0061158) |
| 1.0 | 3.1 | GO:0043321 | regulation of natural killer cell degranulation(GO:0043321) |
| 1.0 | 13.3 | GO:0070935 | 3'-UTR-mediated mRNA stabilization(GO:0070935) |
| 1.0 | 1.0 | GO:0060154 | cellular process regulating host cell cycle in response to virus(GO:0060154) |
| 1.0 | 3.0 | GO:0071336 | regulation of hair follicle cell proliferation(GO:0071336) |
| 1.0 | 4.0 | GO:0000960 | mitochondrial RNA catabolic process(GO:0000957) regulation of mitochondrial RNA catabolic process(GO:0000960) |
| 1.0 | 5.8 | GO:0006477 | protein sulfation(GO:0006477) |
| 1.0 | 3.8 | GO:0001907 | killing by symbiont of host cells(GO:0001907) disruption by symbiont of host cell(GO:0044004) |
| 1.0 | 3.8 | GO:0061724 | lipophagy(GO:0061724) |
| 1.0 | 1.0 | GO:0032986 | nucleosome disassembly(GO:0006337) protein-DNA complex disassembly(GO:0032986) |
| 0.9 | 2.8 | GO:0002536 | respiratory burst involved in inflammatory response(GO:0002536) |
| 0.9 | 2.8 | GO:0016554 | cytidine to uridine editing(GO:0016554) |
| 0.9 | 3.6 | GO:2000741 | positive regulation of mesenchymal stem cell differentiation(GO:2000741) |
| 0.9 | 1.8 | GO:0003340 | negative regulation of mesenchymal to epithelial transition involved in metanephros morphogenesis(GO:0003340) |
| 0.9 | 3.6 | GO:2000659 | regulation of interleukin-1-mediated signaling pathway(GO:2000659) |
| 0.9 | 5.4 | GO:0051574 | positive regulation of histone H3-K9 methylation(GO:0051574) |
| 0.9 | 2.7 | GO:0043490 | malate-aspartate shuttle(GO:0043490) |
| 0.9 | 2.7 | GO:0030997 | regulation of centriole-centriole cohesion(GO:0030997) |
| 0.9 | 4.4 | GO:0060023 | soft palate development(GO:0060023) |
| 0.9 | 5.2 | GO:0075522 | IRES-dependent viral translational initiation(GO:0075522) |
| 0.9 | 2.6 | GO:0035524 | proline transmembrane transport(GO:0035524) |
| 0.9 | 3.4 | GO:0006499 | N-terminal protein myristoylation(GO:0006499) |
| 0.8 | 2.5 | GO:1902065 | response to L-glutamate(GO:1902065) |
| 0.8 | 4.9 | GO:0061042 | vascular wound healing(GO:0061042) |
| 0.8 | 7.4 | GO:0032000 | positive regulation of fatty acid beta-oxidation(GO:0032000) |
| 0.8 | 2.5 | GO:0035461 | vitamin transmembrane transport(GO:0035461) |
| 0.8 | 3.3 | GO:0071712 | ER-associated misfolded protein catabolic process(GO:0071712) |
| 0.8 | 2.4 | GO:1900060 | negative regulation of sphingolipid biosynthetic process(GO:0090155) cellular sphingolipid homeostasis(GO:0090156) negative regulation of ceramide biosynthetic process(GO:1900060) |
| 0.8 | 4.9 | GO:0042985 | negative regulation of amyloid precursor protein biosynthetic process(GO:0042985) |
| 0.8 | 30.4 | GO:0006953 | acute-phase response(GO:0006953) |
| 0.8 | 1.6 | GO:0021564 | vagus nerve development(GO:0021564) |
| 0.8 | 0.8 | GO:0051572 | negative regulation of histone H3-K4 methylation(GO:0051572) |
| 0.8 | 2.4 | GO:0002838 | negative regulation of response to tumor cell(GO:0002835) negative regulation of immune response to tumor cell(GO:0002838) |
| 0.8 | 2.3 | GO:0061010 | gall bladder development(GO:0061010) |
| 0.8 | 0.8 | GO:0007228 | positive regulation of hh target transcription factor activity(GO:0007228) |
| 0.8 | 3.1 | GO:0051031 | tRNA transport(GO:0051031) |
| 0.8 | 1.5 | GO:0042983 | amyloid precursor protein biosynthetic process(GO:0042983) regulation of amyloid precursor protein biosynthetic process(GO:0042984) |
| 0.8 | 2.3 | GO:0060375 | regulation of mast cell differentiation(GO:0060375) |
| 0.8 | 0.8 | GO:0032910 | transforming growth factor beta3 production(GO:0032907) regulation of transforming growth factor beta3 production(GO:0032910) |
| 0.8 | 2.3 | GO:0051562 | negative regulation of mitochondrial calcium ion concentration(GO:0051562) |
| 0.7 | 2.2 | GO:0010535 | positive regulation of activation of JAK2 kinase activity(GO:0010535) |
| 0.7 | 1.4 | GO:0032929 | negative regulation of superoxide anion generation(GO:0032929) |
| 0.7 | 4.3 | GO:0070327 | thyroid hormone transport(GO:0070327) |
| 0.7 | 4.2 | GO:0050917 | sensory perception of umami taste(GO:0050917) |
| 0.7 | 5.6 | GO:0030300 | regulation of intestinal cholesterol absorption(GO:0030300) |
| 0.7 | 2.7 | GO:0060754 | positive regulation of mast cell chemotaxis(GO:0060754) |
| 0.7 | 2.0 | GO:1903232 | melanosome assembly(GO:1903232) |
| 0.7 | 15.2 | GO:0030574 | collagen catabolic process(GO:0030574) |
| 0.7 | 2.0 | GO:0048861 | leukemia inhibitory factor signaling pathway(GO:0048861) |
| 0.7 | 3.9 | GO:0071557 | histone H3-K27 demethylation(GO:0071557) |
| 0.6 | 4.5 | GO:0060613 | fat pad development(GO:0060613) |
| 0.6 | 1.9 | GO:1902109 | negative regulation of mitochondrial membrane permeability involved in apoptotic process(GO:1902109) |
| 0.6 | 1.9 | GO:1903898 | negative regulation of PERK-mediated unfolded protein response(GO:1903898) |
| 0.6 | 1.9 | GO:1904694 | negative regulation of vascular smooth muscle contraction(GO:1904694) |
| 0.6 | 1.9 | GO:0032346 | positive regulation of aldosterone metabolic process(GO:0032346) positive regulation of aldosterone biosynthetic process(GO:0032349) |
| 0.6 | 1.9 | GO:0046341 | CDP-diacylglycerol metabolic process(GO:0046341) |
| 0.6 | 1.8 | GO:0019676 | ammonia assimilation cycle(GO:0019676) |
| 0.6 | 1.2 | GO:0001543 | ovarian follicle rupture(GO:0001543) |
| 0.6 | 2.4 | GO:0034372 | very-low-density lipoprotein particle remodeling(GO:0034372) |
| 0.6 | 2.4 | GO:0046013 | regulation of T cell homeostatic proliferation(GO:0046013) |
| 0.6 | 2.4 | GO:2001268 | negative regulation of cysteine-type endopeptidase activity involved in apoptotic signaling pathway(GO:2001268) |
| 0.6 | 2.9 | GO:0031584 | activation of phospholipase D activity(GO:0031584) |
| 0.6 | 1.7 | GO:0046391 | 5-phosphoribose 1-diphosphate biosynthetic process(GO:0006015) 5-phosphoribose 1-diphosphate metabolic process(GO:0046391) |
| 0.6 | 1.2 | GO:0045658 | regulation of neutrophil differentiation(GO:0045658) |
| 0.6 | 5.2 | GO:0045717 | negative regulation of fatty acid biosynthetic process(GO:0045717) |
| 0.6 | 1.7 | GO:0006393 | termination of mitochondrial transcription(GO:0006393) |
| 0.6 | 0.6 | GO:0010694 | positive regulation of alkaline phosphatase activity(GO:0010694) |
| 0.6 | 1.1 | GO:2000705 | regulation of dense core granule biogenesis(GO:2000705) |
| 0.6 | 2.8 | GO:0006207 | 'de novo' pyrimidine nucleobase biosynthetic process(GO:0006207) pyrimidine nucleobase biosynthetic process(GO:0019856) |
| 0.6 | 1.7 | GO:0042851 | L-alanine metabolic process(GO:0042851) |
| 0.6 | 6.6 | GO:0045899 | positive regulation of RNA polymerase II transcriptional preinitiation complex assembly(GO:0045899) |
| 0.5 | 3.3 | GO:0015671 | oxygen transport(GO:0015671) |
| 0.5 | 1.1 | GO:0090360 | platelet-derived growth factor production(GO:0090360) regulation of platelet-derived growth factor production(GO:0090361) |
| 0.5 | 3.3 | GO:0006729 | tetrahydrobiopterin biosynthetic process(GO:0006729) |
| 0.5 | 17.4 | GO:1903146 | regulation of mitophagy(GO:1903146) |
| 0.5 | 1.1 | GO:0090241 | negative regulation of histone H4 acetylation(GO:0090241) |
| 0.5 | 15.7 | GO:0019373 | epoxygenase P450 pathway(GO:0019373) |
| 0.5 | 2.2 | GO:0021938 | smoothened signaling pathway involved in regulation of cerebellar granule cell precursor cell proliferation(GO:0021938) |
| 0.5 | 1.6 | GO:1903423 | positive regulation of synaptic vesicle recycling(GO:1903423) |
| 0.5 | 2.7 | GO:0090400 | stress-induced premature senescence(GO:0090400) |
| 0.5 | 2.7 | GO:0050882 | voluntary musculoskeletal movement(GO:0050882) |
| 0.5 | 4.3 | GO:0030644 | cellular chloride ion homeostasis(GO:0030644) |
| 0.5 | 3.2 | GO:0070245 | positive regulation of thymocyte apoptotic process(GO:0070245) |
| 0.5 | 1.1 | GO:0019859 | pyrimidine nucleobase catabolic process(GO:0006208) thymine catabolic process(GO:0006210) thymine metabolic process(GO:0019859) |
| 0.5 | 5.8 | GO:0030575 | nuclear body organization(GO:0030575) |
| 0.5 | 3.7 | GO:0001731 | formation of translation preinitiation complex(GO:0001731) |
| 0.5 | 1.6 | GO:0032513 | negative regulation of protein phosphatase type 2B activity(GO:0032513) |
| 0.5 | 2.1 | GO:0060681 | branch elongation involved in ureteric bud branching(GO:0060681) |
| 0.5 | 1.5 | GO:0072531 | pyrimidine-containing compound transmembrane transport(GO:0072531) |
| 0.5 | 4.5 | GO:0051382 | kinetochore assembly(GO:0051382) |
| 0.5 | 2.0 | GO:0097039 | protein linear polyubiquitination(GO:0097039) |
| 0.5 | 2.9 | GO:0045908 | negative regulation of vasodilation(GO:0045908) |
| 0.5 | 1.5 | GO:0090154 | positive regulation of sphingolipid biosynthetic process(GO:0090154) positive regulation of ceramide biosynthetic process(GO:2000304) |
| 0.5 | 2.4 | GO:0051204 | protein insertion into mitochondrial membrane(GO:0051204) |
| 0.5 | 1.0 | GO:0048290 | isotype switching to IgA isotypes(GO:0048290) regulation of isotype switching to IgA isotypes(GO:0048296) |
| 0.5 | 1.4 | GO:0032439 | endosome localization(GO:0032439) |
| 0.5 | 1.4 | GO:0045218 | zonula adherens maintenance(GO:0045218) |
| 0.5 | 4.7 | GO:0035563 | positive regulation of chromatin binding(GO:0035563) |
| 0.5 | 1.4 | GO:0006686 | sphingomyelin biosynthetic process(GO:0006686) |
| 0.5 | 2.8 | GO:0039529 | RIG-I signaling pathway(GO:0039529) |
| 0.5 | 1.4 | GO:0001920 | negative regulation of receptor recycling(GO:0001920) |
| 0.5 | 0.5 | GO:1900020 | regulation of protein kinase C activity(GO:1900019) positive regulation of protein kinase C activity(GO:1900020) |
| 0.5 | 4.6 | GO:0070050 | neuron cellular homeostasis(GO:0070050) |
| 0.5 | 0.5 | GO:0003330 | regulation of extracellular matrix constituent secretion(GO:0003330) positive regulation of extracellular matrix constituent secretion(GO:0003331) |
| 0.5 | 1.4 | GO:2001180 | negative regulation of interleukin-10 secretion(GO:2001180) |
| 0.5 | 0.9 | GO:0010989 | negative regulation of low-density lipoprotein particle clearance(GO:0010989) |
| 0.5 | 1.4 | GO:0002125 | maternal aggressive behavior(GO:0002125) |
| 0.5 | 0.9 | GO:0061643 | chemorepulsion of axon(GO:0061643) |
| 0.4 | 0.9 | GO:2000015 | regulation of determination of dorsal identity(GO:2000015) |
| 0.4 | 3.1 | GO:0032534 | regulation of microvillus assembly(GO:0032534) |
| 0.4 | 3.1 | GO:0032790 | ribosome disassembly(GO:0032790) |
| 0.4 | 1.8 | GO:0043562 | cellular response to nitrogen starvation(GO:0006995) cellular response to nitrogen levels(GO:0043562) |
| 0.4 | 2.6 | GO:0006384 | transcription initiation from RNA polymerase III promoter(GO:0006384) |
| 0.4 | 2.2 | GO:0018101 | protein citrullination(GO:0018101) |
| 0.4 | 0.4 | GO:0070875 | positive regulation of glycogen metabolic process(GO:0070875) |
| 0.4 | 0.4 | GO:0090230 | regulation of centromere complex assembly(GO:0090230) |
| 0.4 | 3.1 | GO:0071257 | cellular response to electrical stimulus(GO:0071257) |
| 0.4 | 6.6 | GO:0015721 | bile acid and bile salt transport(GO:0015721) |
| 0.4 | 8.2 | GO:0071108 | protein K48-linked deubiquitination(GO:0071108) |
| 0.4 | 1.7 | GO:0042997 | negative regulation of Golgi to plasma membrane protein transport(GO:0042997) |
| 0.4 | 3.4 | GO:0022027 | interkinetic nuclear migration(GO:0022027) |
| 0.4 | 1.7 | GO:1902474 | positive regulation of protein localization to synapse(GO:1902474) |
| 0.4 | 2.1 | GO:0030174 | regulation of DNA-dependent DNA replication initiation(GO:0030174) |
| 0.4 | 0.4 | GO:0018904 | ether metabolic process(GO:0018904) |
| 0.4 | 1.2 | GO:0002071 | glandular epithelial cell maturation(GO:0002071) |
| 0.4 | 1.2 | GO:0038028 | insulin receptor signaling pathway via phosphatidylinositol 3-kinase(GO:0038028) |
| 0.4 | 2.5 | GO:0000972 | transcription-dependent tethering of RNA polymerase II gene DNA at nuclear periphery(GO:0000972) |
| 0.4 | 0.8 | GO:1903223 | positive regulation of oxidative stress-induced neuron death(GO:1903223) |
| 0.4 | 1.6 | GO:0044314 | protein K27-linked ubiquitination(GO:0044314) |
| 0.4 | 1.2 | GO:1900108 | negative regulation of nodal signaling pathway(GO:1900108) |
| 0.4 | 1.6 | GO:0061302 | smooth muscle cell-matrix adhesion(GO:0061302) |
| 0.4 | 2.0 | GO:0007182 | common-partner SMAD protein phosphorylation(GO:0007182) |
| 0.4 | 0.8 | GO:0060468 | prevention of polyspermy(GO:0060468) |
| 0.4 | 1.6 | GO:0006570 | tyrosine metabolic process(GO:0006570) |
| 0.4 | 1.2 | GO:0006768 | biotin metabolic process(GO:0006768) |
| 0.4 | 0.4 | GO:0060448 | dichotomous subdivision of terminal units involved in lung branching(GO:0060448) |
| 0.4 | 0.4 | GO:2000338 | chemokine (C-X-C motif) ligand 1 production(GO:0072566) regulation of chemokine (C-X-C motif) ligand 1 production(GO:2000338) |
| 0.4 | 3.1 | GO:0042448 | progesterone metabolic process(GO:0042448) |
| 0.4 | 1.2 | GO:0071638 | negative regulation of monocyte chemotactic protein-1 production(GO:0071638) |
| 0.4 | 0.8 | GO:0045347 | negative regulation of MHC class II biosynthetic process(GO:0045347) |
| 0.4 | 0.4 | GO:0034197 | acylglycerol transport(GO:0034196) triglyceride transport(GO:0034197) |
| 0.4 | 1.1 | GO:1900825 | regulation of membrane depolarization during cardiac muscle cell action potential(GO:1900825) |
| 0.4 | 2.2 | GO:0010815 | bradykinin catabolic process(GO:0010815) |
| 0.4 | 3.4 | GO:0031507 | heterochromatin assembly(GO:0031507) |
| 0.4 | 0.7 | GO:0045898 | regulation of RNA polymerase II transcriptional preinitiation complex assembly(GO:0045898) |
| 0.4 | 1.1 | GO:0060267 | positive regulation of respiratory burst(GO:0060267) |
| 0.4 | 1.1 | GO:1902202 | regulation of hepatocyte growth factor receptor signaling pathway(GO:1902202) |
| 0.4 | 1.4 | GO:1903553 | positive regulation of extracellular exosome assembly(GO:1903553) |
| 0.4 | 1.1 | GO:0061113 | pancreas morphogenesis(GO:0061113) |
| 0.4 | 2.1 | GO:0015838 | amino-acid betaine transport(GO:0015838) |
| 0.4 | 0.4 | GO:0032876 | negative regulation of DNA endoreduplication(GO:0032876) |
| 0.4 | 0.4 | GO:2000618 | regulation of histone H4-K16 acetylation(GO:2000618) |
| 0.3 | 2.8 | GO:0055089 | fatty acid homeostasis(GO:0055089) |
| 0.3 | 0.7 | GO:2000370 | positive regulation of clathrin-mediated endocytosis(GO:2000370) |
| 0.3 | 1.0 | GO:0045080 | positive regulation of chemokine biosynthetic process(GO:0045080) |
| 0.3 | 1.0 | GO:0002317 | plasma cell differentiation(GO:0002317) |
| 0.3 | 0.3 | GO:0003347 | epicardial cell to mesenchymal cell transition(GO:0003347) |
| 0.3 | 1.0 | GO:0002752 | cell surface pattern recognition receptor signaling pathway(GO:0002752) |
| 0.3 | 1.0 | GO:0017187 | peptidyl-glutamic acid carboxylation(GO:0017187) |
| 0.3 | 1.0 | GO:0071042 | nuclear polyadenylation-dependent mRNA catabolic process(GO:0071042) polyadenylation-dependent mRNA catabolic process(GO:0071047) |
| 0.3 | 0.3 | GO:0055064 | chloride ion homeostasis(GO:0055064) |
| 0.3 | 0.7 | GO:1903551 | regulation of extracellular exosome assembly(GO:1903551) |
| 0.3 | 0.3 | GO:0001555 | oocyte growth(GO:0001555) |
| 0.3 | 1.3 | GO:0097011 | cellular response to granulocyte macrophage colony-stimulating factor stimulus(GO:0097011) |
| 0.3 | 1.0 | GO:0071930 | negative regulation of transcription involved in G1/S transition of mitotic cell cycle(GO:0071930) |
| 0.3 | 2.3 | GO:0000185 | activation of MAPKKK activity(GO:0000185) |
| 0.3 | 1.6 | GO:0035610 | protein side chain deglutamylation(GO:0035610) |
| 0.3 | 0.6 | GO:0060178 | regulation of exocyst localization(GO:0060178) |
| 0.3 | 0.3 | GO:0036493 | positive regulation of translation in response to endoplasmic reticulum stress(GO:0036493) |
| 0.3 | 0.6 | GO:0019240 | citrulline biosynthetic process(GO:0019240) |
| 0.3 | 1.3 | GO:0046602 | regulation of mitotic centrosome separation(GO:0046602) |
| 0.3 | 1.0 | GO:0031284 | positive regulation of guanylate cyclase activity(GO:0031284) |
| 0.3 | 4.2 | GO:0045116 | protein neddylation(GO:0045116) |
| 0.3 | 1.9 | GO:0070072 | vacuolar proton-transporting V-type ATPase complex assembly(GO:0070072) |
| 0.3 | 1.6 | GO:0009115 | xanthine catabolic process(GO:0009115) |
| 0.3 | 1.9 | GO:0071281 | cellular response to iron ion(GO:0071281) |
| 0.3 | 0.6 | GO:1900169 | regulation of glucocorticoid mediated signaling pathway(GO:1900169) |
| 0.3 | 3.8 | GO:0015858 | nucleoside transport(GO:0015858) |
| 0.3 | 0.3 | GO:0032077 | positive regulation of deoxyribonuclease activity(GO:0032077) |
| 0.3 | 0.3 | GO:0043402 | glucocorticoid mediated signaling pathway(GO:0043402) |
| 0.3 | 0.6 | GO:0060058 | apoptotic process involved in mammary gland involution(GO:0060057) positive regulation of apoptotic process involved in mammary gland involution(GO:0060058) positive regulation of apoptotic process involved in morphogenesis(GO:1902339) regulation of mammary gland involution(GO:1903519) positive regulation of mammary gland involution(GO:1903521) positive regulation of apoptotic process involved in development(GO:1904747) |
| 0.3 | 0.6 | GO:1990086 | lens fiber cell apoptotic process(GO:1990086) |
| 0.3 | 1.6 | GO:0070389 | chaperone cofactor-dependent protein refolding(GO:0070389) |
| 0.3 | 0.9 | GO:0023021 | termination of signal transduction(GO:0023021) |
| 0.3 | 1.2 | GO:0070837 | dehydroascorbic acid transport(GO:0070837) |
| 0.3 | 2.2 | GO:0045654 | positive regulation of megakaryocyte differentiation(GO:0045654) |
| 0.3 | 0.3 | GO:2000343 | positive regulation of chemokine (C-X-C motif) ligand 2 production(GO:2000343) |
| 0.3 | 1.9 | GO:1904251 | regulation of bile acid metabolic process(GO:1904251) |
| 0.3 | 0.9 | GO:0086023 | adrenergic receptor signaling pathway involved in heart process(GO:0086023) |
| 0.3 | 0.6 | GO:0070278 | extracellular matrix constituent secretion(GO:0070278) |
| 0.3 | 2.1 | GO:0018026 | peptidyl-lysine monomethylation(GO:0018026) |
| 0.3 | 1.2 | GO:0043137 | DNA replication, removal of RNA primer(GO:0043137) |
| 0.3 | 0.6 | GO:0090210 | regulation of establishment of blood-brain barrier(GO:0090210) |
| 0.3 | 3.9 | GO:0043968 | histone H2A acetylation(GO:0043968) |
| 0.3 | 1.8 | GO:0031145 | anaphase-promoting complex-dependent catabolic process(GO:0031145) |
| 0.3 | 0.6 | GO:0008050 | female courtship behavior(GO:0008050) |
| 0.3 | 0.6 | GO:0009957 | epidermal cell fate specification(GO:0009957) |
| 0.3 | 2.6 | GO:0000103 | sulfate assimilation(GO:0000103) |
| 0.3 | 0.9 | GO:0010796 | regulation of multivesicular body size(GO:0010796) |
| 0.3 | 0.9 | GO:0060762 | regulation of branching involved in mammary gland duct morphogenesis(GO:0060762) |
| 0.3 | 2.9 | GO:0048672 | positive regulation of collateral sprouting(GO:0048672) |
| 0.3 | 1.7 | GO:0017196 | N-terminal peptidyl-methionine acetylation(GO:0017196) |
| 0.3 | 0.9 | GO:0007571 | age-dependent response to oxidative stress(GO:0001306) age-dependent general metabolic decline(GO:0007571) |
| 0.3 | 0.9 | GO:1903237 | negative regulation of leukocyte tethering or rolling(GO:1903237) |
| 0.3 | 2.6 | GO:0045725 | positive regulation of glycogen biosynthetic process(GO:0045725) |
| 0.3 | 0.3 | GO:2001170 | negative regulation of ATP biosynthetic process(GO:2001170) |
| 0.3 | 0.9 | GO:0043485 | endosome to melanosome transport(GO:0035646) endosome to pigment granule transport(GO:0043485) pigment granule maturation(GO:0048757) |
| 0.3 | 2.6 | GO:0033866 | coenzyme A biosynthetic process(GO:0015937) nucleoside bisphosphate biosynthetic process(GO:0033866) ribonucleoside bisphosphate biosynthetic process(GO:0034030) purine nucleoside bisphosphate biosynthetic process(GO:0034033) |
| 0.3 | 0.8 | GO:0032988 | ribonucleoprotein complex disassembly(GO:0032988) |
| 0.3 | 0.8 | GO:0048208 | vesicle targeting, rough ER to cis-Golgi(GO:0048207) COPII vesicle coating(GO:0048208) |
| 0.3 | 0.6 | GO:0051593 | response to folic acid(GO:0051593) |
| 0.3 | 0.6 | GO:0090219 | negative regulation of lipid kinase activity(GO:0090219) |
| 0.3 | 0.8 | GO:0007290 | spermatid nucleus elongation(GO:0007290) |
| 0.3 | 0.6 | GO:1904469 | positive regulation of tumor necrosis factor secretion(GO:1904469) |
| 0.3 | 1.4 | GO:0042905 | 9-cis-retinoic acid biosynthetic process(GO:0042904) 9-cis-retinoic acid metabolic process(GO:0042905) |
| 0.3 | 1.1 | GO:0051295 | establishment of meiotic spindle localization(GO:0051295) |
| 0.3 | 0.8 | GO:1900748 | positive regulation of vascular endothelial growth factor signaling pathway(GO:1900748) |
| 0.3 | 0.8 | GO:0031086 | nuclear-transcribed mRNA catabolic process, deadenylation-independent decay(GO:0031086) deadenylation-independent decapping of nuclear-transcribed mRNA(GO:0031087) |
| 0.3 | 0.3 | GO:1903984 | positive regulation of TRAIL-activated apoptotic signaling pathway(GO:1903984) |
| 0.3 | 0.5 | GO:0006868 | glutamine transport(GO:0006868) |
| 0.3 | 7.0 | GO:0018279 | protein N-linked glycosylation via asparagine(GO:0018279) |
| 0.3 | 1.9 | GO:0051255 | spindle midzone assembly(GO:0051255) |
| 0.3 | 0.5 | GO:2000049 | positive regulation of cell-cell adhesion mediated by cadherin(GO:2000049) |
| 0.3 | 1.3 | GO:0090245 | axis elongation involved in somitogenesis(GO:0090245) |
| 0.3 | 1.3 | GO:0032226 | positive regulation of synaptic transmission, dopaminergic(GO:0032226) |
| 0.3 | 2.1 | GO:0032754 | positive regulation of interleukin-5 production(GO:0032754) |
| 0.3 | 3.7 | GO:0070266 | necroptotic process(GO:0070266) |
| 0.3 | 0.8 | GO:2001245 | regulation of phosphatidylcholine biosynthetic process(GO:2001245) |
| 0.3 | 0.8 | GO:0009240 | isopentenyl diphosphate biosynthetic process(GO:0009240) isopentenyl diphosphate biosynthetic process, mevalonate pathway(GO:0019287) |
| 0.3 | 4.2 | GO:0017144 | drug metabolic process(GO:0017144) |
| 0.3 | 1.8 | GO:1902018 | negative regulation of cilium assembly(GO:1902018) |
| 0.3 | 1.3 | GO:0061669 | spontaneous neurotransmitter secretion(GO:0061669) spontaneous synaptic transmission(GO:0098814) |
| 0.3 | 0.8 | GO:1900127 | positive regulation of hyaluronan biosynthetic process(GO:1900127) |
| 0.3 | 0.3 | GO:0060298 | positive regulation of sarcomere organization(GO:0060298) |
| 0.3 | 0.8 | GO:0060978 | angiogenesis involved in coronary vascular morphogenesis(GO:0060978) |
| 0.3 | 2.6 | GO:0030049 | muscle filament sliding(GO:0030049) |
| 0.3 | 0.5 | GO:0035526 | retrograde transport, plasma membrane to Golgi(GO:0035526) |
| 0.3 | 0.5 | GO:0019254 | carnitine metabolic process, CoA-linked(GO:0019254) |
| 0.3 | 2.0 | GO:0072584 | caveolin-mediated endocytosis(GO:0072584) |
| 0.3 | 0.5 | GO:0072675 | osteoclast fusion(GO:0072675) |
| 0.3 | 3.3 | GO:0070166 | enamel mineralization(GO:0070166) |
| 0.3 | 0.8 | GO:0043691 | reverse cholesterol transport(GO:0043691) |
| 0.3 | 0.5 | GO:0006741 | NADP biosynthetic process(GO:0006741) |
| 0.2 | 2.7 | GO:0098869 | cellular oxidant detoxification(GO:0098869) |
| 0.2 | 1.5 | GO:0035745 | T-helper 2 cell cytokine production(GO:0035745) |
| 0.2 | 1.0 | GO:0097070 | ductus arteriosus closure(GO:0097070) |
| 0.2 | 3.0 | GO:0008535 | respiratory chain complex IV assembly(GO:0008535) |
| 0.2 | 0.7 | GO:0000087 | mitotic M phase(GO:0000087) |
| 0.2 | 0.2 | GO:0090611 | ubiquitin-independent protein catabolic process via the multivesicular body sorting pathway(GO:0090611) |
| 0.2 | 0.7 | GO:0006285 | base-excision repair, AP site formation(GO:0006285) |
| 0.2 | 1.5 | GO:0060020 | Bergmann glial cell differentiation(GO:0060020) |
| 0.2 | 0.5 | GO:0016480 | negative regulation of transcription from RNA polymerase III promoter(GO:0016480) |
| 0.2 | 0.5 | GO:2000721 | positive regulation of transcription from RNA polymerase II promoter involved in smooth muscle cell differentiation(GO:2000721) |
| 0.2 | 0.7 | GO:0030242 | pexophagy(GO:0030242) |
| 0.2 | 1.0 | GO:0009169 | ribonucleoside monophosphate catabolic process(GO:0009158) purine ribonucleoside monophosphate catabolic process(GO:0009169) |
| 0.2 | 0.7 | GO:0006369 | termination of RNA polymerase II transcription(GO:0006369) |
| 0.2 | 0.2 | GO:0045590 | negative regulation of regulatory T cell differentiation(GO:0045590) |
| 0.2 | 0.5 | GO:0034242 | negative regulation of syncytium formation by plasma membrane fusion(GO:0034242) |
| 0.2 | 0.5 | GO:0048295 | positive regulation of isotype switching to IgE isotypes(GO:0048295) |
| 0.2 | 0.2 | GO:0001951 | intestinal D-glucose absorption(GO:0001951) |
| 0.2 | 2.4 | GO:0000042 | protein targeting to Golgi(GO:0000042) |
| 0.2 | 1.0 | GO:2000051 | negative regulation of non-canonical Wnt signaling pathway(GO:2000051) |
| 0.2 | 1.4 | GO:0032287 | peripheral nervous system myelin maintenance(GO:0032287) |
| 0.2 | 0.7 | GO:0044860 | protein localization to plasma membrane raft(GO:0044860) |
| 0.2 | 7.3 | GO:0035058 | nonmotile primary cilium assembly(GO:0035058) |
| 0.2 | 2.1 | GO:0007603 | phototransduction, visible light(GO:0007603) |
| 0.2 | 1.6 | GO:0019367 | fatty acid elongation, saturated fatty acid(GO:0019367) fatty acid elongation, unsaturated fatty acid(GO:0019368) fatty acid elongation, monounsaturated fatty acid(GO:0034625) fatty acid elongation, polyunsaturated fatty acid(GO:0034626) |
| 0.2 | 0.9 | GO:0007023 | post-chaperonin tubulin folding pathway(GO:0007023) |
| 0.2 | 0.9 | GO:0071763 | nuclear membrane organization(GO:0071763) |
| 0.2 | 0.7 | GO:1904526 | regulation of microtubule binding(GO:1904526) positive regulation of microtubule binding(GO:1904528) |
| 0.2 | 0.7 | GO:2000686 | regulation of rubidium ion transmembrane transporter activity(GO:2000686) |
| 0.2 | 0.7 | GO:0030916 | otic vesicle formation(GO:0030916) |
| 0.2 | 0.4 | GO:0008626 | granzyme-mediated apoptotic signaling pathway(GO:0008626) |
| 0.2 | 0.9 | GO:0001712 | ectodermal cell fate commitment(GO:0001712) |
| 0.2 | 10.1 | GO:0043330 | response to exogenous dsRNA(GO:0043330) |
| 0.2 | 3.6 | GO:0051180 | vitamin transport(GO:0051180) |
| 0.2 | 0.7 | GO:0007208 | phospholipase C-activating serotonin receptor signaling pathway(GO:0007208) |
| 0.2 | 0.2 | GO:2000520 | regulation of immunological synapse formation(GO:2000520) |
| 0.2 | 0.4 | GO:0034633 | retinol transport(GO:0034633) isoprenoid transport(GO:0046864) terpenoid transport(GO:0046865) |
| 0.2 | 1.1 | GO:0070989 | oxidative demethylation(GO:0070989) |
| 0.2 | 0.7 | GO:0030421 | defecation(GO:0030421) |
| 0.2 | 0.7 | GO:0071596 | ubiquitin-dependent protein catabolic process via the N-end rule pathway(GO:0071596) |
| 0.2 | 0.4 | GO:0046061 | dATP catabolic process(GO:0046061) |
| 0.2 | 3.1 | GO:0015985 | energy coupled proton transport, down electrochemical gradient(GO:0015985) ATP synthesis coupled proton transport(GO:0015986) |
| 0.2 | 0.7 | GO:0033026 | negative regulation of mast cell apoptotic process(GO:0033026) |
| 0.2 | 2.6 | GO:0007064 | mitotic sister chromatid cohesion(GO:0007064) |
| 0.2 | 0.4 | GO:0045723 | positive regulation of fatty acid biosynthetic process(GO:0045723) |
| 0.2 | 2.6 | GO:0051127 | positive regulation of actin nucleation(GO:0051127) |
| 0.2 | 3.2 | GO:0051156 | glucose 6-phosphate metabolic process(GO:0051156) |
| 0.2 | 1.1 | GO:0030913 | paranodal junction assembly(GO:0030913) |
| 0.2 | 0.4 | GO:0046878 | positive regulation of saliva secretion(GO:0046878) |
| 0.2 | 0.6 | GO:0006177 | GMP biosynthetic process(GO:0006177) |
| 0.2 | 0.9 | GO:0009438 | methylglyoxal metabolic process(GO:0009438) methylglyoxal catabolic process to D-lactate via S-lactoyl-glutathione(GO:0019243) methylglyoxal catabolic process(GO:0051596) methylglyoxal catabolic process to lactate(GO:0061727) |
| 0.2 | 7.3 | GO:1901998 | toxin transport(GO:1901998) |
| 0.2 | 0.2 | GO:0034146 | toll-like receptor 5 signaling pathway(GO:0034146) |
| 0.2 | 1.9 | GO:0035999 | tetrahydrofolate interconversion(GO:0035999) |
| 0.2 | 0.9 | GO:0006824 | cobalt ion transport(GO:0006824) |
| 0.2 | 1.1 | GO:0044829 | positive regulation by host of viral genome replication(GO:0044829) |
| 0.2 | 0.9 | GO:0035845 | photoreceptor cell outer segment organization(GO:0035845) |
| 0.2 | 1.5 | GO:1902231 | positive regulation of intrinsic apoptotic signaling pathway in response to DNA damage(GO:1902231) |
| 0.2 | 0.9 | GO:0071896 | protein localization to adherens junction(GO:0071896) |
| 0.2 | 0.2 | GO:0003164 | His-Purkinje system development(GO:0003164) |
| 0.2 | 0.8 | GO:0072488 | ammonium transmembrane transport(GO:0072488) |
| 0.2 | 1.3 | GO:0097421 | liver regeneration(GO:0097421) |
| 0.2 | 0.4 | GO:0061626 | pharyngeal arch artery morphogenesis(GO:0061626) |
| 0.2 | 1.0 | GO:0021869 | forebrain ventricular zone progenitor cell division(GO:0021869) |
| 0.2 | 1.5 | GO:0034498 | early endosome to Golgi transport(GO:0034498) |
| 0.2 | 1.0 | GO:0045719 | negative regulation of glycogen biosynthetic process(GO:0045719) |
| 0.2 | 0.8 | GO:0003383 | apical constriction(GO:0003383) |
| 0.2 | 1.5 | GO:0051895 | negative regulation of focal adhesion assembly(GO:0051895) |
| 0.2 | 1.7 | GO:0006670 | sphingosine metabolic process(GO:0006670) |
| 0.2 | 1.5 | GO:2000197 | regulation of mRNA export from nucleus(GO:0010793) regulation of ribonucleoprotein complex localization(GO:2000197) |
| 0.2 | 0.8 | GO:2000766 | negative regulation of cytoplasmic translation(GO:2000766) |
| 0.2 | 0.2 | GO:0051138 | regulation of NK T cell differentiation(GO:0051136) positive regulation of NK T cell differentiation(GO:0051138) |
| 0.2 | 0.6 | GO:0060931 | sinoatrial node cell development(GO:0060931) |
| 0.2 | 0.8 | GO:0046600 | negative regulation of centriole replication(GO:0046600) |
| 0.2 | 0.4 | GO:0032074 | negative regulation of nuclease activity(GO:0032074) |
| 0.2 | 0.6 | GO:0034154 | toll-like receptor 7 signaling pathway(GO:0034154) |
| 0.2 | 1.2 | GO:0006104 | succinyl-CoA metabolic process(GO:0006104) |
| 0.2 | 1.8 | GO:2000353 | positive regulation of endothelial cell apoptotic process(GO:2000353) |
| 0.2 | 0.6 | GO:0018199 | peptidyl-glutamine modification(GO:0018199) |
| 0.2 | 1.0 | GO:0051122 | hepoxilin metabolic process(GO:0051121) hepoxilin biosynthetic process(GO:0051122) |
| 0.2 | 0.6 | GO:0070358 | actin polymerization-dependent cell motility(GO:0070358) |
| 0.2 | 0.8 | GO:0032482 | Rab protein signal transduction(GO:0032482) |
| 0.2 | 0.8 | GO:0006537 | glutamate biosynthetic process(GO:0006537) |
| 0.2 | 0.4 | GO:1901896 | positive regulation of calcium-transporting ATPase activity(GO:1901896) |
| 0.2 | 0.8 | GO:0060526 | prostate glandular acinus morphogenesis(GO:0060526) prostate epithelial cord arborization involved in prostate glandular acinus morphogenesis(GO:0060527) |
| 0.2 | 1.2 | GO:0048631 | regulation of skeletal muscle tissue growth(GO:0048631) |
| 0.2 | 0.6 | GO:1904683 | regulation of metalloendopeptidase activity(GO:1904683) |
| 0.2 | 0.4 | GO:0045054 | constitutive secretory pathway(GO:0045054) |
| 0.2 | 1.2 | GO:0018401 | peptidyl-proline hydroxylation to 4-hydroxy-L-proline(GO:0018401) |
| 0.2 | 1.0 | GO:0048069 | eye pigmentation(GO:0048069) |
| 0.2 | 0.4 | GO:2000259 | positive regulation of complement activation(GO:0045917) positive regulation of protein activation cascade(GO:2000259) |
| 0.2 | 0.6 | GO:0061535 | glutamate secretion, neurotransmission(GO:0061535) |
| 0.2 | 1.0 | GO:0090005 | negative regulation of establishment of protein localization to plasma membrane(GO:0090005) |
| 0.2 | 1.8 | GO:0051984 | positive regulation of chromosome segregation(GO:0051984) |
| 0.2 | 0.6 | GO:0071926 | cannabinoid signaling pathway(GO:0038171) endocannabinoid signaling pathway(GO:0071926) |
| 0.2 | 0.8 | GO:1902036 | regulation of hematopoietic stem cell differentiation(GO:1902036) |
| 0.2 | 1.8 | GO:0006544 | glycine metabolic process(GO:0006544) |
| 0.2 | 0.8 | GO:0036507 | protein deglycosylation involved in glycoprotein catabolic process(GO:0035977) protein demannosylation(GO:0036507) protein alpha-1,2-demannosylation(GO:0036508) mannose trimming involved in glycoprotein ERAD pathway(GO:1904382) |
| 0.2 | 0.8 | GO:0000727 | double-strand break repair via break-induced replication(GO:0000727) |
| 0.2 | 1.8 | GO:0051601 | exocyst localization(GO:0051601) |
| 0.2 | 1.2 | GO:2000676 | positive regulation of type B pancreatic cell apoptotic process(GO:2000676) |
| 0.2 | 0.4 | GO:1904491 | protein localization to ciliary transition zone(GO:1904491) |
| 0.2 | 0.8 | GO:1902033 | regulation of hematopoietic stem cell proliferation(GO:1902033) |
| 0.2 | 1.9 | GO:0045351 | type I interferon biosynthetic process(GO:0045351) |
| 0.2 | 1.2 | GO:0045607 | regulation of auditory receptor cell differentiation(GO:0045607) regulation of mechanoreceptor differentiation(GO:0045631) regulation of inner ear receptor cell differentiation(GO:2000980) |
| 0.2 | 0.4 | GO:1902071 | regulation of hypoxia-inducible factor-1alpha signaling pathway(GO:1902071) |
| 0.2 | 1.0 | GO:0042364 | water-soluble vitamin biosynthetic process(GO:0042364) |
| 0.2 | 4.0 | GO:0000002 | mitochondrial genome maintenance(GO:0000002) |
| 0.2 | 1.0 | GO:0018231 | peptidyl-L-cysteine S-palmitoylation(GO:0018230) peptidyl-S-diacylglycerol-L-cysteine biosynthetic process from peptidyl-cysteine(GO:0018231) |
| 0.2 | 0.8 | GO:0001992 | regulation of systemic arterial blood pressure by vasopressin(GO:0001992) |
| 0.2 | 0.8 | GO:1904668 | positive regulation of ubiquitin protein ligase activity(GO:1904668) |
| 0.2 | 1.3 | GO:0061418 | regulation of transcription from RNA polymerase II promoter in response to hypoxia(GO:0061418) |
| 0.2 | 0.6 | GO:0038026 | reelin-mediated signaling pathway(GO:0038026) |
| 0.2 | 0.2 | GO:0072053 | renal inner medulla development(GO:0072053) |
| 0.2 | 0.4 | GO:0007039 | protein catabolic process in the vacuole(GO:0007039) |
| 0.2 | 0.2 | GO:0008582 | regulation of synaptic growth at neuromuscular junction(GO:0008582) |
| 0.2 | 0.4 | GO:0046952 | ketone body catabolic process(GO:0046952) |
| 0.2 | 0.4 | GO:0006114 | glycerol biosynthetic process(GO:0006114) |
| 0.2 | 3.5 | GO:0006379 | mRNA cleavage(GO:0006379) |
| 0.2 | 0.6 | GO:0051299 | centrosome separation(GO:0051299) |
| 0.2 | 0.4 | GO:0045627 | positive regulation of T-helper 1 cell differentiation(GO:0045627) |
| 0.2 | 0.7 | GO:0048012 | hepatocyte growth factor receptor signaling pathway(GO:0048012) |
| 0.2 | 2.6 | GO:1902017 | regulation of cilium assembly(GO:1902017) |
| 0.2 | 0.6 | GO:0034214 | protein hexamerization(GO:0034214) |
| 0.2 | 0.4 | GO:0036302 | atrioventricular canal development(GO:0036302) |
| 0.2 | 0.6 | GO:0010835 | regulation of protein ADP-ribosylation(GO:0010835) |
| 0.2 | 1.5 | GO:0001867 | complement activation, lectin pathway(GO:0001867) |
| 0.2 | 0.6 | GO:1904263 | positive regulation of TORC1 signaling(GO:1904263) |
| 0.2 | 0.2 | GO:1904262 | negative regulation of TORC1 signaling(GO:1904262) |
| 0.2 | 2.4 | GO:0045662 | negative regulation of myoblast differentiation(GO:0045662) |
| 0.2 | 0.2 | GO:2000344 | positive regulation of acrosome reaction(GO:2000344) |
| 0.2 | 2.7 | GO:0055090 | acylglycerol homeostasis(GO:0055090) triglyceride homeostasis(GO:0070328) |
| 0.2 | 0.5 | GO:0036092 | phosphatidylinositol-3-phosphate biosynthetic process(GO:0036092) |
| 0.2 | 0.5 | GO:2000525 | regulation of T cell costimulation(GO:2000523) positive regulation of T cell costimulation(GO:2000525) |
| 0.2 | 0.5 | GO:0060965 | negative regulation of gene silencing by miRNA(GO:0060965) |
| 0.2 | 0.4 | GO:0060744 | thelarche(GO:0042695) mammary gland branching involved in thelarche(GO:0060744) |
| 0.2 | 0.7 | GO:0090166 | Golgi disassembly(GO:0090166) |
| 0.2 | 1.4 | GO:0033136 | serine phosphorylation of STAT3 protein(GO:0033136) |
| 0.2 | 0.7 | GO:0043619 | regulation of transcription from RNA polymerase II promoter in response to oxidative stress(GO:0043619) |
| 0.2 | 0.4 | GO:0070086 | ubiquitin-dependent endocytosis(GO:0070086) |
| 0.2 | 1.1 | GO:0048711 | positive regulation of astrocyte differentiation(GO:0048711) |
| 0.2 | 1.4 | GO:0021785 | branchiomotor neuron axon guidance(GO:0021785) |
| 0.2 | 0.4 | GO:0032075 | positive regulation of nuclease activity(GO:0032075) |
| 0.2 | 0.2 | GO:0071351 | response to interleukin-18(GO:0070673) cellular response to interleukin-18(GO:0071351) |
| 0.2 | 2.7 | GO:0044458 | motile cilium assembly(GO:0044458) |
| 0.2 | 0.4 | GO:0032789 | saturated monocarboxylic acid metabolic process(GO:0032788) unsaturated monocarboxylic acid metabolic process(GO:0032789) |
| 0.2 | 0.5 | GO:0000920 | cell separation after cytokinesis(GO:0000920) |
| 0.2 | 0.5 | GO:0046884 | follicle-stimulating hormone secretion(GO:0046884) |
| 0.2 | 0.7 | GO:0060373 | regulation of ventricular cardiac muscle cell membrane depolarization(GO:0060373) |
| 0.2 | 0.5 | GO:0060390 | regulation of SMAD protein import into nucleus(GO:0060390) |
| 0.2 | 6.2 | GO:0070936 | protein K48-linked ubiquitination(GO:0070936) |
| 0.2 | 0.4 | GO:2000587 | regulation of platelet-derived growth factor receptor-beta signaling pathway(GO:2000586) negative regulation of platelet-derived growth factor receptor-beta signaling pathway(GO:2000587) |
| 0.2 | 0.9 | GO:0043415 | positive regulation of skeletal muscle tissue regeneration(GO:0043415) |
| 0.2 | 0.4 | GO:0032020 | ISG15-protein conjugation(GO:0032020) |
| 0.2 | 0.5 | GO:0060352 | cell adhesion molecule production(GO:0060352) |
| 0.2 | 0.4 | GO:2000503 | positive regulation of natural killer cell chemotaxis(GO:2000503) |
| 0.2 | 0.2 | GO:0042488 | positive regulation of odontogenesis of dentin-containing tooth(GO:0042488) |
| 0.2 | 0.3 | GO:1904742 | regulation of telomeric DNA binding(GO:1904742) |
| 0.2 | 0.9 | GO:0061051 | positive regulation of cell growth involved in cardiac muscle cell development(GO:0061051) |
| 0.2 | 0.2 | GO:0009750 | response to fructose(GO:0009750) |
| 0.2 | 0.2 | GO:0046643 | regulation of gamma-delta T cell differentiation(GO:0045586) regulation of gamma-delta T cell activation(GO:0046643) |
| 0.2 | 6.1 | GO:0010862 | positive regulation of pathway-restricted SMAD protein phosphorylation(GO:0010862) |
| 0.2 | 0.9 | GO:0000301 | retrograde transport, vesicle recycling within Golgi(GO:0000301) |
| 0.2 | 0.5 | GO:0003105 | negative regulation of glomerular filtration(GO:0003105) |
| 0.2 | 1.4 | GO:0018344 | protein geranylgeranylation(GO:0018344) |
| 0.2 | 0.7 | GO:1900016 | negative regulation of cytokine production involved in inflammatory response(GO:1900016) |
| 0.2 | 1.2 | GO:0070572 | positive regulation of neuron projection regeneration(GO:0070572) |
| 0.2 | 0.7 | GO:0070162 | adiponectin secretion(GO:0070162) regulation of adiponectin secretion(GO:0070163) |
| 0.2 | 0.9 | GO:0048227 | plasma membrane to endosome transport(GO:0048227) |
| 0.2 | 0.9 | GO:0009235 | cobalamin metabolic process(GO:0009235) |
| 0.2 | 0.5 | GO:0010046 | response to mycotoxin(GO:0010046) |
| 0.2 | 0.9 | GO:0043983 | histone H4-K12 acetylation(GO:0043983) |
| 0.2 | 1.0 | GO:0060710 | chorio-allantoic fusion(GO:0060710) |
| 0.2 | 0.8 | GO:2001256 | regulation of store-operated calcium entry(GO:2001256) |
| 0.2 | 0.3 | GO:2000407 | regulation of T cell extravasation(GO:2000407) positive regulation of T cell extravasation(GO:2000409) |
| 0.2 | 0.7 | GO:0009143 | nucleoside triphosphate catabolic process(GO:0009143) |
| 0.2 | 2.2 | GO:0032967 | positive regulation of collagen biosynthetic process(GO:0032967) |
| 0.2 | 5.5 | GO:0051865 | protein autoubiquitination(GO:0051865) |
| 0.2 | 1.0 | GO:0048541 | mucosal-associated lymphoid tissue development(GO:0048537) Peyer's patch development(GO:0048541) |
| 0.2 | 0.7 | GO:0031581 | hemidesmosome assembly(GO:0031581) |
| 0.2 | 0.2 | GO:2001270 | regulation of cysteine-type endopeptidase activity involved in execution phase of apoptosis(GO:2001270) negative regulation of cysteine-type endopeptidase activity involved in execution phase of apoptosis(GO:2001271) |
| 0.2 | 0.5 | GO:0006438 | valyl-tRNA aminoacylation(GO:0006438) |
| 0.2 | 0.8 | GO:0035413 | positive regulation of catenin import into nucleus(GO:0035413) |
| 0.2 | 2.8 | GO:0045671 | negative regulation of osteoclast differentiation(GO:0045671) |
| 0.2 | 0.2 | GO:1902218 | intrinsic apoptotic signaling pathway in response to osmotic stress(GO:0008627) regulation of intrinsic apoptotic signaling pathway in response to osmotic stress(GO:1902218) negative regulation of intrinsic apoptotic signaling pathway in response to osmotic stress(GO:1902219) |
| 0.2 | 1.3 | GO:0006610 | ribosomal protein import into nucleus(GO:0006610) |
| 0.2 | 1.8 | GO:0006957 | complement activation, alternative pathway(GO:0006957) |
| 0.2 | 0.3 | GO:1901838 | positive regulation of transcription of nuclear large rRNA transcript from RNA polymerase I promoter(GO:1901838) |
| 0.2 | 1.5 | GO:0010960 | magnesium ion homeostasis(GO:0010960) |
| 0.2 | 0.2 | GO:0035743 | CD4-positive, alpha-beta T cell cytokine production(GO:0035743) |
| 0.2 | 0.2 | GO:0045900 | negative regulation of translational elongation(GO:0045900) |
| 0.2 | 0.5 | GO:0035964 | COPI-coated vesicle budding(GO:0035964) |
| 0.2 | 0.8 | GO:0034058 | endosomal vesicle fusion(GO:0034058) |
| 0.2 | 0.3 | GO:0046049 | UMP biosynthetic process(GO:0006222) pyrimidine ribonucleoside monophosphate metabolic process(GO:0009173) pyrimidine ribonucleoside monophosphate biosynthetic process(GO:0009174) UMP metabolic process(GO:0046049) |
| 0.2 | 1.4 | GO:0015693 | magnesium ion transport(GO:0015693) |
| 0.2 | 0.5 | GO:0006420 | arginyl-tRNA aminoacylation(GO:0006420) |
| 0.2 | 1.0 | GO:0019348 | dolichol metabolic process(GO:0019348) |
| 0.2 | 0.2 | GO:0033599 | regulation of mammary gland epithelial cell proliferation(GO:0033599) |
| 0.2 | 0.2 | GO:0071397 | cellular response to cholesterol(GO:0071397) |
| 0.2 | 2.2 | GO:0097352 | autophagosome maturation(GO:0097352) |
| 0.2 | 0.2 | GO:0034454 | microtubule anchoring at centrosome(GO:0034454) |
| 0.2 | 0.2 | GO:0043096 | purine nucleobase salvage(GO:0043096) |
| 0.2 | 1.4 | GO:0060670 | branching involved in labyrinthine layer morphogenesis(GO:0060670) |
| 0.2 | 0.3 | GO:0046719 | regulation by virus of viral protein levels in host cell(GO:0046719) |
| 0.2 | 0.9 | GO:0097094 | craniofacial suture morphogenesis(GO:0097094) |
| 0.2 | 0.5 | GO:0006624 | vacuolar protein processing(GO:0006624) |
| 0.2 | 0.2 | GO:1901165 | positive regulation of trophoblast cell migration(GO:1901165) |
| 0.2 | 2.5 | GO:0048490 | anterograde synaptic vesicle transport(GO:0048490) synaptic vesicle cytoskeletal transport(GO:0099514) synaptic vesicle transport along microtubule(GO:0099517) |
| 0.2 | 0.8 | GO:1901678 | iron coordination entity transport(GO:1901678) |
| 0.2 | 0.3 | GO:2000297 | negative regulation of synapse maturation(GO:2000297) |
| 0.2 | 0.3 | GO:0090214 | spongiotrophoblast layer developmental growth(GO:0090214) |
| 0.2 | 0.8 | GO:0045657 | positive regulation of monocyte differentiation(GO:0045657) |
| 0.2 | 0.8 | GO:0060136 | embryonic process involved in female pregnancy(GO:0060136) |
| 0.2 | 0.9 | GO:0061469 | regulation of type B pancreatic cell proliferation(GO:0061469) |
| 0.2 | 0.5 | GO:0007084 | mitotic nuclear envelope reassembly(GO:0007084) |
| 0.2 | 0.5 | GO:0016561 | protein import into peroxisome matrix, translocation(GO:0016561) |
| 0.2 | 1.2 | GO:0008216 | spermidine metabolic process(GO:0008216) |
| 0.2 | 0.5 | GO:0051088 | PMA-inducible membrane protein ectodomain proteolysis(GO:0051088) |
| 0.2 | 1.4 | GO:0006335 | DNA replication-dependent nucleosome assembly(GO:0006335) DNA replication-dependent nucleosome organization(GO:0034723) |
| 0.2 | 0.3 | GO:0039530 | MDA-5 signaling pathway(GO:0039530) |
| 0.1 | 0.3 | GO:0009106 | lipoate metabolic process(GO:0009106) |
| 0.1 | 1.6 | GO:0051205 | protein insertion into membrane(GO:0051205) |
| 0.1 | 0.3 | GO:0046103 | inosine biosynthetic process(GO:0046103) |
| 0.1 | 1.0 | GO:0032367 | intracellular cholesterol transport(GO:0032367) |
| 0.1 | 1.3 | GO:0036303 | lymphangiogenesis(GO:0001946) lymph vessel morphogenesis(GO:0036303) |
| 0.1 | 1.0 | GO:0009191 | ribonucleoside diphosphate catabolic process(GO:0009191) |
| 0.1 | 0.1 | GO:0007403 | glial cell fate determination(GO:0007403) |
| 0.1 | 0.3 | GO:0090399 | replicative senescence(GO:0090399) |
| 0.1 | 3.7 | GO:0019884 | antigen processing and presentation of exogenous antigen(GO:0019884) |
| 0.1 | 0.3 | GO:0035810 | positive regulation of urine volume(GO:0035810) |
| 0.1 | 0.7 | GO:0071554 | cell wall macromolecule metabolic process(GO:0044036) cell wall organization or biogenesis(GO:0071554) |
| 0.1 | 0.4 | GO:0060743 | epithelial cell maturation involved in prostate gland development(GO:0060743) |
| 0.1 | 1.0 | GO:0051044 | positive regulation of membrane protein ectodomain proteolysis(GO:0051044) |
| 0.1 | 0.4 | GO:0071073 | positive regulation of phospholipid biosynthetic process(GO:0071073) |
| 0.1 | 0.3 | GO:0071225 | cellular response to muramyl dipeptide(GO:0071225) |
| 0.1 | 1.5 | GO:0090200 | positive regulation of release of cytochrome c from mitochondria(GO:0090200) |
| 0.1 | 1.0 | GO:0006103 | 2-oxoglutarate metabolic process(GO:0006103) |
| 0.1 | 0.7 | GO:0051654 | establishment of mitochondrion localization(GO:0051654) |
| 0.1 | 0.3 | GO:2000359 | regulation of binding of sperm to zona pellucida(GO:2000359) |
| 0.1 | 0.9 | GO:0040016 | embryonic cleavage(GO:0040016) |
| 0.1 | 0.4 | GO:0032211 | negative regulation of telomere maintenance via telomerase(GO:0032211) |
| 0.1 | 0.4 | GO:0032365 | intracellular lipid transport(GO:0032365) |
| 0.1 | 0.3 | GO:0045839 | negative regulation of mitotic nuclear division(GO:0045839) |
| 0.1 | 0.4 | GO:0089711 | L-glutamate transmembrane transport(GO:0089711) |
| 0.1 | 0.7 | GO:0046599 | regulation of centriole replication(GO:0046599) |
| 0.1 | 0.3 | GO:0000730 | DNA recombinase assembly(GO:0000730) double-strand break repair via synthesis-dependent strand annealing(GO:0045003) |
| 0.1 | 1.1 | GO:0040015 | negative regulation of multicellular organism growth(GO:0040015) |
| 0.1 | 0.9 | GO:0007175 | negative regulation of epidermal growth factor-activated receptor activity(GO:0007175) |
| 0.1 | 0.1 | GO:0090209 | negative regulation of triglyceride metabolic process(GO:0090209) |
| 0.1 | 1.0 | GO:0009313 | oligosaccharide catabolic process(GO:0009313) |
| 0.1 | 0.8 | GO:0032688 | negative regulation of interferon-beta production(GO:0032688) |
| 0.1 | 0.1 | GO:0034393 | positive regulation of smooth muscle cell apoptotic process(GO:0034393) |
| 0.1 | 0.7 | GO:0030917 | midbrain-hindbrain boundary development(GO:0030917) |
| 0.1 | 9.0 | GO:0006338 | chromatin remodeling(GO:0006338) |
| 0.1 | 0.1 | GO:0043569 | negative regulation of insulin-like growth factor receptor signaling pathway(GO:0043569) |
| 0.1 | 0.8 | GO:0006102 | isocitrate metabolic process(GO:0006102) |
| 0.1 | 1.1 | GO:0006013 | mannose metabolic process(GO:0006013) |
| 0.1 | 1.7 | GO:0007289 | spermatid nucleus differentiation(GO:0007289) |
| 0.1 | 0.3 | GO:0015808 | L-alanine transport(GO:0015808) |
| 0.1 | 21.5 | GO:0010466 | negative regulation of peptidase activity(GO:0010466) |
| 0.1 | 0.7 | GO:2000291 | regulation of myoblast proliferation(GO:2000291) |
| 0.1 | 0.1 | GO:0034311 | diol metabolic process(GO:0034311) |
| 0.1 | 0.6 | GO:0006398 | mRNA 3'-end processing by stem-loop binding and cleavage(GO:0006398) |
| 0.1 | 0.6 | GO:0046133 | pyrimidine ribonucleoside catabolic process(GO:0046133) pyrimidine nucleoside catabolic process(GO:0046135) |
| 0.1 | 0.6 | GO:0061073 | ciliary body morphogenesis(GO:0061073) |
| 0.1 | 0.1 | GO:0051795 | positive regulation of catagen(GO:0051795) |
| 0.1 | 1.0 | GO:0006388 | tRNA splicing, via endonucleolytic cleavage and ligation(GO:0006388) |
| 0.1 | 1.5 | GO:0019184 | nonribosomal peptide biosynthetic process(GO:0019184) |
| 0.1 | 0.3 | GO:0021937 | cerebellar Purkinje cell-granule cell precursor cell signaling involved in regulation of granule cell precursor cell proliferation(GO:0021937) |
| 0.1 | 0.5 | GO:0071494 | cellular response to UV-C(GO:0071494) |
| 0.1 | 1.0 | GO:0010389 | regulation of G2/M transition of mitotic cell cycle(GO:0010389) |
| 0.1 | 0.5 | GO:0098535 | de novo centriole assembly(GO:0098535) |
| 0.1 | 0.1 | GO:0030908 | intein-mediated protein splicing(GO:0016539) protein splicing(GO:0030908) |
| 0.1 | 0.3 | GO:0043307 | eosinophil activation involved in immune response(GO:0002278) eosinophil mediated immunity(GO:0002447) eosinophil activation(GO:0043307) eosinophil degranulation(GO:0043308) |
| 0.1 | 1.5 | GO:0042219 | cellular modified amino acid catabolic process(GO:0042219) |
| 0.1 | 2.0 | GO:0006693 | prostanoid metabolic process(GO:0006692) prostaglandin metabolic process(GO:0006693) |
| 0.1 | 0.9 | GO:0050872 | white fat cell differentiation(GO:0050872) |
| 0.1 | 0.1 | GO:0050955 | thermoception(GO:0050955) |
| 0.1 | 0.4 | GO:0045897 | regulation of transcription during mitosis(GO:0045896) positive regulation of transcription during mitosis(GO:0045897) |
| 0.1 | 0.5 | GO:0043615 | astrocyte cell migration(GO:0043615) |
| 0.1 | 0.7 | GO:0010832 | negative regulation of myotube differentiation(GO:0010832) |
| 0.1 | 0.1 | GO:0032621 | interleukin-18 production(GO:0032621) |
| 0.1 | 0.3 | GO:0000479 | endonucleolytic cleavage of tricistronic rRNA transcript (SSU-rRNA, 5.8S rRNA, LSU-rRNA)(GO:0000479) |
| 0.1 | 0.5 | GO:0051790 | short-chain fatty acid biosynthetic process(GO:0051790) |
| 0.1 | 0.3 | GO:1904354 | negative regulation of telomere capping(GO:1904354) |
| 0.1 | 0.4 | GO:0009437 | carnitine metabolic process(GO:0009437) |
| 0.1 | 0.4 | GO:0043922 | negative regulation by host of viral transcription(GO:0043922) |
| 0.1 | 0.5 | GO:0000707 | meiotic DNA recombinase assembly(GO:0000707) |
| 0.1 | 0.5 | GO:0030579 | ubiquitin-dependent SMAD protein catabolic process(GO:0030579) |
| 0.1 | 2.1 | GO:0000413 | protein peptidyl-prolyl isomerization(GO:0000413) |
| 0.1 | 0.3 | GO:0051547 | regulation of keratinocyte migration(GO:0051547) positive regulation of keratinocyte migration(GO:0051549) |
| 0.1 | 0.4 | GO:0033499 | galactose catabolic process via UDP-galactose(GO:0033499) glycolytic process from galactose(GO:0061623) |
| 0.1 | 0.5 | GO:0030948 | negative regulation of vascular endothelial growth factor receptor signaling pathway(GO:0030948) |
| 0.1 | 0.7 | GO:0016255 | attachment of GPI anchor to protein(GO:0016255) |
| 0.1 | 0.5 | GO:0061179 | negative regulation of insulin secretion involved in cellular response to glucose stimulus(GO:0061179) |
| 0.1 | 0.3 | GO:0048199 | vesicle targeting, to, from or within Golgi(GO:0048199) |
| 0.1 | 2.0 | GO:0034198 | cellular response to amino acid starvation(GO:0034198) |
| 0.1 | 1.7 | GO:0051567 | histone H3-K9 methylation(GO:0051567) |
| 0.1 | 0.3 | GO:0045653 | negative regulation of megakaryocyte differentiation(GO:0045653) |
| 0.1 | 0.5 | GO:0000480 | endonucleolytic cleavage in 5'-ETS of tricistronic rRNA transcript (SSU-rRNA, 5.8S rRNA, LSU-rRNA)(GO:0000480) |
| 0.1 | 0.3 | GO:1903525 | regulation of membrane tubulation(GO:1903525) |
| 0.1 | 1.3 | GO:0034340 | response to type I interferon(GO:0034340) |
| 0.1 | 1.9 | GO:0000028 | ribosomal small subunit assembly(GO:0000028) |
| 0.1 | 0.5 | GO:1902902 | negative regulation of autophagosome assembly(GO:1902902) |
| 0.1 | 5.5 | GO:0071346 | cellular response to interferon-gamma(GO:0071346) |
| 0.1 | 0.4 | GO:0031468 | nuclear envelope reassembly(GO:0031468) |
| 0.1 | 0.4 | GO:0048254 | snoRNA localization(GO:0048254) |
| 0.1 | 1.0 | GO:0035518 | histone H2A monoubiquitination(GO:0035518) |
| 0.1 | 0.3 | GO:1903371 | regulation of endoplasmic reticulum tubular network organization(GO:1903371) |
| 0.1 | 2.9 | GO:0007131 | reciprocal meiotic recombination(GO:0007131) reciprocal DNA recombination(GO:0035825) |
| 0.1 | 1.8 | GO:0016578 | histone deubiquitination(GO:0016578) |
| 0.1 | 0.4 | GO:0042276 | error-prone translesion synthesis(GO:0042276) |
| 0.1 | 0.1 | GO:0048102 | autophagic cell death(GO:0048102) |
| 0.1 | 0.4 | GO:0010818 | T cell chemotaxis(GO:0010818) |
| 0.1 | 0.9 | GO:0006349 | regulation of gene expression by genetic imprinting(GO:0006349) |
| 0.1 | 0.4 | GO:0032570 | response to progesterone(GO:0032570) |
| 0.1 | 0.1 | GO:0046490 | isopentenyl diphosphate metabolic process(GO:0046490) |
| 0.1 | 1.0 | GO:0060628 | regulation of ER to Golgi vesicle-mediated transport(GO:0060628) |
| 0.1 | 0.1 | GO:2000672 | negative regulation of motor neuron apoptotic process(GO:2000672) |
| 0.1 | 1.0 | GO:0006241 | CTP biosynthetic process(GO:0006241) pyrimidine ribonucleotide biosynthetic process(GO:0009220) CTP metabolic process(GO:0046036) pyrimidine ribonucleoside biosynthetic process(GO:0046132) |
| 0.1 | 0.5 | GO:0042138 | meiotic DNA double-strand break formation(GO:0042138) |
| 0.1 | 2.2 | GO:0006879 | cellular iron ion homeostasis(GO:0006879) |
| 0.1 | 0.4 | GO:0002431 | Fc receptor mediated stimulatory signaling pathway(GO:0002431) |
| 0.1 | 3.0 | GO:1901796 | regulation of signal transduction by p53 class mediator(GO:1901796) |
| 0.1 | 0.2 | GO:0021590 | cerebellum maturation(GO:0021590) cerebellar cortex maturation(GO:0021699) |
| 0.1 | 2.2 | GO:0006695 | cholesterol biosynthetic process(GO:0006695) secondary alcohol biosynthetic process(GO:1902653) |
| 0.1 | 0.9 | GO:0003351 | epithelial cilium movement(GO:0003351) |
| 0.1 | 0.2 | GO:0007529 | establishment of synaptic specificity at neuromuscular junction(GO:0007529) |
| 0.1 | 4.6 | GO:0007041 | lysosomal transport(GO:0007041) |
| 0.1 | 0.4 | GO:0010792 | DNA double-strand break processing involved in repair via single-strand annealing(GO:0010792) |
| 0.1 | 0.5 | GO:0043173 | nucleotide salvage(GO:0043173) |
| 0.1 | 0.5 | GO:0044406 | adhesion of symbiont to host(GO:0044406) |
| 0.1 | 0.1 | GO:1901382 | chorionic trophoblast cell proliferation(GO:0097360) regulation of chorionic trophoblast cell proliferation(GO:1901382) |
| 0.1 | 0.2 | GO:0009826 | unidimensional cell growth(GO:0009826) |
| 0.1 | 0.1 | GO:0007096 | regulation of exit from mitosis(GO:0007096) |
| 0.1 | 2.1 | GO:0000186 | activation of MAPKK activity(GO:0000186) |
| 0.1 | 0.7 | GO:0042989 | sequestering of actin monomers(GO:0042989) |
| 0.1 | 0.4 | GO:1903301 | positive regulation of glucokinase activity(GO:0033133) positive regulation of hexokinase activity(GO:1903301) |
| 0.1 | 3.4 | GO:0006635 | fatty acid beta-oxidation(GO:0006635) |
| 0.1 | 0.6 | GO:0007288 | sperm axoneme assembly(GO:0007288) |
| 0.1 | 0.5 | GO:0001561 | fatty acid alpha-oxidation(GO:0001561) |
| 0.1 | 0.5 | GO:0042635 | positive regulation of hair cycle(GO:0042635) |
| 0.1 | 0.6 | GO:0003352 | regulation of cilium movement(GO:0003352) |
| 0.1 | 1.0 | GO:0032329 | serine transport(GO:0032329) |
| 0.1 | 0.4 | GO:0031100 | organ regeneration(GO:0031100) |
| 0.1 | 0.5 | GO:0045648 | positive regulation of erythrocyte differentiation(GO:0045648) |
| 0.1 | 0.2 | GO:0060060 | post-embryonic retina morphogenesis in camera-type eye(GO:0060060) |
| 0.1 | 3.9 | GO:0030490 | maturation of SSU-rRNA(GO:0030490) |
| 0.1 | 0.9 | GO:0033327 | Leydig cell differentiation(GO:0033327) |
| 0.1 | 2.0 | GO:0001958 | endochondral ossification(GO:0001958) replacement ossification(GO:0036075) |
| 0.1 | 0.4 | GO:0045901 | positive regulation of translational elongation(GO:0045901) |
| 0.1 | 1.1 | GO:0098930 | axonal transport(GO:0098930) |
| 0.1 | 0.4 | GO:0030223 | neutrophil differentiation(GO:0030223) |
| 0.1 | 2.8 | GO:0021591 | ventricular system development(GO:0021591) |
| 0.1 | 0.6 | GO:0051123 | RNA polymerase II transcriptional preinitiation complex assembly(GO:0051123) |
| 0.1 | 1.0 | GO:0007191 | adenylate cyclase-activating dopamine receptor signaling pathway(GO:0007191) |
| 0.1 | 0.8 | GO:0046007 | negative regulation of activated T cell proliferation(GO:0046007) |
| 0.1 | 0.2 | GO:0070562 | regulation of vitamin D receptor signaling pathway(GO:0070562) |
| 0.1 | 0.3 | GO:0032484 | Ral protein signal transduction(GO:0032484) regulation of Ral protein signal transduction(GO:0032485) |
| 0.1 | 0.1 | GO:0035962 | response to interleukin-13(GO:0035962) cellular response to interleukin-13(GO:0035963) |
| 0.1 | 0.1 | GO:0035947 | regulation of gluconeogenesis by regulation of transcription from RNA polymerase II promoter(GO:0035947) |
| 0.1 | 0.1 | GO:0045065 | cytotoxic T cell differentiation(GO:0045065) |
| 0.1 | 0.1 | GO:0001692 | histamine metabolic process(GO:0001692) |
| 0.1 | 0.7 | GO:1901984 | negative regulation of protein acetylation(GO:1901984) |
| 0.1 | 0.2 | GO:0019081 | viral translation(GO:0019081) |
| 0.1 | 0.6 | GO:0090080 | positive regulation of MAPKKK cascade by fibroblast growth factor receptor signaling pathway(GO:0090080) |
| 0.1 | 0.3 | GO:0010760 | negative regulation of macrophage chemotaxis(GO:0010760) |
| 0.1 | 0.5 | GO:0019673 | GDP-mannose metabolic process(GO:0019673) |
| 0.1 | 0.3 | GO:0042866 | pyruvate biosynthetic process(GO:0042866) |
| 0.1 | 0.9 | GO:0001833 | inner cell mass cell proliferation(GO:0001833) |
| 0.1 | 0.3 | GO:0015819 | lysine transport(GO:0015819) |
| 0.1 | 0.3 | GO:0006419 | alanyl-tRNA aminoacylation(GO:0006419) |
| 0.1 | 0.5 | GO:0000012 | single strand break repair(GO:0000012) |
| 0.1 | 0.3 | GO:0046185 | aldehyde catabolic process(GO:0046185) |
| 0.1 | 0.2 | GO:0016259 | selenocysteine metabolic process(GO:0016259) |
| 0.1 | 0.4 | GO:0048733 | sebaceous gland development(GO:0048733) |
| 0.1 | 0.3 | GO:0051197 | positive regulation of cofactor metabolic process(GO:0051194) positive regulation of coenzyme metabolic process(GO:0051197) |
| 0.1 | 0.6 | GO:0097120 | receptor localization to synapse(GO:0097120) |
| 0.1 | 0.4 | GO:1901317 | regulation of sperm motility(GO:1901317) |
| 0.1 | 0.4 | GO:0042541 | hemoglobin biosynthetic process(GO:0042541) |
| 0.1 | 0.3 | GO:0006772 | thiamine metabolic process(GO:0006772) thiamine-containing compound metabolic process(GO:0042723) |
| 0.1 | 0.3 | GO:0042454 | purine nucleoside catabolic process(GO:0006152) ribonucleoside catabolic process(GO:0042454) purine ribonucleoside catabolic process(GO:0046130) |
| 0.1 | 0.1 | GO:0034499 | late endosome to Golgi transport(GO:0034499) |
| 0.1 | 0.3 | GO:0033601 | positive regulation of mammary gland epithelial cell proliferation(GO:0033601) |
| 0.1 | 0.1 | GO:0060297 | regulation of sarcomere organization(GO:0060297) |
| 0.1 | 1.1 | GO:0002052 | positive regulation of neuroblast proliferation(GO:0002052) |
| 0.1 | 0.1 | GO:0002426 | immunoglobulin production in mucosal tissue(GO:0002426) |
| 0.1 | 0.8 | GO:0090224 | regulation of mitotic spindle organization(GO:0060236) regulation of spindle organization(GO:0090224) |
| 0.1 | 0.4 | GO:0015813 | L-glutamate transport(GO:0015813) |
| 0.1 | 1.4 | GO:0006890 | retrograde vesicle-mediated transport, Golgi to ER(GO:0006890) |
| 0.1 | 0.8 | GO:0046339 | diacylglycerol metabolic process(GO:0046339) |
| 0.1 | 0.2 | GO:0051599 | response to hydrostatic pressure(GO:0051599) |
| 0.1 | 1.5 | GO:0015701 | bicarbonate transport(GO:0015701) |
| 0.1 | 0.1 | GO:1902369 | negative regulation of RNA catabolic process(GO:1902369) |
| 0.1 | 0.7 | GO:0030718 | germ-line stem cell population maintenance(GO:0030718) |
| 0.1 | 0.7 | GO:0032310 | prostaglandin secretion(GO:0032310) |
| 0.1 | 0.2 | GO:1901300 | positive regulation of hydrogen peroxide-mediated programmed cell death(GO:1901300) positive regulation of hydrogen peroxide-induced cell death(GO:1905206) |
| 0.1 | 0.8 | GO:0061099 | negative regulation of protein tyrosine kinase activity(GO:0061099) |
| 0.1 | 0.3 | GO:0097680 | double-strand break repair via classical nonhomologous end joining(GO:0097680) |
| 0.1 | 1.0 | GO:0007080 | mitotic metaphase plate congression(GO:0007080) |
| 0.1 | 0.7 | GO:0007168 | receptor guanylyl cyclase signaling pathway(GO:0007168) |
| 0.1 | 0.1 | GO:0002428 | antigen processing and presentation of peptide antigen via MHC class Ib(GO:0002428) |
| 0.1 | 0.1 | GO:1900118 | negative regulation of execution phase of apoptosis(GO:1900118) |
| 0.1 | 0.2 | GO:0051970 | negative regulation of transmission of nerve impulse(GO:0051970) |
| 0.1 | 0.5 | GO:0001886 | endothelial cell morphogenesis(GO:0001886) |
| 0.1 | 0.3 | GO:2001137 | positive regulation of endocytic recycling(GO:2001137) |
| 0.1 | 0.1 | GO:1902414 | protein localization to cell junction(GO:1902414) |
| 0.1 | 0.6 | GO:0046415 | urate metabolic process(GO:0046415) |
| 0.1 | 0.9 | GO:0071545 | inositol phosphate catabolic process(GO:0071545) |
| 0.1 | 3.3 | GO:0072332 | intrinsic apoptotic signaling pathway by p53 class mediator(GO:0072332) |
| 0.1 | 3.0 | GO:0050821 | protein stabilization(GO:0050821) |
| 0.1 | 0.1 | GO:1905098 | negative regulation of guanyl-nucleotide exchange factor activity(GO:1905098) |
| 0.1 | 0.9 | GO:0008206 | bile acid metabolic process(GO:0008206) |
| 0.1 | 1.1 | GO:0044783 | G1 DNA damage checkpoint(GO:0044783) |
| 0.1 | 1.4 | GO:0010842 | retina layer formation(GO:0010842) |
| 0.1 | 0.2 | GO:0070391 | response to lipoteichoic acid(GO:0070391) cellular response to lipoteichoic acid(GO:0071223) |
| 0.1 | 0.6 | GO:0072337 | modified amino acid transport(GO:0072337) |
| 0.1 | 0.3 | GO:0019532 | oxalate transport(GO:0019532) |
| 0.1 | 0.4 | GO:0020027 | hemoglobin metabolic process(GO:0020027) |
| 0.1 | 0.8 | GO:0051956 | negative regulation of amino acid transport(GO:0051956) |
| 0.1 | 0.1 | GO:0071314 | cellular response to cocaine(GO:0071314) |
| 0.1 | 0.1 | GO:0060948 | cardiac vascular smooth muscle cell development(GO:0060948) |
| 0.1 | 0.1 | GO:2001274 | negative regulation of glucose import in response to insulin stimulus(GO:2001274) |
| 0.1 | 0.3 | GO:0003148 | outflow tract septum morphogenesis(GO:0003148) |
| 0.1 | 0.1 | GO:0042760 | very long-chain fatty acid catabolic process(GO:0042760) |
| 0.1 | 0.4 | GO:1990440 | positive regulation of transcription from RNA polymerase II promoter in response to endoplasmic reticulum stress(GO:1990440) |
| 0.1 | 1.0 | GO:2000251 | positive regulation of actin cytoskeleton reorganization(GO:2000251) |
| 0.1 | 0.1 | GO:0009642 | response to light intensity(GO:0009642) |
| 0.1 | 0.8 | GO:0006828 | manganese ion transport(GO:0006828) |
| 0.1 | 12.6 | GO:0006869 | lipid transport(GO:0006869) |
| 0.1 | 0.3 | GO:0032227 | negative regulation of synaptic transmission, dopaminergic(GO:0032227) |
| 0.1 | 0.2 | GO:0033132 | negative regulation of glucokinase activity(GO:0033132) negative regulation of hexokinase activity(GO:1903300) |
| 0.1 | 0.1 | GO:0006407 | rRNA export from nucleus(GO:0006407) |
| 0.1 | 0.2 | GO:0060430 | lung saccule development(GO:0060430) |
| 0.1 | 0.2 | GO:2000189 | positive regulation of cholesterol homeostasis(GO:2000189) |
| 0.1 | 0.1 | GO:0006573 | valine metabolic process(GO:0006573) |
| 0.1 | 2.4 | GO:0006284 | base-excision repair(GO:0006284) |
| 0.1 | 0.2 | GO:0010888 | negative regulation of lipid storage(GO:0010888) negative regulation of sequestering of triglyceride(GO:0010891) |
| 0.1 | 0.2 | GO:0007442 | hindgut morphogenesis(GO:0007442) embryonic hindgut morphogenesis(GO:0048619) |
| 0.1 | 2.7 | GO:0000184 | nuclear-transcribed mRNA catabolic process, nonsense-mediated decay(GO:0000184) |
| 0.1 | 0.7 | GO:0030220 | platelet formation(GO:0030220) |
| 0.1 | 0.2 | GO:0060278 | regulation of ovulation(GO:0060278) |
| 0.1 | 0.6 | GO:0046548 | retinal rod cell development(GO:0046548) |
| 0.1 | 0.2 | GO:0060290 | transdifferentiation(GO:0060290) |
| 0.1 | 0.2 | GO:0071286 | cellular response to magnesium ion(GO:0071286) |
| 0.1 | 0.7 | GO:0046641 | positive regulation of alpha-beta T cell proliferation(GO:0046641) |
| 0.1 | 0.1 | GO:0006167 | AMP biosynthetic process(GO:0006167) |
| 0.1 | 0.1 | GO:1901534 | positive regulation of hematopoietic progenitor cell differentiation(GO:1901534) |
| 0.1 | 0.3 | GO:0010884 | positive regulation of lipid storage(GO:0010884) |
| 0.1 | 0.2 | GO:0042374 | phylloquinone metabolic process(GO:0042374) phylloquinone catabolic process(GO:0042376) quinone catabolic process(GO:1901662) |
| 0.1 | 0.1 | GO:0014707 | branchiomeric skeletal muscle development(GO:0014707) |
| 0.1 | 0.3 | GO:0060385 | axonogenesis involved in innervation(GO:0060385) |
| 0.1 | 0.2 | GO:0006532 | aspartate biosynthetic process(GO:0006532) |
| 0.1 | 0.1 | GO:0035542 | regulation of SNARE complex assembly(GO:0035542) |
| 0.1 | 0.3 | GO:0055094 | response to lipoprotein particle(GO:0055094) |
| 0.1 | 1.2 | GO:0043277 | apoptotic cell clearance(GO:0043277) |
| 0.1 | 0.7 | GO:0014898 | muscle hypertrophy in response to stress(GO:0003299) cardiac muscle adaptation(GO:0014887) cardiac muscle hypertrophy in response to stress(GO:0014898) |
| 0.1 | 0.5 | GO:0030259 | lipid glycosylation(GO:0030259) |
| 0.1 | 0.8 | GO:0055070 | copper ion homeostasis(GO:0055070) |
| 0.1 | 0.2 | GO:0010637 | negative regulation of mitochondrial fusion(GO:0010637) |
| 0.1 | 0.4 | GO:0030091 | protein repair(GO:0030091) |
| 0.1 | 0.2 | GO:0034629 | cellular protein complex localization(GO:0034629) |
| 0.1 | 0.1 | GO:0003221 | right ventricular cardiac muscle tissue morphogenesis(GO:0003221) |
| 0.1 | 3.4 | GO:0071391 | cellular response to estrogen stimulus(GO:0071391) |
| 0.1 | 2.2 | GO:0051693 | actin filament capping(GO:0051693) |
| 0.1 | 0.2 | GO:0008334 | histone mRNA metabolic process(GO:0008334) histone mRNA catabolic process(GO:0071044) |
| 0.1 | 0.2 | GO:0072718 | response to cisplatin(GO:0072718) |
| 0.1 | 0.2 | GO:0007217 | tachykinin receptor signaling pathway(GO:0007217) |
| 0.1 | 0.3 | GO:1902897 | regulation of postsynaptic density protein 95 clustering(GO:1902897) |
| 0.1 | 2.5 | GO:0006406 | mRNA export from nucleus(GO:0006406) mRNA-containing ribonucleoprotein complex export from nucleus(GO:0071427) |
| 0.1 | 0.3 | GO:0008291 | acetylcholine metabolic process(GO:0008291) acetate ester metabolic process(GO:1900619) |
| 0.1 | 0.5 | GO:0071468 | cellular response to acidic pH(GO:0071468) |
| 0.1 | 0.3 | GO:0043589 | skin morphogenesis(GO:0043589) |
| 0.1 | 0.3 | GO:0042789 | mRNA transcription from RNA polymerase II promoter(GO:0042789) |
| 0.1 | 0.3 | GO:0051546 | keratinocyte migration(GO:0051546) |
| 0.1 | 0.4 | GO:0034975 | protein folding in endoplasmic reticulum(GO:0034975) |
| 0.1 | 3.7 | GO:0051297 | centrosome organization(GO:0051297) |
| 0.1 | 0.6 | GO:0000290 | deadenylation-dependent decapping of nuclear-transcribed mRNA(GO:0000290) |
| 0.1 | 0.3 | GO:2000270 | negative regulation of fibroblast apoptotic process(GO:2000270) |
| 0.1 | 0.3 | GO:0001672 | regulation of chromatin assembly or disassembly(GO:0001672) |
| 0.1 | 0.6 | GO:0031297 | replication fork processing(GO:0031297) |
| 0.1 | 1.2 | GO:0046854 | phosphatidylinositol phosphorylation(GO:0046854) |
| 0.1 | 0.4 | GO:0050859 | negative regulation of B cell receptor signaling pathway(GO:0050859) |
| 0.1 | 0.1 | GO:1904938 | dopaminergic neuron axon guidance(GO:0036514) planar cell polarity pathway involved in axon guidance(GO:1904938) |
| 0.1 | 0.4 | GO:0071569 | protein ufmylation(GO:0071569) protein polyufmylation(GO:1990564) protein K69-linked ufmylation(GO:1990592) |
| 0.1 | 0.1 | GO:0034729 | histone H3-K79 methylation(GO:0034729) |
| 0.1 | 0.1 | GO:1900102 | negative regulation of endoplasmic reticulum unfolded protein response(GO:1900102) |
| 0.1 | 0.2 | GO:0070257 | positive regulation of mucus secretion(GO:0070257) |
| 0.1 | 0.1 | GO:0032148 | activation of protein kinase B activity(GO:0032148) |
| 0.1 | 0.3 | GO:0015015 | heparan sulfate proteoglycan biosynthetic process, enzymatic modification(GO:0015015) |
| 0.1 | 0.5 | GO:0032959 | inositol trisphosphate biosynthetic process(GO:0032959) |
| 0.1 | 0.1 | GO:0070827 | chromatin maintenance(GO:0070827) |
| 0.1 | 0.2 | GO:1904666 | regulation of ubiquitin protein ligase activity(GO:1904666) |
| 0.1 | 0.2 | GO:0008355 | olfactory learning(GO:0008355) |
| 0.1 | 0.1 | GO:1990441 | negative regulation of transcription from RNA polymerase II promoter in response to endoplasmic reticulum stress(GO:1990441) |
| 0.1 | 1.5 | GO:0034605 | cellular response to heat(GO:0034605) |
| 0.1 | 0.8 | GO:0006301 | postreplication repair(GO:0006301) |
| 0.1 | 0.3 | GO:2000484 | positive regulation of interleukin-8 secretion(GO:2000484) |
| 0.1 | 0.5 | GO:0019800 | peptide cross-linking via chondroitin 4-sulfate glycosaminoglycan(GO:0019800) |
| 0.1 | 0.9 | GO:0031268 | pseudopodium organization(GO:0031268) |
| 0.1 | 0.2 | GO:0070934 | CRD-mediated mRNA stabilization(GO:0070934) |
| 0.1 | 0.7 | GO:0006691 | leukotriene metabolic process(GO:0006691) |
| 0.1 | 1.0 | GO:0044088 | regulation of vacuole organization(GO:0044088) |
| 0.1 | 0.1 | GO:0060260 | regulation of transcription initiation from RNA polymerase II promoter(GO:0060260) |
| 0.1 | 0.7 | GO:0019395 | fatty acid oxidation(GO:0019395) |
| 0.1 | 0.4 | GO:0097500 | receptor localization to nonmotile primary cilium(GO:0097500) |
| 0.1 | 0.8 | GO:0006891 | intra-Golgi vesicle-mediated transport(GO:0006891) |
| 0.1 | 0.7 | GO:0035065 | regulation of histone acetylation(GO:0035065) |
| 0.1 | 1.2 | GO:0045840 | positive regulation of mitotic nuclear division(GO:0045840) |
| 0.1 | 0.2 | GO:0032286 | central nervous system myelin maintenance(GO:0032286) |
| 0.1 | 0.4 | GO:0003283 | atrial septum development(GO:0003283) |
| 0.1 | 0.1 | GO:0035493 | SNARE complex assembly(GO:0035493) |
| 0.1 | 0.2 | GO:0010958 | regulation of amino acid import(GO:0010958) regulation of L-arginine import(GO:0010963) |
| 0.1 | 0.2 | GO:0033634 | positive regulation of cell-cell adhesion mediated by integrin(GO:0033634) |
| 0.1 | 0.1 | GO:0034134 | toll-like receptor 2 signaling pathway(GO:0034134) |
| 0.1 | 1.6 | GO:0032088 | negative regulation of NF-kappaB transcription factor activity(GO:0032088) |
| 0.1 | 0.1 | GO:0007418 | ventral midline development(GO:0007418) |
| 0.1 | 0.2 | GO:0000729 | DNA double-strand break processing(GO:0000729) |
| 0.1 | 0.1 | GO:0001698 | gastrin-induced gastric acid secretion(GO:0001698) positive regulation of pancreatic juice secretion(GO:0090187) |
| 0.1 | 0.2 | GO:0043985 | histone H4-R3 methylation(GO:0043985) |
| 0.1 | 0.4 | GO:0006110 | regulation of glycolytic process(GO:0006110) |
| 0.1 | 0.1 | GO:0002074 | extraocular skeletal muscle development(GO:0002074) |
| 0.1 | 0.1 | GO:0090666 | scaRNA localization to Cajal body(GO:0090666) |
| 0.1 | 1.0 | GO:1904030 | negative regulation of cyclin-dependent protein serine/threonine kinase activity(GO:0045736) negative regulation of cyclin-dependent protein kinase activity(GO:1904030) |
| 0.1 | 0.1 | GO:0002589 | regulation of antigen processing and presentation of peptide antigen via MHC class I(GO:0002589) |
| 0.1 | 0.3 | GO:1902895 | positive regulation of pri-miRNA transcription from RNA polymerase II promoter(GO:1902895) |
| 0.1 | 0.2 | GO:0061304 | retinal blood vessel morphogenesis(GO:0061304) |
| 0.1 | 0.1 | GO:1900368 | regulation of RNA interference(GO:1900368) |
| 0.1 | 0.1 | GO:0006689 | ganglioside catabolic process(GO:0006689) |
| 0.1 | 0.9 | GO:0030866 | cortical actin cytoskeleton organization(GO:0030866) |
| 0.1 | 0.4 | GO:0006370 | 7-methylguanosine mRNA capping(GO:0006370) |
| 0.1 | 0.8 | GO:0071539 | protein localization to centrosome(GO:0071539) |
| 0.1 | 0.1 | GO:0032762 | mast cell cytokine production(GO:0032762) |
| 0.1 | 0.2 | GO:0042732 | D-xylose metabolic process(GO:0042732) |
| 0.1 | 0.5 | GO:0048148 | behavioral response to cocaine(GO:0048148) |
| 0.1 | 1.2 | GO:0060612 | adipose tissue development(GO:0060612) |
| 0.1 | 0.2 | GO:0045835 | negative regulation of meiotic nuclear division(GO:0045835) |
| 0.1 | 0.2 | GO:0034638 | phosphatidylcholine catabolic process(GO:0034638) |
| 0.1 | 0.1 | GO:0071895 | odontoblast differentiation(GO:0071895) |
| 0.1 | 2.1 | GO:0006414 | translational elongation(GO:0006414) |
| 0.1 | 3.2 | GO:0030168 | platelet activation(GO:0030168) |
| 0.1 | 0.4 | GO:0014072 | response to isoquinoline alkaloid(GO:0014072) response to morphine(GO:0043278) |
| 0.1 | 0.2 | GO:1990414 | replication-born double-strand break repair via sister chromatid exchange(GO:1990414) |
| 0.1 | 0.2 | GO:0040031 | snRNA modification(GO:0040031) |
| 0.1 | 0.6 | GO:0042347 | negative regulation of NF-kappaB import into nucleus(GO:0042347) |
| 0.1 | 1.2 | GO:0048240 | sperm capacitation(GO:0048240) |
| 0.1 | 0.2 | GO:1900037 | regulation of cellular response to hypoxia(GO:1900037) |
| 0.1 | 0.2 | GO:0006297 | nucleotide-excision repair, DNA gap filling(GO:0006297) |
| 0.1 | 0.3 | GO:0010739 | positive regulation of protein kinase A signaling(GO:0010739) |
| 0.1 | 0.8 | GO:0043984 | histone H4-K16 acetylation(GO:0043984) |
| 0.1 | 1.1 | GO:0046488 | phosphatidylinositol metabolic process(GO:0046488) |
| 0.1 | 0.3 | GO:0010838 | positive regulation of keratinocyte proliferation(GO:0010838) |
| 0.1 | 0.2 | GO:0060837 | blood vessel endothelial cell differentiation(GO:0060837) |
| 0.1 | 0.5 | GO:0006851 | mitochondrial calcium ion transport(GO:0006851) |
| 0.1 | 0.1 | GO:1903044 | protein transport into membrane raft(GO:0032596) protein localization to membrane raft(GO:1903044) |
| 0.1 | 0.3 | GO:0070269 | pyroptosis(GO:0070269) |
| 0.1 | 0.3 | GO:0006620 | posttranslational protein targeting to membrane(GO:0006620) |
| 0.1 | 0.5 | GO:0090026 | positive regulation of monocyte chemotaxis(GO:0090026) |
| 0.1 | 0.7 | GO:0022617 | extracellular matrix disassembly(GO:0022617) |
| 0.1 | 0.1 | GO:0030327 | prenylated protein catabolic process(GO:0030327) |
| 0.1 | 0.1 | GO:0033566 | gamma-tubulin complex localization(GO:0033566) |
| 0.1 | 0.3 | GO:0045792 | negative regulation of cell size(GO:0045792) |
| 0.1 | 0.4 | GO:0051350 | negative regulation of lyase activity(GO:0051350) |
| 0.1 | 0.4 | GO:0003298 | physiological muscle hypertrophy(GO:0003298) physiological cardiac muscle hypertrophy(GO:0003301) cell growth involved in cardiac muscle cell development(GO:0061049) |
| 0.1 | 0.3 | GO:0070493 | thrombin receptor signaling pathway(GO:0070493) |
| 0.1 | 0.5 | GO:0043306 | positive regulation of mast cell activation involved in immune response(GO:0033008) positive regulation of mast cell degranulation(GO:0043306) |
| 0.1 | 0.1 | GO:0009182 | purine deoxyribonucleoside diphosphate metabolic process(GO:0009182) dGDP metabolic process(GO:0046066) |
| 0.1 | 0.1 | GO:0033299 | secretion of lysosomal enzymes(GO:0033299) |
| 0.1 | 0.1 | GO:0007440 | foregut morphogenesis(GO:0007440) |
| 0.1 | 0.1 | GO:0046533 | negative regulation of photoreceptor cell differentiation(GO:0046533) |
| 0.1 | 0.1 | GO:0060677 | ureteric bud elongation(GO:0060677) |
| 0.1 | 1.1 | GO:0044784 | metaphase/anaphase transition of mitotic cell cycle(GO:0007091) regulation of mitotic sister chromatid segregation(GO:0033047) metaphase/anaphase transition of cell cycle(GO:0044784) |
| 0.1 | 0.4 | GO:0051225 | spindle assembly(GO:0051225) |
| 0.1 | 0.3 | GO:0006703 | estrogen biosynthetic process(GO:0006703) |
| 0.1 | 0.1 | GO:0003056 | regulation of vascular smooth muscle contraction(GO:0003056) |
| 0.1 | 0.1 | GO:0006269 | DNA replication, synthesis of RNA primer(GO:0006269) |
| 0.1 | 0.3 | GO:0038063 | collagen-activated tyrosine kinase receptor signaling pathway(GO:0038063) |
| 0.1 | 0.4 | GO:0007341 | penetration of zona pellucida(GO:0007341) |
| 0.1 | 0.4 | GO:0090502 | RNA phosphodiester bond hydrolysis, endonucleolytic(GO:0090502) |
| 0.1 | 0.4 | GO:0032008 | positive regulation of TOR signaling(GO:0032008) |
| 0.1 | 0.2 | GO:1902715 | positive regulation of interferon-gamma secretion(GO:1902715) |
| 0.1 | 0.4 | GO:0043162 | ubiquitin-dependent protein catabolic process via the multivesicular body sorting pathway(GO:0043162) |
| 0.1 | 0.6 | GO:0008211 | glucocorticoid metabolic process(GO:0008211) |
| 0.1 | 0.2 | GO:1901843 | positive regulation of high voltage-gated calcium channel activity(GO:1901843) |
| 0.1 | 0.1 | GO:0044243 | multicellular organism catabolic process(GO:0044243) |
| 0.1 | 0.1 | GO:0015747 | urate transport(GO:0015747) |
| 0.1 | 0.1 | GO:0035589 | G-protein coupled purinergic nucleotide receptor signaling pathway(GO:0035589) |
| 0.1 | 1.0 | GO:0032784 | regulation of DNA-templated transcription, elongation(GO:0032784) |
| 0.1 | 0.3 | GO:1902236 | negative regulation of endoplasmic reticulum stress-induced intrinsic apoptotic signaling pathway(GO:1902236) |
| 0.1 | 0.2 | GO:0007252 | I-kappaB phosphorylation(GO:0007252) |
| 0.1 | 0.1 | GO:0002408 | myeloid dendritic cell chemotaxis(GO:0002408) |
| 0.1 | 0.2 | GO:0090036 | regulation of protein kinase C signaling(GO:0090036) |
| 0.1 | 0.1 | GO:0046835 | carbohydrate phosphorylation(GO:0046835) |
| 0.1 | 0.1 | GO:0061577 | calcium ion transmembrane transport via high voltage-gated calcium channel(GO:0061577) |
| 0.1 | 0.5 | GO:1902850 | mitotic spindle assembly(GO:0090307) microtubule cytoskeleton organization involved in mitosis(GO:1902850) |
| 0.1 | 0.3 | GO:0035855 | megakaryocyte development(GO:0035855) |
| 0.1 | 0.5 | GO:0000060 | protein import into nucleus, translocation(GO:0000060) |
| 0.1 | 0.1 | GO:0060631 | regulation of meiosis I(GO:0060631) |
| 0.1 | 0.4 | GO:0010640 | regulation of platelet-derived growth factor receptor signaling pathway(GO:0010640) |
| 0.1 | 0.7 | GO:0045577 | regulation of B cell differentiation(GO:0045577) |
| 0.1 | 0.1 | GO:0033147 | negative regulation of intracellular estrogen receptor signaling pathway(GO:0033147) |
| 0.1 | 1.0 | GO:0009649 | entrainment of circadian clock(GO:0009649) |
| 0.1 | 0.1 | GO:0044339 | canonical Wnt signaling pathway involved in osteoblast differentiation(GO:0044339) |
| 0.1 | 0.5 | GO:0006706 | steroid catabolic process(GO:0006706) |
| 0.1 | 0.1 | GO:0014873 | response to muscle activity involved in regulation of muscle adaptation(GO:0014873) |
| 0.1 | 0.1 | GO:0016080 | synaptic vesicle targeting(GO:0016080) |
| 0.1 | 0.1 | GO:0009128 | purine nucleoside monophosphate catabolic process(GO:0009128) |
| 0.1 | 0.2 | GO:0017198 | N-terminal peptidyl-serine acetylation(GO:0017198) N-terminal peptidyl-glutamic acid acetylation(GO:0018002) peptidyl-serine acetylation(GO:0030920) |
| 0.1 | 1.3 | GO:0006958 | complement activation, classical pathway(GO:0006958) |
| 0.1 | 0.3 | GO:0036297 | interstrand cross-link repair(GO:0036297) |
| 0.1 | 0.1 | GO:0046628 | positive regulation of insulin receptor signaling pathway(GO:0046628) |
| 0.1 | 0.5 | GO:0045947 | negative regulation of translational initiation(GO:0045947) |
| 0.1 | 1.2 | GO:0000470 | maturation of LSU-rRNA(GO:0000470) |
| 0.1 | 0.5 | GO:1900372 | negative regulation of nucleotide biosynthetic process(GO:0030809) negative regulation of purine nucleotide biosynthetic process(GO:1900372) |
| 0.1 | 0.3 | GO:0030835 | negative regulation of actin filament depolymerization(GO:0030835) |
| 0.1 | 0.7 | GO:0015012 | heparan sulfate proteoglycan biosynthetic process(GO:0015012) |
| 0.1 | 0.1 | GO:0051712 | positive regulation of killing of cells of other organism(GO:0051712) |
| 0.1 | 0.8 | GO:0008053 | mitochondrial fusion(GO:0008053) |
| 0.1 | 0.7 | GO:0071466 | cellular response to xenobiotic stimulus(GO:0071466) |
| 0.1 | 0.1 | GO:0046184 | aldehyde biosynthetic process(GO:0046184) |
| 0.1 | 1.4 | GO:0009408 | response to heat(GO:0009408) |
| 0.1 | 0.1 | GO:0036289 | peptidyl-serine autophosphorylation(GO:0036289) |
| 0.1 | 0.5 | GO:0032620 | interleukin-17 production(GO:0032620) |
| 0.1 | 0.1 | GO:0010446 | response to alkaline pH(GO:0010446) |
| 0.1 | 0.8 | GO:1902652 | secondary alcohol metabolic process(GO:1902652) |
| 0.1 | 1.8 | GO:0006611 | protein export from nucleus(GO:0006611) |
| 0.1 | 0.3 | GO:0006513 | protein monoubiquitination(GO:0006513) |
| 0.1 | 0.1 | GO:0002337 | B-1a B cell differentiation(GO:0002337) |
| 0.1 | 0.2 | GO:0001880 | Mullerian duct regression(GO:0001880) |
| 0.1 | 0.3 | GO:0032780 | negative regulation of ATPase activity(GO:0032780) |
| 0.1 | 0.2 | GO:0061029 | eyelid development in camera-type eye(GO:0061029) |
| 0.1 | 0.1 | GO:0035902 | response to immobilization stress(GO:0035902) |
| 0.1 | 0.2 | GO:1901660 | calcium ion export(GO:1901660) |
| 0.1 | 0.1 | GO:0045019 | negative regulation of nitric oxide biosynthetic process(GO:0045019) negative regulation of nitric oxide metabolic process(GO:1904406) |
| 0.1 | 0.1 | GO:0009648 | photoperiodism(GO:0009648) |
| 0.1 | 0.9 | GO:0032011 | ARF protein signal transduction(GO:0032011) regulation of ARF protein signal transduction(GO:0032012) |
| 0.1 | 0.3 | GO:0080182 | histone H3-K4 trimethylation(GO:0080182) |
| 0.1 | 0.2 | GO:0006911 | phagocytosis, engulfment(GO:0006911) |
| 0.1 | 0.4 | GO:1902108 | regulation of mitochondrial membrane permeability involved in apoptotic process(GO:1902108) |
| 0.1 | 0.4 | GO:0042770 | signal transduction in response to DNA damage(GO:0042770) |
| 0.1 | 0.2 | GO:0044598 | polyketide metabolic process(GO:0030638) aminoglycoside antibiotic metabolic process(GO:0030647) daunorubicin metabolic process(GO:0044597) doxorubicin metabolic process(GO:0044598) |
| 0.1 | 0.1 | GO:0034472 | snRNA 3'-end processing(GO:0034472) |
| 0.1 | 0.2 | GO:0010800 | positive regulation of peptidyl-threonine phosphorylation(GO:0010800) |
| 0.1 | 3.9 | GO:0008654 | phospholipid biosynthetic process(GO:0008654) |
| 0.1 | 0.1 | GO:0042222 | interleukin-1 biosynthetic process(GO:0042222) |
| 0.1 | 0.2 | GO:2001168 | regulation of histone H2B ubiquitination(GO:2001166) positive regulation of histone H2B ubiquitination(GO:2001168) |
| 0.1 | 0.1 | GO:0051131 | chaperone-mediated protein complex assembly(GO:0051131) |
| 0.1 | 0.1 | GO:0030240 | skeletal muscle thin filament assembly(GO:0030240) |
| 0.1 | 0.1 | GO:0015705 | iodide transport(GO:0015705) |
| 0.1 | 0.1 | GO:0043084 | penile erection(GO:0043084) |
| 0.1 | 0.1 | GO:0032825 | positive regulation of natural killer cell differentiation(GO:0032825) |
| 0.1 | 0.2 | GO:0048170 | positive regulation of long-term neuronal synaptic plasticity(GO:0048170) |
| 0.1 | 0.1 | GO:0060971 | embryonic heart tube left/right pattern formation(GO:0060971) |
| 0.1 | 0.5 | GO:0052697 | xenobiotic glucuronidation(GO:0052697) |
| 0.1 | 0.2 | GO:0034628 | nicotinamide nucleotide biosynthetic process from aspartate(GO:0019355) 'de novo' NAD biosynthetic process from aspartate(GO:0034628) |
| 0.1 | 0.2 | GO:0014883 | transition between fast and slow fiber(GO:0014883) |
| 0.1 | 0.1 | GO:0003062 | regulation of heart rate by chemical signal(GO:0003062) |
| 0.1 | 0.2 | GO:0097284 | hepatocyte apoptotic process(GO:0097284) |
| 0.1 | 0.6 | GO:0016226 | iron-sulfur cluster assembly(GO:0016226) metallo-sulfur cluster assembly(GO:0031163) |
| 0.1 | 0.1 | GO:0051000 | positive regulation of nitric-oxide synthase activity(GO:0051000) |
| 0.1 | 0.1 | GO:0098902 | regulation of membrane depolarization during action potential(GO:0098902) |
| 0.1 | 0.1 | GO:2000987 | positive regulation of fear response(GO:1903367) positive regulation of behavioral fear response(GO:2000987) |
| 0.1 | 0.1 | GO:0001915 | negative regulation of T cell mediated cytotoxicity(GO:0001915) |
| 0.1 | 0.3 | GO:0006004 | fucose metabolic process(GO:0006004) |
| 0.1 | 0.1 | GO:0043653 | mitochondrial fragmentation involved in apoptotic process(GO:0043653) |
| 0.1 | 0.7 | GO:0009250 | glycogen biosynthetic process(GO:0005978) glucan biosynthetic process(GO:0009250) |
| 0.1 | 0.1 | GO:0045005 | DNA-dependent DNA replication maintenance of fidelity(GO:0045005) |
| 0.1 | 0.1 | GO:0061013 | regulation of mRNA catabolic process(GO:0061013) positive regulation of mRNA catabolic process(GO:0061014) |
| 0.1 | 0.1 | GO:2000507 | positive regulation of energy homeostasis(GO:2000507) |
| 0.1 | 0.2 | GO:0090292 | nuclear matrix organization(GO:0043578) nuclear matrix anchoring at nuclear membrane(GO:0090292) |
| 0.1 | 0.4 | GO:0044380 | protein localization to cytoskeleton(GO:0044380) |
| 0.1 | 0.1 | GO:0070682 | proteasome regulatory particle assembly(GO:0070682) |
| 0.1 | 0.1 | GO:0090271 | positive regulation of fibroblast growth factor production(GO:0090271) |
| 0.1 | 0.1 | GO:0046598 | positive regulation of viral entry into host cell(GO:0046598) |
| 0.1 | 0.1 | GO:0035864 | response to potassium ion(GO:0035864) cellular response to potassium ion(GO:0035865) |
| 0.1 | 0.3 | GO:0070131 | positive regulation of mitochondrial translation(GO:0070131) |
| 0.1 | 0.1 | GO:0043152 | induction of bacterial agglutination(GO:0043152) |
| 0.1 | 0.4 | GO:0042407 | cristae formation(GO:0042407) |
| 0.1 | 0.9 | GO:0030261 | chromosome condensation(GO:0030261) |
| 0.1 | 0.4 | GO:0097150 | neuronal stem cell population maintenance(GO:0097150) |
| 0.1 | 0.9 | GO:0007274 | neuromuscular synaptic transmission(GO:0007274) |
| 0.1 | 0.3 | GO:0061000 | negative regulation of dendritic spine development(GO:0061000) |
| 0.1 | 0.2 | GO:0060252 | positive regulation of glial cell proliferation(GO:0060252) |
| 0.1 | 0.2 | GO:0070129 | regulation of mitochondrial translation(GO:0070129) |
| 0.1 | 0.2 | GO:1903025 | regulation of RNA polymerase II regulatory region sequence-specific DNA binding(GO:1903025) |
| 0.1 | 0.2 | GO:0015780 | nucleotide-sugar transport(GO:0015780) pyrimidine nucleotide-sugar transport(GO:0015781) |
| 0.1 | 0.3 | GO:0098762 | meiotic prophase I(GO:0007128) prophase(GO:0051324) meiotic cell cycle phase(GO:0098762) meiosis I cell cycle phase(GO:0098764) |
| 0.1 | 0.3 | GO:1990126 | retrograde transport, endosome to plasma membrane(GO:1990126) |
| 0.1 | 1.5 | GO:0000387 | spliceosomal snRNP assembly(GO:0000387) |
| 0.1 | 0.2 | GO:0051725 | protein de-ADP-ribosylation(GO:0051725) |
| 0.1 | 0.2 | GO:0019321 | pentose metabolic process(GO:0019321) |
| 0.1 | 0.1 | GO:1904424 | regulation of GTP binding(GO:1904424) |
| 0.1 | 0.1 | GO:0051450 | myoblast proliferation(GO:0051450) |
| 0.1 | 0.1 | GO:1902751 | positive regulation of cell cycle G2/M phase transition(GO:1902751) |
| 0.1 | 0.1 | GO:0071462 | cellular response to water stimulus(GO:0071462) |
| 0.1 | 0.3 | GO:0006621 | protein retention in ER lumen(GO:0006621) |
| 0.1 | 0.9 | GO:0045454 | cell redox homeostasis(GO:0045454) |
| 0.1 | 0.3 | GO:0002076 | osteoblast development(GO:0002076) |
| 0.1 | 0.1 | GO:0050687 | negative regulation of defense response to virus(GO:0050687) |
| 0.1 | 0.6 | GO:0097031 | NADH dehydrogenase complex assembly(GO:0010257) mitochondrial respiratory chain complex I assembly(GO:0032981) mitochondrial respiratory chain complex I biogenesis(GO:0097031) |
| 0.1 | 0.1 | GO:0030046 | parallel actin filament bundle assembly(GO:0030046) |
| 0.1 | 0.2 | GO:0006435 | threonyl-tRNA aminoacylation(GO:0006435) |
| 0.1 | 1.1 | GO:0007200 | phospholipase C-activating G-protein coupled receptor signaling pathway(GO:0007200) |
| 0.1 | 0.1 | GO:2000402 | negative regulation of lymphocyte migration(GO:2000402) |
| 0.1 | 0.3 | GO:0035162 | embryonic hemopoiesis(GO:0035162) |
| 0.1 | 0.1 | GO:0097049 | motor neuron apoptotic process(GO:0097049) |
| 0.1 | 0.1 | GO:0016584 | nucleosome positioning(GO:0016584) |
| 0.1 | 0.2 | GO:0018317 | protein C-linked glycosylation(GO:0018103) peptidyl-tryptophan modification(GO:0018211) protein C-linked glycosylation via tryptophan(GO:0018317) protein C-linked glycosylation via 2'-alpha-mannosyl-L-tryptophan(GO:0018406) |
| 0.1 | 0.1 | GO:0010907 | positive regulation of glucose metabolic process(GO:0010907) |
| 0.1 | 0.2 | GO:0009226 | nucleotide-sugar biosynthetic process(GO:0009226) |
| 0.1 | 0.4 | GO:0006883 | cellular sodium ion homeostasis(GO:0006883) |
| 0.0 | 0.1 | GO:0033563 | dorsal/ventral axon guidance(GO:0033563) |
| 0.0 | 0.4 | GO:0030968 | endoplasmic reticulum unfolded protein response(GO:0030968) |
| 0.0 | 0.0 | GO:0070255 | regulation of mucus secretion(GO:0070255) |
| 0.0 | 0.0 | GO:0006566 | threonine metabolic process(GO:0006566) |
| 0.0 | 0.1 | GO:0048312 | intracellular distribution of mitochondria(GO:0048312) |
| 0.0 | 2.6 | GO:0098792 | xenophagy(GO:0098792) |
| 0.0 | 0.2 | GO:0050891 | multicellular organismal water homeostasis(GO:0050891) |
| 0.0 | 0.3 | GO:1901223 | negative regulation of NIK/NF-kappaB signaling(GO:1901223) |
| 0.0 | 0.1 | GO:0014054 | positive regulation of gamma-aminobutyric acid secretion(GO:0014054) |
| 0.0 | 0.3 | GO:0010719 | negative regulation of epithelial to mesenchymal transition(GO:0010719) |
| 0.0 | 0.0 | GO:0019372 | lipoxygenase pathway(GO:0019372) |
| 0.0 | 0.0 | GO:0050847 | progesterone receptor signaling pathway(GO:0050847) |
| 0.0 | 0.1 | GO:0006368 | transcription elongation from RNA polymerase II promoter(GO:0006368) |
| 0.0 | 0.1 | GO:0071243 | cellular response to arsenic-containing substance(GO:0071243) |
| 0.0 | 0.1 | GO:0070873 | regulation of glycogen metabolic process(GO:0070873) |
| 0.0 | 0.0 | GO:0051344 | negative regulation of cyclic-nucleotide phosphodiesterase activity(GO:0051344) |
| 0.0 | 0.3 | GO:0006107 | oxaloacetate metabolic process(GO:0006107) |
| 0.0 | 0.5 | GO:0060575 | intestinal epithelial cell differentiation(GO:0060575) |
| 0.0 | 1.5 | GO:0000423 | macromitophagy(GO:0000423) |
| 0.0 | 0.2 | GO:0032757 | positive regulation of interleukin-8 production(GO:0032757) |
| 0.0 | 1.4 | GO:0006637 | acyl-CoA metabolic process(GO:0006637) thioester metabolic process(GO:0035383) |
| 0.0 | 0.1 | GO:0009249 | protein lipoylation(GO:0009249) |
| 0.0 | 0.1 | GO:0030050 | vesicle transport along actin filament(GO:0030050) |
| 0.0 | 0.8 | GO:0006096 | glycolytic process(GO:0006096) |
| 0.0 | 0.3 | GO:0050884 | neuromuscular process controlling posture(GO:0050884) |
| 0.0 | 0.2 | GO:0009251 | glycogen catabolic process(GO:0005980) glucan catabolic process(GO:0009251) cellular polysaccharide catabolic process(GO:0044247) |
| 0.0 | 0.6 | GO:0061298 | retina vasculature development in camera-type eye(GO:0061298) |
| 0.0 | 0.0 | GO:0003184 | pulmonary valve development(GO:0003177) pulmonary valve morphogenesis(GO:0003184) |
| 0.0 | 0.0 | GO:0045348 | positive regulation of MHC class II biosynthetic process(GO:0045348) |
| 0.0 | 0.0 | GO:0010749 | regulation of nitric oxide mediated signal transduction(GO:0010749) |
| 0.0 | 0.5 | GO:0045214 | sarcomere organization(GO:0045214) |
| 0.0 | 0.4 | GO:0006359 | regulation of transcription from RNA polymerase III promoter(GO:0006359) |
| 0.0 | 0.3 | GO:0006123 | mitochondrial electron transport, cytochrome c to oxygen(GO:0006123) |
| 0.0 | 0.0 | GO:0051799 | negative regulation of hair follicle development(GO:0051799) |
| 0.0 | 0.0 | GO:0048539 | bone marrow development(GO:0048539) |
| 0.0 | 0.0 | GO:0061484 | hematopoietic stem cell homeostasis(GO:0061484) |
| 0.0 | 0.1 | GO:0070234 | positive regulation of T cell apoptotic process(GO:0070234) |
| 0.0 | 0.1 | GO:0051029 | rRNA transport(GO:0051029) |
| 0.0 | 0.1 | GO:0021702 | cerebellar Purkinje cell differentiation(GO:0021702) |
| 0.0 | 1.0 | GO:0006829 | zinc II ion transport(GO:0006829) |
| 0.0 | 0.1 | GO:0051444 | negative regulation of ubiquitin-protein transferase activity(GO:0051444) |
| 0.0 | 0.0 | GO:1901983 | regulation of protein acetylation(GO:1901983) |
| 0.0 | 0.2 | GO:0010954 | positive regulation of protein processing(GO:0010954) positive regulation of protein maturation(GO:1903319) |
| 0.0 | 0.4 | GO:0021521 | ventral spinal cord interneuron specification(GO:0021521) cell fate specification involved in pattern specification(GO:0060573) |
| 0.0 | 0.1 | GO:0007343 | egg activation(GO:0007343) |
| 0.0 | 0.6 | GO:0043268 | positive regulation of potassium ion transport(GO:0043268) |
| 0.0 | 0.0 | GO:0032610 | interleukin-1 alpha production(GO:0032610) |
| 0.0 | 0.1 | GO:0006348 | chromatin silencing at telomere(GO:0006348) |
| 0.0 | 0.3 | GO:0071711 | basement membrane organization(GO:0071711) |
| 0.0 | 0.2 | GO:0030212 | hyaluronan metabolic process(GO:0030212) |
| 0.0 | 0.1 | GO:0021534 | cell proliferation in hindbrain(GO:0021534) |
| 0.0 | 0.5 | GO:0033561 | regulation of water loss via skin(GO:0033561) |
| 0.0 | 0.1 | GO:2000253 | positive regulation of feeding behavior(GO:2000253) |
| 0.0 | 0.1 | GO:0002827 | positive regulation of T-helper 1 type immune response(GO:0002827) |
| 0.0 | 0.2 | GO:0000076 | DNA replication checkpoint(GO:0000076) |
| 0.0 | 0.1 | GO:0031061 | negative regulation of histone methylation(GO:0031061) |
| 0.0 | 0.2 | GO:0015697 | quaternary ammonium group transport(GO:0015697) |
| 0.0 | 0.2 | GO:0033273 | response to vitamin(GO:0033273) |
| 0.0 | 0.0 | GO:2000574 | regulation of microtubule motor activity(GO:2000574) |
| 0.0 | 0.0 | GO:1902415 | regulation of mRNA binding(GO:1902415) regulation of RNA binding(GO:1905214) |
| 0.0 | 0.2 | GO:0032486 | Rap protein signal transduction(GO:0032486) |
| 0.0 | 0.0 | GO:0044068 | modulation by symbiont of host cellular process(GO:0044068) |
| 0.0 | 0.2 | GO:1901976 | regulation of cell cycle checkpoint(GO:1901976) |
| 0.0 | 0.0 | GO:2000483 | negative regulation of interleukin-8 secretion(GO:2000483) |
| 0.0 | 2.3 | GO:0008643 | carbohydrate transport(GO:0008643) |
| 0.0 | 0.0 | GO:0032717 | negative regulation of interleukin-8 production(GO:0032717) |
| 0.0 | 0.1 | GO:0042559 | pteridine-containing compound biosynthetic process(GO:0042559) |
| 0.0 | 0.2 | GO:0042632 | cholesterol homeostasis(GO:0042632) sterol homeostasis(GO:0055092) |
| 0.0 | 0.2 | GO:0007213 | G-protein coupled acetylcholine receptor signaling pathway(GO:0007213) |
| 0.0 | 0.1 | GO:1903795 | regulation of inorganic anion transmembrane transport(GO:1903795) |
| 0.0 | 0.0 | GO:2000210 | positive regulation of anoikis(GO:2000210) |
| 0.0 | 1.0 | GO:1902600 | hydrogen ion transmembrane transport(GO:1902600) |
| 0.0 | 0.1 | GO:0002291 | T cell activation via T cell receptor contact with antigen bound to MHC molecule on antigen presenting cell(GO:0002291) |
| 0.0 | 0.0 | GO:1901164 | negative regulation of trophoblast cell migration(GO:1901164) |
| 0.0 | 0.0 | GO:0034620 | cellular response to unfolded protein(GO:0034620) |
| 0.0 | 0.2 | GO:0051220 | cytoplasmic sequestering of protein(GO:0051220) |
| 0.0 | 0.3 | GO:0006120 | mitochondrial electron transport, NADH to ubiquinone(GO:0006120) |
| 0.0 | 1.1 | GO:0007173 | epidermal growth factor receptor signaling pathway(GO:0007173) |
| 0.0 | 0.1 | GO:0035020 | regulation of Rac protein signal transduction(GO:0035020) |
| 0.0 | 0.3 | GO:0033235 | positive regulation of protein sumoylation(GO:0033235) |
| 0.0 | 0.7 | GO:0043631 | mRNA polyadenylation(GO:0006378) RNA polyadenylation(GO:0043631) |
| 0.0 | 0.0 | GO:0045591 | positive regulation of regulatory T cell differentiation(GO:0045591) |
| 0.0 | 0.1 | GO:0046037 | GMP metabolic process(GO:0046037) |
| 0.0 | 0.0 | GO:0038065 | collagen-activated signaling pathway(GO:0038065) |
| 0.0 | 0.0 | GO:0006481 | C-terminal protein methylation(GO:0006481) |
| 0.0 | 0.2 | GO:0046040 | IMP metabolic process(GO:0046040) |
| 0.0 | 0.1 | GO:0060055 | angiogenesis involved in wound healing(GO:0060055) |
| 0.0 | 0.2 | GO:0080154 | regulation of fertilization(GO:0080154) |
| 0.0 | 0.0 | GO:1900028 | negative regulation of ruffle assembly(GO:1900028) |
| 0.0 | 0.1 | GO:0070417 | cellular response to cold(GO:0070417) |
| 0.0 | 0.1 | GO:1903966 | monounsaturated fatty acid metabolic process(GO:1903964) monounsaturated fatty acid biosynthetic process(GO:1903966) |
| 0.0 | 0.0 | GO:0048625 | myoblast fate commitment(GO:0048625) |
| 0.0 | 0.5 | GO:0000154 | rRNA modification(GO:0000154) |
| 0.0 | 0.3 | GO:0006482 | protein demethylation(GO:0006482) protein dealkylation(GO:0008214) |
| 0.0 | 0.1 | GO:0006561 | proline biosynthetic process(GO:0006561) |
| 0.0 | 0.1 | GO:1902459 | positive regulation of stem cell population maintenance(GO:1902459) |
| 0.0 | 0.1 | GO:0006054 | N-acetylneuraminate metabolic process(GO:0006054) |
| 0.0 | 0.1 | GO:0031023 | microtubule organizing center organization(GO:0031023) |
| 0.0 | 0.2 | GO:0047496 | vesicle transport along microtubule(GO:0047496) |
| 0.0 | 0.0 | GO:0046532 | regulation of photoreceptor cell differentiation(GO:0046532) |
| 0.0 | 0.1 | GO:2000325 | regulation of ligand-dependent nuclear receptor transcription coactivator activity(GO:2000325) positive regulation of ligand-dependent nuclear receptor transcription coactivator activity(GO:2000327) |
| 0.0 | 0.8 | GO:0006694 | steroid biosynthetic process(GO:0006694) |
| 0.0 | 0.1 | GO:0035988 | chondrocyte proliferation(GO:0035988) |
| 0.0 | 0.0 | GO:0070828 | heterochromatin organization(GO:0070828) |
| 0.0 | 0.2 | GO:0048566 | embryonic digestive tract development(GO:0048566) |
| 0.0 | 0.9 | GO:0003281 | ventricular septum development(GO:0003281) |
| 0.0 | 0.2 | GO:0071347 | cellular response to interleukin-1(GO:0071347) |
| 0.0 | 0.2 | GO:0060216 | definitive hemopoiesis(GO:0060216) |
| 0.0 | 0.0 | GO:0007184 | SMAD protein import into nucleus(GO:0007184) |
| 0.0 | 0.0 | GO:0042706 | eye photoreceptor cell fate commitment(GO:0042706) photoreceptor cell fate commitment(GO:0046552) |
| 0.0 | 0.3 | GO:0006625 | protein targeting to peroxisome(GO:0006625) peroxisomal transport(GO:0043574) protein localization to peroxisome(GO:0072662) establishment of protein localization to peroxisome(GO:0072663) |
| 0.0 | 0.3 | GO:0051923 | sulfation(GO:0051923) |
| 0.0 | 0.3 | GO:0043206 | extracellular fibril organization(GO:0043206) |
| 0.0 | 0.1 | GO:0006556 | S-adenosylmethionine biosynthetic process(GO:0006556) |
| 0.0 | 0.2 | GO:0031293 | membrane protein intracellular domain proteolysis(GO:0031293) |
| 0.0 | 0.3 | GO:0070633 | transepithelial transport(GO:0070633) |
| 0.0 | 0.1 | GO:0070986 | left/right axis specification(GO:0070986) |
| 0.0 | 0.3 | GO:0070208 | protein heterotrimerization(GO:0070208) |
| 0.0 | 0.1 | GO:0002322 | B cell proliferation involved in immune response(GO:0002322) |
| 0.0 | 0.1 | GO:0048739 | cardiac muscle fiber development(GO:0048739) |
| 0.0 | 0.1 | GO:0051189 | Mo-molybdopterin cofactor biosynthetic process(GO:0006777) Mo-molybdopterin cofactor metabolic process(GO:0019720) molybdopterin cofactor biosynthetic process(GO:0032324) molybdopterin cofactor metabolic process(GO:0043545) prosthetic group metabolic process(GO:0051189) |
| 0.0 | 0.4 | GO:0070098 | chemokine-mediated signaling pathway(GO:0070098) |
| 0.0 | 0.1 | GO:0032222 | regulation of synaptic transmission, cholinergic(GO:0032222) |
| 0.0 | 0.0 | GO:0033860 | regulation of NAD(P)H oxidase activity(GO:0033860) |
| 0.0 | 0.1 | GO:0072529 | pyrimidine-containing compound catabolic process(GO:0072529) |
| 0.0 | 0.0 | GO:0009946 | proximal/distal axis specification(GO:0009946) |
| 0.0 | 0.1 | GO:0035021 | negative regulation of Rac protein signal transduction(GO:0035021) |
| 0.0 | 0.1 | GO:1902775 | mitochondrial ribosome assembly(GO:0061668) mitochondrial large ribosomal subunit assembly(GO:1902775) |
| 0.0 | 1.0 | GO:0032543 | mitochondrial translation(GO:0032543) |
| 0.0 | 0.1 | GO:1904385 | cellular response to angiotensin(GO:1904385) response to angiotensin(GO:1990776) |
| 0.0 | 0.1 | GO:0010626 | negative regulation of Schwann cell proliferation(GO:0010626) |
| 0.0 | 0.1 | GO:0031572 | G2 DNA damage checkpoint(GO:0031572) |
| 0.0 | 0.1 | GO:0045060 | negative thymic T cell selection(GO:0045060) |
| 0.0 | 0.1 | GO:0006650 | glycerophospholipid metabolic process(GO:0006650) |
| 0.0 | 0.1 | GO:0017183 | peptidyl-diphthamide metabolic process(GO:0017182) peptidyl-diphthamide biosynthetic process from peptidyl-histidine(GO:0017183) peptidyl-histidine modification(GO:0018202) |
| 0.0 | 0.0 | GO:0035768 | cell chemotaxis to fibroblast growth factor(GO:0035766) endothelial cell chemotaxis to fibroblast growth factor(GO:0035768) regulation of cell chemotaxis to fibroblast growth factor(GO:1904847) regulation of endothelial cell chemotaxis to fibroblast growth factor(GO:2000544) |
| 0.0 | 0.0 | GO:0061046 | regulation of branching involved in lung morphogenesis(GO:0061046) |
| 0.0 | 0.0 | GO:0039702 | viral budding via host ESCRT complex(GO:0039702) |
| 0.0 | 0.0 | GO:0090365 | regulation of mRNA modification(GO:0090365) |
| 0.0 | 0.0 | GO:0045606 | positive regulation of epidermal cell differentiation(GO:0045606) |
| 0.0 | 0.6 | GO:0050829 | defense response to Gram-negative bacterium(GO:0050829) |
| 0.0 | 0.1 | GO:1990403 | embryonic brain development(GO:1990403) |
| 0.0 | 0.1 | GO:0032713 | negative regulation of interleukin-4 production(GO:0032713) |
| 0.0 | 0.3 | GO:0002902 | regulation of B cell apoptotic process(GO:0002902) |
| 0.0 | 0.1 | GO:0033615 | mitochondrial proton-transporting ATP synthase complex assembly(GO:0033615) |
| 0.0 | 0.2 | GO:0006754 | ATP biosynthetic process(GO:0006754) |
| 0.0 | 0.2 | GO:2000479 | regulation of cAMP-dependent protein kinase activity(GO:2000479) |
| 0.0 | 0.2 | GO:0001990 | regulation of systemic arterial blood pressure by hormone(GO:0001990) |
| 0.0 | 0.0 | GO:0032239 | regulation of nucleobase-containing compound transport(GO:0032239) regulation of RNA export from nucleus(GO:0046831) |
| 0.0 | 0.0 | GO:0032957 | inositol trisphosphate metabolic process(GO:0032957) |
| 0.0 | 0.0 | GO:0007066 | female meiosis sister chromatid cohesion(GO:0007066) |
| 0.0 | 0.1 | GO:0070307 | lens fiber cell development(GO:0070307) |
| 0.0 | 0.1 | GO:0045830 | positive regulation of isotype switching(GO:0045830) |
| 0.0 | 0.1 | GO:0032898 | neurotrophin production(GO:0032898) |
| 0.0 | 0.3 | GO:0050910 | detection of mechanical stimulus involved in sensory perception of sound(GO:0050910) |
| 0.0 | 0.3 | GO:0016926 | protein desumoylation(GO:0016926) |
| 0.0 | 0.0 | GO:0032277 | negative regulation of gonadotropin secretion(GO:0032277) |
| 0.0 | 0.0 | GO:0009155 | purine deoxyribonucleotide catabolic process(GO:0009155) |
| 0.0 | 0.1 | GO:0048386 | positive regulation of retinoic acid receptor signaling pathway(GO:0048386) |
| 0.0 | 0.0 | GO:0072282 | metanephric nephron tubule morphogenesis(GO:0072282) |
| 0.0 | 0.1 | GO:0000160 | phosphorelay signal transduction system(GO:0000160) |
| 0.0 | 0.1 | GO:0042126 | nitrate metabolic process(GO:0042126) |
| 0.0 | 0.0 | GO:0032272 | negative regulation of protein polymerization(GO:0032272) |
| 0.0 | 0.0 | GO:0072076 | nephrogenic mesenchyme development(GO:0072076) |
| 0.0 | 0.1 | GO:0018242 | protein O-linked glycosylation via serine(GO:0018242) |
| 0.0 | 0.2 | GO:0006144 | purine nucleobase metabolic process(GO:0006144) |
| 0.0 | 2.4 | GO:0016042 | lipid catabolic process(GO:0016042) |
| 0.0 | 0.1 | GO:0007007 | inner mitochondrial membrane organization(GO:0007007) |
| 0.0 | 0.1 | GO:0046909 | intermembrane transport(GO:0046909) |
| 0.0 | 0.1 | GO:0015740 | C4-dicarboxylate transport(GO:0015740) |
| 0.0 | 0.0 | GO:1990774 | regulation of tumor necrosis factor secretion(GO:1904467) tumor necrosis factor secretion(GO:1990774) |
| 0.0 | 0.1 | GO:0001955 | blood vessel maturation(GO:0001955) |
| 0.0 | 0.2 | GO:0051292 | nuclear pore complex assembly(GO:0051292) |
| 0.0 | 0.1 | GO:0072015 | glomerular visceral epithelial cell development(GO:0072015) glomerular epithelial cell development(GO:0072310) |
| 0.0 | 0.1 | GO:0060969 | negative regulation of gene silencing(GO:0060969) |
| 0.0 | 0.2 | GO:0006607 | NLS-bearing protein import into nucleus(GO:0006607) |
| 0.0 | 0.1 | GO:0035774 | positive regulation of insulin secretion involved in cellular response to glucose stimulus(GO:0035774) |
| 0.0 | 0.0 | GO:0034035 | purine ribonucleoside bisphosphate metabolic process(GO:0034035) |
| 0.0 | 0.3 | GO:0016180 | snRNA processing(GO:0016180) |
| 0.0 | 0.4 | GO:0048286 | lung alveolus development(GO:0048286) |
| 0.0 | 0.2 | GO:0051568 | histone H3-K4 methylation(GO:0051568) |
| 0.0 | 0.3 | GO:0072661 | protein targeting to plasma membrane(GO:0072661) |
| 0.0 | 0.0 | GO:0071476 | cellular hypotonic response(GO:0071476) |
| 0.0 | 0.1 | GO:0071321 | cellular response to cGMP(GO:0071321) |
| 0.0 | 0.1 | GO:0045604 | regulation of epidermal cell differentiation(GO:0045604) |
| 0.0 | 0.1 | GO:0008594 | photoreceptor cell morphogenesis(GO:0008594) |
| 0.0 | 0.1 | GO:0014067 | negative regulation of phosphatidylinositol 3-kinase signaling(GO:0014067) |
| 0.0 | 0.0 | GO:0006116 | NADH oxidation(GO:0006116) |
| 0.0 | 0.2 | GO:0035024 | negative regulation of Rho protein signal transduction(GO:0035024) |
| 0.0 | 0.3 | GO:0006919 | activation of cysteine-type endopeptidase activity involved in apoptotic process(GO:0006919) |
| 0.0 | 0.5 | GO:0003333 | amino acid transmembrane transport(GO:0003333) |
| 0.0 | 0.0 | GO:0031282 | regulation of guanylate cyclase activity(GO:0031282) |
| 0.0 | 0.3 | GO:0071880 | adenylate cyclase-activating adrenergic receptor signaling pathway(GO:0071880) |
| 0.0 | 0.0 | GO:0010452 | histone H3-K36 methylation(GO:0010452) |
| 0.0 | 0.2 | GO:0070193 | synaptonemal complex organization(GO:0070193) |
| 0.0 | 0.2 | GO:0000188 | inactivation of MAPK activity(GO:0000188) |
| 0.0 | 0.1 | GO:0000393 | spliceosomal conformational changes to generate catalytic conformation(GO:0000393) |
| 0.0 | 0.1 | GO:0060017 | parathyroid gland development(GO:0060017) |
| 0.0 | 0.0 | GO:0051036 | regulation of endosome size(GO:0051036) |
| 0.0 | 0.1 | GO:1902042 | negative regulation of extrinsic apoptotic signaling pathway via death domain receptors(GO:1902042) |
| 0.0 | 0.2 | GO:0040033 | negative regulation of translation, ncRNA-mediated(GO:0040033) regulation of translation, ncRNA-mediated(GO:0045974) |
| 0.0 | 0.0 | GO:0002934 | desmosome organization(GO:0002934) |
| 0.0 | 0.0 | GO:0018125 | peptidyl-cysteine methylation(GO:0018125) |
| 0.0 | 0.1 | GO:0008065 | establishment of blood-nerve barrier(GO:0008065) |
| 0.0 | 0.0 | GO:0009125 | nucleoside monophosphate catabolic process(GO:0009125) |
| 0.0 | 0.0 | GO:0032494 | response to peptidoglycan(GO:0032494) |
| 0.0 | 0.1 | GO:0051534 | negative regulation of NFAT protein import into nucleus(GO:0051534) |
| 0.0 | 0.2 | GO:0010388 | cullin deneddylation(GO:0010388) |
| 0.0 | 0.1 | GO:1901620 | regulation of smoothened signaling pathway involved in dorsal/ventral neural tube patterning(GO:1901620) negative regulation of smoothened signaling pathway involved in dorsal/ventral neural tube patterning(GO:1901621) |
| 0.0 | 0.1 | GO:0003431 | growth plate cartilage chondrocyte development(GO:0003431) |
| 0.0 | 0.0 | GO:0007161 | calcium-independent cell-matrix adhesion(GO:0007161) |
| 0.0 | 0.0 | GO:0002361 | CD4-positive, CD25-positive, alpha-beta regulatory T cell differentiation(GO:0002361) |
| 0.0 | 0.1 | GO:0030511 | positive regulation of transforming growth factor beta receptor signaling pathway(GO:0030511) positive regulation of cellular response to transforming growth factor beta stimulus(GO:1903846) |
| 0.0 | 0.0 | GO:0009080 | alanine metabolic process(GO:0006522) alanine catabolic process(GO:0006524) pyruvate family amino acid metabolic process(GO:0009078) pyruvate family amino acid catabolic process(GO:0009080) |
| 0.0 | 0.0 | GO:0015669 | gas transport(GO:0015669) carbon dioxide transport(GO:0015670) |
| 0.0 | 0.0 | GO:0048703 | embryonic viscerocranium morphogenesis(GO:0048703) |
| 0.0 | 0.1 | GO:0006405 | RNA export from nucleus(GO:0006405) |
| 0.0 | 0.1 | GO:0070542 | response to fatty acid(GO:0070542) |
| 0.0 | 0.0 | GO:0002072 | optic cup morphogenesis involved in camera-type eye development(GO:0002072) |
| 0.0 | 0.1 | GO:0018206 | peptidyl-methionine modification(GO:0018206) |
| 0.0 | 0.4 | GO:0034113 | heterotypic cell-cell adhesion(GO:0034113) |
| 0.0 | 0.2 | GO:0042403 | thyroid hormone metabolic process(GO:0042403) |
| 0.0 | 0.0 | GO:0046070 | dGTP metabolic process(GO:0046070) |
| 0.0 | 0.0 | GO:2000973 | regulation of pro-B cell differentiation(GO:2000973) |
| 0.0 | 0.0 | GO:0007223 | Wnt signaling pathway, calcium modulating pathway(GO:0007223) |
| 0.0 | 0.2 | GO:0002053 | positive regulation of mesenchymal cell proliferation(GO:0002053) |
| 0.0 | 0.1 | GO:0021546 | rhombomere development(GO:0021546) |
| 0.0 | 0.1 | GO:0007020 | microtubule nucleation(GO:0007020) |
| 0.0 | 0.0 | GO:0032290 | peripheral nervous system myelin formation(GO:0032290) |
| 0.0 | 0.1 | GO:0070314 | G1 to G0 transition(GO:0070314) |
| 0.0 | 0.0 | GO:0032495 | response to muramyl dipeptide(GO:0032495) |
| 0.0 | 0.0 | GO:0045297 | mating plug formation(GO:0042628) single-organism reproductive behavior(GO:0044704) post-mating behavior(GO:0045297) |
| 0.0 | 0.5 | GO:0000956 | nuclear-transcribed mRNA catabolic process(GO:0000956) |
| 0.0 | 0.3 | GO:0051289 | protein homotetramerization(GO:0051289) |
| 0.0 | 0.1 | GO:1901387 | positive regulation of voltage-gated calcium channel activity(GO:1901387) |
| 0.0 | 0.2 | GO:0010508 | positive regulation of autophagy(GO:0010508) |
| 0.0 | 0.0 | GO:0044838 | cell quiescence(GO:0044838) |
| 0.0 | 0.1 | GO:0009992 | cellular water homeostasis(GO:0009992) |
| 0.0 | 0.2 | GO:0070979 | protein K11-linked ubiquitination(GO:0070979) |
| 0.0 | 0.0 | GO:0042761 | very long-chain fatty acid biosynthetic process(GO:0042761) |
| 0.0 | 0.0 | GO:0042097 | interleukin-4 biosynthetic process(GO:0042097) regulation of interleukin-4 biosynthetic process(GO:0045402) |
| 0.0 | 0.4 | GO:0018345 | protein palmitoylation(GO:0018345) |
| 0.0 | 0.5 | GO:0007093 | mitotic cell cycle checkpoint(GO:0007093) |
| 0.0 | 0.0 | GO:0061502 | early endosome to recycling endosome transport(GO:0061502) |
| 0.0 | 0.0 | GO:0001960 | negative regulation of cytokine-mediated signaling pathway(GO:0001960) |
| 0.0 | 0.1 | GO:0070584 | mitochondrion morphogenesis(GO:0070584) |
| 0.0 | 0.3 | GO:0031929 | TOR signaling(GO:0031929) |
| 0.0 | 0.0 | GO:0032532 | regulation of microvillus length(GO:0032532) |
| 0.0 | 0.7 | GO:0006865 | amino acid transport(GO:0006865) |
| 0.0 | 0.0 | GO:0050916 | sensory perception of sweet taste(GO:0050916) |
| 0.0 | 0.1 | GO:0042574 | retinal metabolic process(GO:0042574) |
| 0.0 | 0.2 | GO:0032098 | regulation of appetite(GO:0032098) |
| 0.0 | 0.1 | GO:0030224 | monocyte differentiation(GO:0030224) |
| 0.0 | 0.0 | GO:0051124 | synaptic growth at neuromuscular junction(GO:0051124) |
| 0.0 | 0.0 | GO:0016125 | sterol metabolic process(GO:0016125) |
| 0.0 | 0.0 | GO:0003348 | cardiac endothelial cell differentiation(GO:0003348) |
| 0.0 | 0.0 | GO:1903441 | protein localization to ciliary membrane(GO:1903441) |
| 0.0 | 0.2 | GO:0030857 | negative regulation of epithelial cell differentiation(GO:0030857) |
| 0.0 | 0.2 | GO:0006044 | N-acetylglucosamine metabolic process(GO:0006044) |
| 0.0 | 0.3 | GO:0007339 | binding of sperm to zona pellucida(GO:0007339) |
| 0.0 | 1.0 | GO:0010923 | negative regulation of phosphatase activity(GO:0010923) |
| 0.0 | 0.5 | GO:0061077 | chaperone-mediated protein folding(GO:0061077) |
| 0.0 | 0.4 | GO:0006749 | glutathione metabolic process(GO:0006749) |
| 0.0 | 0.8 | GO:0006457 | protein folding(GO:0006457) |
| 0.0 | 0.0 | GO:0006842 | tricarboxylic acid transport(GO:0006842) citrate transport(GO:0015746) |
| 0.0 | 0.0 | GO:0006003 | fructose 2,6-bisphosphate metabolic process(GO:0006003) |
| 0.0 | 0.1 | GO:0035582 | sequestering of BMP in extracellular matrix(GO:0035582) |
| 0.0 | 0.4 | GO:0006493 | protein O-linked glycosylation(GO:0006493) |
| 0.0 | 0.2 | GO:0033198 | response to ATP(GO:0033198) |
| 0.0 | 0.8 | GO:0070646 | protein modification by small protein removal(GO:0070646) |
| 0.0 | 1.1 | GO:0006631 | fatty acid metabolic process(GO:0006631) |
| 0.0 | 0.0 | GO:0006600 | creatine metabolic process(GO:0006600) |
| 0.0 | 0.0 | GO:0090135 | actin filament branching(GO:0090135) |
| 0.0 | 0.1 | GO:0010737 | protein kinase A signaling(GO:0010737) |
| 0.0 | 0.0 | GO:0016479 | negative regulation of transcription from RNA polymerase I promoter(GO:0016479) |
| 0.0 | 0.0 | GO:0050915 | sensory perception of sour taste(GO:0050915) |
| 0.0 | 0.4 | GO:0051028 | mRNA transport(GO:0051028) |
| 0.0 | 0.0 | GO:0050849 | negative regulation of calcium-mediated signaling(GO:0050849) |
| 0.0 | 0.2 | GO:0031111 | negative regulation of microtubule polymerization or depolymerization(GO:0031111) |
| 0.0 | 0.2 | GO:0043001 | Golgi to plasma membrane protein transport(GO:0043001) |
| 0.0 | 0.1 | GO:0045078 | positive regulation of interferon-gamma biosynthetic process(GO:0045078) |
| 0.0 | 0.1 | GO:0006265 | DNA topological change(GO:0006265) |
| 0.0 | 0.0 | GO:0060019 | radial glial cell differentiation(GO:0060019) |
| 0.0 | 0.1 | GO:0033015 | porphyrin-containing compound catabolic process(GO:0006787) tetrapyrrole catabolic process(GO:0033015) |
| 0.0 | 0.0 | GO:0071827 | plasma lipoprotein particle organization(GO:0071827) |
| 0.0 | 0.0 | GO:0031914 | negative regulation of synaptic plasticity(GO:0031914) |
| 0.0 | 0.0 | GO:0006000 | fructose metabolic process(GO:0006000) |
| 0.0 | 0.1 | GO:0034453 | microtubule anchoring(GO:0034453) |
| 0.0 | 0.0 | GO:0001835 | blastocyst hatching(GO:0001835) hatching(GO:0035188) organism emergence from protective structure(GO:0071684) |
| 0.0 | 0.1 | GO:0006027 | glycosaminoglycan catabolic process(GO:0006027) |
| 0.0 | 0.0 | GO:0002484 | antigen processing and presentation of endogenous peptide antigen via MHC class I via ER pathway(GO:0002484) antigen processing and presentation of endogenous peptide antigen via MHC class I via ER pathway, TAP-dependent(GO:0002485) |
| 0.0 | 0.1 | GO:0050832 | defense response to fungus(GO:0050832) |
| 0.0 | 0.1 | GO:0002710 | negative regulation of T cell mediated immunity(GO:0002710) |
| 0.0 | 0.0 | GO:0045085 | negative regulation of interleukin-2 biosynthetic process(GO:0045085) |
| 0.0 | 0.0 | GO:0046629 | gamma-delta T cell differentiation(GO:0042492) gamma-delta T cell activation(GO:0046629) |
| 0.0 | 0.0 | GO:0007386 | compartment pattern specification(GO:0007386) |
| 0.0 | 0.0 | GO:1904153 | negative regulation of protein exit from endoplasmic reticulum(GO:0070862) negative regulation of retrograde protein transport, ER to cytosol(GO:1904153) |
| 0.0 | 0.0 | GO:2000823 | regulation of androgen receptor activity(GO:2000823) |
| 0.0 | 0.0 | GO:0021692 | cerebellar Purkinje cell layer morphogenesis(GO:0021692) |
| 0.0 | 0.4 | GO:0030833 | regulation of actin filament polymerization(GO:0030833) |
| 0.0 | 0.0 | GO:0051388 | positive regulation of neurotrophin TRK receptor signaling pathway(GO:0051388) |
| 0.0 | 0.0 | GO:0002031 | G-protein coupled receptor internalization(GO:0002031) |
| 0.0 | 0.0 | GO:0071157 | negative regulation of cell cycle arrest(GO:0071157) |
| 0.0 | 0.1 | GO:0043011 | myeloid dendritic cell differentiation(GO:0043011) |
| 0.0 | 0.0 | GO:0035735 | intraciliary transport involved in cilium morphogenesis(GO:0035735) |
| 0.0 | 0.4 | GO:0034101 | erythrocyte homeostasis(GO:0034101) |
| 0.0 | 0.1 | GO:0050830 | defense response to Gram-positive bacterium(GO:0050830) |
| 0.0 | 0.1 | GO:0042640 | anagen(GO:0042640) |
| 0.0 | 0.1 | GO:0006081 | cellular aldehyde metabolic process(GO:0006081) |
| 0.0 | 0.0 | GO:0006354 | DNA-templated transcription, elongation(GO:0006354) |
| 0.0 | 0.0 | GO:0033630 | positive regulation of cell adhesion mediated by integrin(GO:0033630) |
| 0.0 | 0.0 | GO:0016048 | detection of temperature stimulus(GO:0016048) |
| 0.0 | 0.1 | GO:0007635 | chemosensory behavior(GO:0007635) |
| 0.0 | 0.0 | GO:0070528 | protein kinase C signaling(GO:0070528) |
| 0.0 | 0.0 | GO:0032801 | receptor catabolic process(GO:0032801) |
| 0.0 | 0.1 | GO:0051497 | negative regulation of stress fiber assembly(GO:0051497) |
| 0.0 | 0.0 | GO:0070318 | positive regulation of G0 to G1 transition(GO:0070318) |
| 0.0 | 0.1 | GO:0050651 | dermatan sulfate proteoglycan biosynthetic process(GO:0050651) |
| 0.0 | 0.0 | GO:1901894 | regulation of calcium-transporting ATPase activity(GO:1901894) |
| 0.0 | 0.0 | GO:0032714 | negative regulation of interleukin-5 production(GO:0032714) |
| 0.0 | 0.0 | GO:0060856 | establishment of blood-brain barrier(GO:0060856) |
| 0.0 | 0.0 | GO:1904431 | positive regulation of t-circle formation(GO:1904431) |
| 0.0 | 0.0 | GO:0035622 | intrahepatic bile duct development(GO:0035622) |
| 0.0 | 0.1 | GO:0008299 | isoprenoid biosynthetic process(GO:0008299) |
| 0.0 | 17.6 | GO:0007608 | sensory perception of smell(GO:0007608) |
| 0.0 | 0.2 | GO:0045582 | positive regulation of T cell differentiation(GO:0045582) |
| 0.0 | 0.0 | GO:0045086 | positive regulation of interleukin-2 biosynthetic process(GO:0045086) |
| 0.0 | 0.0 | GO:0016137 | glycoside metabolic process(GO:0016137) |
| 0.0 | 0.0 | GO:0045059 | positive thymic T cell selection(GO:0045059) |
| 0.0 | 0.0 | GO:0050732 | negative regulation of peptidyl-tyrosine phosphorylation(GO:0050732) |
| 0.0 | 0.0 | GO:0014874 | response to stimulus involved in regulation of muscle adaptation(GO:0014874) |
| 0.0 | 0.0 | GO:0009164 | nucleoside catabolic process(GO:0009164) |
| 0.0 | 0.0 | GO:0035608 | protein deglutamylation(GO:0035608) |
| 0.0 | 0.2 | GO:0032355 | response to estradiol(GO:0032355) |
| 0.0 | 0.0 | GO:1901020 | negative regulation of calcium ion transmembrane transporter activity(GO:1901020) |
| 0.0 | 0.1 | GO:0002690 | positive regulation of leukocyte chemotaxis(GO:0002690) |
| 0.0 | 0.1 | GO:0060065 | uterus development(GO:0060065) |
| 0.0 | 0.0 | GO:0036010 | protein localization to endosome(GO:0036010) |
| 0.0 | 0.0 | GO:0003162 | atrioventricular node development(GO:0003162) |
| 0.0 | 0.0 | GO:0051447 | negative regulation of meiotic cell cycle(GO:0051447) |
| 0.0 | 0.0 | GO:0090042 | tubulin deacetylation(GO:0090042) regulation of tubulin deacetylation(GO:0090043) |
| 0.0 | 0.0 | GO:0048247 | lymphocyte chemotaxis(GO:0048247) |
| 0.0 | 0.0 | GO:0022401 | desensitization of G-protein coupled receptor protein signaling pathway(GO:0002029) negative adaptation of signaling pathway(GO:0022401) |
| 0.0 | 0.0 | GO:0048241 | epinephrine transport(GO:0048241) |
| 0.0 | 0.1 | GO:0007088 | regulation of mitotic nuclear division(GO:0007088) |
| 0.0 | 0.0 | GO:0042427 | serotonin biosynthetic process(GO:0042427) primary amino compound biosynthetic process(GO:1901162) |
| 0.0 | 0.0 | GO:1900745 | positive regulation of p38MAPK cascade(GO:1900745) |
| 0.0 | 0.0 | GO:0014029 | neural crest formation(GO:0014029) |
| 0.0 | 0.0 | GO:0045721 | negative regulation of gluconeogenesis(GO:0045721) |
| 0.0 | 0.0 | GO:0035635 | entry of bacterium into host cell(GO:0035635) regulation of entry of bacterium into host cell(GO:2000535) |
| 0.0 | 0.1 | GO:1903363 | negative regulation of cellular protein catabolic process(GO:1903363) |
| 0.0 | 0.0 | GO:0046951 | ketone body biosynthetic process(GO:0046951) |
| 0.0 | 0.2 | GO:0001522 | pseudouridine synthesis(GO:0001522) |
| 0.0 | 0.1 | GO:0014059 | dopamine secretion(GO:0014046) regulation of dopamine secretion(GO:0014059) |
| 0.0 | 0.0 | GO:0008343 | adult feeding behavior(GO:0008343) |
| 0.0 | 0.0 | GO:0033148 | positive regulation of intracellular estrogen receptor signaling pathway(GO:0033148) |
| 0.0 | 0.1 | GO:0035458 | cellular response to interferon-beta(GO:0035458) |
| 0.0 | 0.0 | GO:0001865 | NK T cell differentiation(GO:0001865) |
| 0.0 | 0.0 | GO:1904872 | regulation of telomerase RNA localization to Cajal body(GO:1904872) positive regulation of telomerase RNA localization to Cajal body(GO:1904874) |
| 0.0 | 0.1 | GO:0009303 | rRNA transcription(GO:0009303) |
| 0.0 | 0.0 | GO:0001302 | replicative cell aging(GO:0001302) |
| 0.0 | 0.0 | GO:0060481 | lobar bronchus epithelium development(GO:0060481) lobar bronchus development(GO:0060482) |
| 0.0 | 0.1 | GO:0032527 | protein exit from endoplasmic reticulum(GO:0032527) |
| 0.0 | 0.0 | GO:0033683 | nucleotide-excision repair, DNA incision(GO:0033683) |
| 0.0 | 0.9 | GO:0007606 | sensory perception of chemical stimulus(GO:0007606) |
| 0.0 | 0.1 | GO:0036093 | germ cell proliferation(GO:0036093) |
| 0.0 | 0.0 | GO:1903430 | negative regulation of cell maturation(GO:1903430) |
| 0.0 | 0.0 | GO:0009794 | regulation of mitotic cell cycle, embryonic(GO:0009794) mitotic cell cycle, embryonic(GO:0045448) |
| 0.0 | 0.0 | GO:1903573 | negative regulation of response to endoplasmic reticulum stress(GO:1903573) |
| 0.0 | 0.0 | GO:0034144 | negative regulation of toll-like receptor 4 signaling pathway(GO:0034144) |
| 0.0 | 0.0 | GO:0070973 | protein localization to endoplasmic reticulum exit site(GO:0070973) |
| 0.0 | 0.1 | GO:0014807 | regulation of somitogenesis(GO:0014807) |
| 0.0 | 0.0 | GO:1903054 | negative regulation of extracellular matrix organization(GO:1903054) |
| 0.0 | 0.0 | GO:0050704 | regulation of interleukin-1 secretion(GO:0050704) |
| 0.0 | 0.0 | GO:0060040 | retinal bipolar neuron differentiation(GO:0060040) |
| 0.0 | 0.0 | GO:0033962 | cytoplasmic mRNA processing body assembly(GO:0033962) |
| 0.0 | 0.0 | GO:0060148 | positive regulation of posttranscriptional gene silencing(GO:0060148) |
| 0.0 | 0.0 | GO:0034331 | cell junction maintenance(GO:0034331) |
| 0.0 | 0.0 | GO:0006527 | arginine catabolic process(GO:0006527) |
| 0.0 | 0.0 | GO:0007181 | transforming growth factor beta receptor complex assembly(GO:0007181) |
| 0.0 | 0.4 | GO:0018149 | peptide cross-linking(GO:0018149) |
| 0.0 | 0.0 | GO:0044331 | cell-cell adhesion mediated by cadherin(GO:0044331) |
| 0.0 | 0.2 | GO:0030488 | tRNA methylation(GO:0030488) |
| 0.0 | 0.0 | GO:0043403 | skeletal muscle tissue regeneration(GO:0043403) |
| 0.0 | 0.0 | GO:0031915 | positive regulation of synaptic plasticity(GO:0031915) |
| 0.0 | 0.0 | GO:0002551 | mast cell chemotaxis(GO:0002551) |
| 0.0 | 0.0 | GO:0072396 | response to cell cycle checkpoint signaling(GO:0072396) response to DNA integrity checkpoint signaling(GO:0072402) response to DNA damage checkpoint signaling(GO:0072423) response to intra-S DNA damage checkpoint signaling(GO:0072429) |
| 0.0 | 0.0 | GO:0000722 | telomere maintenance via recombination(GO:0000722) |
| 0.0 | 0.1 | GO:0070816 | phosphorylation of RNA polymerase II C-terminal domain(GO:0070816) |
| 0.0 | 0.0 | GO:0072678 | T cell migration(GO:0072678) |
| 0.0 | 0.0 | GO:0033004 | negative regulation of mast cell activation(GO:0033004) |
| 0.0 | 0.0 | GO:0048859 | formation of anatomical boundary(GO:0048859) |
| 0.0 | 0.0 | GO:0007032 | endosome organization(GO:0007032) |
| 0.0 | 0.1 | GO:0046596 | regulation of viral entry into host cell(GO:0046596) |
| 0.0 | 0.0 | GO:0010459 | negative regulation of heart rate(GO:0010459) |
| 0.0 | 0.1 | GO:0042516 | tyrosine phosphorylation of Stat3 protein(GO:0042503) regulation of tyrosine phosphorylation of Stat3 protein(GO:0042516) |
| 0.0 | 0.0 | GO:0033574 | response to testosterone(GO:0033574) |
| 0.0 | 0.0 | GO:0035405 | histone-threonine phosphorylation(GO:0035405) |
| 0.0 | 0.0 | GO:0034421 | post-translational protein acetylation(GO:0034421) |
| 0.0 | 0.0 | GO:0007016 | cytoskeletal anchoring at plasma membrane(GO:0007016) |
Gene overrepresentation in cellular component category:
| Log-likelihood per target | Total log-likelihood | Term | Description |
|---|---|---|---|
| 2.2 | 8.9 | GO:0044316 | cone cell pedicle(GO:0044316) |
| 1.8 | 5.5 | GO:0032010 | phagolysosome(GO:0032010) |
| 1.8 | 5.3 | GO:0030981 | cortical microtubule cytoskeleton(GO:0030981) |
| 1.6 | 6.6 | GO:0097425 | smooth endoplasmic reticulum membrane(GO:0030868) smooth endoplasmic reticulum part(GO:0097425) |
| 1.6 | 7.9 | GO:0031838 | haptoglobin-hemoglobin complex(GO:0031838) |
| 1.3 | 8.0 | GO:0070937 | CRD-mediated mRNA stability complex(GO:0070937) |
| 1.2 | 6.2 | GO:0030870 | Mre11 complex(GO:0030870) |
| 1.1 | 3.3 | GO:0005833 | hemoglobin complex(GO:0005833) |
| 1.1 | 3.2 | GO:0097452 | GAIT complex(GO:0097452) |
| 1.1 | 10.6 | GO:0046581 | intercellular canaliculus(GO:0046581) |
| 1.0 | 5.9 | GO:0016589 | NURF complex(GO:0016589) |
| 1.0 | 4.9 | GO:0005638 | lamin filament(GO:0005638) |
| 1.0 | 9.6 | GO:1990023 | mitotic spindle midzone(GO:1990023) |
| 0.9 | 2.7 | GO:0005899 | insulin receptor complex(GO:0005899) |
| 0.8 | 6.8 | GO:0034464 | BBSome(GO:0034464) |
| 0.8 | 3.3 | GO:0032777 | Piccolo NuA4 histone acetyltransferase complex(GO:0032777) |
| 0.8 | 2.4 | GO:0048179 | activin receptor complex(GO:0048179) |
| 0.7 | 3.6 | GO:0045098 | type III intermediate filament(GO:0045098) |
| 0.7 | 5.8 | GO:0031595 | nuclear proteasome complex(GO:0031595) |
| 0.7 | 3.5 | GO:0008091 | spectrin(GO:0008091) |
| 0.7 | 2.8 | GO:0035363 | histone locus body(GO:0035363) |
| 0.7 | 2.7 | GO:0031466 | Cul5-RING ubiquitin ligase complex(GO:0031466) |
| 0.6 | 3.1 | GO:0016281 | eukaryotic translation initiation factor 4F complex(GO:0016281) |
| 0.6 | 5.0 | GO:0071541 | eukaryotic translation initiation factor 3 complex, eIF3m(GO:0071541) |
| 0.6 | 2.5 | GO:0035339 | SPOTS complex(GO:0035339) |
| 0.6 | 3.0 | GO:0016461 | unconventional myosin complex(GO:0016461) |
| 0.6 | 2.9 | GO:0031298 | replication fork protection complex(GO:0031298) |
| 0.6 | 7.6 | GO:0035098 | ESC/E(Z) complex(GO:0035098) |
| 0.6 | 5.1 | GO:0008250 | oligosaccharyltransferase complex(GO:0008250) |
| 0.5 | 1.6 | GO:0046691 | intracellular canaliculus(GO:0046691) |
| 0.5 | 2.1 | GO:0097136 | Bcl-2 family protein complex(GO:0097136) |
| 0.5 | 1.0 | GO:0044393 | microspike(GO:0044393) |
| 0.5 | 1.0 | GO:0097629 | extrinsic component of omegasome membrane(GO:0097629) |
| 0.5 | 2.0 | GO:0005968 | Rab-protein geranylgeranyltransferase complex(GO:0005968) |
| 0.5 | 1.5 | GO:1990761 | growth cone lamellipodium(GO:1990761) |
| 0.5 | 2.0 | GO:0005955 | calcineurin complex(GO:0005955) |
| 0.5 | 6.0 | GO:0042627 | chylomicron(GO:0042627) |
| 0.5 | 2.0 | GO:0035867 | alphav-beta3 integrin-IGF-1-IGF1R complex(GO:0035867) |
| 0.5 | 2.0 | GO:0030127 | COPII vesicle coat(GO:0030127) |
| 0.5 | 6.4 | GO:0031528 | microvillus membrane(GO:0031528) |
| 0.5 | 2.9 | GO:0005677 | chromatin silencing complex(GO:0005677) |
| 0.5 | 10.0 | GO:0002080 | acrosomal membrane(GO:0002080) |
| 0.5 | 1.4 | GO:0005828 | kinetochore microtubule(GO:0005828) |
| 0.5 | 1.4 | GO:0016602 | CCAAT-binding factor complex(GO:0016602) |
| 0.5 | 2.3 | GO:0005579 | membrane attack complex(GO:0005579) |
| 0.4 | 1.3 | GO:0005915 | zonula adherens(GO:0005915) |
| 0.4 | 6.1 | GO:0000421 | autophagosome membrane(GO:0000421) |
| 0.4 | 0.4 | GO:0032127 | dense core granule membrane(GO:0032127) |
| 0.4 | 4.5 | GO:0005675 | holo TFIIH complex(GO:0005675) |
| 0.4 | 1.9 | GO:1990712 | HFE-transferrin receptor complex(GO:1990712) |
| 0.4 | 3.0 | GO:0045179 | apical cortex(GO:0045179) |
| 0.4 | 1.1 | GO:0042827 | platelet dense granule(GO:0042827) |
| 0.4 | 1.8 | GO:0033093 | Weibel-Palade body(GO:0033093) |
| 0.4 | 4.0 | GO:0016580 | Sin3 complex(GO:0016580) |
| 0.4 | 1.1 | GO:0044462 | cell outer membrane(GO:0009279) cell envelope(GO:0030313) external encapsulating structure part(GO:0044462) |
| 0.4 | 1.4 | GO:0014731 | spectrin-associated cytoskeleton(GO:0014731) |
| 0.4 | 1.4 | GO:0070820 | tertiary granule(GO:0070820) |
| 0.4 | 1.1 | GO:0035189 | Rb-E2F complex(GO:0035189) |
| 0.3 | 10.1 | GO:0015030 | Cajal body(GO:0015030) |
| 0.3 | 1.7 | GO:0000306 | extrinsic component of vacuolar membrane(GO:0000306) |
| 0.3 | 1.4 | GO:0000322 | storage vacuole(GO:0000322) |
| 0.3 | 1.0 | GO:0036488 | CHOP-C/EBP complex(GO:0036488) |
| 0.3 | 5.2 | GO:0001741 | XY body(GO:0001741) |
| 0.3 | 1.0 | GO:0033185 | dolichol-phosphate-mannose synthase complex(GO:0033185) |
| 0.3 | 1.0 | GO:0031417 | NatC complex(GO:0031417) |
| 0.3 | 3.2 | GO:0036513 | Derlin-1 retrotranslocation complex(GO:0036513) |
| 0.3 | 3.4 | GO:0031616 | spindle pole centrosome(GO:0031616) |
| 0.3 | 4.4 | GO:0010369 | chromocenter(GO:0010369) |
| 0.3 | 0.9 | GO:0098536 | deuterosome(GO:0098536) |
| 0.3 | 3.7 | GO:0005640 | nuclear outer membrane(GO:0005640) |
| 0.3 | 0.3 | GO:1990423 | RZZ complex(GO:1990423) |
| 0.3 | 3.3 | GO:0035102 | PRC1 complex(GO:0035102) |
| 0.3 | 2.1 | GO:0000276 | mitochondrial proton-transporting ATP synthase complex, coupling factor F(o)(GO:0000276) |
| 0.3 | 0.9 | GO:0032937 | SREBP-SCAP-Insig complex(GO:0032937) |
| 0.3 | 0.9 | GO:0097513 | myosin II filament(GO:0097513) |
| 0.3 | 9.6 | GO:0005637 | nuclear inner membrane(GO:0005637) |
| 0.3 | 0.9 | GO:0030670 | phagocytic vesicle membrane(GO:0030670) |
| 0.3 | 0.9 | GO:0032299 | ribonuclease H2 complex(GO:0032299) |
| 0.3 | 2.6 | GO:0032593 | insulin-responsive compartment(GO:0032593) |
| 0.3 | 1.2 | GO:0030121 | AP-1 adaptor complex(GO:0030121) |
| 0.3 | 1.4 | GO:0090571 | RNA polymerase II transcription repressor complex(GO:0090571) |
| 0.3 | 1.1 | GO:0030062 | mitochondrial tricarboxylic acid cycle enzyme complex(GO:0030062) |
| 0.3 | 0.3 | GO:0005767 | secondary lysosome(GO:0005767) |
| 0.3 | 2.2 | GO:0045178 | basal part of cell(GO:0045178) |
| 0.3 | 1.4 | GO:0048237 | rough endoplasmic reticulum lumen(GO:0048237) |
| 0.3 | 0.8 | GO:1990130 | Iml1 complex(GO:1990130) |
| 0.3 | 0.8 | GO:0097543 | ciliary inversin compartment(GO:0097543) |
| 0.3 | 0.8 | GO:0071008 | U2-type post-mRNA release spliceosomal complex(GO:0071008) |
| 0.3 | 2.4 | GO:0002116 | semaphorin receptor complex(GO:0002116) |
| 0.3 | 0.5 | GO:0097025 | MPP7-DLG1-LIN7 complex(GO:0097025) |
| 0.3 | 1.8 | GO:0070688 | MLL5-L complex(GO:0070688) |
| 0.3 | 1.0 | GO:0005610 | laminin-5 complex(GO:0005610) |
| 0.3 | 0.8 | GO:0046540 | U4/U6 x U5 tri-snRNP complex(GO:0046540) |
| 0.3 | 0.5 | GO:0097418 | neurofibrillary tangle(GO:0097418) |
| 0.3 | 1.5 | GO:0002178 | palmitoyltransferase complex(GO:0002178) |
| 0.2 | 1.0 | GO:0045261 | mitochondrial proton-transporting ATP synthase complex, catalytic core F(1)(GO:0000275) proton-transporting ATP synthase complex, catalytic core F(1)(GO:0045261) |
| 0.2 | 0.2 | GO:0090543 | Flemming body(GO:0090543) |
| 0.2 | 1.0 | GO:0034448 | EGO complex(GO:0034448) Gtr1-Gtr2 GTPase complex(GO:1990131) |
| 0.2 | 4.6 | GO:0005669 | transcription factor TFIID complex(GO:0005669) |
| 0.2 | 15.6 | GO:0022625 | cytosolic large ribosomal subunit(GO:0022625) |
| 0.2 | 1.0 | GO:0097422 | tubular endosome(GO:0097422) |
| 0.2 | 5.2 | GO:0005719 | nuclear euchromatin(GO:0005719) |
| 0.2 | 0.5 | GO:0070765 | gamma-secretase complex(GO:0070765) |
| 0.2 | 1.6 | GO:0000788 | nuclear nucleosome(GO:0000788) |
| 0.2 | 3.9 | GO:0031082 | BLOC complex(GO:0031082) |
| 0.2 | 1.6 | GO:0000137 | Golgi cis cisterna(GO:0000137) |
| 0.2 | 2.3 | GO:0000176 | nuclear exosome (RNase complex)(GO:0000176) |
| 0.2 | 0.2 | GO:0042585 | germinal vesicle(GO:0042585) |
| 0.2 | 7.2 | GO:0005776 | autophagosome(GO:0005776) |
| 0.2 | 2.7 | GO:0005721 | pericentric heterochromatin(GO:0005721) |
| 0.2 | 0.7 | GO:0009331 | glycerol-3-phosphate dehydrogenase complex(GO:0009331) |
| 0.2 | 6.5 | GO:0032040 | small-subunit processome(GO:0032040) |
| 0.2 | 1.3 | GO:0005851 | eukaryotic translation initiation factor 2B complex(GO:0005851) |
| 0.2 | 1.1 | GO:0000220 | vacuolar proton-transporting V-type ATPase, V0 domain(GO:0000220) |
| 0.2 | 1.3 | GO:0097342 | ripoptosome(GO:0097342) |
| 0.2 | 2.4 | GO:0098533 | ATPase dependent transmembrane transport complex(GO:0098533) |
| 0.2 | 1.3 | GO:0097431 | mitotic spindle pole(GO:0097431) |
| 0.2 | 3.2 | GO:0034364 | high-density lipoprotein particle(GO:0034364) |
| 0.2 | 9.7 | GO:0042645 | nucleoid(GO:0009295) mitochondrial nucleoid(GO:0042645) |
| 0.2 | 0.8 | GO:0071014 | post-mRNA release spliceosomal complex(GO:0071014) |
| 0.2 | 1.5 | GO:0035859 | Seh1-associated complex(GO:0035859) |
| 0.2 | 1.9 | GO:0032045 | guanyl-nucleotide exchange factor complex(GO:0032045) |
| 0.2 | 3.1 | GO:0000145 | exocyst(GO:0000145) |
| 0.2 | 2.0 | GO:0042575 | DNA polymerase complex(GO:0042575) |
| 0.2 | 0.8 | GO:0005818 | aster(GO:0005818) |
| 0.2 | 0.8 | GO:0005652 | nuclear lamina(GO:0005652) |
| 0.2 | 2.2 | GO:0031512 | motile primary cilium(GO:0031512) |
| 0.2 | 0.6 | GO:0060053 | neurofilament cytoskeleton(GO:0060053) |
| 0.2 | 2.5 | GO:0035327 | transcriptionally active chromatin(GO:0035327) |
| 0.2 | 10.8 | GO:0031526 | brush border membrane(GO:0031526) |
| 0.2 | 0.6 | GO:0097443 | sorting endosome(GO:0097443) |
| 0.2 | 2.9 | GO:0022624 | proteasome accessory complex(GO:0022624) |
| 0.2 | 1.7 | GO:0032993 | protein-DNA complex(GO:0032993) |
| 0.2 | 9.8 | GO:0000932 | cytoplasmic mRNA processing body(GO:0000932) |
| 0.2 | 0.6 | GO:0000506 | glycosylphosphatidylinositol-N-acetylglucosaminyltransferase (GPI-GnT) complex(GO:0000506) |
| 0.2 | 0.7 | GO:0045180 | basal cortex(GO:0045180) |
| 0.2 | 1.8 | GO:0070852 | cell body fiber(GO:0070852) |
| 0.2 | 1.3 | GO:0097542 | ciliary tip(GO:0097542) |
| 0.2 | 3.4 | GO:0001673 | male germ cell nucleus(GO:0001673) |
| 0.2 | 0.2 | GO:0031523 | Myb complex(GO:0031523) |
| 0.2 | 6.7 | GO:0022627 | cytosolic small ribosomal subunit(GO:0022627) |
| 0.2 | 2.0 | GO:0031588 | nucleotide-activated protein kinase complex(GO:0031588) |
| 0.2 | 0.4 | GO:0071782 | endoplasmic reticulum tubular network(GO:0071782) |
| 0.2 | 0.2 | GO:0005664 | origin recognition complex(GO:0000808) nuclear origin of replication recognition complex(GO:0005664) |
| 0.2 | 15.4 | GO:0072562 | blood microparticle(GO:0072562) |
| 0.2 | 0.4 | GO:0042583 | chromaffin granule(GO:0042583) |
| 0.2 | 0.4 | GO:0097524 | sperm plasma membrane(GO:0097524) |
| 0.2 | 0.5 | GO:0071203 | WASH complex(GO:0071203) |
| 0.2 | 0.2 | GO:0000243 | commitment complex(GO:0000243) |
| 0.2 | 1.2 | GO:0046930 | pore complex(GO:0046930) |
| 0.2 | 0.2 | GO:0034750 | Scrib-APC-beta-catenin complex(GO:0034750) |
| 0.2 | 2.8 | GO:0005614 | interstitial matrix(GO:0005614) |
| 0.2 | 0.7 | GO:0000938 | GARP complex(GO:0000938) |
| 0.2 | 2.7 | GO:0000502 | proteasome complex(GO:0000502) |
| 0.2 | 1.5 | GO:0005832 | chaperonin-containing T-complex(GO:0005832) |
| 0.2 | 0.5 | GO:0042406 | extrinsic component of endoplasmic reticulum membrane(GO:0042406) |
| 0.2 | 2.4 | GO:0005682 | U5 snRNP(GO:0005682) |
| 0.2 | 2.0 | GO:0005847 | mRNA cleavage and polyadenylation specificity factor complex(GO:0005847) |
| 0.2 | 2.8 | GO:0005788 | endoplasmic reticulum lumen(GO:0005788) |
| 0.2 | 1.3 | GO:0031414 | N-terminal protein acetyltransferase complex(GO:0031414) |
| 0.2 | 0.8 | GO:0031315 | extrinsic component of mitochondrial outer membrane(GO:0031315) |
| 0.2 | 2.9 | GO:0031305 | integral component of mitochondrial inner membrane(GO:0031305) |
| 0.2 | 0.2 | GO:0097470 | ribbon synapse(GO:0097470) |
| 0.2 | 1.0 | GO:0000791 | euchromatin(GO:0000791) |
| 0.2 | 1.1 | GO:0044232 | organelle membrane contact site(GO:0044232) |
| 0.2 | 4.1 | GO:0055038 | recycling endosome membrane(GO:0055038) |
| 0.2 | 0.6 | GO:0005683 | U7 snRNP(GO:0005683) |
| 0.2 | 0.6 | GO:0045298 | tubulin complex(GO:0045298) |
| 0.2 | 1.7 | GO:0000346 | transcription export complex(GO:0000346) |
| 0.2 | 1.2 | GO:0032591 | dendritic spine membrane(GO:0032591) |
| 0.2 | 0.6 | GO:0043219 | lateral loop(GO:0043219) |
| 0.2 | 4.1 | GO:0030660 | Golgi-associated vesicle membrane(GO:0030660) |
| 0.2 | 1.5 | GO:0065010 | extracellular membrane-bounded organelle(GO:0065010) |
| 0.2 | 0.5 | GO:1990604 | IRE1-TRAF2-ASK1 complex(GO:1990604) |
| 0.2 | 0.2 | GO:0097526 | spliceosomal tri-snRNP complex(GO:0097526) |
| 0.2 | 0.9 | GO:0005744 | mitochondrial inner membrane presequence translocase complex(GO:0005744) |
| 0.2 | 1.1 | GO:0033116 | endoplasmic reticulum-Golgi intermediate compartment membrane(GO:0033116) |
| 0.2 | 0.8 | GO:0030485 | smooth muscle contractile fiber(GO:0030485) |
| 0.1 | 1.8 | GO:0033270 | paranode region of axon(GO:0033270) |
| 0.1 | 19.3 | GO:0042579 | peroxisome(GO:0005777) microbody(GO:0042579) |
| 0.1 | 0.9 | GO:0002102 | podosome(GO:0002102) |
| 0.1 | 1.6 | GO:0042612 | MHC class I protein complex(GO:0042612) |
| 0.1 | 1.4 | GO:0000922 | spindle pole(GO:0000922) |
| 0.1 | 0.4 | GO:0044354 | pinosome(GO:0044352) macropinosome(GO:0044354) |
| 0.1 | 1.9 | GO:0000407 | pre-autophagosomal structure(GO:0000407) |
| 0.1 | 0.4 | GO:0005785 | signal recognition particle receptor complex(GO:0005785) |
| 0.1 | 2.1 | GO:0031519 | PcG protein complex(GO:0031519) |
| 0.1 | 42.7 | GO:0005743 | mitochondrial inner membrane(GO:0005743) |
| 0.1 | 1.0 | GO:0097440 | apical dendrite(GO:0097440) |
| 0.1 | 1.7 | GO:0030904 | retromer complex(GO:0030904) |
| 0.1 | 0.4 | GO:0030478 | actin cap(GO:0030478) |
| 0.1 | 1.1 | GO:0008385 | IkappaB kinase complex(GO:0008385) |
| 0.1 | 4.9 | GO:0016592 | mediator complex(GO:0016592) |
| 0.1 | 0.3 | GO:0036449 | microtubule minus-end(GO:0036449) |
| 0.1 | 0.3 | GO:0033186 | CAF-1 complex(GO:0033186) |
| 0.1 | 1.8 | GO:0036038 | MKS complex(GO:0036038) |
| 0.1 | 2.8 | GO:0033017 | sarcoplasmic reticulum membrane(GO:0033017) |
| 0.1 | 0.5 | GO:0005672 | transcription factor TFIIA complex(GO:0005672) |
| 0.1 | 1.6 | GO:0005665 | DNA-directed RNA polymerase II, core complex(GO:0005665) |
| 0.1 | 11.6 | GO:0030176 | integral component of endoplasmic reticulum membrane(GO:0030176) |
| 0.1 | 0.5 | GO:0045009 | melanosome membrane(GO:0033162) chitosome(GO:0045009) |
| 0.1 | 1.8 | GO:0005942 | phosphatidylinositol 3-kinase complex(GO:0005942) |
| 0.1 | 4.0 | GO:0005762 | organellar large ribosomal subunit(GO:0000315) mitochondrial large ribosomal subunit(GO:0005762) |
| 0.1 | 0.9 | GO:0033061 | DNA recombinase mediator complex(GO:0033061) |
| 0.1 | 0.3 | GO:0031264 | death-inducing signaling complex(GO:0031264) |
| 0.1 | 1.8 | GO:0001891 | phagocytic cup(GO:0001891) |
| 0.1 | 0.6 | GO:0005663 | DNA replication factor C complex(GO:0005663) |
| 0.1 | 4.2 | GO:0005881 | cytoplasmic microtubule(GO:0005881) |
| 0.1 | 0.4 | GO:0005853 | eukaryotic translation elongation factor 1 complex(GO:0005853) |
| 0.1 | 4.5 | GO:0032587 | ruffle membrane(GO:0032587) |
| 0.1 | 0.5 | GO:1990696 | USH2 complex(GO:1990696) |
| 0.1 | 0.8 | GO:0044666 | MLL3/4 complex(GO:0044666) |
| 0.1 | 0.6 | GO:0017101 | aminoacyl-tRNA synthetase multienzyme complex(GO:0017101) |
| 0.1 | 0.5 | GO:0071437 | invadopodium(GO:0071437) |
| 0.1 | 0.6 | GO:0005964 | phosphorylase kinase complex(GO:0005964) |
| 0.1 | 14.3 | GO:0005802 | trans-Golgi network(GO:0005802) |
| 0.1 | 1.0 | GO:0051233 | spindle midzone(GO:0051233) |
| 0.1 | 0.1 | GO:0044326 | dendritic spine neck(GO:0044326) |
| 0.1 | 0.1 | GO:0033178 | proton-transporting two-sector ATPase complex, catalytic domain(GO:0033178) |
| 0.1 | 0.8 | GO:0072669 | tRNA-splicing ligase complex(GO:0072669) |
| 0.1 | 1.5 | GO:0071011 | precatalytic spliceosome(GO:0071011) |
| 0.1 | 0.8 | GO:0033263 | CORVET complex(GO:0033263) |
| 0.1 | 3.0 | GO:0032432 | actin filament bundle(GO:0032432) |
| 0.1 | 4.3 | GO:0005643 | nuclear pore(GO:0005643) |
| 0.1 | 3.9 | GO:0046658 | anchored component of plasma membrane(GO:0046658) |
| 0.1 | 3.4 | GO:0072686 | mitotic spindle(GO:0072686) |
| 0.1 | 0.4 | GO:1990851 | Wnt-Frizzled-LRP5/6 complex(GO:1990851) |
| 0.1 | 0.9 | GO:0031080 | nuclear pore outer ring(GO:0031080) |
| 0.1 | 2.2 | GO:0005680 | anaphase-promoting complex(GO:0005680) |
| 0.1 | 18.8 | GO:0042175 | nuclear outer membrane-endoplasmic reticulum membrane network(GO:0042175) |
| 0.1 | 1.4 | GO:0005662 | DNA replication factor A complex(GO:0005662) |
| 0.1 | 0.2 | GO:0097451 | glial limiting end-foot(GO:0097451) |
| 0.1 | 0.5 | GO:0030056 | hemidesmosome(GO:0030056) |
| 0.1 | 0.3 | GO:0031390 | Ctf18 RFC-like complex(GO:0031390) |
| 0.1 | 3.9 | GO:0045095 | keratin filament(GO:0045095) |
| 0.1 | 0.3 | GO:0030688 | preribosome, small subunit precursor(GO:0030688) |
| 0.1 | 0.5 | GO:0005671 | Ada2/Gcn5/Ada3 transcription activator complex(GO:0005671) |
| 0.1 | 0.4 | GO:0072357 | PTW/PP1 phosphatase complex(GO:0072357) |
| 0.1 | 0.3 | GO:0097512 | cardiac myofibril(GO:0097512) |
| 0.1 | 0.7 | GO:0042382 | paraspeckles(GO:0042382) |
| 0.1 | 0.3 | GO:0034709 | methylosome(GO:0034709) |
| 0.1 | 0.6 | GO:0001772 | immunological synapse(GO:0001772) |
| 0.1 | 1.2 | GO:0043240 | Fanconi anaemia nuclear complex(GO:0043240) |
| 0.1 | 2.3 | GO:0000118 | histone deacetylase complex(GO:0000118) |
| 0.1 | 1.2 | GO:0005697 | telomerase holoenzyme complex(GO:0005697) |
| 0.1 | 5.7 | GO:0017053 | transcriptional repressor complex(GO:0017053) |
| 0.1 | 0.3 | GO:1990635 | proximal dendrite(GO:1990635) |
| 0.1 | 1.3 | GO:0005868 | cytoplasmic dynein complex(GO:0005868) |
| 0.1 | 2.3 | GO:0001917 | photoreceptor inner segment(GO:0001917) |
| 0.1 | 0.7 | GO:0031462 | Cul2-RING ubiquitin ligase complex(GO:0031462) |
| 0.1 | 0.7 | GO:0031371 | ubiquitin conjugating enzyme complex(GO:0031371) |
| 0.1 | 1.2 | GO:0005793 | endoplasmic reticulum-Golgi intermediate compartment(GO:0005793) |
| 0.1 | 0.2 | GO:0097057 | TRAF2-GSTP1 complex(GO:0097057) |
| 0.1 | 2.3 | GO:0000781 | chromosome, telomeric region(GO:0000781) |
| 0.1 | 1.1 | GO:0000786 | nucleosome(GO:0000786) |
| 0.1 | 1.8 | GO:0035145 | exon-exon junction complex(GO:0035145) |
| 0.1 | 1.2 | GO:0043196 | varicosity(GO:0043196) |
| 0.1 | 0.2 | GO:0035631 | CD40 receptor complex(GO:0035631) |
| 0.1 | 0.7 | GO:0032426 | stereocilium tip(GO:0032426) |
| 0.1 | 0.5 | GO:0045240 | dihydrolipoyl dehydrogenase complex(GO:0045240) oxoglutarate dehydrogenase complex(GO:0045252) |
| 0.1 | 0.5 | GO:0070776 | H3 histone acetyltransferase complex(GO:0070775) MOZ/MORF histone acetyltransferase complex(GO:0070776) |
| 0.1 | 0.5 | GO:0008290 | F-actin capping protein complex(GO:0008290) |
| 0.1 | 0.1 | GO:0044327 | dendritic spine head(GO:0044327) |
| 0.1 | 0.2 | GO:0097487 | multivesicular body, internal vesicle(GO:0097487) |
| 0.1 | 1.7 | GO:0043209 | myelin sheath(GO:0043209) |
| 0.1 | 0.6 | GO:0005641 | nuclear envelope lumen(GO:0005641) |
| 0.1 | 0.5 | GO:0034719 | SMN-Sm protein complex(GO:0034719) |
| 0.1 | 0.1 | GO:0035985 | senescence-associated heterochromatin focus(GO:0035985) |
| 0.1 | 4.1 | GO:0016605 | PML body(GO:0016605) |
| 0.1 | 0.4 | GO:0072487 | MSL complex(GO:0072487) |
| 0.1 | 0.3 | GO:0030896 | checkpoint clamp complex(GO:0030896) |
| 0.1 | 0.3 | GO:0030877 | beta-catenin destruction complex(GO:0030877) |
| 0.1 | 0.3 | GO:0033179 | proton-transporting V-type ATPase, V0 domain(GO:0033179) |
| 0.1 | 1.0 | GO:0035861 | site of double-strand break(GO:0035861) |
| 0.1 | 0.1 | GO:0071010 | prespliceosome(GO:0071010) |
| 0.1 | 0.3 | GO:0000814 | ESCRT II complex(GO:0000814) |
| 0.1 | 0.3 | GO:0000942 | condensed nuclear chromosome outer kinetochore(GO:0000942) |
| 0.1 | 23.0 | GO:0005578 | proteinaceous extracellular matrix(GO:0005578) |
| 0.1 | 0.1 | GO:0070069 | cytochrome complex(GO:0070069) |
| 0.1 | 2.5 | GO:0005903 | brush border(GO:0005903) |
| 0.1 | 0.2 | GO:0016222 | procollagen-proline 4-dioxygenase complex(GO:0016222) |
| 0.1 | 0.2 | GO:0030897 | HOPS complex(GO:0030897) |
| 0.1 | 0.2 | GO:1990907 | beta-catenin-TCF complex(GO:1990907) |
| 0.1 | 0.1 | GO:0000812 | Swr1 complex(GO:0000812) |
| 0.1 | 65.6 | GO:0005794 | Golgi apparatus(GO:0005794) |
| 0.1 | 0.2 | GO:0000214 | tRNA-intron endonuclease complex(GO:0000214) |
| 0.1 | 2.2 | GO:0045171 | intercellular bridge(GO:0045171) |
| 0.1 | 0.8 | GO:0044665 | MLL1/2 complex(GO:0044665) MLL1 complex(GO:0071339) |
| 0.1 | 2.0 | GO:0071013 | catalytic step 2 spliceosome(GO:0071013) |
| 0.1 | 0.2 | GO:0097255 | R2TP complex(GO:0097255) |
| 0.1 | 2.0 | GO:0001750 | photoreceptor outer segment(GO:0001750) |
| 0.1 | 0.3 | GO:0070545 | PeBoW complex(GO:0070545) |
| 0.1 | 5.0 | GO:0098852 | lysosomal membrane(GO:0005765) lytic vacuole membrane(GO:0098852) |
| 0.1 | 0.3 | GO:0001650 | fibrillar center(GO:0001650) |
| 0.1 | 9.7 | GO:0016323 | basolateral plasma membrane(GO:0016323) |
| 0.1 | 3.9 | GO:0000785 | chromatin(GO:0000785) |
| 0.1 | 0.2 | GO:0001939 | female pronucleus(GO:0001939) male pronucleus(GO:0001940) |
| 0.1 | 0.3 | GO:0048476 | Holliday junction resolvase complex(GO:0048476) |
| 0.1 | 0.4 | GO:0000813 | ESCRT I complex(GO:0000813) |
| 0.1 | 5.0 | GO:0005741 | mitochondrial outer membrane(GO:0005741) outer membrane(GO:0019867) organelle outer membrane(GO:0031968) |
| 0.1 | 0.6 | GO:0005685 | U1 snRNP(GO:0005685) |
| 0.1 | 1.3 | GO:0080008 | Cul4-RING E3 ubiquitin ligase complex(GO:0080008) |
| 0.1 | 0.3 | GO:0072559 | NLRP3 inflammasome complex(GO:0072559) |
| 0.1 | 1.6 | GO:0032809 | neuronal cell body membrane(GO:0032809) cell body membrane(GO:0044298) |
| 0.1 | 0.6 | GO:0035267 | NuA4 histone acetyltransferase complex(GO:0035267) H4/H2A histone acetyltransferase complex(GO:0043189) H4 histone acetyltransferase complex(GO:1902562) |
| 0.1 | 0.1 | GO:0071817 | MMXD complex(GO:0071817) |
| 0.1 | 2.9 | GO:0005769 | early endosome(GO:0005769) |
| 0.1 | 0.1 | GO:0097648 | G-protein coupled receptor dimeric complex(GO:0038037) G-protein coupled receptor complex(GO:0097648) |
| 0.1 | 0.1 | GO:0002139 | stereocilia coupling link(GO:0002139) stereocilia ankle link(GO:0002141) |
| 0.1 | 0.5 | GO:0005869 | dynactin complex(GO:0005869) |
| 0.1 | 0.1 | GO:0010009 | cytoplasmic side of endosome membrane(GO:0010009) |
| 0.1 | 0.1 | GO:1990923 | PET complex(GO:1990923) |
| 0.1 | 0.1 | GO:0097058 | CRLF-CLCF1 complex(GO:0097058) |
| 0.1 | 1.2 | GO:0098636 | protein complex involved in cell adhesion(GO:0098636) |
| 0.1 | 1.0 | GO:0090544 | BAF-type complex(GO:0090544) |
| 0.1 | 4.2 | GO:0005840 | ribosome(GO:0005840) |
| 0.1 | 0.1 | GO:0097413 | Lewy body(GO:0097413) |
| 0.1 | 4.7 | GO:0016604 | nuclear body(GO:0016604) |
| 0.1 | 2.3 | GO:0034399 | nuclear periphery(GO:0034399) |
| 0.1 | 59.7 | GO:0005654 | nucleoplasm(GO:0005654) |
| 0.1 | 0.7 | GO:0005657 | replication fork(GO:0005657) |
| 0.1 | 5.1 | GO:0045111 | intermediate filament cytoskeleton(GO:0045111) |
| 0.1 | 17.0 | GO:0005813 | centrosome(GO:0005813) |
| 0.1 | 0.2 | GO:0002189 | ribose phosphate diphosphokinase complex(GO:0002189) |
| 0.1 | 2.2 | GO:0030863 | cortical cytoskeleton(GO:0030863) |
| 0.1 | 0.8 | GO:0030057 | desmosome(GO:0030057) |
| 0.1 | 0.1 | GO:0030123 | AP-3 adaptor complex(GO:0030123) |
| 0.1 | 0.8 | GO:0030496 | midbody(GO:0030496) |
| 0.1 | 0.7 | GO:0008180 | COP9 signalosome(GO:0008180) |
| 0.1 | 0.1 | GO:0005971 | ribonucleoside-diphosphate reductase complex(GO:0005971) |
| 0.1 | 1.3 | GO:0055037 | recycling endosome(GO:0055037) |
| 0.1 | 1.0 | GO:0044452 | nucleolar part(GO:0044452) |
| 0.1 | 1.2 | GO:0000795 | synaptonemal complex(GO:0000795) |
| 0.1 | 3.3 | GO:0031234 | extrinsic component of cytoplasmic side of plasma membrane(GO:0031234) |
| 0.1 | 0.1 | GO:0036194 | muscle cell projection(GO:0036194) muscle cell projection membrane(GO:0036195) |
| 0.1 | 38.2 | GO:0005739 | mitochondrion(GO:0005739) |
| 0.1 | 8.2 | GO:0005667 | transcription factor complex(GO:0005667) |
| 0.1 | 0.4 | GO:0032420 | stereocilium(GO:0032420) |
| 0.1 | 1.5 | GO:0005681 | spliceosomal complex(GO:0005681) |
| 0.1 | 3.8 | GO:0005925 | focal adhesion(GO:0005925) |
| 0.1 | 0.2 | GO:0034518 | mRNA cap binding complex(GO:0005845) RNA cap binding complex(GO:0034518) |
| 0.1 | 58.1 | GO:0070062 | extracellular exosome(GO:0070062) |
| 0.1 | 0.1 | GO:0048787 | presynaptic active zone membrane(GO:0048787) |
| 0.1 | 0.1 | GO:0034362 | low-density lipoprotein particle(GO:0034362) |
| 0.0 | 0.0 | GO:0001674 | female germ cell nucleus(GO:0001674) |
| 0.0 | 0.3 | GO:0035869 | ciliary transition zone(GO:0035869) |
| 0.0 | 0.0 | GO:0030915 | Smc5-Smc6 complex(GO:0030915) |
| 0.0 | 0.0 | GO:0034992 | microtubule organizing center attachment site(GO:0034992) LINC complex(GO:0034993) |
| 0.0 | 3.1 | GO:0005694 | chromosome(GO:0005694) |
| 0.0 | 0.3 | GO:0030014 | CCR4-NOT complex(GO:0030014) |
| 0.0 | 1.5 | GO:0036126 | sperm flagellum(GO:0036126) |
| 0.0 | 0.1 | GO:0042105 | alpha-beta T cell receptor complex(GO:0042105) |
| 0.0 | 0.1 | GO:0031091 | platelet alpha granule(GO:0031091) |
| 0.0 | 1.7 | GO:0001669 | acrosomal vesicle(GO:0001669) |
| 0.0 | 0.2 | GO:1990204 | oxidoreductase complex(GO:1990204) |
| 0.0 | 0.6 | GO:0031514 | motile cilium(GO:0031514) |
| 0.0 | 1.2 | GO:0019005 | SCF ubiquitin ligase complex(GO:0019005) |
| 0.0 | 0.1 | GO:0072557 | IPAF inflammasome complex(GO:0072557) |
| 0.0 | 0.7 | GO:0005811 | lipid particle(GO:0005811) |
| 0.0 | 0.5 | GO:0016529 | sarcoplasmic reticulum(GO:0016529) |
| 0.0 | 0.5 | GO:0005892 | acetylcholine-gated channel complex(GO:0005892) |
| 0.0 | 0.2 | GO:0019897 | extrinsic component of plasma membrane(GO:0019897) |
| 0.0 | 0.5 | GO:0005922 | connexon complex(GO:0005922) |
| 0.0 | 0.1 | GO:0042555 | MCM complex(GO:0042555) |
| 0.0 | 0.5 | GO:0005913 | cell-cell adherens junction(GO:0005913) |
| 0.0 | 0.6 | GO:0005581 | collagen trimer(GO:0005581) |
| 0.0 | 0.4 | GO:0005844 | polysome(GO:0005844) |
| 0.0 | 0.2 | GO:0032279 | asymmetric synapse(GO:0032279) |
| 0.0 | 0.6 | GO:0072372 | primary cilium(GO:0072372) |
| 0.0 | 0.1 | GO:0061702 | inflammasome complex(GO:0061702) |
| 0.0 | 0.6 | GO:0019898 | extrinsic component of membrane(GO:0019898) |
| 0.0 | 0.1 | GO:0031931 | TORC1 complex(GO:0031931) |
| 0.0 | 0.0 | GO:0031074 | nucleocytoplasmic shuttling complex(GO:0031074) |
| 0.0 | 0.4 | GO:0005901 | caveola(GO:0005901) |
| 0.0 | 0.0 | GO:0071439 | clathrin complex(GO:0071439) |
| 0.0 | 0.2 | GO:0030667 | secretory granule membrane(GO:0030667) |
| 0.0 | 0.0 | GO:0000439 | core TFIIH complex(GO:0000439) |
| 0.0 | 0.0 | GO:0005952 | cAMP-dependent protein kinase complex(GO:0005952) |
| 0.0 | 0.0 | GO:1990716 | axonemal central apparatus(GO:1990716) |
| 0.0 | 0.0 | GO:0044214 | spanning component of plasma membrane(GO:0044214) spanning component of membrane(GO:0089717) |
| 0.0 | 0.0 | GO:0030992 | intraciliary transport particle B(GO:0030992) |
| 0.0 | 0.0 | GO:0032433 | filopodium tip(GO:0032433) |
| 0.0 | 0.0 | GO:0005896 | interleukin-6 receptor complex(GO:0005896) |
| 0.0 | 0.5 | GO:0001533 | cornified envelope(GO:0001533) |
| 0.0 | 0.0 | GO:0000408 | EKC/KEOPS complex(GO:0000408) |
| 0.0 | 0.0 | GO:1990777 | plasma lipoprotein particle(GO:0034358) lipoprotein particle(GO:1990777) |
| 0.0 | 0.1 | GO:0000164 | protein phosphatase type 1 complex(GO:0000164) |
| 0.0 | 0.0 | GO:0044322 | endoplasmic reticulum quality control compartment(GO:0044322) |
| 0.0 | 0.0 | GO:0042101 | T cell receptor complex(GO:0042101) |
| 0.0 | 0.0 | GO:0036128 | CatSper complex(GO:0036128) |
| 0.0 | 0.0 | GO:1990391 | DNA repair complex(GO:1990391) |
Gene overrepresentation in molecular function category:
| Log-likelihood per target | Total log-likelihood | Term | Description |
|---|---|---|---|
| 3.6 | 10.9 | GO:0015205 | purine nucleobase transmembrane transporter activity(GO:0005345) pyrimidine nucleobase transmembrane transporter activity(GO:0005350) nucleobase transmembrane transporter activity(GO:0015205) |
| 3.4 | 10.3 | GO:0004505 | phenylalanine 4-monooxygenase activity(GO:0004505) |
| 3.2 | 9.6 | GO:0008525 | phosphatidylcholine transporter activity(GO:0008525) |
| 2.9 | 11.5 | GO:0008970 | phosphatidylcholine 1-acylhydrolase activity(GO:0008970) |
| 2.4 | 7.2 | GO:0046573 | lactonohydrolase activity(GO:0046573) acyl-L-homoserine-lactone lactonohydrolase activity(GO:0102007) |
| 2.1 | 10.4 | GO:0016841 | ammonia-lyase activity(GO:0016841) |
| 1.7 | 5.0 | GO:0003886 | DNA (cytosine-5-)-methyltransferase activity(GO:0003886) DNA (cytosine-5-)-methyltransferase activity, acting on CpG substrates(GO:0051718) |
| 1.5 | 4.6 | GO:0055100 | adiponectin binding(GO:0055100) |
| 1.5 | 10.6 | GO:0030492 | hemoglobin binding(GO:0030492) |
| 1.5 | 4.4 | GO:0005220 | inositol 1,4,5-trisphosphate-sensitive calcium-release channel activity(GO:0005220) |
| 1.3 | 3.9 | GO:0004616 | phosphogluconate dehydrogenase (decarboxylating) activity(GO:0004616) |
| 1.1 | 7.6 | GO:0046790 | virion binding(GO:0046790) |
| 1.0 | 2.1 | GO:0002151 | G-quadruplex RNA binding(GO:0002151) |
| 1.0 | 3.1 | GO:0033592 | RNA strand annealing activity(GO:0033592) |
| 1.0 | 4.0 | GO:0004566 | beta-glucuronidase activity(GO:0004566) |
| 1.0 | 2.9 | GO:0034186 | apolipoprotein A-I binding(GO:0034186) |
| 1.0 | 6.8 | GO:0016803 | ether hydrolase activity(GO:0016803) |
| 1.0 | 7.7 | GO:0034046 | poly(G) binding(GO:0034046) |
| 0.9 | 3.7 | GO:0019788 | NEDD8 transferase activity(GO:0019788) |
| 0.9 | 2.7 | GO:0004366 | glycerol-3-phosphate O-acyltransferase activity(GO:0004366) |
| 0.9 | 3.6 | GO:0015204 | urea transmembrane transporter activity(GO:0015204) |
| 0.9 | 6.3 | GO:0004908 | interleukin-1 receptor activity(GO:0004908) |
| 0.9 | 2.7 | GO:0004699 | calcium-independent protein kinase C activity(GO:0004699) |
| 0.9 | 2.7 | GO:0060230 | lipoprotein lipase activator activity(GO:0060230) |
| 0.9 | 13.2 | GO:0016290 | palmitoyl-CoA hydrolase activity(GO:0016290) |
| 0.9 | 3.5 | GO:0019136 | deoxynucleoside kinase activity(GO:0019136) |
| 0.8 | 3.3 | GO:0008379 | thioredoxin peroxidase activity(GO:0008379) |
| 0.8 | 2.5 | GO:0050252 | retinol O-fatty-acyltransferase activity(GO:0050252) |
| 0.8 | 2.5 | GO:0016822 | hydrolase activity, acting on acid carbon-carbon bonds(GO:0016822) hydrolase activity, acting on acid carbon-carbon bonds, in ketonic substances(GO:0016823) |
| 0.8 | 4.8 | GO:0070324 | thyroid hormone binding(GO:0070324) |
| 0.8 | 5.4 | GO:0003836 | beta-galactoside (CMP) alpha-2,3-sialyltransferase activity(GO:0003836) |
| 0.8 | 4.6 | GO:0008508 | bile acid:sodium symporter activity(GO:0008508) |
| 0.8 | 3.8 | GO:0071558 | histone demethylase activity (H3-K27 specific)(GO:0071558) |
| 0.7 | 5.8 | GO:0050649 | testosterone 6-beta-hydroxylase activity(GO:0050649) |
| 0.7 | 2.1 | GO:0070653 | high-density lipoprotein particle receptor binding(GO:0070653) |
| 0.7 | 5.6 | GO:0003841 | 1-acylglycerol-3-phosphate O-acyltransferase activity(GO:0003841) |
| 0.7 | 2.1 | GO:0016838 | carbon-oxygen lyase activity, acting on phosphates(GO:0016838) |
| 0.7 | 2.0 | GO:0042392 | sphingosine-1-phosphate phosphatase activity(GO:0042392) |
| 0.7 | 2.0 | GO:0070644 | vitamin D response element binding(GO:0070644) |
| 0.7 | 4.0 | GO:0032052 | bile acid binding(GO:0032052) |
| 0.7 | 2.0 | GO:0005176 | ErbB-2 class receptor binding(GO:0005176) |
| 0.7 | 2.7 | GO:0015183 | L-aspartate transmembrane transporter activity(GO:0015183) |
| 0.7 | 2.0 | GO:0004939 | beta-adrenergic receptor activity(GO:0004939) |
| 0.7 | 2.0 | GO:0008321 | Ral guanyl-nucleotide exchange factor activity(GO:0008321) |
| 0.7 | 4.0 | GO:0016812 | hydrolase activity, acting on carbon-nitrogen (but not peptide) bonds, in cyclic amides(GO:0016812) |
| 0.7 | 4.0 | GO:0061133 | endopeptidase activator activity(GO:0061133) |
| 0.7 | 2.0 | GO:0016532 | superoxide dismutase copper chaperone activity(GO:0016532) |
| 0.7 | 2.0 | GO:0004924 | oncostatin-M receptor activity(GO:0004924) |
| 0.6 | 15.6 | GO:0004190 | aspartic-type endopeptidase activity(GO:0004190) aspartic-type peptidase activity(GO:0070001) |
| 0.6 | 6.2 | GO:0051010 | microtubule plus-end binding(GO:0051010) |
| 0.6 | 3.1 | GO:0000774 | adenyl-nucleotide exchange factor activity(GO:0000774) |
| 0.6 | 2.4 | GO:0016361 | activin receptor activity, type I(GO:0016361) |
| 0.6 | 2.4 | GO:0019237 | centromeric DNA binding(GO:0019237) |
| 0.6 | 3.0 | GO:0035613 | RNA stem-loop binding(GO:0035613) |
| 0.6 | 0.6 | GO:0005119 | smoothened binding(GO:0005119) |
| 0.6 | 1.7 | GO:0016882 | cyclo-ligase activity(GO:0016882) |
| 0.6 | 2.2 | GO:0033192 | calmodulin-dependent protein phosphatase activity(GO:0033192) |
| 0.6 | 1.7 | GO:0051434 | BH3 domain binding(GO:0051434) |
| 0.5 | 2.7 | GO:0097642 | calcitonin family receptor activity(GO:0097642) |
| 0.5 | 6.5 | GO:0017160 | Ral GTPase binding(GO:0017160) |
| 0.5 | 1.1 | GO:0031893 | vasopressin receptor binding(GO:0031893) |
| 0.5 | 1.6 | GO:0000403 | Y-form DNA binding(GO:0000403) |
| 0.5 | 3.2 | GO:0050733 | RS domain binding(GO:0050733) |
| 0.5 | 2.7 | GO:0005134 | interleukin-2 receptor binding(GO:0005134) |
| 0.5 | 3.2 | GO:0043559 | insulin binding(GO:0043559) |
| 0.5 | 55.5 | GO:0002020 | protease binding(GO:0002020) |
| 0.5 | 3.7 | GO:0008190 | eukaryotic initiation factor 4E binding(GO:0008190) |
| 0.5 | 1.0 | GO:0070698 | type I activin receptor binding(GO:0070698) |
| 0.5 | 2.0 | GO:0035615 | clathrin adaptor activity(GO:0035615) endocytic adaptor activity(GO:0098748) |
| 0.5 | 2.0 | GO:0004095 | carnitine O-palmitoyltransferase activity(GO:0004095) |
| 0.5 | 24.6 | GO:0003730 | mRNA 3'-UTR binding(GO:0003730) |
| 0.5 | 1.5 | GO:0031726 | CCR1 chemokine receptor binding(GO:0031726) |
| 0.5 | 1.5 | GO:0038100 | nodal binding(GO:0038100) |
| 0.5 | 2.9 | GO:0036402 | proteasome-activating ATPase activity(GO:0036402) |
| 0.5 | 3.3 | GO:0042809 | vitamin D receptor binding(GO:0042809) |
| 0.5 | 0.9 | GO:0060228 | phosphatidylcholine-sterol O-acyltransferase activator activity(GO:0060228) |
| 0.5 | 0.9 | GO:0004300 | enoyl-CoA hydratase activity(GO:0004300) |
| 0.5 | 2.3 | GO:0001665 | alpha-N-acetylgalactosaminide alpha-2,6-sialyltransferase activity(GO:0001665) |
| 0.5 | 4.2 | GO:0004499 | N,N-dimethylaniline monooxygenase activity(GO:0004499) |
| 0.5 | 2.3 | GO:0015165 | pyrimidine nucleotide-sugar transmembrane transporter activity(GO:0015165) |
| 0.5 | 12.6 | GO:0001103 | RNA polymerase II repressing transcription factor binding(GO:0001103) |
| 0.4 | 2.2 | GO:0004668 | protein-arginine deiminase activity(GO:0004668) |
| 0.4 | 2.6 | GO:0048406 | nerve growth factor binding(GO:0048406) |
| 0.4 | 0.9 | GO:0031749 | D2 dopamine receptor binding(GO:0031749) |
| 0.4 | 3.0 | GO:0070300 | phosphatidic acid binding(GO:0070300) |
| 0.4 | 0.9 | GO:0034617 | tetrahydrobiopterin binding(GO:0034617) |
| 0.4 | 1.3 | GO:0005001 | transmembrane receptor protein tyrosine phosphatase activity(GO:0005001) |
| 0.4 | 2.5 | GO:0005049 | nuclear export signal receptor activity(GO:0005049) |
| 0.4 | 1.2 | GO:0033300 | dehydroascorbic acid transporter activity(GO:0033300) |
| 0.4 | 1.2 | GO:1990460 | leptin receptor binding(GO:1990460) |
| 0.4 | 2.4 | GO:0003988 | acetyl-CoA C-acyltransferase activity(GO:0003988) |
| 0.4 | 1.6 | GO:0031750 | D3 dopamine receptor binding(GO:0031750) |
| 0.4 | 6.2 | GO:0019825 | oxygen binding(GO:0019825) |
| 0.4 | 1.5 | GO:0015375 | glycine:sodium symporter activity(GO:0015375) |
| 0.4 | 2.3 | GO:0015288 | porin activity(GO:0015288) |
| 0.4 | 7.2 | GO:0008157 | protein phosphatase 1 binding(GO:0008157) |
| 0.4 | 2.3 | GO:0016936 | galactoside binding(GO:0016936) |
| 0.4 | 1.9 | GO:0015450 | P-P-bond-hydrolysis-driven protein transmembrane transporter activity(GO:0015450) |
| 0.4 | 1.9 | GO:0003997 | acyl-CoA oxidase activity(GO:0003997) |
| 0.4 | 2.2 | GO:0017127 | cholesterol transporter activity(GO:0017127) |
| 0.4 | 4.1 | GO:0005337 | nucleoside transmembrane transporter activity(GO:0005337) |
| 0.4 | 1.1 | GO:0061676 | importin-alpha family protein binding(GO:0061676) |
| 0.4 | 2.1 | GO:0032027 | myosin light chain binding(GO:0032027) |
| 0.4 | 1.1 | GO:0016509 | long-chain-3-hydroxyacyl-CoA dehydrogenase activity(GO:0016509) |
| 0.4 | 1.1 | GO:0050220 | prostaglandin-E synthase activity(GO:0050220) |
| 0.4 | 7.1 | GO:0071889 | 14-3-3 protein binding(GO:0071889) |
| 0.4 | 12.8 | GO:0048365 | Rac GTPase binding(GO:0048365) |
| 0.4 | 1.8 | GO:0046975 | histone methyltransferase activity (H3-K36 specific)(GO:0046975) |
| 0.4 | 1.4 | GO:0005534 | galactose binding(GO:0005534) |
| 0.3 | 1.0 | GO:0045504 | dynein heavy chain binding(GO:0045504) |
| 0.3 | 15.5 | GO:0008392 | arachidonic acid epoxygenase activity(GO:0008392) |
| 0.3 | 7.8 | GO:0001540 | beta-amyloid binding(GO:0001540) |
| 0.3 | 1.0 | GO:0051425 | PTB domain binding(GO:0051425) |
| 0.3 | 1.0 | GO:0031871 | proteinase activated receptor binding(GO:0031871) |
| 0.3 | 4.3 | GO:0005351 | sugar:proton symporter activity(GO:0005351) |
| 0.3 | 2.6 | GO:0016861 | intramolecular oxidoreductase activity, interconverting aldoses and ketoses(GO:0016861) |
| 0.3 | 1.3 | GO:0032564 | dATP binding(GO:0032564) |
| 0.3 | 4.9 | GO:0032452 | histone demethylase activity(GO:0032452) |
| 0.3 | 1.0 | GO:0016842 | amidine-lyase activity(GO:0016842) |
| 0.3 | 1.0 | GO:0050309 | glucose-6-phosphatase activity(GO:0004346) sugar-terminal-phosphatase activity(GO:0050309) |
| 0.3 | 1.6 | GO:0004854 | xanthine dehydrogenase activity(GO:0004854) oxidoreductase activity, acting on CH or CH2 groups, NAD or NADP as acceptor(GO:0016726) |
| 0.3 | 0.3 | GO:0070411 | I-SMAD binding(GO:0070411) |
| 0.3 | 0.3 | GO:0032139 | dinucleotide insertion or deletion binding(GO:0032139) |
| 0.3 | 0.6 | GO:0004075 | biotin carboxylase activity(GO:0004075) |
| 0.3 | 1.6 | GO:0017169 | CDP-alcohol phosphatidyltransferase activity(GO:0017169) |
| 0.3 | 0.9 | GO:0019002 | GMP binding(GO:0019002) |
| 0.3 | 0.6 | GO:0035529 | NADH pyrophosphatase activity(GO:0035529) |
| 0.3 | 3.6 | GO:0043022 | ribosome binding(GO:0043022) |
| 0.3 | 1.5 | GO:0031849 | olfactory receptor binding(GO:0031849) |
| 0.3 | 1.2 | GO:0016920 | pyroglutamyl-peptidase activity(GO:0016920) |
| 0.3 | 1.2 | GO:0005168 | neurotrophin TRKA receptor binding(GO:0005168) |
| 0.3 | 2.7 | GO:0036312 | phosphatidylinositol 3-kinase regulatory subunit binding(GO:0036312) |
| 0.3 | 3.8 | GO:1990841 | promoter-specific chromatin binding(GO:1990841) |
| 0.3 | 0.9 | GO:0004416 | hydroxyacylglutathione hydrolase activity(GO:0004416) |
| 0.3 | 4.9 | GO:0046965 | retinoid X receptor binding(GO:0046965) |
| 0.3 | 2.6 | GO:0097027 | ubiquitin-protein transferase activator activity(GO:0097027) |
| 0.3 | 1.1 | GO:0035184 | histone threonine kinase activity(GO:0035184) |
| 0.3 | 1.4 | GO:0097157 | pre-mRNA intronic binding(GO:0097157) |
| 0.3 | 0.6 | GO:0070546 | L-phenylalanine aminotransferase activity(GO:0070546) |
| 0.3 | 0.8 | GO:0004345 | glucose-6-phosphate dehydrogenase activity(GO:0004345) |
| 0.3 | 0.6 | GO:0004999 | vasoactive intestinal polypeptide receptor activity(GO:0004999) |
| 0.3 | 1.7 | GO:0046974 | histone methyltransferase activity (H3-K9 specific)(GO:0046974) |
| 0.3 | 1.7 | GO:0030983 | mismatched DNA binding(GO:0030983) |
| 0.3 | 8.3 | GO:0061631 | ubiquitin conjugating enzyme activity(GO:0061631) |
| 0.3 | 1.1 | GO:0051022 | Rho GDP-dissociation inhibitor binding(GO:0051022) |
| 0.3 | 0.8 | GO:0030229 | very-low-density lipoprotein particle receptor activity(GO:0030229) |
| 0.3 | 0.8 | GO:0032422 | purine-rich negative regulatory element binding(GO:0032422) |
| 0.3 | 1.4 | GO:0070728 | leucine binding(GO:0070728) |
| 0.3 | 0.5 | GO:0015182 | L-asparagine transmembrane transporter activity(GO:0015182) L-glutamine transmembrane transporter activity(GO:0015186) |
| 0.3 | 0.8 | GO:0004605 | phosphatidate cytidylyltransferase activity(GO:0004605) |
| 0.3 | 1.1 | GO:0004582 | dolichyl-phosphate beta-D-mannosyltransferase activity(GO:0004582) |
| 0.3 | 1.6 | GO:0030235 | nitric-oxide synthase regulator activity(GO:0030235) |
| 0.3 | 1.6 | GO:0004768 | stearoyl-CoA 9-desaturase activity(GO:0004768) |
| 0.3 | 0.3 | GO:0004517 | nitric-oxide synthase activity(GO:0004517) |
| 0.3 | 0.8 | GO:0043138 | 3'-5' DNA helicase activity(GO:0043138) |
| 0.3 | 2.4 | GO:0034946 | 2-oxoglutaryl-CoA thioesterase activity(GO:0034843) 2,4,4-trimethyl-3-oxopentanoyl-CoA thioesterase activity(GO:0034869) 3-isopropylbut-3-enoyl-CoA thioesterase activity(GO:0034946) glutaryl-CoA hydrolase activity(GO:0044466) |
| 0.3 | 1.1 | GO:0000293 | ferric-chelate reductase activity(GO:0000293) |
| 0.3 | 1.1 | GO:0016744 | transferase activity, transferring aldehyde or ketonic groups(GO:0016744) |
| 0.3 | 1.0 | GO:0002054 | nucleobase binding(GO:0002054) |
| 0.3 | 1.0 | GO:0070579 | methylcytosine dioxygenase activity(GO:0070579) |
| 0.3 | 2.1 | GO:0102391 | decanoate--CoA ligase activity(GO:0102391) |
| 0.3 | 1.5 | GO:0005000 | vasopressin receptor activity(GO:0005000) |
| 0.3 | 3.4 | GO:0017091 | AU-rich element binding(GO:0017091) |
| 0.3 | 11.2 | GO:0003684 | damaged DNA binding(GO:0003684) |
| 0.3 | 0.8 | GO:0008310 | single-stranded DNA 3'-5' exodeoxyribonuclease activity(GO:0008310) |
| 0.3 | 5.5 | GO:0016702 | oxidoreductase activity, acting on single donors with incorporation of molecular oxygen, incorporation of two atoms of oxygen(GO:0016702) |
| 0.2 | 11.0 | GO:0018721 | N-acetylglucosamine 6-O-sulfotransferase activity(GO:0001517) heparan sulfate 2-O-sulfotransferase activity(GO:0004394) HNK-1 sulfotransferase activity(GO:0016232) heparan sulfate 6-O-sulfotransferase activity(GO:0017095) trans-9R,10R-dihydrodiolphenanthrene sulfotransferase activity(GO:0018721) 1-phenanthrol sulfotransferase activity(GO:0018722) 3-phenanthrol sulfotransferase activity(GO:0018723) 4-phenanthrol sulfotransferase activity(GO:0018724) trans-3,4-dihydrodiolphenanthrene sulfotransferase activity(GO:0018725) 9-phenanthrol sulfotransferase activity(GO:0018726) 2-phenanthrol sulfotransferase activity(GO:0018727) phenanthrol sulfotransferase activity(GO:0019111) 1-hydroxypyrene sulfotransferase activity(GO:0034930) proteoglycan sulfotransferase activity(GO:0050698) cholesterol sulfotransferase activity(GO:0051922) hydroxyjasmonate sulfotransferase activity(GO:0080131) |
| 0.2 | 0.7 | GO:0016774 | phosphotransferase activity, carboxyl group as acceptor(GO:0016774) |
| 0.2 | 1.0 | GO:0070097 | delta-catenin binding(GO:0070097) |
| 0.2 | 1.5 | GO:0004322 | ferroxidase activity(GO:0004322) oxidoreductase activity, oxidizing metal ions, oxygen as acceptor(GO:0016724) |
| 0.2 | 1.0 | GO:0051525 | NFAT protein binding(GO:0051525) |
| 0.2 | 1.0 | GO:0001025 | RNA polymerase III transcription factor binding(GO:0001025) |
| 0.2 | 1.7 | GO:0004579 | dolichyl-diphosphooligosaccharide-protein glycotransferase activity(GO:0004579) |
| 0.2 | 1.7 | GO:0003688 | DNA replication origin binding(GO:0003688) |
| 0.2 | 0.7 | GO:0030160 | GKAP/Homer scaffold activity(GO:0030160) |
| 0.2 | 0.5 | GO:0070538 | oleic acid binding(GO:0070538) |
| 0.2 | 0.7 | GO:0004359 | glutaminase activity(GO:0004359) |
| 0.2 | 0.2 | GO:0003691 | double-stranded telomeric DNA binding(GO:0003691) |
| 0.2 | 0.7 | GO:0003829 | beta-1,3-galactosyl-O-glycosyl-glycoprotein beta-1,6-N-acetylglucosaminyltransferase activity(GO:0003829) |
| 0.2 | 2.9 | GO:0032183 | SUMO binding(GO:0032183) |
| 0.2 | 5.3 | GO:0005158 | insulin receptor binding(GO:0005158) |
| 0.2 | 2.4 | GO:0004596 | peptide alpha-N-acetyltransferase activity(GO:0004596) |
| 0.2 | 6.1 | GO:0031369 | translation initiation factor binding(GO:0031369) |
| 0.2 | 1.4 | GO:0019855 | calcium channel inhibitor activity(GO:0019855) |
| 0.2 | 2.3 | GO:0017154 | semaphorin receptor activity(GO:0017154) |
| 0.2 | 0.7 | GO:0004430 | 1-phosphatidylinositol 4-kinase activity(GO:0004430) |
| 0.2 | 0.5 | GO:0001069 | regulatory region RNA binding(GO:0001069) |
| 0.2 | 1.6 | GO:0102338 | fatty acid elongase activity(GO:0009922) 3-oxo-arachidoyl-CoA synthase activity(GO:0102336) 3-oxo-cerotoyl-CoA synthase activity(GO:0102337) 3-oxo-lignoceronyl-CoA synthase activity(GO:0102338) |
| 0.2 | 1.8 | GO:0051400 | BH domain binding(GO:0051400) |
| 0.2 | 7.0 | GO:0005132 | type I interferon receptor binding(GO:0005132) |
| 0.2 | 6.1 | GO:0050699 | WW domain binding(GO:0050699) |
| 0.2 | 0.7 | GO:0004367 | glycerol-3-phosphate dehydrogenase [NAD+] activity(GO:0004367) |
| 0.2 | 0.9 | GO:0004332 | fructose-bisphosphate aldolase activity(GO:0004332) |
| 0.2 | 0.7 | GO:0050692 | DBD domain binding(GO:0050692) |
| 0.2 | 0.9 | GO:0005280 | hydrogen:amino acid symporter activity(GO:0005280) |
| 0.2 | 0.9 | GO:0004594 | pantothenate kinase activity(GO:0004594) |
| 0.2 | 0.9 | GO:0005072 | transforming growth factor beta receptor, cytoplasmic mediator activity(GO:0005072) |
| 0.2 | 2.0 | GO:0001222 | transcription corepressor binding(GO:0001222) |
| 0.2 | 0.4 | GO:0034988 | Fc-gamma receptor I complex binding(GO:0034988) |
| 0.2 | 1.5 | GO:0001162 | RNA polymerase II intronic transcription regulatory region sequence-specific DNA binding(GO:0001162) |
| 0.2 | 1.1 | GO:0017151 | DEAD/H-box RNA helicase binding(GO:0017151) |
| 0.2 | 6.1 | GO:0017112 | Rab guanyl-nucleotide exchange factor activity(GO:0017112) |
| 0.2 | 0.9 | GO:0004468 | lysine N-acetyltransferase activity, acting on acetyl phosphate as donor(GO:0004468) |
| 0.2 | 0.9 | GO:0030976 | thiamine pyrophosphate binding(GO:0030976) |
| 0.2 | 0.6 | GO:0001075 | transcription factor activity, RNA polymerase II core promoter sequence-specific binding involved in preinitiation complex assembly(GO:0001075) |
| 0.2 | 0.4 | GO:0004779 | sulfate adenylyltransferase activity(GO:0004779) |
| 0.2 | 1.9 | GO:0016886 | ligase activity, forming phosphoric ester bonds(GO:0016886) |
| 0.2 | 3.8 | GO:0070491 | repressing transcription factor binding(GO:0070491) |
| 0.2 | 0.4 | GO:0034618 | arginine binding(GO:0034618) |
| 0.2 | 1.3 | GO:0005225 | volume-sensitive anion channel activity(GO:0005225) |
| 0.2 | 1.7 | GO:0019869 | chloride channel inhibitor activity(GO:0019869) |
| 0.2 | 0.8 | GO:0036137 | kynurenine-oxoglutarate transaminase activity(GO:0016212) kynurenine aminotransferase activity(GO:0036137) |
| 0.2 | 1.1 | GO:0004957 | prostaglandin E receptor activity(GO:0004957) |
| 0.2 | 1.0 | GO:0005113 | patched binding(GO:0005113) |
| 0.2 | 1.7 | GO:0008889 | glycerophosphodiester phosphodiesterase activity(GO:0008889) |
| 0.2 | 0.8 | GO:0009374 | biotin binding(GO:0009374) |
| 0.2 | 0.2 | GO:1990715 | mRNA CDS binding(GO:1990715) |
| 0.2 | 0.4 | GO:0034739 | histone deacetylase activity (H4-K16 specific)(GO:0034739) |
| 0.2 | 1.5 | GO:0043495 | protein anchor(GO:0043495) |
| 0.2 | 0.4 | GO:0047023 | androsterone dehydrogenase activity(GO:0047023) |
| 0.2 | 0.6 | GO:0030911 | TPR domain binding(GO:0030911) |
| 0.2 | 1.4 | GO:0050700 | CARD domain binding(GO:0050700) |
| 0.2 | 0.6 | GO:0000900 | translation repressor activity, nucleic acid binding(GO:0000900) |
| 0.2 | 0.8 | GO:0016899 | oxidoreductase activity, acting on the CH-OH group of donors, oxygen as acceptor(GO:0016899) |
| 0.2 | 0.6 | GO:0015143 | urate transmembrane transporter activity(GO:0015143) salt transmembrane transporter activity(GO:1901702) |
| 0.2 | 1.2 | GO:0034185 | apolipoprotein binding(GO:0034185) |
| 0.2 | 2.2 | GO:0008641 | small protein activating enzyme activity(GO:0008641) |
| 0.2 | 1.0 | GO:0001758 | retinal dehydrogenase activity(GO:0001758) |
| 0.2 | 0.8 | GO:0043426 | MRF binding(GO:0043426) |
| 0.2 | 3.5 | GO:0031492 | nucleosomal DNA binding(GO:0031492) |
| 0.2 | 0.6 | GO:0016635 | oxidoreductase activity, acting on the CH-CH group of donors, quinone or related compound as acceptor(GO:0016635) |
| 0.2 | 4.4 | GO:0018024 | histone-lysine N-methyltransferase activity(GO:0018024) |
| 0.2 | 0.6 | GO:0071209 | U7 snRNA binding(GO:0071209) |
| 0.2 | 3.5 | GO:0043325 | phosphatidylinositol-3,4-bisphosphate binding(GO:0043325) |
| 0.2 | 0.4 | GO:0010484 | H3 histone acetyltransferase activity(GO:0010484) |
| 0.2 | 2.9 | GO:0008146 | sulfotransferase activity(GO:0008146) |
| 0.2 | 0.8 | GO:0016018 | cyclosporin A binding(GO:0016018) |
| 0.2 | 6.7 | GO:0048487 | beta-tubulin binding(GO:0048487) |
| 0.2 | 0.6 | GO:0047045 | testosterone 17-beta-dehydrogenase (NADP+) activity(GO:0047045) |
| 0.2 | 1.0 | GO:0004523 | RNA-DNA hybrid ribonuclease activity(GO:0004523) |
| 0.2 | 1.1 | GO:0043522 | leucine zipper domain binding(GO:0043522) |
| 0.2 | 2.9 | GO:0004407 | histone deacetylase activity(GO:0004407) |
| 0.2 | 0.6 | GO:0004427 | inorganic diphosphatase activity(GO:0004427) |
| 0.2 | 0.8 | GO:0002046 | opsin binding(GO:0002046) |
| 0.2 | 1.1 | GO:0045545 | syndecan binding(GO:0045545) |
| 0.2 | 0.8 | GO:0017034 | Rap guanyl-nucleotide exchange factor activity(GO:0017034) |
| 0.2 | 1.9 | GO:0070180 | large ribosomal subunit rRNA binding(GO:0070180) |
| 0.2 | 0.7 | GO:0031545 | peptidyl-proline 4-dioxygenase activity(GO:0031545) |
| 0.2 | 0.6 | GO:0008503 | benzodiazepine receptor activity(GO:0008503) |
| 0.2 | 0.6 | GO:0004663 | Rab geranylgeranyltransferase activity(GO:0004663) |
| 0.2 | 0.7 | GO:0004312 | fatty acid synthase activity(GO:0004312) |
| 0.2 | 32.6 | GO:0004252 | serine-type endopeptidase activity(GO:0004252) |
| 0.2 | 1.8 | GO:0015643 | toxic substance binding(GO:0015643) |
| 0.2 | 3.6 | GO:0001158 | enhancer sequence-specific DNA binding(GO:0001158) |
| 0.2 | 0.2 | GO:0032405 | MutLalpha complex binding(GO:0032405) |
| 0.2 | 0.7 | GO:0034235 | GPI anchor binding(GO:0034235) |
| 0.2 | 0.7 | GO:0004726 | non-membrane spanning protein tyrosine phosphatase activity(GO:0004726) |
| 0.2 | 1.9 | GO:0043274 | phospholipase binding(GO:0043274) |
| 0.2 | 7.8 | GO:0005160 | transforming growth factor beta receptor binding(GO:0005160) |
| 0.2 | 8.1 | GO:0004722 | protein serine/threonine phosphatase activity(GO:0004722) |
| 0.2 | 0.9 | GO:1990239 | steroid hormone binding(GO:1990239) |
| 0.2 | 3.3 | GO:0003746 | translation elongation factor activity(GO:0003746) |
| 0.2 | 0.2 | GO:0070878 | primary miRNA binding(GO:0070878) |
| 0.2 | 0.7 | GO:0031419 | cobalamin binding(GO:0031419) |
| 0.2 | 1.9 | GO:0005092 | GDP-dissociation inhibitor activity(GO:0005092) |
| 0.2 | 0.2 | GO:1990825 | sequence-specific mRNA binding(GO:1990825) |
| 0.2 | 2.4 | GO:0001871 | pattern binding(GO:0001871) polysaccharide binding(GO:0030247) |
| 0.2 | 0.5 | GO:0051373 | FATZ binding(GO:0051373) |
| 0.2 | 0.3 | GO:0004448 | isocitrate dehydrogenase activity(GO:0004448) |
| 0.2 | 0.5 | GO:0004849 | uridine kinase activity(GO:0004849) |
| 0.2 | 1.2 | GO:0034450 | ubiquitin-ubiquitin ligase activity(GO:0034450) |
| 0.2 | 0.5 | GO:0018631 | 3-(3-hydroxyphenyl)propionate hydroxylase activity(GO:0008688) 4-chlorobenzaldehyde oxidase activity(GO:0018471) 3,5-xylenol methylhydroxylase activity(GO:0018630) phenylacetate hydroxylase activity(GO:0018631) 4-nitrophenol 4-monooxygenase activity(GO:0018632) dimethyl sulfide monooxygenase activity(GO:0018633) alpha-pinene monooxygenase [NADH] activity(GO:0018634) phenanthrene 9,10-monooxygenase activity(GO:0018636) 1-hydroxy-2-naphthoate hydroxylase activity(GO:0018637) toluene 4-monooxygenase activity(GO:0018638) xylene monooxygenase activity(GO:0018639) dibenzothiophene monooxygenase activity(GO:0018640) 6-hydroxy-3-methyl-2-oxo-1,2-dihydroquinoline 6-monooxygenase activity(GO:0018641) chlorophenol 4-monooxygenase activity(GO:0018642) carbon disulfide oxygenase activity(GO:0018643) toluene 2-monooxygenase activity(GO:0018644) 1-hydroxy-2-oxolimonene 1,2-monooxygenase activity(GO:0018646) phenanthrene 1,2-monooxygenase activity(GO:0018647) tetrahydrofuran hydroxylase activity(GO:0018649) styrene monooxygenase activity(GO:0018650) toluene-4-sulfonate monooxygenase activity(GO:0018651) toluene-sulfonate methyl-monooxygenase activity(GO:0018652) 3-methyl-2-oxo-1,2-dihydroquinoline 6-monooxygenase activity(GO:0018653) 2-hydroxy-phenylacetate hydroxylase activity(GO:0018654) 2-oxo-delta3-4,5,5-trimethylcyclopentenylacetyl-CoA 1,2-monooxygenase activity(GO:0018655) phenanthrene 3,4-monooxygenase activity(GO:0018656) toluene 3-monooxygenase activity(GO:0018657) 4-hydroxyphenylacetate,NADH:oxygen oxidoreductase (3-hydroxylating) activity(GO:0018660) limonene monooxygenase activity(GO:0019113) 2-methylnaphthalene hydroxylase activity(GO:0034526) 1-methylnaphthalene hydroxylase activity(GO:0034534) bisphenol A hydroxylase A activity(GO:0034560) salicylate 5-hydroxylase activity(GO:0034785) isobutylamine N-hydroxylase activity(GO:0034791) branched-chain dodecylbenzene sulfonate monooxygenase activity(GO:0034802) 3-HSA hydroxylase activity(GO:0034819) 4-hydroxypyridine-3-hydroxylase activity(GO:0034894) 2-octaprenyl-3-methyl-6-methoxy-1,4-benzoquinol hydroxylase activity(GO:0043719) 6-hydroxynicotinate 3-monooxygenase activity(GO:0043731) tocotrienol omega-hydroxylase activity(GO:0052872) thalianol hydroxylase activity(GO:0080014) |
| 0.2 | 29.3 | GO:0031267 | small GTPase binding(GO:0031267) |
| 0.2 | 0.5 | GO:0010858 | calcium-dependent protein kinase regulator activity(GO:0010858) |
| 0.2 | 0.5 | GO:0004832 | valine-tRNA ligase activity(GO:0004832) |
| 0.2 | 0.3 | GO:0005159 | insulin-like growth factor receptor binding(GO:0005159) |
| 0.2 | 14.7 | GO:0015399 | primary active transmembrane transporter activity(GO:0015399) P-P-bond-hydrolysis-driven transmembrane transporter activity(GO:0015405) ATPase activity, coupled to transmembrane movement of substances(GO:0042626) |
| 0.2 | 2.1 | GO:0016790 | thiolester hydrolase activity(GO:0016790) |
| 0.2 | 0.8 | GO:0048020 | CCR chemokine receptor binding(GO:0048020) |
| 0.2 | 0.5 | GO:0004708 | MAP kinase kinase activity(GO:0004708) |
| 0.2 | 1.1 | GO:0035005 | 1-phosphatidylinositol-4-phosphate 3-kinase activity(GO:0035005) |
| 0.2 | 0.5 | GO:0004165 | dodecenoyl-CoA delta-isomerase activity(GO:0004165) |
| 0.2 | 0.8 | GO:0043008 | ATP-dependent protein binding(GO:0043008) |
| 0.2 | 0.5 | GO:0004035 | alkaline phosphatase activity(GO:0004035) |
| 0.2 | 1.1 | GO:0050072 | m7G(5')pppN diphosphatase activity(GO:0050072) |
| 0.2 | 0.2 | GO:0004706 | JUN kinase kinase kinase activity(GO:0004706) |
| 0.2 | 2.7 | GO:0016755 | transferase activity, transferring amino-acyl groups(GO:0016755) |
| 0.2 | 2.2 | GO:0046332 | SMAD binding(GO:0046332) |
| 0.2 | 1.6 | GO:0005521 | lamin binding(GO:0005521) |
| 0.2 | 0.6 | GO:1990226 | histone methyltransferase binding(GO:1990226) |
| 0.2 | 0.3 | GO:0030297 | transmembrane receptor protein tyrosine kinase activator activity(GO:0030297) |
| 0.2 | 0.6 | GO:0004966 | galanin receptor activity(GO:0004966) |
| 0.2 | 3.5 | GO:0005154 | epidermal growth factor receptor binding(GO:0005154) |
| 0.2 | 2.1 | GO:0008307 | structural constituent of muscle(GO:0008307) |
| 0.2 | 0.5 | GO:0050508 | glucuronosyl-N-acetylglucosaminyl-proteoglycan 4-alpha-N-acetylglucosaminyltransferase activity(GO:0050508) |
| 0.2 | 0.5 | GO:0004558 | alpha-1,4-glucosidase activity(GO:0004558) |
| 0.2 | 1.1 | GO:0008192 | RNA guanylyltransferase activity(GO:0008192) |
| 0.2 | 2.1 | GO:0070530 | K63-linked polyubiquitin binding(GO:0070530) |
| 0.1 | 0.6 | GO:0004679 | AMP-activated protein kinase activity(GO:0004679) |
| 0.1 | 5.8 | GO:0005080 | protein kinase C binding(GO:0005080) |
| 0.1 | 0.6 | GO:0005173 | stem cell factor receptor binding(GO:0005173) |
| 0.1 | 0.3 | GO:0004687 | myosin light chain kinase activity(GO:0004687) |
| 0.1 | 1.8 | GO:0008198 | ferrous iron binding(GO:0008198) |
| 0.1 | 2.2 | GO:0043139 | 5'-3' DNA helicase activity(GO:0043139) |
| 0.1 | 0.4 | GO:0042301 | phosphate ion binding(GO:0042301) |
| 0.1 | 0.9 | GO:0015168 | glycerol transmembrane transporter activity(GO:0015168) glycerol channel activity(GO:0015254) |
| 0.1 | 1.6 | GO:0016854 | racemase and epimerase activity(GO:0016854) |
| 0.1 | 0.4 | GO:0008430 | selenium binding(GO:0008430) |
| 0.1 | 0.4 | GO:0004514 | nicotinate-nucleotide diphosphorylase (carboxylating) activity(GO:0004514) |
| 0.1 | 0.7 | GO:0005412 | glucose:sodium symporter activity(GO:0005412) |
| 0.1 | 0.6 | GO:0010521 | telomerase inhibitor activity(GO:0010521) |
| 0.1 | 0.7 | GO:0016176 | superoxide-generating NADPH oxidase activator activity(GO:0016176) |
| 0.1 | 0.6 | GO:0097001 | ceramide binding(GO:0097001) |
| 0.1 | 0.7 | GO:0008603 | cAMP-dependent protein kinase regulator activity(GO:0008603) |
| 0.1 | 2.2 | GO:0035035 | histone acetyltransferase binding(GO:0035035) |
| 0.1 | 1.1 | GO:0043024 | ribosomal small subunit binding(GO:0043024) |
| 0.1 | 1.0 | GO:0051787 | misfolded protein binding(GO:0051787) |
| 0.1 | 0.4 | GO:0016716 | oxidoreductase activity, acting on paired donors, with incorporation or reduction of molecular oxygen, another compound as one donor, and incorporation of one atom of oxygen(GO:0016716) |
| 0.1 | 0.3 | GO:0031752 | D5 dopamine receptor binding(GO:0031752) |
| 0.1 | 1.2 | GO:0015651 | quaternary ammonium group transmembrane transporter activity(GO:0015651) |
| 0.1 | 0.5 | GO:0019145 | aminobutyraldehyde dehydrogenase activity(GO:0019145) 4-trimethylammoniobutyraldehyde dehydrogenase activity(GO:0047105) |
| 0.1 | 1.5 | GO:0070412 | R-SMAD binding(GO:0070412) |
| 0.1 | 1.1 | GO:0005123 | death receptor binding(GO:0005123) |
| 0.1 | 0.5 | GO:0070290 | N-acylphosphatidylethanolamine-specific phospholipase D activity(GO:0070290) |
| 0.1 | 1.8 | GO:0016780 | phosphotransferase activity, for other substituted phosphate groups(GO:0016780) |
| 0.1 | 0.4 | GO:0004611 | phosphoenolpyruvate carboxykinase activity(GO:0004611) |
| 0.1 | 8.2 | GO:0046906 | tetrapyrrole binding(GO:0046906) |
| 0.1 | 0.7 | GO:1990247 | N6-methyladenosine-containing RNA binding(GO:1990247) |
| 0.1 | 0.8 | GO:0030676 | Rac guanyl-nucleotide exchange factor activity(GO:0030676) |
| 0.1 | 1.5 | GO:0015279 | store-operated calcium channel activity(GO:0015279) |
| 0.1 | 0.4 | GO:0008260 | 3-oxoacid CoA-transferase activity(GO:0008260) |
| 0.1 | 0.7 | GO:0000832 | inositol hexakisphosphate kinase activity(GO:0000828) inositol hexakisphosphate 5-kinase activity(GO:0000832) inositol hexakisphosphate 1-kinase activity(GO:0052723) inositol hexakisphosphate 3-kinase activity(GO:0052724) |
| 0.1 | 0.4 | GO:0042030 | ATPase inhibitor activity(GO:0042030) |
| 0.1 | 0.5 | GO:0019870 | potassium channel inhibitor activity(GO:0019870) |
| 0.1 | 1.1 | GO:0018857 | 3-oxo-2-(2'-pentenyl)cyclopentane-1-octanoic acid CoA ligase activity(GO:0010435) 3-isopropenyl-6-oxoheptanoyl-CoA synthetase activity(GO:0018854) 2-oxo-delta3-4,5,5-trimethylcyclopentenylacetyl-CoA synthetase activity(GO:0018855) benzoyl acetate-CoA ligase activity(GO:0018856) 2,4-dichlorobenzoate-CoA ligase activity(GO:0018857) pivalate-CoA ligase activity(GO:0034783) cyclopropanecarboxylate-CoA ligase activity(GO:0034793) adipate-CoA ligase activity(GO:0034796) citronellyl-CoA ligase activity(GO:0034823) mentha-1,3-dione-CoA ligase activity(GO:0034841) thiophene-2-carboxylate-CoA ligase activity(GO:0034842) 2,4,4-trimethylpentanoate-CoA ligase activity(GO:0034865) cis-2-methyl-5-isopropylhexa-2,5-dienoate-CoA ligase activity(GO:0034942) trans-2-methyl-5-isopropylhexa-2,5-dienoate-CoA ligase activity(GO:0034943) branched-chain acyl-CoA synthetase (ADP-forming) activity(GO:0043759) aryl-CoA synthetase (ADP-forming) activity(GO:0043762) 3-hydroxypropionyl-CoA synthetase activity(GO:0043955) perillic acid:CoA ligase (ADP-forming) activity(GO:0052685) perillic acid:CoA ligase (AMP-forming) activity(GO:0052686) (3R)-3-isopropenyl-6-oxoheptanoate:CoA ligase (ADP-forming) activity(GO:0052687) (3R)-3-isopropenyl-6-oxoheptanoate:CoA ligase (AMP-forming) activity(GO:0052688) pristanate-CoA ligase activity(GO:0070251) malonyl-CoA synthetase activity(GO:0090409) |
| 0.1 | 1.2 | GO:0016653 | oxidoreductase activity, acting on NAD(P)H, heme protein as acceptor(GO:0016653) |
| 0.1 | 2.0 | GO:0016671 | oxidoreductase activity, acting on a sulfur group of donors, disulfide as acceptor(GO:0016671) |
| 0.1 | 0.5 | GO:0043184 | vascular endothelial growth factor receptor 2 binding(GO:0043184) |
| 0.1 | 0.5 | GO:0001727 | lipid kinase activity(GO:0001727) |
| 0.1 | 2.6 | GO:0051721 | protein phosphatase 2A binding(GO:0051721) |
| 0.1 | 1.4 | GO:0070008 | serine-type carboxypeptidase activity(GO:0004185) serine-type exopeptidase activity(GO:0070008) |
| 0.1 | 5.6 | GO:0016628 | oxidoreductase activity, acting on the CH-CH group of donors, NAD or NADP as acceptor(GO:0016628) |
| 0.1 | 0.5 | GO:0046923 | ER retention sequence binding(GO:0046923) |
| 0.1 | 4.5 | GO:0004869 | cysteine-type endopeptidase inhibitor activity(GO:0004869) |
| 0.1 | 1.9 | GO:0045543 | sulfonate dioxygenase activity(GO:0000907) 2,4-dichlorophenoxyacetate alpha-ketoglutarate dioxygenase activity(GO:0018602) hypophosphite dioxygenase activity(GO:0034792) gibberellin 2-beta-dioxygenase activity(GO:0045543) C-19 gibberellin 2-beta-dioxygenase activity(GO:0052634) C-20 gibberellin 2-beta-dioxygenase activity(GO:0052635) |
| 0.1 | 3.1 | GO:0001205 | transcriptional activator activity, RNA polymerase II distal enhancer sequence-specific binding(GO:0001205) |
| 0.1 | 1.2 | GO:0035497 | cAMP response element binding(GO:0035497) |
| 0.1 | 0.5 | GO:1990405 | protein antigen binding(GO:1990405) |
| 0.1 | 1.5 | GO:0004602 | glutathione peroxidase activity(GO:0004602) |
| 0.1 | 0.5 | GO:0052796 | exo-alpha-sialidase activity(GO:0004308) alpha-sialidase activity(GO:0016997) exo-alpha-(2->3)-sialidase activity(GO:0052794) exo-alpha-(2->6)-sialidase activity(GO:0052795) exo-alpha-(2->8)-sialidase activity(GO:0052796) |
| 0.1 | 0.3 | GO:0030984 | kininogen binding(GO:0030984) |
| 0.1 | 0.4 | GO:0001094 | TFIID-class transcription factor binding(GO:0001094) |
| 0.1 | 0.5 | GO:0005499 | vitamin D binding(GO:0005499) |
| 0.1 | 0.5 | GO:0004449 | isocitrate dehydrogenase (NAD+) activity(GO:0004449) |
| 0.1 | 6.3 | GO:0008094 | DNA-dependent ATPase activity(GO:0008094) |
| 0.1 | 0.5 | GO:0070566 | adenylyltransferase activity(GO:0070566) |
| 0.1 | 0.6 | GO:0005381 | iron ion transmembrane transporter activity(GO:0005381) ferrous iron transmembrane transporter activity(GO:0015093) |
| 0.1 | 0.6 | GO:0008454 | alpha-1,3-mannosylglycoprotein 4-beta-N-acetylglucosaminyltransferase activity(GO:0008454) |
| 0.1 | 4.5 | GO:0008009 | chemokine activity(GO:0008009) |
| 0.1 | 0.4 | GO:0004735 | pyrroline-5-carboxylate reductase activity(GO:0004735) |
| 0.1 | 2.0 | GO:0008422 | beta-glucosidase activity(GO:0008422) |
| 0.1 | 22.2 | GO:0003735 | structural constituent of ribosome(GO:0003735) |
| 0.1 | 6.3 | GO:0042826 | histone deacetylase binding(GO:0042826) |
| 0.1 | 0.4 | GO:0015645 | fatty acid ligase activity(GO:0015645) |
| 0.1 | 0.8 | GO:0004571 | mannosyl-oligosaccharide 1,2-alpha-mannosidase activity(GO:0004571) |
| 0.1 | 1.8 | GO:0043295 | glutathione binding(GO:0043295) oligopeptide binding(GO:1900750) |
| 0.1 | 1.2 | GO:0004861 | cyclin-dependent protein serine/threonine kinase inhibitor activity(GO:0004861) |
| 0.1 | 0.5 | GO:0051184 | cofactor transporter activity(GO:0051184) |
| 0.1 | 0.5 | GO:0015245 | fatty acid transporter activity(GO:0015245) |
| 0.1 | 0.2 | GO:0097371 | MDM2/MDM4 family protein binding(GO:0097371) |
| 0.1 | 2.9 | GO:0015485 | cholesterol binding(GO:0015485) |
| 0.1 | 0.2 | GO:0045340 | mercury ion binding(GO:0045340) |
| 0.1 | 0.2 | GO:0015232 | heme transporter activity(GO:0015232) |
| 0.1 | 0.6 | GO:0004689 | phosphorylase kinase activity(GO:0004689) |
| 0.1 | 0.1 | GO:0048018 | receptor agonist activity(GO:0048018) |
| 0.1 | 0.3 | GO:0038132 | neuregulin binding(GO:0038132) |
| 0.1 | 1.0 | GO:0044548 | S100 protein binding(GO:0044548) |
| 0.1 | 0.2 | GO:0004720 | protein-lysine 6-oxidase activity(GO:0004720) |
| 0.1 | 0.8 | GO:0031386 | protein tag(GO:0031386) |
| 0.1 | 0.9 | GO:0035259 | glucocorticoid receptor binding(GO:0035259) |
| 0.1 | 0.3 | GO:0004813 | alanine-tRNA ligase activity(GO:0004813) |
| 0.1 | 2.3 | GO:0042169 | SH2 domain binding(GO:0042169) |
| 0.1 | 0.1 | GO:0032404 | mismatch repair complex binding(GO:0032404) |
| 0.1 | 1.1 | GO:0008143 | poly(A) binding(GO:0008143) |
| 0.1 | 8.2 | GO:0003729 | mRNA binding(GO:0003729) |
| 0.1 | 1.0 | GO:0017069 | snRNA binding(GO:0017069) |
| 0.1 | 3.6 | GO:0003697 | single-stranded DNA binding(GO:0003697) |
| 0.1 | 1.1 | GO:0015125 | bile acid transmembrane transporter activity(GO:0015125) |
| 0.1 | 0.7 | GO:0070991 | medium-chain-acyl-CoA dehydrogenase activity(GO:0070991) |
| 0.1 | 0.3 | GO:0003987 | acetate-CoA ligase activity(GO:0003987) |
| 0.1 | 1.9 | GO:0030331 | estrogen receptor binding(GO:0030331) |
| 0.1 | 0.1 | GO:0001030 | RNA polymerase III regulatory region DNA binding(GO:0001016) RNA polymerase III type 1 promoter DNA binding(GO:0001030) RNA polymerase III type 2 promoter DNA binding(GO:0001031) RNA polymerase III type 3 promoter DNA binding(GO:0001032) 5S rDNA binding(GO:0080084) |
| 0.1 | 0.4 | GO:0070492 | oligosaccharide binding(GO:0070492) |
| 0.1 | 1.6 | GO:0031593 | polyubiquitin binding(GO:0031593) |
| 0.1 | 0.1 | GO:0004645 | phosphorylase activity(GO:0004645) |
| 0.1 | 0.9 | GO:0003854 | 3-beta-hydroxy-delta5-steroid dehydrogenase activity(GO:0003854) |
| 0.1 | 0.5 | GO:0004758 | serine C-palmitoyltransferase activity(GO:0004758) |
| 0.1 | 1.0 | GO:0004016 | adenylate cyclase activity(GO:0004016) |
| 0.1 | 0.3 | GO:0016309 | 1-phosphatidylinositol-5-phosphate 4-kinase activity(GO:0016309) |
| 0.1 | 0.1 | GO:0052658 | inositol-1,4,5-trisphosphate 5-phosphatase activity(GO:0052658) |
| 0.1 | 0.5 | GO:0008273 | calcium, potassium:sodium antiporter activity(GO:0008273) |
| 0.1 | 0.6 | GO:0016681 | ubiquinol-cytochrome-c reductase activity(GO:0008121) oxidoreductase activity, acting on diphenols and related substances as donors(GO:0016679) oxidoreductase activity, acting on diphenols and related substances as donors, cytochrome as acceptor(GO:0016681) |
| 0.1 | 0.2 | GO:0016715 | oxidoreductase activity, acting on paired donors, with incorporation or reduction of molecular oxygen, reduced ascorbate as one donor, and incorporation of one atom of oxygen(GO:0016715) |
| 0.1 | 3.1 | GO:0035064 | methylated histone binding(GO:0035064) |
| 0.1 | 0.4 | GO:0035473 | lipase binding(GO:0035473) |
| 0.1 | 0.6 | GO:0043014 | alpha-tubulin binding(GO:0043014) |
| 0.1 | 0.1 | GO:0004069 | L-aspartate:2-oxoglutarate aminotransferase activity(GO:0004069) |
| 0.1 | 0.3 | GO:0016941 | natriuretic peptide receptor activity(GO:0016941) |
| 0.1 | 0.4 | GO:0004337 | geranyltranstransferase activity(GO:0004337) |
| 0.1 | 0.4 | GO:0050501 | hyaluronan synthase activity(GO:0050501) |
| 0.1 | 1.7 | GO:0042813 | Wnt-activated receptor activity(GO:0042813) |
| 0.1 | 3.5 | GO:0016763 | transferase activity, transferring pentosyl groups(GO:0016763) |
| 0.1 | 0.3 | GO:0003857 | 3-hydroxyacyl-CoA dehydrogenase activity(GO:0003857) |
| 0.1 | 0.5 | GO:0010181 | FMN binding(GO:0010181) |
| 0.1 | 0.8 | GO:0022889 | L-serine transmembrane transporter activity(GO:0015194) serine transmembrane transporter activity(GO:0022889) |
| 0.1 | 0.2 | GO:0008384 | IkappaB kinase activity(GO:0008384) |
| 0.1 | 1.1 | GO:0008139 | nuclear localization sequence binding(GO:0008139) |
| 0.1 | 0.4 | GO:0070567 | cytidylyltransferase activity(GO:0070567) |
| 0.1 | 0.9 | GO:0016504 | peptidase activator activity(GO:0016504) |
| 0.1 | 0.7 | GO:0016248 | channel inhibitor activity(GO:0016248) |
| 0.1 | 0.3 | GO:0004719 | protein-L-isoaspartate (D-aspartate) O-methyltransferase activity(GO:0004719) |
| 0.1 | 1.7 | GO:0051020 | GTPase binding(GO:0051020) |
| 0.1 | 0.6 | GO:0005487 | nucleocytoplasmic transporter activity(GO:0005487) |
| 0.1 | 1.8 | GO:0045502 | dynein binding(GO:0045502) |
| 0.1 | 1.7 | GO:0042166 | acetylcholine binding(GO:0042166) |
| 0.1 | 0.3 | GO:0008131 | primary amine oxidase activity(GO:0008131) |
| 0.1 | 1.1 | GO:0051183 | vitamin transporter activity(GO:0051183) |
| 0.1 | 0.6 | GO:0008191 | metalloendopeptidase inhibitor activity(GO:0008191) |
| 0.1 | 12.4 | GO:0005096 | GTPase activator activity(GO:0005096) |
| 0.1 | 4.2 | GO:0008135 | translation factor activity, RNA binding(GO:0008135) |
| 0.1 | 2.0 | GO:0070063 | RNA polymerase binding(GO:0070063) |
| 0.1 | 0.5 | GO:0022820 | potassium:chloride symporter activity(GO:0015379) potassium ion symporter activity(GO:0022820) |
| 0.1 | 0.5 | GO:0046912 | transferase activity, transferring acyl groups, acyl groups converted into alkyl on transfer(GO:0046912) |
| 0.1 | 0.4 | GO:0052834 | inositol monophosphate 1-phosphatase activity(GO:0008934) inositol monophosphate 3-phosphatase activity(GO:0052832) inositol monophosphate 4-phosphatase activity(GO:0052833) inositol monophosphate phosphatase activity(GO:0052834) |
| 0.1 | 0.3 | GO:0004169 | dolichyl-phosphate-mannose-protein mannosyltransferase activity(GO:0004169) |
| 0.1 | 0.1 | GO:0016972 | flavin-linked sulfhydryl oxidase activity(GO:0016971) thiol oxidase activity(GO:0016972) |
| 0.1 | 1.1 | GO:0031435 | mitogen-activated protein kinase kinase kinase binding(GO:0031435) |
| 0.1 | 0.2 | GO:0008073 | ornithine decarboxylase inhibitor activity(GO:0008073) |
| 0.1 | 4.5 | GO:0047485 | protein N-terminus binding(GO:0047485) |
| 0.1 | 0.1 | GO:0098634 | protein binding involved in cell-matrix adhesion(GO:0098634) |
| 0.1 | 0.2 | GO:0005128 | erythropoietin receptor binding(GO:0005128) |
| 0.1 | 0.3 | GO:0003696 | satellite DNA binding(GO:0003696) |
| 0.1 | 7.0 | GO:0019902 | phosphatase binding(GO:0019902) |
| 0.1 | 3.2 | GO:0005201 | extracellular matrix structural constituent(GO:0005201) |
| 0.1 | 0.1 | GO:0008401 | retinoic acid 4-hydroxylase activity(GO:0008401) |
| 0.1 | 0.4 | GO:0004985 | opioid receptor activity(GO:0004985) |
| 0.1 | 0.4 | GO:0047035 | testosterone dehydrogenase (NAD+) activity(GO:0047035) |
| 0.1 | 0.9 | GO:0035173 | histone kinase activity(GO:0035173) |
| 0.1 | 1.8 | GO:0005385 | zinc ion transmembrane transporter activity(GO:0005385) |
| 0.1 | 0.1 | GO:0008905 | mannose-phosphate guanylyltransferase activity(GO:0008905) |
| 0.1 | 0.3 | GO:0061665 | SUMO ligase activity(GO:0061665) |
| 0.1 | 2.6 | GO:0019842 | vitamin binding(GO:0019842) |
| 0.1 | 1.0 | GO:0005545 | 1-phosphatidylinositol binding(GO:0005545) |
| 0.1 | 0.5 | GO:0003993 | acid phosphatase activity(GO:0003993) |
| 0.1 | 0.1 | GO:0003945 | N-acetyllactosamine synthase activity(GO:0003945) |
| 0.1 | 0.3 | GO:0022833 | mechanically-gated ion channel activity(GO:0008381) mechanically gated channel activity(GO:0022833) |
| 0.1 | 1.9 | GO:0019706 | protein-cysteine S-palmitoyltransferase activity(GO:0019706) |
| 0.1 | 0.2 | GO:0004704 | NF-kappaB-inducing kinase activity(GO:0004704) |
| 0.1 | 1.7 | GO:0005044 | scavenger receptor activity(GO:0005044) |
| 0.1 | 0.5 | GO:0018448 | pinocarveol dehydrogenase activity(GO:0018446) chloral hydrate dehydrogenase activity(GO:0018447) hydroxymethylmethylsilanediol oxidase activity(GO:0018448) 1-phenylethanol dehydrogenase activity(GO:0018449) myrtenol dehydrogenase activity(GO:0018450) cis-1,2-dihydroxy-1,2-dihydro-8-carboxynaphthalene dehydrogenase activity(GO:0034522) 3-hydroxy-4-methyloctanoyl-CoA dehydrogenase activity(GO:0034582) 2-hydroxy-4-isopropenylcyclohexane-1-carboxyl-CoA dehydrogenase activity(GO:0034778) cis-9,10-dihydroanthracene-9,10-diol dehydrogenase activity(GO:0034817) citronellol dehydrogenase activity(GO:0034821) naphthyl-2-hydroxymethyl-succinyl-CoA dehydrogenase activity(GO:0034847) 2,4,4-trimethyl-1-pentanol dehydrogenase activity(GO:0034863) 2,4,4-trimethyl-3-hydroxypentanoyl-CoA dehydrogenase activity(GO:0034868) 1-hydroxy-4,4-dimethylpentan-3-one dehydrogenase activity(GO:0034871) endosulfan diol dehydrogenase activity(GO:0034891) endosulfan hydroxyether dehydrogenase activity(GO:0034901) 3-hydroxy-2-methylhexanoyl-CoA dehydrogenase activity(GO:0034918) 3-hydroxy-2,6-dimethyl-5-methylene-heptanoyl-CoA dehydrogenase activity(GO:0034944) versicolorin reductase activity(GO:0042469) ketoreductase activity(GO:0045703) |
| 0.1 | 1.2 | GO:0008252 | nucleotidase activity(GO:0008252) |
| 0.1 | 0.3 | GO:0004090 | carbonyl reductase (NADPH) activity(GO:0004090) |
| 0.1 | 0.6 | GO:0004143 | diacylglycerol kinase activity(GO:0004143) |
| 0.1 | 2.1 | GO:0005507 | copper ion binding(GO:0005507) |
| 0.1 | 0.3 | GO:0045134 | uridine-diphosphatase activity(GO:0045134) |
| 0.1 | 0.3 | GO:0071987 | WD40-repeat domain binding(GO:0071987) |
| 0.1 | 0.5 | GO:0042162 | telomeric DNA binding(GO:0042162) |
| 0.1 | 0.3 | GO:0070996 | type 1 melanocortin receptor binding(GO:0070996) |
| 0.1 | 2.6 | GO:0005496 | steroid binding(GO:0005496) |
| 0.1 | 1.4 | GO:0004181 | metallocarboxypeptidase activity(GO:0004181) |
| 0.1 | 1.2 | GO:0004745 | retinol dehydrogenase activity(GO:0004745) |
| 0.1 | 0.3 | GO:0070061 | fructose binding(GO:0070061) |
| 0.1 | 0.7 | GO:0044183 | protein binding involved in protein folding(GO:0044183) |
| 0.1 | 1.6 | GO:0004129 | cytochrome-c oxidase activity(GO:0004129) heme-copper terminal oxidase activity(GO:0015002) oxidoreductase activity, acting on a heme group of donors(GO:0016675) oxidoreductase activity, acting on a heme group of donors, oxygen as acceptor(GO:0016676) |
| 0.1 | 1.6 | GO:0004033 | aldo-keto reductase (NADP) activity(GO:0004033) |
| 0.1 | 0.2 | GO:0043560 | insulin receptor substrate binding(GO:0043560) |
| 0.1 | 0.3 | GO:0008526 | phosphatidylinositol transporter activity(GO:0008526) |
| 0.1 | 0.9 | GO:0005243 | gap junction channel activity(GO:0005243) |
| 0.1 | 0.2 | GO:0017153 | sodium:dicarboxylate symporter activity(GO:0017153) |
| 0.1 | 0.7 | GO:0051879 | Hsp90 protein binding(GO:0051879) |
| 0.1 | 0.3 | GO:0032051 | clathrin light chain binding(GO:0032051) |
| 0.1 | 0.8 | GO:0018720 | cobinamide kinase activity(GO:0008819) phytol kinase activity(GO:0010276) phenol kinase activity(GO:0018720) cyclin-dependent protein kinase activating kinase regulator activity(GO:0019914) inositol tetrakisphosphate 2-kinase activity(GO:0032942) heptose 7-phosphate kinase activity(GO:0033785) aminoglycoside phosphotransferase activity(GO:0034071) eukaryotic elongation factor-2 kinase regulator activity(GO:0042556) eukaryotic elongation factor-2 kinase activator activity(GO:0042557) LPPG:FO 2-phospho-L-lactate transferase activity(GO:0043743) cytidine kinase activity(GO:0043771) glycerate 2-kinase activity(GO:0043798) (S)-lactate 2-kinase activity(GO:0043841) phosphoserine:homoserine phosphotransferase activity(GO:0043899) L-seryl-tRNA(Sec) kinase activity(GO:0043915) phosphocholine transferase activity(GO:0044605) GTP-dependent polynucleotide kinase activity(GO:0051735) farnesol kinase activity(GO:0052668) CTP:2-trans,-6-trans-farnesol kinase activity(GO:0052669) geraniol kinase activity(GO:0052670) geranylgeraniol kinase activity(GO:0052671) CTP:geranylgeraniol kinase activity(GO:0052672) prenol kinase activity(GO:0052673) 1-phosphatidylinositol-5-kinase activity(GO:0052810) 1-phosphatidylinositol-3-phosphate 4-kinase activity(GO:0052811) phosphatidylinositol-3,4-bisphosphate 5-kinase activity(GO:0052812) inositol-3,4,6-trisphosphate 1-kinase activity(GO:0052835) inositol 5-diphosphate pentakisphosphate 5-kinase activity(GO:0052836) inositol diphosphate tetrakisphosphate kinase activity(GO:0052839) |
| 0.1 | 0.1 | GO:0016443 | bidentate ribonuclease III activity(GO:0016443) |
| 0.1 | 0.1 | GO:1901612 | cardiolipin binding(GO:1901612) |
| 0.1 | 0.5 | GO:0050291 | sphingosine N-acyltransferase activity(GO:0050291) |
| 0.1 | 0.2 | GO:0043515 | kinetochore binding(GO:0043515) |
| 0.1 | 0.3 | GO:0005522 | profilin binding(GO:0005522) |
| 0.1 | 0.4 | GO:0051371 | muscle alpha-actinin binding(GO:0051371) |
| 0.1 | 1.1 | GO:0001594 | trace-amine receptor activity(GO:0001594) |
| 0.1 | 0.1 | GO:0003964 | telomerase activity(GO:0003720) RNA-directed DNA polymerase activity(GO:0003964) |
| 0.1 | 1.1 | GO:0004653 | polypeptide N-acetylgalactosaminyltransferase activity(GO:0004653) |
| 0.1 | 0.2 | GO:0005157 | macrophage colony-stimulating factor receptor binding(GO:0005157) |
| 0.1 | 1.2 | GO:0004527 | exonuclease activity(GO:0004527) |
| 0.1 | 0.1 | GO:0004591 | oxoglutarate dehydrogenase (succinyl-transferring) activity(GO:0004591) |
| 0.1 | 0.9 | GO:0001848 | complement binding(GO:0001848) |
| 0.1 | 1.3 | GO:0004712 | protein serine/threonine/tyrosine kinase activity(GO:0004712) |
| 0.1 | 0.5 | GO:0030898 | actin-dependent ATPase activity(GO:0030898) |
| 0.1 | 3.0 | GO:0003705 | transcription factor activity, RNA polymerase II distal enhancer sequence-specific binding(GO:0003705) |
| 0.1 | 0.3 | GO:0050780 | dopamine receptor binding(GO:0050780) |
| 0.1 | 0.2 | GO:0019215 | intermediate filament binding(GO:0019215) |
| 0.1 | 0.1 | GO:0055131 | C3HC4-type RING finger domain binding(GO:0055131) |
| 0.1 | 0.7 | GO:0070064 | proline-rich region binding(GO:0070064) |
| 0.1 | 0.1 | GO:0016408 | C-acyltransferase activity(GO:0016408) |
| 0.1 | 2.0 | GO:0019209 | kinase activator activity(GO:0019209) |
| 0.1 | 0.6 | GO:0046977 | TAP binding(GO:0046977) |
| 0.1 | 0.1 | GO:0004741 | [pyruvate dehydrogenase (lipoamide)] phosphatase activity(GO:0004741) |
| 0.1 | 2.4 | GO:0032182 | ubiquitin-like protein binding(GO:0032182) |
| 0.1 | 0.1 | GO:0016670 | oxidoreductase activity, acting on a sulfur group of donors, oxygen as acceptor(GO:0016670) |
| 0.1 | 0.1 | GO:0015215 | nucleotide transmembrane transporter activity(GO:0015215) |
| 0.1 | 0.4 | GO:0048038 | quinone binding(GO:0048038) |
| 0.1 | 0.2 | GO:0031432 | titin binding(GO:0031432) |
| 0.1 | 0.6 | GO:0031559 | oxidosqualene cyclase activity(GO:0031559) |
| 0.1 | 0.8 | GO:0004709 | MAP kinase kinase kinase activity(GO:0004709) |
| 0.1 | 0.2 | GO:0008432 | JUN kinase binding(GO:0008432) |
| 0.1 | 0.1 | GO:0097617 | annealing activity(GO:0097617) |
| 0.1 | 0.2 | GO:0008486 | diphosphoinositol-polyphosphate diphosphatase activity(GO:0008486) |
| 0.1 | 0.3 | GO:0004994 | somatostatin receptor activity(GO:0004994) |
| 0.1 | 8.6 | GO:0061659 | ubiquitin-like protein ligase activity(GO:0061659) |
| 0.1 | 0.2 | GO:0005384 | manganese ion transmembrane transporter activity(GO:0005384) |
| 0.1 | 0.1 | GO:0045182 | translation regulator activity(GO:0045182) |
| 0.1 | 0.8 | GO:0005528 | macrolide binding(GO:0005527) FK506 binding(GO:0005528) |
| 0.1 | 0.3 | GO:0017040 | ceramidase activity(GO:0017040) |
| 0.1 | 0.4 | GO:0016813 | hydrolase activity, acting on carbon-nitrogen (but not peptide) bonds, in linear amidines(GO:0016813) |
| 0.1 | 0.3 | GO:0004974 | leukotriene receptor activity(GO:0004974) |
| 0.1 | 0.3 | GO:0004439 | phosphatidylinositol-4,5-bisphosphate 5-phosphatase activity(GO:0004439) |
| 0.1 | 0.6 | GO:0017025 | TBP-class protein binding(GO:0017025) |
| 0.1 | 0.2 | GO:0070513 | death domain binding(GO:0070513) |
| 0.1 | 0.1 | GO:0004716 | receptor signaling protein tyrosine kinase activity(GO:0004716) |
| 0.1 | 0.4 | GO:0003796 | lysozyme activity(GO:0003796) |
| 0.1 | 0.1 | GO:0070051 | fibrinogen binding(GO:0070051) |
| 0.1 | 3.9 | GO:0036459 | thiol-dependent ubiquitinyl hydrolase activity(GO:0036459) ubiquitinyl hydrolase activity(GO:0101005) |
| 0.1 | 0.7 | GO:0046703 | natural killer cell lectin-like receptor binding(GO:0046703) |
| 0.1 | 0.5 | GO:0008601 | protein phosphatase type 2A regulator activity(GO:0008601) |
| 0.1 | 0.2 | GO:0070891 | lipoteichoic acid binding(GO:0070891) |
| 0.1 | 0.1 | GO:0003916 | DNA topoisomerase activity(GO:0003916) |
| 0.1 | 0.2 | GO:0000213 | tRNA-intron endonuclease activity(GO:0000213) |
| 0.1 | 0.9 | GO:0004198 | calcium-dependent cysteine-type endopeptidase activity(GO:0004198) |
| 0.1 | 0.8 | GO:0015106 | bicarbonate transmembrane transporter activity(GO:0015106) |
| 0.1 | 0.9 | GO:0005031 | tumor necrosis factor-activated receptor activity(GO:0005031) death receptor activity(GO:0005035) |
| 0.1 | 0.2 | GO:0000309 | nicotinamide-nucleotide adenylyltransferase activity(GO:0000309) nicotinate-nucleotide adenylyltransferase activity(GO:0004515) |
| 0.1 | 1.5 | GO:0005484 | SNAP receptor activity(GO:0005484) |
| 0.1 | 0.2 | GO:1990254 | keratin filament binding(GO:1990254) |
| 0.1 | 4.2 | GO:0004386 | helicase activity(GO:0004386) |
| 0.1 | 0.1 | GO:0004889 | acetylcholine-activated cation-selective channel activity(GO:0004889) |
| 0.1 | 0.7 | GO:0031489 | myosin V binding(GO:0031489) |
| 0.1 | 1.0 | GO:0052866 | phosphatidylinositol phosphate phosphatase activity(GO:0052866) |
| 0.1 | 0.2 | GO:0001135 | transcription factor activity, RNA polymerase II transcription factor recruiting(GO:0001135) |
| 0.1 | 0.2 | GO:0043199 | sulfate binding(GO:0043199) |
| 0.1 | 1.6 | GO:0030170 | pyridoxal phosphate binding(GO:0030170) |
| 0.1 | 0.2 | GO:0044020 | histone methyltransferase activity (H4-R3 specific)(GO:0044020) |
| 0.1 | 1.3 | GO:0097110 | scaffold protein binding(GO:0097110) |
| 0.1 | 0.2 | GO:0019770 | IgG receptor activity(GO:0019770) |
| 0.1 | 1.2 | GO:0005212 | structural constituent of eye lens(GO:0005212) |
| 0.1 | 0.5 | GO:0001055 | RNA polymerase II activity(GO:0001055) |
| 0.1 | 0.3 | GO:0001054 | RNA polymerase I activity(GO:0001054) |
| 0.1 | 0.8 | GO:0005149 | interleukin-1 receptor binding(GO:0005149) |
| 0.1 | 0.4 | GO:0042288 | MHC class I protein binding(GO:0042288) |
| 0.1 | 0.3 | GO:0034237 | protein kinase A regulatory subunit binding(GO:0034237) |
| 0.1 | 0.2 | GO:0018812 | 3-hydroxyacyl-CoA dehydratase activity(GO:0018812) 3-hydroxy-behenoyl-CoA dehydratase activity(GO:0102344) 3-hydroxy-lignoceroyl-CoA dehydratase activity(GO:0102345) |
| 0.1 | 0.2 | GO:0004945 | angiotensin type II receptor activity(GO:0004945) |
| 0.1 | 0.2 | GO:0031996 | thioesterase binding(GO:0031996) |
| 0.1 | 0.2 | GO:0042284 | sphingolipid delta-4 desaturase activity(GO:0042284) |
| 0.1 | 0.2 | GO:0004829 | threonine-tRNA ligase activity(GO:0004829) |
| 0.1 | 0.1 | GO:0019206 | nucleoside kinase activity(GO:0019206) |
| 0.1 | 0.2 | GO:0004127 | cytidylate kinase activity(GO:0004127) |
| 0.1 | 0.1 | GO:0001591 | dopamine neurotransmitter receptor activity, coupled via Gi/Go(GO:0001591) |
| 0.1 | 0.5 | GO:0004535 | poly(A)-specific ribonuclease activity(GO:0004535) |
| 0.0 | 0.7 | GO:0015095 | magnesium ion transmembrane transporter activity(GO:0015095) |
| 0.0 | 0.1 | GO:0047961 | glycine N-acyltransferase activity(GO:0047961) |
| 0.0 | 0.1 | GO:0003831 | beta-N-acetylglucosaminylglycopeptide beta-1,4-galactosyltransferase activity(GO:0003831) |
| 0.0 | 0.2 | GO:0001972 | retinoic acid binding(GO:0001972) |
| 0.0 | 0.1 | GO:0032050 | clathrin heavy chain binding(GO:0032050) |
| 0.0 | 1.2 | GO:0003923 | GPI-anchor transamidase activity(GO:0003923) |
| 0.0 | 0.2 | GO:0001515 | opioid peptide activity(GO:0001515) |
| 0.0 | 0.8 | GO:0005506 | iron ion binding(GO:0005506) |
| 0.0 | 0.2 | GO:0036122 | BMP binding(GO:0036122) |
| 0.0 | 0.1 | GO:0005501 | retinoid binding(GO:0005501) |
| 0.0 | 0.3 | GO:0016889 | endodeoxyribonuclease activity, producing 3'-phosphomonoesters(GO:0016889) |
| 0.0 | 0.1 | GO:0034511 | U3 snoRNA binding(GO:0034511) |
| 0.0 | 0.1 | GO:0010997 | anaphase-promoting complex binding(GO:0010997) |
| 0.0 | 0.5 | GO:0008519 | ammonium transmembrane transporter activity(GO:0008519) |
| 0.0 | 0.2 | GO:0019957 | C-C chemokine binding(GO:0019957) |
| 0.0 | 4.0 | GO:0005125 | cytokine activity(GO:0005125) |
| 0.0 | 0.4 | GO:0070577 | lysine-acetylated histone binding(GO:0070577) |
| 0.0 | 0.1 | GO:0004046 | aminoacylase activity(GO:0004046) |
| 0.0 | 0.1 | GO:0005143 | interleukin-12 receptor binding(GO:0005143) |
| 0.0 | 0.1 | GO:0003876 | AMP deaminase activity(GO:0003876) adenosine-phosphate deaminase activity(GO:0047623) |
| 0.0 | 0.1 | GO:0008301 | DNA binding, bending(GO:0008301) |
| 0.0 | 0.2 | GO:0097153 | cysteine-type endopeptidase activity involved in apoptotic process(GO:0097153) |
| 0.0 | 3.5 | GO:0000287 | magnesium ion binding(GO:0000287) |
| 0.0 | 0.2 | GO:0051861 | glycolipid binding(GO:0051861) |
| 0.0 | 0.1 | GO:0010861 | thyroid hormone receptor activator activity(GO:0010861) |
| 0.0 | 0.1 | GO:0043262 | adenosine-diphosphatase activity(GO:0043262) |
| 0.0 | 0.1 | GO:0070052 | collagen V binding(GO:0070052) |
| 0.0 | 0.1 | GO:0072345 | NAADP-sensitive calcium-release channel activity(GO:0072345) |
| 0.0 | 0.5 | GO:0045296 | cadherin binding(GO:0045296) |
| 0.0 | 0.3 | GO:0030695 | GTPase regulator activity(GO:0030695) |
| 0.0 | 0.3 | GO:0019200 | carbohydrate kinase activity(GO:0019200) |
| 0.0 | 0.0 | GO:0001846 | opsonin binding(GO:0001846) |
| 0.0 | 0.1 | GO:0015252 | hydrogen ion channel activity(GO:0015252) |
| 0.0 | 0.9 | GO:0004623 | phospholipase A2 activity(GO:0004623) |
| 0.0 | 0.1 | GO:0016894 | endonuclease activity, active with either ribo- or deoxyribonucleic acids and producing 3'-phosphomonoesters(GO:0016894) |
| 0.0 | 0.1 | GO:0004920 | interleukin-10 receptor activity(GO:0004920) |
| 0.0 | 0.6 | GO:0016209 | antioxidant activity(GO:0016209) |
| 0.0 | 0.0 | GO:0035650 | AP-1 adaptor complex binding(GO:0035650) |
| 0.0 | 0.5 | GO:0001056 | RNA polymerase III activity(GO:0001056) |
| 0.0 | 0.2 | GO:0046972 | histone acetyltransferase activity (H4-K5 specific)(GO:0043995) histone acetyltransferase activity (H4-K8 specific)(GO:0043996) histone acetyltransferase activity (H4-K16 specific)(GO:0046972) |
| 0.0 | 0.1 | GO:0008898 | S-adenosylmethionine-homocysteine S-methyltransferase activity(GO:0008898) |
| 0.0 | 0.0 | GO:0004793 | threonine aldolase activity(GO:0004793) L-allo-threonine aldolase activity(GO:0008732) |
| 0.0 | 0.1 | GO:0004365 | glyceraldehyde-3-phosphate dehydrogenase (NAD+) (phosphorylating) activity(GO:0004365) glyceraldehyde-3-phosphate dehydrogenase (NAD(P)+) (phosphorylating) activity(GO:0043891) |
| 0.0 | 0.1 | GO:0019961 | interferon binding(GO:0019961) |
| 0.0 | 0.1 | GO:0005021 | vascular endothelial growth factor-activated receptor activity(GO:0005021) |
| 0.0 | 1.6 | GO:0008565 | protein transporter activity(GO:0008565) |
| 0.0 | 0.6 | GO:0004089 | carbonate dehydratase activity(GO:0004089) |
| 0.0 | 0.1 | GO:0004800 | thyroxine 5'-deiodinase activity(GO:0004800) |
| 0.0 | 0.0 | GO:0052813 | phosphatidylinositol bisphosphate kinase activity(GO:0052813) |
| 0.0 | 0.5 | GO:0016864 | protein disulfide isomerase activity(GO:0003756) intramolecular oxidoreductase activity, transposing S-S bonds(GO:0016864) |
| 0.0 | 0.2 | GO:0004415 | hyalurononglucosaminidase activity(GO:0004415) |
| 0.0 | 0.3 | GO:0019203 | carbohydrate phosphatase activity(GO:0019203) |
| 0.0 | 0.1 | GO:0008179 | adenylate cyclase binding(GO:0008179) |
| 0.0 | 0.5 | GO:0043395 | heparan sulfate proteoglycan binding(GO:0043395) |
| 0.0 | 0.2 | GO:0003847 | 1-alkyl-2-acetylglycerophosphocholine esterase activity(GO:0003847) |
| 0.0 | 0.1 | GO:0004703 | G-protein coupled receptor kinase activity(GO:0004703) |
| 0.0 | 1.4 | GO:0005518 | collagen binding(GO:0005518) |
| 0.0 | 0.3 | GO:0030742 | GTP-dependent protein binding(GO:0030742) |
| 0.0 | 0.2 | GO:0015189 | arginine transmembrane transporter activity(GO:0015181) L-lysine transmembrane transporter activity(GO:0015189) |
| 0.0 | 0.2 | GO:0042015 | interleukin-20 binding(GO:0042015) |
| 0.0 | 0.1 | GO:0003906 | DNA-(apurinic or apyrimidinic site) lyase activity(GO:0003906) |
| 0.0 | 0.1 | GO:0008147 | structural constituent of bone(GO:0008147) |
| 0.0 | 0.1 | GO:0019863 | IgE binding(GO:0019863) |
| 0.0 | 0.6 | GO:0008137 | NADH dehydrogenase (ubiquinone) activity(GO:0008137) NADH dehydrogenase (quinone) activity(GO:0050136) |
| 0.0 | 0.1 | GO:0048407 | platelet-derived growth factor binding(GO:0048407) |
| 0.0 | 0.8 | GO:0042605 | peptide antigen binding(GO:0042605) |
| 0.0 | 1.7 | GO:0015171 | amino acid transmembrane transporter activity(GO:0015171) |
| 0.0 | 0.1 | GO:0016888 | endodeoxyribonuclease activity, producing 5'-phosphomonoesters(GO:0016888) |
| 0.0 | 0.1 | GO:0015368 | calcium:cation antiporter activity(GO:0015368) |
| 0.0 | 0.1 | GO:0005519 | cytoskeletal regulatory protein binding(GO:0005519) |
| 0.0 | 1.4 | GO:0008527 | taste receptor activity(GO:0008527) |
| 0.0 | 0.6 | GO:0001614 | purinergic nucleotide receptor activity(GO:0001614) nucleotide receptor activity(GO:0016502) |
| 0.0 | 0.1 | GO:0030628 | pre-mRNA 3'-splice site binding(GO:0030628) |
| 0.0 | 1.3 | GO:0004702 | receptor signaling protein serine/threonine kinase activity(GO:0004702) |
| 0.0 | 0.7 | GO:0005109 | frizzled binding(GO:0005109) |
| 0.0 | 0.4 | GO:0004364 | glutathione transferase activity(GO:0004364) |
| 0.0 | 0.1 | GO:0016868 | intramolecular transferase activity, phosphotransferases(GO:0016868) |
| 0.0 | 0.0 | GO:0019966 | interleukin-1 binding(GO:0019966) |
| 0.0 | 0.9 | GO:0008138 | protein tyrosine/serine/threonine phosphatase activity(GO:0008138) |
| 0.0 | 0.1 | GO:0004083 | bisphosphoglycerate mutase activity(GO:0004082) bisphosphoglycerate 2-phosphatase activity(GO:0004083) phosphoglycerate mutase activity(GO:0004619) bisphosphoglycerate phosphatase activity(GO:0034416) 2,3-bisphosphoglycerate-dependent phosphoglycerate mutase activity(GO:0046538) |
| 0.0 | 0.2 | GO:0001618 | virus receptor activity(GO:0001618) |
| 0.0 | 0.1 | GO:0004690 | cyclic nucleotide-dependent protein kinase activity(GO:0004690) |
| 0.0 | 0.1 | GO:0047276 | N-acetyllactosaminide 3-alpha-galactosyltransferase activity(GO:0047276) |
| 0.0 | 0.1 | GO:0004949 | cannabinoid receptor activity(GO:0004949) |
| 0.0 | 0.0 | GO:0070697 | activin receptor binding(GO:0070697) type II activin receptor binding(GO:0070699) |
| 0.0 | 24.0 | GO:0003723 | RNA binding(GO:0003723) |
| 0.0 | 0.1 | GO:0001595 | angiotensin receptor activity(GO:0001595) |
| 0.0 | 0.0 | GO:0048185 | activin binding(GO:0048185) |
| 0.0 | 0.1 | GO:0003846 | 2-acylglycerol O-acyltransferase activity(GO:0003846) |
| 0.0 | 0.6 | GO:0017022 | myosin binding(GO:0017022) |
| 0.0 | 0.9 | GO:0004540 | ribonuclease activity(GO:0004540) |
| 0.0 | 0.0 | GO:0008413 | 8-oxo-7,8-dihydroguanosine triphosphate pyrophosphatase activity(GO:0008413) |
| 0.0 | 0.1 | GO:0043422 | protein kinase B binding(GO:0043422) |
| 0.0 | 0.1 | GO:0016832 | aldehyde-lyase activity(GO:0016832) |
| 0.0 | 0.1 | GO:0005105 | type 1 fibroblast growth factor receptor binding(GO:0005105) |
| 0.0 | 0.1 | GO:0004748 | ribonucleoside-diphosphate reductase activity, thioredoxin disulfide as acceptor(GO:0004748) oxidoreductase activity, acting on CH or CH2 groups, disulfide as acceptor(GO:0016728) ribonucleoside-diphosphate reductase activity(GO:0061731) |
| 0.0 | 0.5 | GO:0035591 | signaling adaptor activity(GO:0035591) |
| 0.0 | 0.3 | GO:0051539 | 4 iron, 4 sulfur cluster binding(GO:0051539) |
| 0.0 | 0.1 | GO:0033265 | choline binding(GO:0033265) |
| 0.0 | 0.1 | GO:0070137 | ubiquitin-like protein-specific endopeptidase activity(GO:0070137) SUMO-specific endopeptidase activity(GO:0070139) |
| 0.0 | 0.0 | GO:0015248 | sterol transporter activity(GO:0015248) |
| 0.0 | 0.0 | GO:0016778 | diphosphotransferase activity(GO:0016778) |
| 0.0 | 0.2 | GO:0004767 | sphingomyelin phosphodiesterase activity(GO:0004767) |
| 0.0 | 0.0 | GO:0016655 | oxidoreductase activity, acting on NAD(P)H, quinone or similar compound as acceptor(GO:0016655) |
| 0.0 | 0.1 | GO:0005536 | glucose binding(GO:0005536) |
| 0.0 | 0.1 | GO:0001609 | G-protein coupled adenosine receptor activity(GO:0001609) |
| 0.0 | 0.1 | GO:0015111 | iodide transmembrane transporter activity(GO:0015111) |
| 0.0 | 0.0 | GO:0051021 | GDP-dissociation inhibitor binding(GO:0051021) |
| 0.0 | 0.2 | GO:0008568 | microtubule-severing ATPase activity(GO:0008568) |
| 0.0 | 0.1 | GO:0016742 | hydroxymethyl-, formyl- and related transferase activity(GO:0016742) |
| 0.0 | 0.1 | GO:0019992 | diacylglycerol binding(GO:0019992) |
| 0.0 | 0.1 | GO:0030291 | protein serine/threonine kinase inhibitor activity(GO:0030291) |
| 0.0 | 0.0 | GO:0004045 | aminoacyl-tRNA hydrolase activity(GO:0004045) |
| 0.0 | 0.0 | GO:0000182 | rDNA binding(GO:0000182) |
| 0.0 | 0.0 | GO:0070403 | NAD+ binding(GO:0070403) |
| 0.0 | 0.5 | GO:0019107 | myristoyltransferase activity(GO:0019107) |
| 0.0 | 0.1 | GO:0046404 | ATP-dependent polydeoxyribonucleotide 5'-hydroxyl-kinase activity(GO:0046404) polydeoxyribonucleotide kinase activity(GO:0051733) |
| 0.0 | 0.0 | GO:0003708 | retinoic acid receptor activity(GO:0003708) |
| 0.0 | 0.0 | GO:0031779 | melanocortin receptor binding(GO:0031779) type 3 melanocortin receptor binding(GO:0031781) type 4 melanocortin receptor binding(GO:0031782) |
| 0.0 | 0.0 | GO:0016668 | oxidoreductase activity, acting on a sulfur group of donors, NAD(P) as acceptor(GO:0016668) |
| 0.0 | 0.3 | GO:0005537 | mannose binding(GO:0005537) |
| 0.0 | 0.0 | GO:0004814 | arginine-tRNA ligase activity(GO:0004814) |
| 0.0 | 0.0 | GO:0015137 | citrate transmembrane transporter activity(GO:0015137) tricarboxylic acid transmembrane transporter activity(GO:0015142) |
| 0.0 | 0.1 | GO:0005223 | intracellular cGMP activated cation channel activity(GO:0005223) |
| 0.0 | 0.2 | GO:0005247 | voltage-gated chloride channel activity(GO:0005247) |
| 0.0 | 0.0 | GO:0030546 | receptor activator activity(GO:0030546) |
| 0.0 | 0.1 | GO:0070182 | DNA polymerase binding(GO:0070182) |
| 0.0 | 0.1 | GO:0050567 | glutaminyl-tRNA synthase (glutamine-hydrolyzing) activity(GO:0050567) |
| 0.0 | 0.3 | GO:0034061 | DNA-directed DNA polymerase activity(GO:0003887) DNA polymerase activity(GO:0034061) |
| 0.0 | 0.0 | GO:0004969 | histamine receptor activity(GO:0004969) |
| 0.0 | 0.0 | GO:0032190 | acrosin binding(GO:0032190) |
| 0.0 | 0.1 | GO:0004028 | 3-chloroallyl aldehyde dehydrogenase activity(GO:0004028) |
| 0.0 | 0.1 | GO:0004488 | methylenetetrahydrofolate dehydrogenase (NADP+) activity(GO:0004488) |
| 0.0 | 0.1 | GO:0005540 | hyaluronic acid binding(GO:0005540) |
| 0.0 | 0.1 | GO:0086008 | voltage-gated potassium channel activity involved in cardiac muscle cell action potential repolarization(GO:0086008) |
| 0.0 | 21.4 | GO:0004984 | olfactory receptor activity(GO:0004984) |
| 0.0 | 0.2 | GO:0016876 | aminoacyl-tRNA ligase activity(GO:0004812) ligase activity, forming carbon-oxygen bonds(GO:0016875) ligase activity, forming aminoacyl-tRNA and related compounds(GO:0016876) |
| 0.0 | 0.2 | GO:0042056 | chemoattractant activity(GO:0042056) |
| 0.0 | 0.0 | GO:0015377 | cation:chloride symporter activity(GO:0015377) |
| 0.0 | 0.5 | GO:0042393 | histone binding(GO:0042393) |
| 0.0 | 0.0 | GO:0000400 | four-way junction DNA binding(GO:0000400) |
| 0.0 | 0.1 | GO:0008140 | cAMP response element binding protein binding(GO:0008140) |
| 0.0 | 0.1 | GO:0051431 | corticotropin-releasing hormone receptor 2 binding(GO:0051431) |
| 0.0 | 0.0 | GO:0047631 | ADP-ribose diphosphatase activity(GO:0047631) |
| 0.0 | 0.0 | GO:0051379 | epinephrine binding(GO:0051379) |
| 0.0 | 0.0 | GO:0046935 | 1-phosphatidylinositol-3-kinase regulator activity(GO:0046935) |
| 0.0 | 0.1 | GO:0060590 | ATPase regulator activity(GO:0060590) |
| 0.0 | 0.0 | GO:0008332 | low voltage-gated calcium channel activity(GO:0008332) |
| 0.0 | 0.0 | GO:0004887 | thyroid hormone receptor activity(GO:0004887) |
| 0.0 | 0.0 | GO:0034547 | GTP cyclohydrolase activity(GO:0003933) tRNA-specific adenosine deaminase activity(GO:0008251) N-cyclopropylmelamine deaminase activity(GO:0034547) N-cyclopropylammeline deaminase activity(GO:0034548) N-cyclopropylammelide alkylamino hydrolase activity(GO:0034549) 2,5-diamino-6-ribitylamino-4(3H)-pyrimidinone 5'-phosphate deaminase activity(GO:0043723) tRNA-specific adenosine-37 deaminase activity(GO:0043829) archaeal-specific GTP cyclohydrolase activity(GO:0044682) tRNA-specific adenosine-34 deaminase activity(GO:0052717) |
| 0.0 | 0.1 | GO:0016493 | C-C chemokine receptor activity(GO:0016493) |
| 0.0 | 0.4 | GO:0050253 | retinyl-palmitate esterase activity(GO:0050253) |
| 0.0 | 0.1 | GO:0004180 | carboxypeptidase activity(GO:0004180) |
| 0.0 | 0.0 | GO:0015238 | drug transmembrane transporter activity(GO:0015238) |
| 0.0 | 0.0 | GO:0042289 | MHC class II protein binding(GO:0042289) |
| 0.0 | 0.2 | GO:0042923 | neuropeptide binding(GO:0042923) |
| 0.0 | 0.1 | GO:0008429 | phosphatidylethanolamine binding(GO:0008429) |
| 0.0 | 0.0 | GO:0031491 | nucleosome binding(GO:0031491) |
| 0.0 | 0.0 | GO:0051213 | dioxygenase activity(GO:0051213) |
| 0.0 | 0.0 | GO:0004711 | ribosomal protein S6 kinase activity(GO:0004711) |
| 0.0 | 0.0 | GO:0004385 | guanylate kinase activity(GO:0004385) |
| 0.0 | 0.0 | GO:0046624 | sphingolipid transporter activity(GO:0046624) |
| 0.0 | 0.1 | GO:0004457 | lactate dehydrogenase activity(GO:0004457) |
| 0.0 | 0.1 | GO:0015464 | acetylcholine receptor activity(GO:0015464) |
| 0.0 | 1.1 | GO:0005550 | pheromone binding(GO:0005550) |
| 0.0 | 0.0 | GO:0030955 | potassium ion binding(GO:0030955) |
| 0.0 | 0.0 | GO:0016751 | S-succinyltransferase activity(GO:0016751) |
| 0.0 | 0.0 | GO:0097602 | cullin family protein binding(GO:0097602) |
| 0.0 | 0.0 | GO:0004971 | AMPA glutamate receptor activity(GO:0004971) |
| 0.0 | 0.0 | GO:0001163 | RNA polymerase I regulatory region DNA binding(GO:0001013) RNA polymerase I regulatory region sequence-specific DNA binding(GO:0001163) RNA polymerase I CORE element sequence-specific DNA binding(GO:0001164) |
Gene overrepresentation in curated gene sets: canonical pathways category:
| Log-likelihood per target | Total log-likelihood | Term | Description |
|---|---|---|---|
| 0.9 | 38.5 | PID HNF3B PATHWAY | FOXA2 and FOXA3 transcription factor networks |
| 0.5 | 16.1 | ST P38 MAPK PATHWAY | p38 MAPK Pathway |
| 0.4 | 1.6 | PID RHOA PATHWAY | RhoA signaling pathway |
| 0.4 | 9.9 | PID BARD1 PATHWAY | BARD1 signaling events |
| 0.3 | 2.7 | ST TYPE I INTERFERON PATHWAY | Type I Interferon (alpha/beta IFN) Pathway |
| 0.3 | 8.5 | PID P38 ALPHA BETA DOWNSTREAM PATHWAY | Signaling mediated by p38-alpha and p38-beta |
| 0.3 | 0.8 | ST STAT3 PATHWAY | STAT3 Pathway |
| 0.3 | 9.5 | SIG PIP3 SIGNALING IN B LYMPHOCYTES | Genes related to PIP3 signaling in B lymphocytes |
| 0.3 | 5.9 | PID IL8 CXCR1 PATHWAY | IL8- and CXCR1-mediated signaling events |
| 0.3 | 0.8 | PID NECTIN PATHWAY | Nectin adhesion pathway |
| 0.3 | 16.0 | PID P73PATHWAY | p73 transcription factor network |
| 0.3 | 15.9 | PID CMYB PATHWAY | C-MYB transcription factor network |
| 0.3 | 6.3 | PID IGF1 PATHWAY | IGF1 pathway |
| 0.2 | 0.7 | SA REG CASCADE OF CYCLIN EXPR | Expression of cyclins regulates progression through the cell cycle by activating cyclin-dependent kinases. |
| 0.2 | 1.0 | ST DIFFERENTIATION PATHWAY IN PC12 CELLS | Differentiation Pathway in PC12 Cells; this is a specific case of PAC1 Receptor Pathway. |
| 0.2 | 0.2 | SA B CELL RECEPTOR COMPLEXES | Antigen binding to B cell receptors activates protein tyrosine kinases, such as the Src family, which ultimate activate MAP kinases. |
| 0.2 | 4.0 | PID EPO PATHWAY | EPO signaling pathway |
| 0.2 | 3.9 | PID AR TF PATHWAY | Regulation of Androgen receptor activity |
| 0.2 | 10.0 | PID MYC REPRESS PATHWAY | Validated targets of C-MYC transcriptional repression |
| 0.2 | 1.4 | PID PI3K PLC TRK PATHWAY | Trk receptor signaling mediated by PI3K and PLC-gamma |
| 0.2 | 2.4 | PID ALK2 PATHWAY | ALK2 signaling events |
| 0.2 | 9.7 | PID CASPASE PATHWAY | Caspase cascade in apoptosis |
| 0.2 | 1.0 | SA G2 AND M PHASES | Cdc25 activates the cdc2/cyclin B complex to induce the G2/M transition. |
| 0.2 | 1.0 | ST JNK MAPK PATHWAY | JNK MAPK Pathway |
| 0.2 | 8.1 | PID HIF1 TFPATHWAY | HIF-1-alpha transcription factor network |
| 0.2 | 3.5 | PID RETINOIC ACID PATHWAY | Retinoic acid receptors-mediated signaling |
| 0.2 | 4.9 | PID ILK PATHWAY | Integrin-linked kinase signaling |
| 0.2 | 0.7 | PID IL2 1PATHWAY | IL2-mediated signaling events |
| 0.2 | 0.2 | SA TRKA RECEPTOR | The TrkA receptor binds nerve growth factor to activate MAP kinase pathways and promote cell growth. |
| 0.2 | 0.9 | PID LYMPH ANGIOGENESIS PATHWAY | VEGFR3 signaling in lymphatic endothelium |
| 0.2 | 7.2 | PID SMAD2 3NUCLEAR PATHWAY | Regulation of nuclear SMAD2/3 signaling |
| 0.2 | 1.9 | ST TUMOR NECROSIS FACTOR PATHWAY | Tumor Necrosis Factor Pathway. |
| 0.2 | 0.2 | PID S1P S1P2 PATHWAY | S1P2 pathway |
| 0.2 | 0.7 | ST JAK STAT PATHWAY | Jak-STAT Pathway |
| 0.2 | 3.5 | PID INSULIN PATHWAY | Insulin Pathway |
| 0.2 | 0.7 | PID FAS PATHWAY | FAS (CD95) signaling pathway |
| 0.2 | 4.4 | PID TGFBR PATHWAY | TGF-beta receptor signaling |
| 0.2 | 3.0 | PID CERAMIDE PATHWAY | Ceramide signaling pathway |
| 0.2 | 1.4 | PID SMAD2 3PATHWAY | Regulation of cytoplasmic and nuclear SMAD2/3 signaling |
| 0.2 | 5.3 | PID AURORA B PATHWAY | Aurora B signaling |
| 0.2 | 32.2 | NABA ECM REGULATORS | Genes encoding enzymes and their regulators involved in the remodeling of the extracellular matrix |
| 0.2 | 1.2 | PID INTEGRIN4 PATHWAY | Alpha6 beta4 integrin-ligand interactions |
| 0.2 | 0.8 | PID HDAC CLASSIII PATHWAY | Signaling events mediated by HDAC Class III |
| 0.2 | 0.3 | PID IL23 PATHWAY | IL23-mediated signaling events |
| 0.1 | 2.7 | PID ATF2 PATHWAY | ATF-2 transcription factor network |
| 0.1 | 1.8 | PID SYNDECAN 2 PATHWAY | Syndecan-2-mediated signaling events |
| 0.1 | 5.0 | PID MTOR 4PATHWAY | mTOR signaling pathway |
| 0.1 | 1.6 | PID IFNG PATHWAY | IFN-gamma pathway |
| 0.1 | 1.2 | PID AURORA A PATHWAY | Aurora A signaling |
| 0.1 | 0.5 | SIG IL4RECEPTOR IN B LYPHOCYTES | Genes related to IL4 rceptor signaling in B lymphocytes |
| 0.1 | 2.7 | PID ATR PATHWAY | ATR signaling pathway |
| 0.1 | 4.8 | PID ERBB1 DOWNSTREAM PATHWAY | ErbB1 downstream signaling |
| 0.1 | 0.9 | PID PI3KCI PATHWAY | Class I PI3K signaling events |
| 0.1 | 1.3 | PID ALPHA SYNUCLEIN PATHWAY | Alpha-synuclein signaling |
| 0.1 | 2.2 | PID INTEGRIN A4B1 PATHWAY | Alpha4 beta1 integrin signaling events |
| 0.1 | 4.1 | PID HDAC CLASSI PATHWAY | Signaling events mediated by HDAC Class I |
| 0.1 | 0.6 | PID VEGFR1 2 PATHWAY | Signaling events mediated by VEGFR1 and VEGFR2 |
| 0.1 | 1.5 | PID RXR VDR PATHWAY | RXR and RAR heterodimerization with other nuclear receptor |
| 0.1 | 1.6 | PID ARF 3PATHWAY | Arf1 pathway |
| 0.1 | 1.2 | ST INTEGRIN SIGNALING PATHWAY | Integrin Signaling Pathway |
| 0.1 | 0.3 | PID EPHA2 FWD PATHWAY | EPHA2 forward signaling |
| 0.1 | 0.5 | PID S1P META PATHWAY | Sphingosine 1-phosphate (S1P) pathway |
| 0.1 | 1.1 | PID A6B1 A6B4 INTEGRIN PATHWAY | a6b1 and a6b4 Integrin signaling |
| 0.1 | 2.5 | PID LKB1 PATHWAY | LKB1 signaling events |
| 0.1 | 3.5 | PID INTEGRIN1 PATHWAY | Beta1 integrin cell surface interactions |
| 0.1 | 0.7 | PID HIF1A PATHWAY | Hypoxic and oxygen homeostasis regulation of HIF-1-alpha |
| 0.1 | 0.6 | PID HDAC CLASSII PATHWAY | Signaling events mediated by HDAC Class II |
| 0.1 | 0.2 | SA PROGRAMMED CELL DEATH | Programmed cell death, or apoptosis, eliminates damaged or unneeded cells. |
| 0.1 | 1.1 | PID LPA4 PATHWAY | LPA4-mediated signaling events |
| 0.1 | 2.0 | PID TOLL ENDOGENOUS PATHWAY | Endogenous TLR signaling |
| 0.1 | 0.4 | PID P38 ALPHA BETA PATHWAY | Regulation of p38-alpha and p38-beta |
| 0.1 | 0.4 | PID IL2 PI3K PATHWAY | IL2 signaling events mediated by PI3K |
| 0.1 | 1.2 | PID FANCONI PATHWAY | Fanconi anemia pathway |
| 0.1 | 0.3 | SA PTEN PATHWAY | PTEN is a tumor suppressor that dephosphorylates the lipid messenger phosphatidylinositol triphosphate. |
| 0.1 | 0.8 | PID ERBB2 ERBB3 PATHWAY | ErbB2/ErbB3 signaling events |
| 0.1 | 1.9 | PID CONE PATHWAY | Visual signal transduction: Cones |
| 0.1 | 0.5 | PID SYNDECAN 4 PATHWAY | Syndecan-4-mediated signaling events |
| 0.1 | 2.4 | PID P53 REGULATION PATHWAY | p53 pathway |
| 0.1 | 2.8 | NABA PROTEOGLYCANS | Genes encoding proteoglycans |
| 0.1 | 0.8 | PID IL1 PATHWAY | IL1-mediated signaling events |
| 0.1 | 0.4 | PID ARF6 DOWNSTREAM PATHWAY | Arf6 downstream pathway |
| 0.1 | 1.8 | PID REG GR PATHWAY | Glucocorticoid receptor regulatory network |
| 0.1 | 0.6 | SIG INSULIN RECEPTOR PATHWAY IN CARDIAC MYOCYTES | Genes related to the insulin receptor pathway |
| 0.1 | 1.9 | PID FGF PATHWAY | FGF signaling pathway |
| 0.1 | 0.4 | PID INSULIN GLUCOSE PATHWAY | Insulin-mediated glucose transport |
| 0.1 | 1.0 | PID IL12 2PATHWAY | IL12-mediated signaling events |
| 0.1 | 0.5 | ST B CELL ANTIGEN RECEPTOR | B Cell Antigen Receptor |
| 0.1 | 1.1 | PID AP1 PATHWAY | AP-1 transcription factor network |
| 0.1 | 1.5 | PID PLK1 PATHWAY | PLK1 signaling events |
| 0.1 | 0.5 | PID EPHB FWD PATHWAY | EPHB forward signaling |
| 0.1 | 2.7 | PID RHOA REG PATHWAY | Regulation of RhoA activity |
| 0.1 | 1.3 | PID HEDGEHOG GLI PATHWAY | Hedgehog signaling events mediated by Gli proteins |
| 0.1 | 0.6 | PID RHODOPSIN PATHWAY | Visual signal transduction: Rods |
| 0.1 | 0.3 | PID S1P S1P4 PATHWAY | S1P4 pathway |
| 0.1 | 1.3 | PID P75 NTR PATHWAY | p75(NTR)-mediated signaling |
| 0.1 | 0.1 | PID SYNDECAN 1 PATHWAY | Syndecan-1-mediated signaling events |
| 0.1 | 0.9 | PID PDGFRB PATHWAY | PDGFR-beta signaling pathway |
| 0.1 | 1.2 | PID IL12 STAT4 PATHWAY | IL12 signaling mediated by STAT4 |
| 0.1 | 0.2 | SA FAS SIGNALING | The TNF-type receptor Fas induces apoptosis on ligand binding. |
| 0.1 | 0.1 | PID HIV NEF PATHWAY | HIV-1 Nef: Negative effector of Fas and TNF-alpha |
| 0.1 | 1.6 | PID IL4 2PATHWAY | IL4-mediated signaling events |
| 0.1 | 1.4 | PID CD8 TCR DOWNSTREAM PATHWAY | Downstream signaling in naïve CD8+ T cells |
| 0.1 | 1.0 | PID TELOMERASE PATHWAY | Regulation of Telomerase |
| 0.1 | 1.0 | SIG REGULATION OF THE ACTIN CYTOSKELETON BY RHO GTPASES | Genes related to regulation of the actin cytoskeleton |
| 0.1 | 0.8 | PID WNT NONCANONICAL PATHWAY | Noncanonical Wnt signaling pathway |
| 0.1 | 0.2 | ST PHOSPHOINOSITIDE 3 KINASE PATHWAY | PI3K Pathway |
| 0.1 | 0.4 | PID HEDGEHOG 2PATHWAY | Signaling events mediated by the Hedgehog family |
| 0.1 | 0.2 | PID INTEGRIN A9B1 PATHWAY | Alpha9 beta1 integrin signaling events |
| 0.1 | 0.4 | PID PRL SIGNALING EVENTS PATHWAY | Signaling events mediated by PRL |
| 0.1 | 0.1 | SIG CHEMOTAXIS | Genes related to chemotaxis |
| 0.1 | 0.5 | PID FOXM1 PATHWAY | FOXM1 transcription factor network |
| 0.1 | 0.5 | PID HIF2PATHWAY | HIF-2-alpha transcription factor network |
| 0.0 | 0.4 | ST FAS SIGNALING PATHWAY | Fas Signaling Pathway |
| 0.0 | 0.7 | PID FCER1 PATHWAY | Fc-epsilon receptor I signaling in mast cells |
| 0.0 | 0.7 | PID TCR PATHWAY | TCR signaling in naïve CD4+ T cells |
| 0.0 | 0.3 | PID EPHRINB REV PATHWAY | Ephrin B reverse signaling |
| 0.0 | 0.1 | SIG BCR SIGNALING PATHWAY | Members of the BCR signaling pathway |
| 0.0 | 0.6 | PID NFAT TFPATHWAY | Calcineurin-regulated NFAT-dependent transcription in lymphocytes |
| 0.0 | 0.1 | PID AR NONGENOMIC PATHWAY | Nongenotropic Androgen signaling |
| 0.0 | 0.3 | PID BCR 5PATHWAY | BCR signaling pathway |
| 0.0 | 4.6 | NABA ECM AFFILIATED | Genes encoding proteins affiliated structurally or functionally to extracellular matrix proteins |
| 0.0 | 0.2 | PID FRA PATHWAY | Validated transcriptional targets of AP1 family members Fra1 and Fra2 |
| 0.0 | 0.1 | PID INTEGRIN5 PATHWAY | Beta5 beta6 beta7 and beta8 integrin cell surface interactions |
| 0.0 | 0.1 | ST GAQ PATHWAY | G alpha q Pathway |
| 0.0 | 0.4 | NABA COLLAGENS | Genes encoding collagen proteins |
| 0.0 | 0.2 | ST ERK1 ERK2 MAPK PATHWAY | ERK1/ERK2 MAPK Pathway |
| 0.0 | 0.2 | PID IL3 PATHWAY | IL3-mediated signaling events |
| 0.0 | 0.3 | PID AJDISS 2PATHWAY | Posttranslational regulation of adherens junction stability and dissassembly |
| 0.0 | 1.5 | PID P53 DOWNSTREAM PATHWAY | Direct p53 effectors |
| 0.0 | 0.2 | PID INTEGRIN CS PATHWAY | Integrin family cell surface interactions |
| 0.0 | 0.5 | PID WNT SIGNALING PATHWAY | Wnt signaling network |
| 0.0 | 0.1 | PID IL27 PATHWAY | IL27-mediated signaling events |
| 0.0 | 0.3 | PID TAP63 PATHWAY | Validated transcriptional targets of TAp63 isoforms |
| 0.0 | 0.2 | PID ARF6 PATHWAY | Arf6 signaling events |
| 0.0 | 0.1 | PID MET PATHWAY | Signaling events mediated by Hepatocyte Growth Factor Receptor (c-Met) |
| 0.0 | 0.3 | PID AVB3 INTEGRIN PATHWAY | Integrins in angiogenesis |
| 0.0 | 0.1 | PID UPA UPAR PATHWAY | Urokinase-type plasminogen activator (uPA) and uPAR-mediated signaling |
| 0.0 | 0.1 | PID MAPK TRK PATHWAY | Trk receptor signaling mediated by the MAPK pathway |
| 0.0 | 0.1 | PID ANGIOPOIETIN RECEPTOR PATHWAY | Angiopoietin receptor Tie2-mediated signaling |
| 0.0 | 0.0 | SA CASPASE CASCADE | Apoptosis is mediated by caspases, cysteine proteases arranged in a proteolytic cascade. |
| 0.0 | 0.0 | PID SHP2 PATHWAY | SHP2 signaling |
| 0.0 | 0.1 | PID AMB2 NEUTROPHILS PATHWAY | amb2 Integrin signaling |
| 0.0 | 0.1 | PID ER NONGENOMIC PATHWAY | Plasma membrane estrogen receptor signaling |
| 0.0 | 0.0 | PID CDC42 PATHWAY | CDC42 signaling events |
| 0.0 | 0.1 | SA MMP CYTOKINE CONNECTION | Cytokines can induce activation of matrix metalloproteinases, which degrade extracellular matrix. |
| 0.0 | 0.0 | PID TRAIL PATHWAY | TRAIL signaling pathway |
| 0.0 | 0.0 | PID ERBB NETWORK PATHWAY | ErbB receptor signaling network |
Gene overrepresentation in curated gene sets: REACTOME pathways category:
| Log-likelihood per target | Total log-likelihood | Term | Description |
|---|---|---|---|
| 1.4 | 14.5 | REACTOME PASSIVE TRANSPORT BY AQUAPORINS | Genes involved in Passive Transport by Aquaporins |
| 1.1 | 8.6 | REACTOME RECYCLING OF BILE ACIDS AND SALTS | Genes involved in Recycling of bile acids and salts |
| 1.0 | 19.5 | REACTOME REGULATION OF GENE EXPRESSION IN BETA CELLS | Genes involved in Regulation of gene expression in beta cells |
| 0.8 | 17.2 | REACTOME AMYLOIDS | Genes involved in Amyloids |
| 0.7 | 11.0 | REACTOME RAP1 SIGNALLING | Genes involved in Rap1 signalling |
| 0.7 | 0.7 | REACTOME ALPHA LINOLENIC ACID ALA METABOLISM | Genes involved in alpha-linolenic acid (ALA) metabolism |
| 0.7 | 5.7 | REACTOME ELEVATION OF CYTOSOLIC CA2 LEVELS | Genes involved in Elevation of cytosolic Ca2+ levels |
| 0.7 | 6.1 | REACTOME GLYCOPROTEIN HORMONES | Genes involved in Glycoprotein hormones |
| 0.7 | 7.9 | REACTOME PYRIMIDINE CATABOLISM | Genes involved in Pyrimidine catabolism |
| 0.6 | 1.2 | REACTOME DCC MEDIATED ATTRACTIVE SIGNALING | Genes involved in DCC mediated attractive signaling |
| 0.6 | 8.1 | REACTOME HOMOLOGOUS RECOMBINATION REPAIR OF REPLICATION INDEPENDENT DOUBLE STRAND BREAKS | Genes involved in Homologous recombination repair of replication-independent double-strand breaks |
| 0.5 | 1.0 | REACTOME REGULATION OF AMPK ACTIVITY VIA LKB1 | Genes involved in Regulation of AMPK activity via LKB1 |
| 0.5 | 0.5 | REACTOME NRAGE SIGNALS DEATH THROUGH JNK | Genes involved in NRAGE signals death through JNK |
| 0.5 | 0.5 | REACTOME MRNA DECAY BY 3 TO 5 EXORIBONUCLEASE | Genes involved in mRNA Decay by 3' to 5' Exoribonuclease |
| 0.5 | 8.4 | REACTOME ACTIVATED AMPK STIMULATES FATTY ACID OXIDATION IN MUSCLE | Genes involved in Activated AMPK stimulates fatty-acid oxidation in muscle |
| 0.4 | 7.4 | REACTOME TERMINATION OF O GLYCAN BIOSYNTHESIS | Genes involved in Termination of O-glycan biosynthesis |
| 0.4 | 14.7 | REACTOME TRIGLYCERIDE BIOSYNTHESIS | Genes involved in Triglyceride Biosynthesis |
| 0.4 | 5.4 | REACTOME CELL EXTRACELLULAR MATRIX INTERACTIONS | Genes involved in Cell-extracellular matrix interactions |
| 0.4 | 4.9 | REACTOME PYRIMIDINE METABOLISM | Genes involved in Pyrimidine metabolism |
| 0.4 | 5.5 | REACTOME CHYLOMICRON MEDIATED LIPID TRANSPORT | Genes involved in Chylomicron-mediated lipid transport |
| 0.4 | 0.4 | REACTOME CDK MEDIATED PHOSPHORYLATION AND REMOVAL OF CDC6 | Genes involved in CDK-mediated phosphorylation and removal of Cdc6 |
| 0.3 | 4.8 | REACTOME OTHER SEMAPHORIN INTERACTIONS | Genes involved in Other semaphorin interactions |
| 0.3 | 9.2 | REACTOME TRANSPORT OF VITAMINS NUCLEOSIDES AND RELATED MOLECULES | Genes involved in Transport of vitamins, nucleosides, and related molecules |
| 0.3 | 10.0 | REACTOME AMINO ACID TRANSPORT ACROSS THE PLASMA MEMBRANE | Genes involved in Amino acid transport across the plasma membrane |
| 0.3 | 2.9 | REACTOME LIPOPROTEIN METABOLISM | Genes involved in Lipoprotein metabolism |
| 0.3 | 31.6 | REACTOME 3 UTR MEDIATED TRANSLATIONAL REGULATION | Genes involved in 3' -UTR-mediated translational regulation |
| 0.3 | 4.4 | REACTOME ABCA TRANSPORTERS IN LIPID HOMEOSTASIS | Genes involved in ABCA transporters in lipid homeostasis |
| 0.3 | 1.8 | REACTOME PLATELET SENSITIZATION BY LDL | Genes involved in Platelet sensitization by LDL |
| 0.3 | 3.3 | REACTOME SYNTHESIS OF BILE ACIDS AND BILE SALTS VIA 7ALPHA HYDROXYCHOLESTEROL | Genes involved in Synthesis of bile acids and bile salts via 7alpha-hydroxycholesterol |
| 0.3 | 6.4 | REACTOME SMOOTH MUSCLE CONTRACTION | Genes involved in Smooth Muscle Contraction |
| 0.3 | 0.6 | REACTOME ENDOSOMAL VACUOLAR PATHWAY | Genes involved in Endosomal/Vacuolar pathway |
| 0.3 | 4.0 | REACTOME PROCESSING OF INTRONLESS PRE MRNAS | Genes involved in Processing of Intronless Pre-mRNAs |
| 0.3 | 3.9 | REACTOME VIRAL MESSENGER RNA SYNTHESIS | Genes involved in Viral Messenger RNA Synthesis |
| 0.3 | 2.2 | REACTOME APOPTOSIS INDUCED DNA FRAGMENTATION | Genes involved in Apoptosis induced DNA fragmentation |
| 0.3 | 3.1 | REACTOME FORMATION OF ATP BY CHEMIOSMOTIC COUPLING | Genes involved in Formation of ATP by chemiosmotic coupling |
| 0.3 | 0.8 | REACTOME RNA POL I PROMOTER OPENING | Genes involved in RNA Polymerase I Promoter Opening |
| 0.3 | 2.9 | REACTOME NFKB ACTIVATION THROUGH FADD RIP1 PATHWAY MEDIATED BY CASPASE 8 AND10 | Genes involved in NF-kB activation through FADD/RIP-1 pathway mediated by caspase-8 and -10 |
| 0.3 | 25.2 | REACTOME FACTORS INVOLVED IN MEGAKARYOCYTE DEVELOPMENT AND PLATELET PRODUCTION | Genes involved in Factors involved in megakaryocyte development and platelet production |
| 0.3 | 19.5 | REACTOME MRNA SPLICING | Genes involved in mRNA Splicing |
| 0.3 | 0.8 | REACTOME YAP1 AND WWTR1 TAZ STIMULATED GENE EXPRESSION | Genes involved in YAP1- and WWTR1 (TAZ)-stimulated gene expression |
| 0.3 | 1.5 | REACTOME CTNNB1 PHOSPHORYLATION CASCADE | Genes involved in Beta-catenin phosphorylation cascade |
| 0.2 | 22.4 | REACTOME PPARA ACTIVATES GENE EXPRESSION | Genes involved in PPARA Activates Gene Expression |
| 0.2 | 1.5 | REACTOME GAP JUNCTION DEGRADATION | Genes involved in Gap junction degradation |
| 0.2 | 3.2 | REACTOME AMINO ACID SYNTHESIS AND INTERCONVERSION TRANSAMINATION | Genes involved in Amino acid synthesis and interconversion (transamination) |
| 0.2 | 6.0 | REACTOME GLUCONEOGENESIS | Genes involved in Gluconeogenesis |
| 0.2 | 17.6 | REACTOME MITOTIC PROMETAPHASE | Genes involved in Mitotic Prometaphase |
| 0.2 | 1.9 | REACTOME COPI MEDIATED TRANSPORT | Genes involved in COPI Mediated Transport |
| 0.2 | 0.9 | REACTOME INFLUENZA VIRAL RNA TRANSCRIPTION AND REPLICATION | Genes involved in Influenza Viral RNA Transcription and Replication |
| 0.2 | 10.9 | REACTOME GOLGI ASSOCIATED VESICLE BIOGENESIS | Genes involved in Golgi Associated Vesicle Biogenesis |
| 0.2 | 3.3 | REACTOME FANCONI ANEMIA PATHWAY | Genes involved in Fanconi Anemia pathway |
| 0.2 | 4.9 | REACTOME MEIOTIC SYNAPSIS | Genes involved in Meiotic Synapsis |
| 0.2 | 2.5 | REACTOME GLYCOGEN BREAKDOWN GLYCOGENOLYSIS | Genes involved in Glycogen breakdown (glycogenolysis) |
| 0.2 | 2.5 | REACTOME P130CAS LINKAGE TO MAPK SIGNALING FOR INTEGRINS | Genes involved in p130Cas linkage to MAPK signaling for integrins |
| 0.2 | 5.4 | REACTOME CYTOCHROME P450 ARRANGED BY SUBSTRATE TYPE | Genes involved in Cytochrome P450 - arranged by substrate type |
| 0.2 | 0.9 | REACTOME APOBEC3G MEDIATED RESISTANCE TO HIV1 INFECTION | Genes involved in APOBEC3G mediated resistance to HIV-1 infection |
| 0.2 | 3.5 | REACTOME EFFECTS OF PIP2 HYDROLYSIS | Genes involved in Effects of PIP2 hydrolysis |
| 0.2 | 0.2 | REACTOME ADENYLATE CYCLASE ACTIVATING PATHWAY | Genes involved in Adenylate cyclase activating pathway |
| 0.2 | 34.2 | REACTOME METABOLISM OF AMINO ACIDS AND DERIVATIVES | Genes involved in Metabolism of amino acids and derivatives |
| 0.2 | 2.1 | REACTOME REGULATION OF BETA CELL DEVELOPMENT | Genes involved in Regulation of beta-cell development |
| 0.2 | 3.8 | REACTOME SIGNALING BY FGFR1 FUSION MUTANTS | Genes involved in Signaling by FGFR1 fusion mutants |
| 0.2 | 2.1 | REACTOME REGULATED PROTEOLYSIS OF P75NTR | Genes involved in Regulated proteolysis of p75NTR |
| 0.2 | 1.2 | REACTOME IKK COMPLEX RECRUITMENT MEDIATED BY RIP1 | Genes involved in IKK complex recruitment mediated by RIP1 |
| 0.2 | 4.8 | REACTOME INTRINSIC PATHWAY FOR APOPTOSIS | Genes involved in Intrinsic Pathway for Apoptosis |
| 0.2 | 3.0 | REACTOME SYNTHESIS OF PC | Genes involved in Synthesis of PC |
| 0.2 | 2.0 | REACTOME REGULATION OF IFNG SIGNALING | Genes involved in Regulation of IFNG signaling |
| 0.2 | 2.9 | REACTOME REGULATION OF HYPOXIA INDUCIBLE FACTOR HIF BY OXYGEN | Genes involved in Regulation of Hypoxia-inducible Factor (HIF) by Oxygen |
| 0.2 | 2.1 | REACTOME BMAL1 CLOCK NPAS2 ACTIVATES CIRCADIAN EXPRESSION | Genes involved in BMAL1:CLOCK/NPAS2 Activates Circadian Expression |
| 0.2 | 5.2 | REACTOME REGULATION OF MRNA STABILITY BY PROTEINS THAT BIND AU RICH ELEMENTS | Genes involved in Regulation of mRNA Stability by Proteins that Bind AU-rich Elements |
| 0.2 | 2.6 | REACTOME CONVERSION FROM APC C CDC20 TO APC C CDH1 IN LATE ANAPHASE | Genes involved in Conversion from APC/C:Cdc20 to APC/C:Cdh1 in late anaphase |
| 0.2 | 0.5 | REACTOME CYCLIN A B1 ASSOCIATED EVENTS DURING G2 M TRANSITION | Genes involved in Cyclin A/B1 associated events during G2/M transition |
| 0.2 | 2.1 | REACTOME DOWNREGULATION OF SMAD2 3 SMAD4 TRANSCRIPTIONAL ACTIVITY | Genes involved in Downregulation of SMAD2/3:SMAD4 transcriptional activity |
| 0.2 | 1.2 | REACTOME RETROGRADE NEUROTROPHIN SIGNALLING | Genes involved in Retrograde neurotrophin signalling |
| 0.2 | 2.2 | REACTOME ENOS ACTIVATION AND REGULATION | Genes involved in eNOS activation and regulation |
| 0.2 | 6.8 | REACTOME LOSS OF NLP FROM MITOTIC CENTROSOMES | Genes involved in Loss of Nlp from mitotic centrosomes |
| 0.2 | 0.3 | REACTOME PHOSPHORYLATION OF THE APC C | Genes involved in Phosphorylation of the APC/C |
| 0.2 | 0.2 | REACTOME CIRCADIAN CLOCK | Genes involved in Circadian Clock |
| 0.2 | 0.5 | REACTOME PROCESSING OF CAPPED INTRONLESS PRE MRNA | Genes involved in Processing of Capped Intronless Pre-mRNA |
| 0.2 | 3.6 | REACTOME CYTOSOLIC TRNA AMINOACYLATION | Genes involved in Cytosolic tRNA aminoacylation |
| 0.2 | 1.1 | REACTOME CREATION OF C4 AND C2 ACTIVATORS | Genes involved in Creation of C4 and C2 activators |
| 0.2 | 0.3 | REACTOME MRNA CAPPING | Genes involved in mRNA Capping |
| 0.2 | 0.8 | REACTOME MTORC1 MEDIATED SIGNALLING | Genes involved in mTORC1-mediated signalling |
| 0.2 | 2.6 | REACTOME CHOLESTEROL BIOSYNTHESIS | Genes involved in Cholesterol biosynthesis |
| 0.2 | 0.6 | REACTOME REGULATION OF IFNA SIGNALING | Genes involved in Regulation of IFNA signaling |
| 0.2 | 2.6 | REACTOME G0 AND EARLY G1 | Genes involved in G0 and Early G1 |
| 0.2 | 1.2 | REACTOME CYCLIN E ASSOCIATED EVENTS DURING G1 S TRANSITION | Genes involved in Cyclin E associated events during G1/S transition |
| 0.1 | 1.5 | REACTOME IRON UPTAKE AND TRANSPORT | Genes involved in Iron uptake and transport |
| 0.1 | 2.2 | REACTOME STEROID HORMONES | Genes involved in Steroid hormones |
| 0.1 | 3.3 | REACTOME INTERFERON GAMMA SIGNALING | Genes involved in Interferon gamma signaling |
| 0.1 | 1.0 | REACTOME ACTIVATION OF CHAPERONE GENES BY ATF6 ALPHA | Genes involved in Activation of Chaperone Genes by ATF6-alpha |
| 0.1 | 0.7 | REACTOME P75NTR RECRUITS SIGNALLING COMPLEXES | Genes involved in p75NTR recruits signalling complexes |
| 0.1 | 1.9 | REACTOME PHASE1 FUNCTIONALIZATION OF COMPOUNDS | Genes involved in Phase 1 - Functionalization of compounds |
| 0.1 | 1.9 | REACTOME SYNTHESIS OF PIPS AT THE GOLGI MEMBRANE | Genes involved in Synthesis of PIPs at the Golgi membrane |
| 0.1 | 2.0 | REACTOME CITRIC ACID CYCLE TCA CYCLE | Genes involved in Citric acid cycle (TCA cycle) |
| 0.1 | 5.5 | REACTOME ANTIVIRAL MECHANISM BY IFN STIMULATED GENES | Genes involved in Antiviral mechanism by IFN-stimulated genes |
| 0.1 | 0.1 | REACTOME P53 DEPENDENT G1 DNA DAMAGE RESPONSE | Genes involved in p53-Dependent G1 DNA Damage Response |
| 0.1 | 5.5 | REACTOME TRANSLATION | Genes involved in Translation |
| 0.1 | 3.7 | REACTOME IL1 SIGNALING | Genes involved in Interleukin-1 signaling |
| 0.1 | 1.2 | REACTOME VITAMIN B5 PANTOTHENATE METABOLISM | Genes involved in Vitamin B5 (pantothenate) metabolism |
| 0.1 | 1.6 | REACTOME MITOCHONDRIAL FATTY ACID BETA OXIDATION | Genes involved in Mitochondrial Fatty Acid Beta-Oxidation |
| 0.1 | 1.0 | REACTOME P38MAPK EVENTS | Genes involved in p38MAPK events |
| 0.1 | 4.9 | REACTOME MITOCHONDRIAL PROTEIN IMPORT | Genes involved in Mitochondrial Protein Import |
| 0.1 | 0.9 | REACTOME FORMATION OF TRANSCRIPTION COUPLED NER TC NER REPAIR COMPLEX | Genes involved in Formation of transcription-coupled NER (TC-NER) repair complex |
| 0.1 | 0.3 | REACTOME SYNTHESIS SECRETION AND INACTIVATION OF GLP1 | Genes involved in Synthesis, Secretion, and Inactivation of Glucagon-like Peptide-1 (GLP-1) |
| 0.1 | 2.0 | REACTOME PRE NOTCH TRANSCRIPTION AND TRANSLATION | Genes involved in Pre-NOTCH Transcription and Translation |
| 0.1 | 3.4 | REACTOME TIGHT JUNCTION INTERACTIONS | Genes involved in Tight junction interactions |
| 0.1 | 1.1 | REACTOME SIGNAL ATTENUATION | Genes involved in Signal attenuation |
| 0.1 | 1.4 | REACTOME SIGNALING BY FGFR1 MUTANTS | Genes involved in Signaling by FGFR1 mutants |
| 0.1 | 3.2 | REACTOME SPHINGOLIPID DE NOVO BIOSYNTHESIS | Genes involved in Sphingolipid de novo biosynthesis |
| 0.1 | 0.2 | REACTOME ACTIVATED TAK1 MEDIATES P38 MAPK ACTIVATION | Genes involved in activated TAK1 mediates p38 MAPK activation |
| 0.1 | 4.8 | REACTOME GLYCEROPHOSPHOLIPID BIOSYNTHESIS | Genes involved in Glycerophospholipid biosynthesis |
| 0.1 | 1.5 | REACTOME SIGNALING BY BMP | Genes involved in Signaling by BMP |
| 0.1 | 2.9 | REACTOME RNA POL II TRANSCRIPTION PRE INITIATION AND PROMOTER OPENING | Genes involved in RNA Polymerase II Transcription Pre-Initiation And Promoter Opening |
| 0.1 | 0.3 | REACTOME ACTIVATION OF IRF3 IRF7 MEDIATED BY TBK1 IKK EPSILON | Genes involved in Activation of IRF3/IRF7 mediated by TBK1/IKK epsilon |
| 0.1 | 1.5 | REACTOME MEIOTIC RECOMBINATION | Genes involved in Meiotic Recombination |
| 0.1 | 1.1 | REACTOME PKA MEDIATED PHOSPHORYLATION OF CREB | Genes involved in PKA-mediated phosphorylation of CREB |
| 0.1 | 1.1 | REACTOME CALNEXIN CALRETICULIN CYCLE | Genes involved in Calnexin/calreticulin cycle |
| 0.1 | 0.2 | REACTOME REGULATION OF KIT SIGNALING | Genes involved in Regulation of KIT signaling |
| 0.1 | 0.4 | REACTOME TRANS GOLGI NETWORK VESICLE BUDDING | Genes involved in trans-Golgi Network Vesicle Budding |
| 0.1 | 1.1 | REACTOME MRNA DECAY BY 5 TO 3 EXORIBONUCLEASE | Genes involved in mRNA Decay by 5' to 3' Exoribonuclease |
| 0.1 | 2.4 | REACTOME REGULATION OF WATER BALANCE BY RENAL AQUAPORINS | Genes involved in Regulation of Water Balance by Renal Aquaporins |
| 0.1 | 0.4 | REACTOME DIGESTION OF DIETARY CARBOHYDRATE | Genes involved in Digestion of dietary carbohydrate |
| 0.1 | 0.2 | REACTOME SHC1 EVENTS IN EGFR SIGNALING | Genes involved in SHC1 events in EGFR signaling |
| 0.1 | 2.0 | REACTOME GLUTATHIONE CONJUGATION | Genes involved in Glutathione conjugation |
| 0.1 | 0.8 | REACTOME VEGF LIGAND RECEPTOR INTERACTIONS | Genes involved in VEGF ligand-receptor interactions |
| 0.1 | 0.3 | REACTOME G ALPHA1213 SIGNALLING EVENTS | Genes involved in G alpha (12/13) signalling events |
| 0.1 | 3.1 | REACTOME METABOLISM OF VITAMINS AND COFACTORS | Genes involved in Metabolism of vitamins and cofactors |
| 0.1 | 0.3 | REACTOME ADVANCED GLYCOSYLATION ENDPRODUCT RECEPTOR SIGNALING | Genes involved in Advanced glycosylation endproduct receptor signaling |
| 0.1 | 1.1 | REACTOME PRESYNAPTIC NICOTINIC ACETYLCHOLINE RECEPTORS | Genes involved in Presynaptic nicotinic acetylcholine receptors |
| 0.1 | 0.6 | REACTOME PROLONGED ERK ACTIVATION EVENTS | Genes involved in Prolonged ERK activation events |
| 0.1 | 0.4 | REACTOME SYNTHESIS OF PIPS AT THE LATE ENDOSOME MEMBRANE | Genes involved in Synthesis of PIPs at the late endosome membrane |
| 0.1 | 0.6 | REACTOME MEMBRANE BINDING AND TARGETTING OF GAG PROTEINS | Genes involved in Membrane binding and targetting of GAG proteins |
| 0.1 | 0.1 | REACTOME ACETYLCHOLINE NEUROTRANSMITTER RELEASE CYCLE | Genes involved in Acetylcholine Neurotransmitter Release Cycle |
| 0.1 | 1.0 | REACTOME BASIGIN INTERACTIONS | Genes involved in Basigin interactions |
| 0.1 | 0.1 | REACTOME RESOLUTION OF AP SITES VIA THE MULTIPLE NUCLEOTIDE PATCH REPLACEMENT PATHWAY | Genes involved in Resolution of AP sites via the multiple-nucleotide patch replacement pathway |
| 0.1 | 1.0 | REACTOME METABOLISM OF NON CODING RNA | Genes involved in Metabolism of non-coding RNA |
| 0.1 | 0.7 | REACTOME FACILITATIVE NA INDEPENDENT GLUCOSE TRANSPORTERS | Genes involved in Facilitative Na+-independent glucose transporters |
| 0.1 | 0.6 | REACTOME CDC6 ASSOCIATION WITH THE ORC ORIGIN COMPLEX | Genes involved in CDC6 association with the ORC:origin complex |
| 0.1 | 0.6 | REACTOME GAMMA CARBOXYLATION TRANSPORT AND AMINO TERMINAL CLEAVAGE OF PROTEINS | Genes involved in Gamma-carboxylation, transport, and amino-terminal cleavage of proteins |
| 0.1 | 1.0 | REACTOME HYALURONAN METABOLISM | Genes involved in Hyaluronan metabolism |
| 0.1 | 0.8 | REACTOME PURINE RIBONUCLEOSIDE MONOPHOSPHATE BIOSYNTHESIS | Genes involved in Purine ribonucleoside monophosphate biosynthesis |
| 0.1 | 0.7 | REACTOME CYTOSOLIC SULFONATION OF SMALL MOLECULES | Genes involved in Cytosolic sulfonation of small molecules |
| 0.1 | 3.4 | REACTOME NCAM SIGNALING FOR NEURITE OUT GROWTH | Genes involved in NCAM signaling for neurite out-growth |
| 0.1 | 2.0 | REACTOME LATENT INFECTION OF HOMO SAPIENS WITH MYCOBACTERIUM TUBERCULOSIS | Genes involved in Latent infection of Homo sapiens with Mycobacterium tuberculosis |
| 0.1 | 1.1 | REACTOME SYNTHESIS OF GLYCOSYLPHOSPHATIDYLINOSITOL GPI | Genes involved in Synthesis of glycosylphosphatidylinositol (GPI) |
| 0.1 | 0.8 | REACTOME PROTEOLYTIC CLEAVAGE OF SNARE COMPLEX PROTEINS | Genes involved in Proteolytic cleavage of SNARE complex proteins |
| 0.1 | 0.3 | REACTOME FATTY ACID TRIACYLGLYCEROL AND KETONE BODY METABOLISM | Genes involved in Fatty acid, triacylglycerol, and ketone body metabolism |
| 0.1 | 0.3 | REACTOME TRAF6 MEDIATED NFKB ACTIVATION | Genes involved in TRAF6 mediated NF-kB activation |
| 0.1 | 2.3 | REACTOME AMINE LIGAND BINDING RECEPTORS | Genes involved in Amine ligand-binding receptors |
| 0.1 | 1.1 | REACTOME COMPLEMENT CASCADE | Genes involved in Complement cascade |
| 0.1 | 1.6 | REACTOME APOPTOTIC EXECUTION PHASE | Genes involved in Apoptotic execution phase |
| 0.1 | 0.5 | REACTOME TRAFFICKING AND PROCESSING OF ENDOSOMAL TLR | Genes involved in Trafficking and processing of endosomal TLR |
| 0.1 | 0.5 | REACTOME PLATELET ADHESION TO EXPOSED COLLAGEN | Genes involved in Platelet Adhesion to exposed collagen |
| 0.1 | 0.9 | REACTOME INSULIN SYNTHESIS AND PROCESSING | Genes involved in Insulin Synthesis and Processing |
| 0.1 | 0.6 | REACTOME PEROXISOMAL LIPID METABOLISM | Genes involved in Peroxisomal lipid metabolism |
| 0.1 | 0.7 | REACTOME P2Y RECEPTORS | Genes involved in P2Y receptors |
| 0.1 | 2.7 | REACTOME CHEMOKINE RECEPTORS BIND CHEMOKINES | Genes involved in Chemokine receptors bind chemokines |
| 0.1 | 0.1 | REACTOME FGFR1 LIGAND BINDING AND ACTIVATION | Genes involved in FGFR1 ligand binding and activation |
| 0.1 | 0.4 | REACTOME GLUCURONIDATION | Genes involved in Glucuronidation |
| 0.1 | 0.3 | REACTOME BIOLOGICAL OXIDATIONS | Genes involved in Biological oxidations |
| 0.1 | 0.5 | REACTOME SMAD2 SMAD3 SMAD4 HETEROTRIMER REGULATES TRANSCRIPTION | Genes involved in SMAD2/SMAD3:SMAD4 heterotrimer regulates transcription |
| 0.1 | 0.6 | REACTOME NONSENSE MEDIATED DECAY ENHANCED BY THE EXON JUNCTION COMPLEX | Genes involved in Nonsense Mediated Decay Enhanced by the Exon Junction Complex |
| 0.1 | 1.8 | REACTOME COLLAGEN FORMATION | Genes involved in Collagen formation |
| 0.1 | 0.7 | REACTOME SIGNALING BY NODAL | Genes involved in Signaling by NODAL |
| 0.1 | 0.1 | REACTOME SIGNALING BY THE B CELL RECEPTOR BCR | Genes involved in Signaling by the B Cell Receptor (BCR) |
| 0.0 | 0.4 | REACTOME GENERATION OF SECOND MESSENGER MOLECULES | Genes involved in Generation of second messenger molecules |
| 0.0 | 0.1 | REACTOME REGULATION OF SIGNALING BY CBL | Genes involved in Regulation of signaling by CBL |
| 0.0 | 0.1 | REACTOME ASSOCIATION OF LICENSING FACTORS WITH THE PRE REPLICATIVE COMPLEX | Genes involved in Association of licensing factors with the pre-replicative complex |
| 0.0 | 0.5 | REACTOME PTM GAMMA CARBOXYLATION HYPUSINE FORMATION AND ARYLSULFATASE ACTIVATION | Genes involved in PTM: gamma carboxylation, hypusine formation and arylsulfatase activation |
| 0.0 | 0.3 | REACTOME TGF BETA RECEPTOR SIGNALING IN EMT EPITHELIAL TO MESENCHYMAL TRANSITION | Genes involved in TGF-beta receptor signaling in EMT (epithelial to mesenchymal transition) |
| 0.0 | 0.4 | REACTOME INFLAMMASOMES | Genes involved in Inflammasomes |
| 0.0 | 0.0 | REACTOME REMOVAL OF THE FLAP INTERMEDIATE FROM THE C STRAND | Genes involved in Removal of the Flap Intermediate from the C-strand |
| 0.0 | 2.3 | REACTOME TRANSPORT OF INORGANIC CATIONS ANIONS AND AMINO ACIDS OLIGOPEPTIDES | Genes involved in Transport of inorganic cations/anions and amino acids/oligopeptides |
| 0.0 | 0.1 | REACTOME PLATELET AGGREGATION PLUG FORMATION | Genes involved in Platelet Aggregation (Plug Formation) |
| 0.0 | 0.4 | REACTOME ACTIVATION OF RAC | Genes involved in Activation of Rac |
| 0.0 | 0.0 | REACTOME ABORTIVE ELONGATION OF HIV1 TRANSCRIPT IN THE ABSENCE OF TAT | Genes involved in Abortive elongation of HIV-1 transcript in the absence of Tat |
| 0.0 | 0.4 | REACTOME RNA POL I TRANSCRIPTION | Genes involved in RNA Polymerase I Transcription |
| 0.0 | 0.2 | REACTOME NUCLEOTIDE LIKE PURINERGIC RECEPTORS | Genes involved in Nucleotide-like (purinergic) receptors |
| 0.0 | 4.1 | REACTOME METABOLISM OF CARBOHYDRATES | Genes involved in Metabolism of carbohydrates |
| 0.0 | 0.4 | REACTOME BASE FREE SUGAR PHOSPHATE REMOVAL VIA THE SINGLE NUCLEOTIDE REPLACEMENT PATHWAY | Genes involved in Base-free sugar-phosphate removal via the single-nucleotide replacement pathway |
| 0.0 | 0.1 | REACTOME AKT PHOSPHORYLATES TARGETS IN THE CYTOSOL | Genes involved in AKT phosphorylates targets in the cytosol |
| 0.0 | 0.1 | REACTOME CROSS PRESENTATION OF SOLUBLE EXOGENOUS ANTIGENS ENDOSOMES | Genes involved in Cross-presentation of soluble exogenous antigens (endosomes) |
| 0.0 | 0.1 | REACTOME REGULATION OF INSULIN SECRETION BY GLUCAGON LIKE PEPTIDE1 | Genes involved in Regulation of Insulin Secretion by Glucagon-like Peptide-1 |
| 0.0 | 0.2 | REACTOME ABACAVIR TRANSPORT AND METABOLISM | Genes involved in Abacavir transport and metabolism |
| 0.0 | 1.9 | REACTOME RESPIRATORY ELECTRON TRANSPORT ATP SYNTHESIS BY CHEMIOSMOTIC COUPLING AND HEAT PRODUCTION BY UNCOUPLING PROTEINS | Genes involved in Respiratory electron transport, ATP synthesis by chemiosmotic coupling, and heat production by uncoupling proteins. |
| 0.0 | 0.0 | REACTOME GLUTAMATE NEUROTRANSMITTER RELEASE CYCLE | Genes involved in Glutamate Neurotransmitter Release Cycle |
| 0.0 | 1.0 | REACTOME INTEGRIN CELL SURFACE INTERACTIONS | Genes involved in Integrin cell surface interactions |
| 0.0 | 1.3 | REACTOME RESPONSE TO ELEVATED PLATELET CYTOSOLIC CA2 | Genes involved in Response to elevated platelet cytosolic Ca2+ |
| 0.0 | 0.1 | REACTOME ERKS ARE INACTIVATED | Genes involved in ERKs are inactivated |
| 0.0 | 0.4 | REACTOME SEMA4D INDUCED CELL MIGRATION AND GROWTH CONE COLLAPSE | Genes involved in Sema4D induced cell migration and growth-cone collapse |
| 0.0 | 0.9 | REACTOME NUCLEAR RECEPTOR TRANSCRIPTION PATHWAY | Genes involved in Nuclear Receptor transcription pathway |
| 0.0 | 0.2 | REACTOME EXTRINSIC PATHWAY FOR APOPTOSIS | Genes involved in Extrinsic Pathway for Apoptosis |
| 0.0 | 0.1 | REACTOME IL 6 SIGNALING | Genes involved in Interleukin-6 signaling |
| 0.0 | 0.4 | REACTOME SPHINGOLIPID METABOLISM | Genes involved in Sphingolipid metabolism |
| 0.0 | 0.2 | REACTOME REPAIR SYNTHESIS FOR GAP FILLING BY DNA POL IN TC NER | Genes involved in Repair synthesis for gap-filling by DNA polymerase in TC-NER |
| 0.0 | 0.1 | REACTOME ADP SIGNALLING THROUGH P2RY12 | Genes involved in ADP signalling through P2Y purinoceptor 12 |
| 0.0 | 0.1 | REACTOME MICRORNA MIRNA BIOGENESIS | Genes involved in MicroRNA (miRNA) Biogenesis |
| 0.0 | 0.1 | REACTOME ROLE OF SECOND MESSENGERS IN NETRIN1 SIGNALING | Genes involved in Role of second messengers in netrin-1 signaling |
| 0.0 | 0.3 | REACTOME GAP JUNCTION ASSEMBLY | Genes involved in Gap junction assembly |
| 0.0 | 0.5 | REACTOME ASSOCIATION OF TRIC CCT WITH TARGET PROTEINS DURING BIOSYNTHESIS | Genes involved in Association of TriC/CCT with target proteins during biosynthesis |
| 0.0 | 0.0 | REACTOME BINDING AND ENTRY OF HIV VIRION | Genes involved in Binding and entry of HIV virion |
| 0.0 | 0.1 | REACTOME G BETA GAMMA SIGNALLING THROUGH PI3KGAMMA | Genes involved in G beta:gamma signalling through PI3Kgamma |
| 0.0 | 0.4 | REACTOME DNA REPAIR | Genes involved in DNA Repair |
| 0.0 | 0.2 | REACTOME ANTIGEN ACTIVATES B CELL RECEPTOR LEADING TO GENERATION OF SECOND MESSENGERS | Genes involved in Antigen Activates B Cell Receptor Leading to Generation of Second Messengers |
| 0.0 | 0.2 | REACTOME RNA POL III CHAIN ELONGATION | Genes involved in RNA Polymerase III Chain Elongation |
| 0.0 | 0.3 | REACTOME MHC CLASS II ANTIGEN PRESENTATION | Genes involved in MHC class II antigen presentation |
| 0.0 | 0.0 | REACTOME SIGNALING BY FGFR IN DISEASE | Genes involved in Signaling by FGFR in disease |
| 0.0 | 0.1 | REACTOME DEPOSITION OF NEW CENPA CONTAINING NUCLEOSOMES AT THE CENTROMERE | Genes involved in Deposition of New CENPA-containing Nucleosomes at the Centromere |
| 0.0 | 0.1 | REACTOME HORMONE SENSITIVE LIPASE HSL MEDIATED TRIACYLGLYCEROL HYDROLYSIS | Genes involved in Hormone-sensitive lipase (HSL)-mediated triacylglycerol hydrolysis |
| 0.0 | 0.2 | REACTOME AMINE COMPOUND SLC TRANSPORTERS | Genes involved in Amine compound SLC transporters |
| 0.0 | 0.3 | REACTOME COSTIMULATION BY THE CD28 FAMILY | Genes involved in Costimulation by the CD28 family |
| 0.0 | 0.3 | REACTOME O LINKED GLYCOSYLATION OF MUCINS | Genes involved in O-linked glycosylation of mucins |
| 0.0 | 0.1 | REACTOME NEGATIVE REGULATORS OF RIG I MDA5 SIGNALING | Genes involved in Negative regulators of RIG-I/MDA5 signaling |