Project
ENCODE: ATAC-seq of different tissues during embryonic development
Navigation
Downloads
CREMA is a free online tool that recognizes most
important transcription factors that change the chromatin
state across different samples.
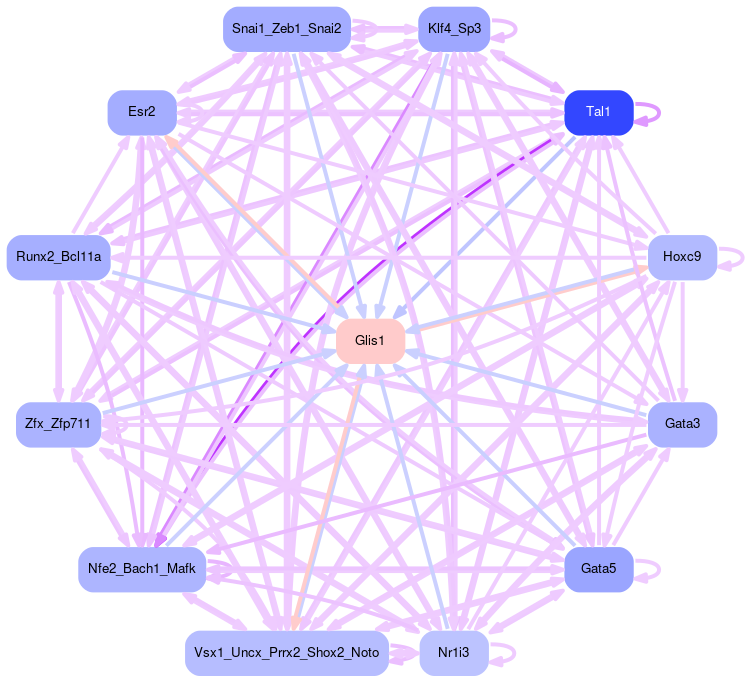
Results for Glis1
Z-value: 0.48
Motif logo
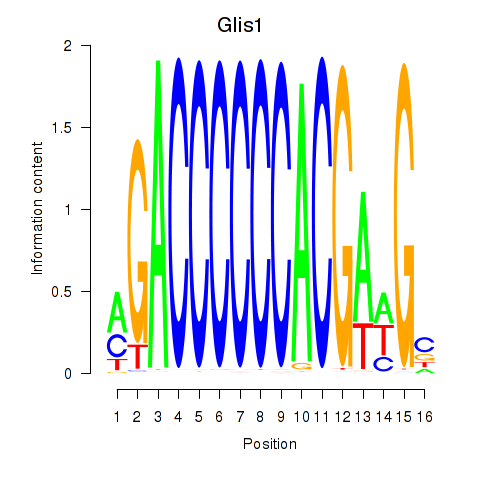
Transcription factors associated with Glis1
| Gene Symbol | Gene ID | Gene Info |
|---|---|---|
|
Glis1
|
ENSMUSG00000034762.3 | Glis1 |
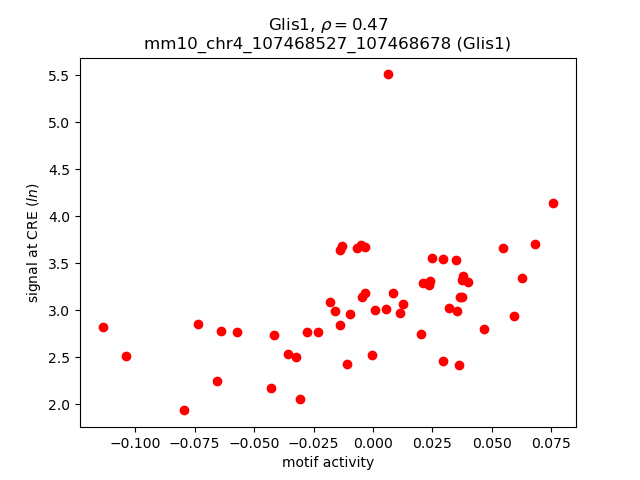
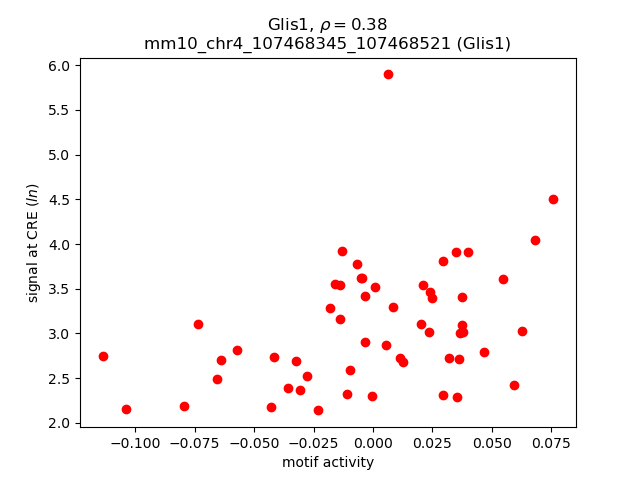
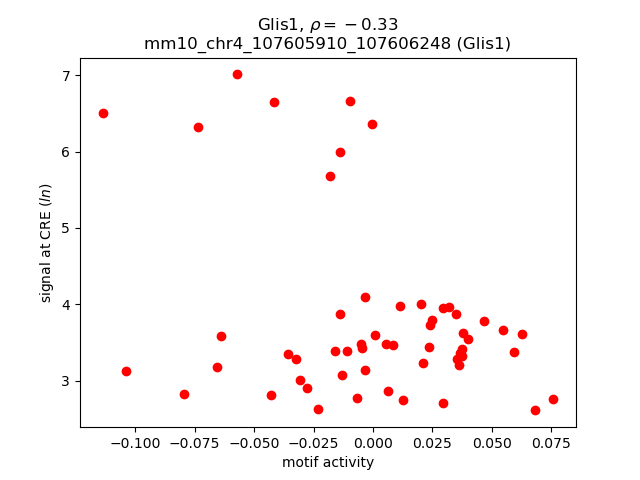
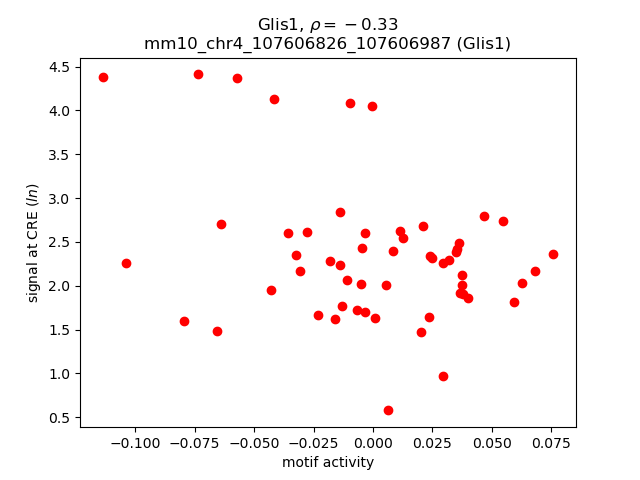
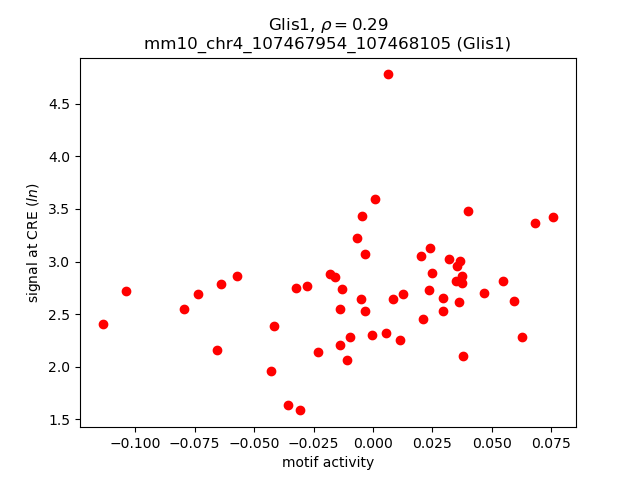
Correlations of motif activity and signal intensity at CREs associated with the motif's TFs:
This plot shows correlation between observed signal intensity of a CRE associated with the transcription factor across all samples and activity of the motif.
For each TF, only the top 5 correlated CREs are shown.
| CRE | Gene | Distance | Association probability | Pearson corr. coef. | P-value | Plot |
|---|---|---|---|---|---|---|
| Glis1 | chr4_107468527_107468678 | 29604 | 0.146690 | 0.47 | 3.3e-04 | Click! |
| Glis1 | chr4_107468345_107468521 | 29435 | 0.146953 | 0.38 | 3.9e-03 | Click! |
| Glis1 | chr4_107605910_107606248 | 8921 | 0.194168 | -0.33 | 1.3e-02 | Click! |
| Glis1 | chr4_107606826_107606987 | 8094 | 0.196124 | -0.33 | 1.3e-02 | Click! |
| Glis1 | chr4_107467954_107468105 | 29031 | 0.147579 | 0.29 | 3.1e-02 | Click! |
Activity of the Glis1 motif across conditions
Conditions sorted by the z-value of the Glis1 motif activity
Move your cursor over a bar to see sample name and corresponding Z-value.
Top target CREs of the motif:
| Cis Regulatory Element (CRE) | Target Score | Top associated gene | Gene Info | Distance of CRE to TSS | CRE/Gene association probability |
|---|---|---|---|---|---|
| chr5_24730299_24730496 | 3.82 |
Wdr86 |
WD repeat domain 86 |
283 |
0.87 |
| chr7_29453052_29453769 | 3.54 |
Sipa1l3 |
signal-induced proliferation-associated 1 like 3 |
52042 |
0.1 |
| chr5_113635949_113636100 | 3.40 |
Cmklr1 |
chemokine-like receptor 1 |
7579 |
0.16 |
| chr3_87764321_87764732 | 2.46 |
Pear1 |
platelet endothelial aggregation receptor 1 |
2312 |
0.22 |
| chr7_45091386_45091868 | 2.41 |
Rcn3 |
reticulocalbin 3, EF-hand calcium binding domain |
98 |
0.62 |
| chr6_135136423_135136864 | 2.26 |
Gm29803 |
predicted gene, 29803 |
2191 |
0.2 |
| chr4_147969190_147969341 | 2.02 |
Nppb |
natriuretic peptide type B |
16523 |
0.09 |
| chr7_3411029_3411836 | 1.79 |
Gm23450 |
predicted gene, 23450 |
3634 |
0.11 |
| chr5_52114565_52115511 | 1.76 |
Gm43177 |
predicted gene 43177 |
2274 |
0.22 |
| chr5_120005810_120006020 | 1.72 |
Gm38554 |
predicted gene, 38554 |
46672 |
0.13 |
| chr1_150991901_150992071 | 1.11 |
Hmcn1 |
hemicentin 1 |
1065 |
0.52 |
| chr15_93825328_93825719 | 1.08 |
Gm49445 |
predicted gene, 49445 |
485 |
0.86 |
| chr8_82943719_82943873 | 1.07 |
Gm18212 |
predicted gene, 18212 |
8716 |
0.25 |
| chr6_85254101_85254349 | 1.03 |
Sfxn5 |
sideroflexin 5 |
10708 |
0.16 |
| chr10_44589951_44590105 | 0.97 |
Gm5950 |
predicted gene 5950 |
100 |
0.65 |
| chr5_101765419_101765831 | 0.90 |
Cds1 |
CDP-diacylglycerol synthase 1 |
495 |
0.77 |
| chr6_42262194_42262445 | 0.89 |
Tmem139 |
transmembrane protein 139 |
349 |
0.77 |
| chr12_76572353_76572504 | 0.70 |
Plekhg3 |
pleckstrin homology domain containing, family G (with RhoGef domain) member 3 |
878 |
0.53 |
| chr4_156248345_156248496 | 0.67 |
Samd11 |
sterile alpha motif domain containing 11 |
3660 |
0.12 |
| chr11_3289074_3290615 | 0.58 |
Patz1 |
POZ (BTB) and AT hook containing zinc finger 1 |
149 |
0.93 |
| chr4_141623114_141623302 | 0.56 |
Slc25a34 |
solute carrier family 25, member 34 |
613 |
0.58 |
| chr7_100930787_100931664 | 0.51 |
Arhgef17 |
Rho guanine nucleotide exchange factor (GEF) 17 |
882 |
0.51 |
| chr2_27122039_27122272 | 0.50 |
Adamtsl2 |
ADAMTS-like 2 |
17492 |
0.11 |
| chr15_99474144_99474817 | 0.48 |
Bcdin3d |
BCDIN3 domain containing |
228 |
0.86 |
| chr4_144893602_144894367 | 0.42 |
Dhrs3 |
dehydrogenase/reductase (SDR family) member 3 |
765 |
0.69 |
| chrX_151046578_151047462 | 0.39 |
Fgd1 |
FYVE, RhoGEF and PH domain containing 1 |
150 |
0.95 |
| chr3_87971441_87971954 | 0.39 |
Nes |
nestin |
568 |
0.56 |
| chr8_126903611_126903762 | 0.38 |
Gm31718 |
predicted gene, 31718 |
4529 |
0.2 |
| chrX_60891972_60892372 | 0.37 |
Sox3 |
SRY (sex determining region Y)-box 3 |
1258 |
0.34 |
| chr8_104602539_104603204 | 0.36 |
Cdh16 |
cadherin 16 |
10393 |
0.09 |
| chr2_59674040_59674316 | 0.34 |
Tanc1 |
tetratricopeptide repeat, ankyrin repeat and coiled-coil containing 1 |
27367 |
0.23 |
| chr15_63163951_63164159 | 0.34 |
Gm49013 |
predicted gene, 49013 |
17822 |
0.21 |
| chr4_133887658_133888457 | 0.33 |
Rps6ka1 |
ribosomal protein S6 kinase polypeptide 1 |
260 |
0.86 |
| chr11_117114876_117115708 | 0.32 |
Sec14l1 |
SEC14-like lipid binding 1 |
40 |
0.96 |
| chr17_56159615_56160011 | 0.31 |
Tnfaip8l1 |
tumor necrosis factor, alpha-induced protein 8-like 1 |
2664 |
0.13 |
| chr12_85523165_85523316 | 0.31 |
Gm32296 |
predicted gene, 32296 |
6358 |
0.19 |
| chr19_6951202_6952512 | 0.30 |
Bad |
BCL2-associated agonist of cell death |
1090 |
0.24 |
| chr2_58566508_58567083 | 0.29 |
Acvr1 |
activin A receptor, type 1 |
31 |
0.91 |
| chr12_98741435_98741655 | 0.29 |
Ptpn21 |
protein tyrosine phosphatase, non-receptor type 21 |
4140 |
0.14 |
| chr11_77462226_77462390 | 0.29 |
Coro6 |
coronin 6 |
103 |
0.95 |
| chr8_3493298_3493991 | 0.19 |
Zfp358 |
zinc finger protein 358 |
474 |
0.67 |
| chr1_133205071_133205255 | 0.18 |
Plekha6 |
pleckstrin homology domain containing, family A member 6 |
23842 |
0.15 |
| chr18_68871188_68871762 | 0.17 |
Gm50260 |
predicted gene, 50260 |
66117 |
0.12 |
| chr7_69490938_69491157 | 0.16 |
Gm38584 |
predicted gene, 38584 |
246 |
0.92 |
| chr8_84701108_84701942 | 0.14 |
Lyl1 |
lymphoblastomic leukemia 1 |
19 |
0.95 |
| chr4_133011887_133012661 | 0.14 |
Ahdc1 |
AT hook, DNA binding motif, containing 1 |
70 |
0.97 |
| chr17_37045564_37046927 | 0.12 |
Gabbr1 |
gamma-aminobutyric acid (GABA) B receptor, 1 |
46 |
0.94 |
| chr19_56722198_56722794 | 0.07 |
Adrb1 |
adrenergic receptor, beta 1 |
297 |
0.88 |
| chr13_12461787_12462200 | 0.05 |
Lgals8 |
lectin, galactose binding, soluble 8 |
255 |
0.9 |
| chr13_49308984_49309135 | 0.04 |
Fgd3 |
FYVE, RhoGEF and PH domain containing 3 |
181 |
0.95 |
| chr6_35651521_35651804 | 0.02 |
Gm42931 |
predicted gene 42931 |
35993 |
0.21 |
| chr15_102103920_102104453 | 0.02 |
Tns2 |
tensin 2 |
239 |
0.87 |
| chr1_172632394_172632933 | 0.01 |
Dusp23 |
dual specificity phosphatase 23 |
299 |
0.86 |
| chr10_67284607_67285827 | 0.00 |
Nrbf2 |
nuclear receptor binding factor 2 |
37 |
0.97 |
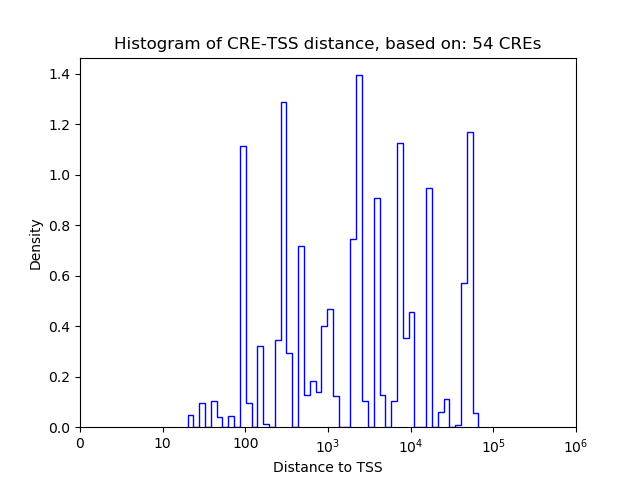
Histogram of CRE-TSS distances for CREs targeted by :
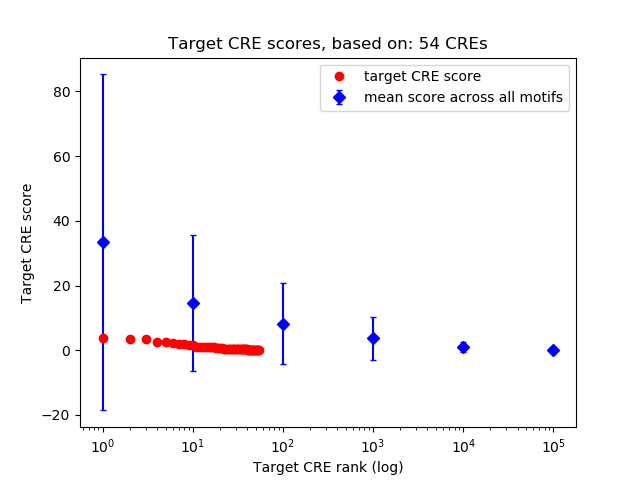
Rank distribution of CRE target scores:
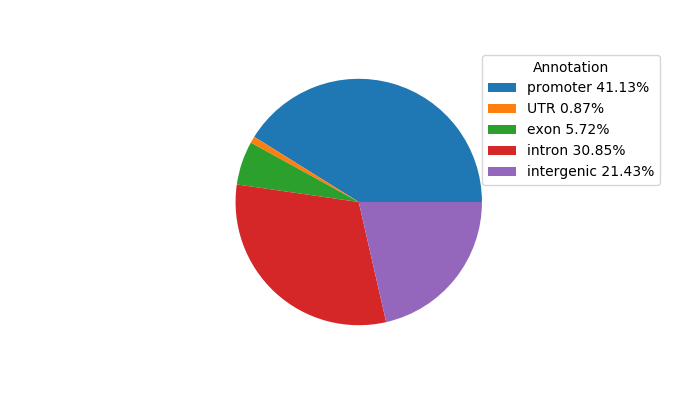
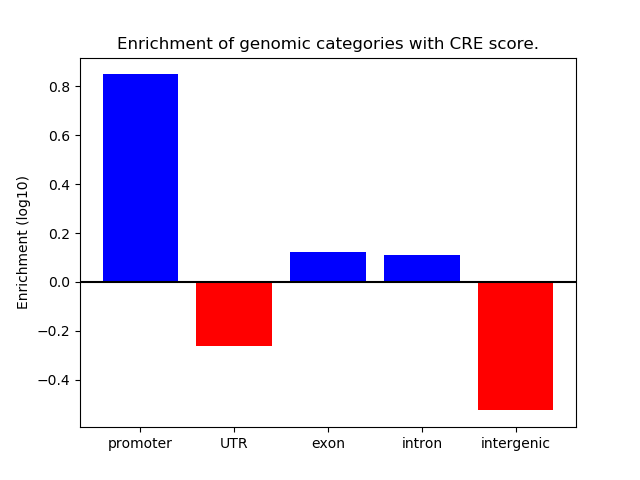
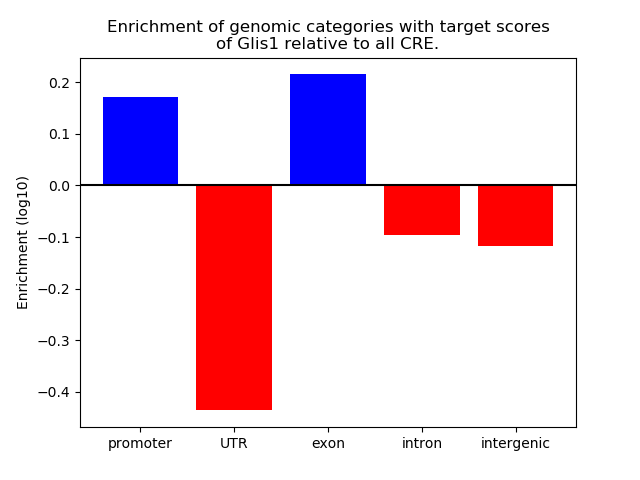
Distribution of target CREs across different genomic regions:
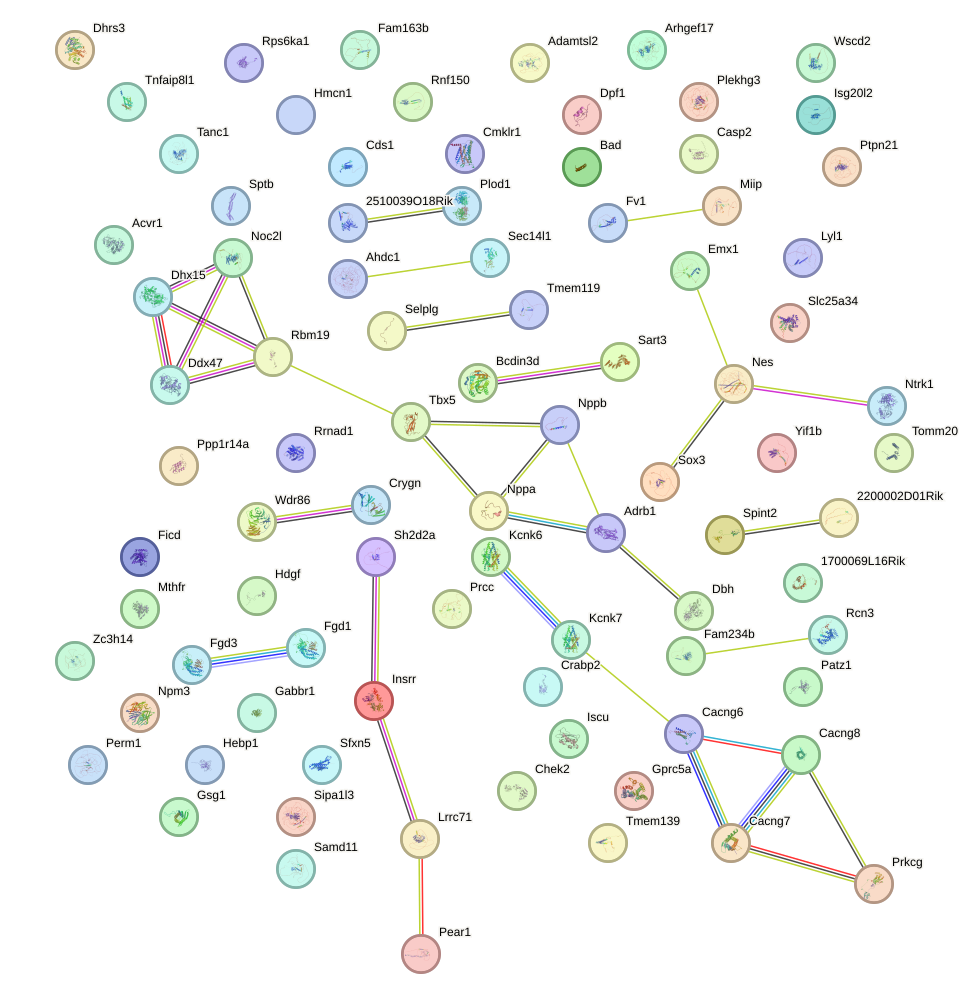
Network of associatons between targets according to the STRING database.
Gene Ontology Analysis
Gene overrepresentation in biological process category:
| Log-likelihood per target | Total log-likelihood | Term | Description |
|---|---|---|---|
| 0.2 | 0.7 | GO:0046341 | CDP-diacylglycerol metabolic process(GO:0046341) |
| 0.1 | 0.6 | GO:0043654 | recognition of apoptotic cell(GO:0043654) |
| 0.1 | 0.3 | GO:0003289 | atrial septum primum morphogenesis(GO:0003289) |
| 0.1 | 0.2 | GO:0010446 | response to alkaline pH(GO:0010446) |
| 0.1 | 0.3 | GO:0039536 | negative regulation of RIG-I signaling pathway(GO:0039536) |
| 0.1 | 0.2 | GO:0061366 | behavioral response to chemical pain(GO:0061366) behavioral response to formalin induced pain(GO:0061368) |
| 0.1 | 0.4 | GO:1903799 | negative regulation of production of miRNAs involved in gene silencing by miRNA(GO:1903799) |
| 0.1 | 0.3 | GO:2000491 | positive regulation of hepatic stellate cell activation(GO:2000491) |
| 0.1 | 0.2 | GO:0015746 | tricarboxylic acid transport(GO:0006842) citrate transport(GO:0015746) |
| 0.0 | 0.1 | GO:0097623 | potassium ion export across plasma membrane(GO:0097623) regulation of potassium ion export(GO:1902302) |
| 0.0 | 0.6 | GO:0010759 | positive regulation of macrophage chemotaxis(GO:0010759) |
| 0.0 | 0.3 | GO:0048387 | negative regulation of retinoic acid receptor signaling pathway(GO:0048387) |
| 0.0 | 0.1 | GO:0014053 | negative regulation of gamma-aminobutyric acid secretion(GO:0014053) |
| 0.0 | 0.1 | GO:0052041 | induction of programmed cell death(GO:0012502) negative regulation by symbiont of host apoptotic process(GO:0033668) positive regulation of apoptotic process in other organism(GO:0044533) negative regulation by symbiont of host programmed cell death(GO:0052041) positive regulation by symbiont of host programmed cell death(GO:0052042) positive regulation by symbiont of host apoptotic process(GO:0052151) positive regulation by organism of programmed cell death in other organism involved in symbiotic interaction(GO:0052330) negative regulation by organism of programmed cell death in other organism involved in symbiotic interaction(GO:0052490) positive regulation by organism of apoptotic process in other organism involved in symbiotic interaction(GO:0052501) positive regulation of apoptotic process by virus(GO:0060139) cellular process regulating host cell cycle in response to virus(GO:0060154) |
| 0.0 | 0.1 | GO:0070827 | chromatin maintenance(GO:0070827) |
| 0.0 | 0.1 | GO:0032066 | nucleolus to nucleoplasm transport(GO:0032066) |
| 0.0 | 0.1 | GO:0002025 | vasodilation by norepinephrine-epinephrine involved in regulation of systemic arterial blood pressure(GO:0002025) positive regulation of renin secretion into blood stream(GO:1900135) |
| 0.0 | 0.1 | GO:0001955 | blood vessel maturation(GO:0001955) |
| 0.0 | 0.1 | GO:0060671 | epithelial cell differentiation involved in embryonic placenta development(GO:0060671) epithelial cell morphogenesis involved in placental branching(GO:0060672) |
| 0.0 | 0.1 | GO:0097428 | protein maturation by iron-sulfur cluster transfer(GO:0097428) |
| 0.0 | 0.2 | GO:0035810 | positive regulation of urine volume(GO:0035810) |
| 0.0 | 0.3 | GO:0090162 | establishment of epithelial cell polarity(GO:0090162) |
| 0.0 | 0.1 | GO:0090085 | regulation of protein deubiquitination(GO:0090085) |
| 0.0 | 0.1 | GO:0097062 | dendritic spine maintenance(GO:0097062) |
| 0.0 | 0.0 | GO:0051891 | positive regulation of cardioblast differentiation(GO:0051891) |
| 0.0 | 1.0 | GO:0035023 | regulation of Rho protein signal transduction(GO:0035023) |
| 0.0 | 0.0 | GO:0070164 | negative regulation of adiponectin secretion(GO:0070164) |
| 0.0 | 0.1 | GO:0018126 | protein hydroxylation(GO:0018126) |
Gene overrepresentation in cellular component category:
| Log-likelihood per target | Total log-likelihood | Term | Description |
|---|---|---|---|
| 0.1 | 0.3 | GO:0048179 | activin receptor complex(GO:0048179) |
| 0.1 | 0.3 | GO:0061689 | tricellular tight junction(GO:0061689) |
| 0.0 | 0.1 | GO:0071008 | U2-type post-mRNA release spliceosomal complex(GO:0071008) |
| 0.0 | 0.6 | GO:0001891 | phagocytic cup(GO:0001891) |
| 0.0 | 0.1 | GO:0038037 | G-protein coupled receptor dimeric complex(GO:0038037) G-protein coupled receptor complex(GO:0097648) |
| 0.0 | 0.1 | GO:0071001 | U4/U6 snRNP(GO:0071001) |
| 0.0 | 0.1 | GO:0042629 | mast cell granule(GO:0042629) |
| 0.0 | 0.1 | GO:0030689 | Noc complex(GO:0030689) |
| 0.0 | 0.1 | GO:0008091 | spectrin(GO:0008091) |
Gene overrepresentation in molecular function category:
| Log-likelihood per target | Total log-likelihood | Term | Description |
|---|---|---|---|
| 0.2 | 0.7 | GO:0004605 | phosphatidate cytidylyltransferase activity(GO:0004605) |
| 0.1 | 0.3 | GO:0052650 | NADP-retinol dehydrogenase activity(GO:0052650) |
| 0.1 | 0.3 | GO:0016361 | activin receptor activity, type I(GO:0016361) |
| 0.1 | 0.2 | GO:0015137 | citrate transmembrane transporter activity(GO:0015137) tricarboxylic acid transmembrane transporter activity(GO:0015142) |
| 0.1 | 0.2 | GO:0005030 | neurotrophin receptor activity(GO:0005030) |
| 0.0 | 0.1 | GO:0008475 | procollagen-lysine 5-dioxygenase activity(GO:0008475) |
| 0.0 | 0.1 | GO:0004965 | G-protein coupled GABA receptor activity(GO:0004965) |
| 0.0 | 0.2 | GO:0031730 | CCR5 chemokine receptor binding(GO:0031730) |
| 0.0 | 0.2 | GO:0043560 | insulin receptor substrate binding(GO:0043560) |
| 0.0 | 0.1 | GO:0004939 | beta-adrenergic receptor activity(GO:0004939) |
| 0.0 | 0.1 | GO:0042731 | PH domain binding(GO:0042731) |
| 0.0 | 0.3 | GO:0051428 | peptide hormone receptor binding(GO:0051428) |
| 0.0 | 0.1 | GO:0031493 | nucleosomal histone binding(GO:0031493) |
| 0.0 | 1.0 | GO:0005089 | Rho guanyl-nucleotide exchange factor activity(GO:0005089) |
| 0.0 | 0.0 | GO:0071553 | uridine nucleotide receptor activity(GO:0015065) G-protein coupled pyrimidinergic nucleotide receptor activity(GO:0071553) |
| 0.0 | 0.0 | GO:0030943 | mitochondrion targeting sequence binding(GO:0030943) |
| 0.0 | 0.3 | GO:0043027 | cysteine-type endopeptidase inhibitor activity involved in apoptotic process(GO:0043027) |
| 0.0 | 0.0 | GO:0004724 | magnesium-dependent protein serine/threonine phosphatase activity(GO:0004724) [pyruvate dehydrogenase (lipoamide)] phosphatase activity(GO:0004741) |
| 0.0 | 0.1 | GO:1990381 | ubiquitin-specific protease binding(GO:1990381) |
Gene overrepresentation in curated gene sets: canonical pathways category:
| Log-likelihood per target | Total log-likelihood | Term | Description |
|---|---|---|---|
| 0.0 | 0.3 | PID ALK2 PATHWAY | ALK2 signaling events |
| 0.0 | 0.2 | SA TRKA RECEPTOR | The TrkA receptor binds nerve growth factor to activate MAP kinase pathways and promote cell growth. |
| 0.0 | 0.6 | NABA BASEMENT MEMBRANES | Genes encoding structural components of basement membranes |
| 0.0 | 0.4 | PID CDC42 REG PATHWAY | Regulation of CDC42 activity |
| 0.0 | 0.3 | SA B CELL RECEPTOR COMPLEXES | Antigen binding to B cell receptors activates protein tyrosine kinases, such as the Src family, which ultimate activate MAP kinases. |
Gene overrepresentation in curated gene sets: REACTOME pathways category:
| Log-likelihood per target | Total log-likelihood | Term | Description |
|---|---|---|---|
| 0.0 | 0.3 | REACTOME RECYCLING PATHWAY OF L1 | Genes involved in Recycling pathway of L1 |
| 0.0 | 0.2 | REACTOME RETROGRADE NEUROTROPHIN SIGNALLING | Genes involved in Retrograde neurotrophin signalling |
| 0.0 | 0.8 | REACTOME NRAGE SIGNALS DEATH THROUGH JNK | Genes involved in NRAGE signals death through JNK |