Project
ENCODE: ATAC-seq of different tissues during embryonic development
Navigation
Downloads
CREMA is a free online tool that recognizes most
important transcription factors that change the chromatin
state across different samples.
Results for Msx1_Lhx9_Barx1_Rax_Dlx6
Z-value: 0.16
Motif logo
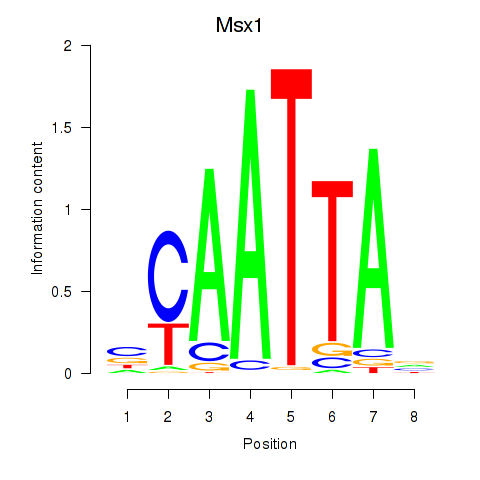
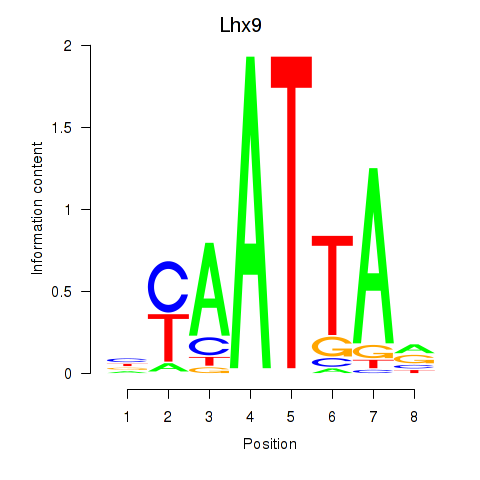
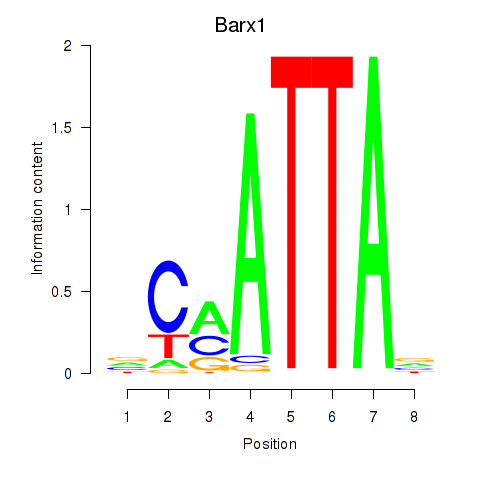

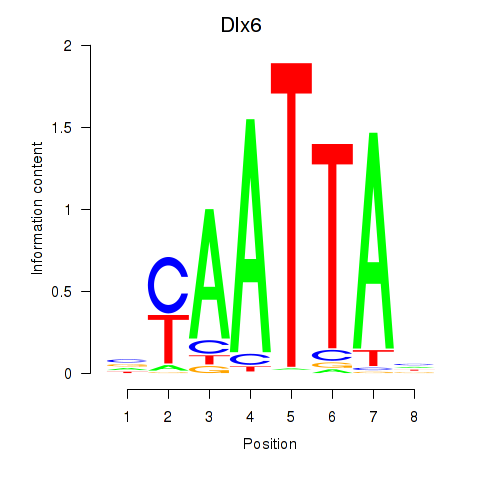
Transcription factors associated with Msx1_Lhx9_Barx1_Rax_Dlx6
| Gene Symbol | Gene ID | Gene Info |
|---|---|---|
|
Msx1
|
ENSMUSG00000048450.10 | Msx1 |
|
Lhx9
|
ENSMUSG00000019230.8 | Lhx9 |
|
Barx1
|
ENSMUSG00000021381.4 | Barx1 |
|
Rax
|
ENSMUSG00000024518.3 | Rax |
|
Dlx6
|
ENSMUSG00000029754.7 | Dlx6 |
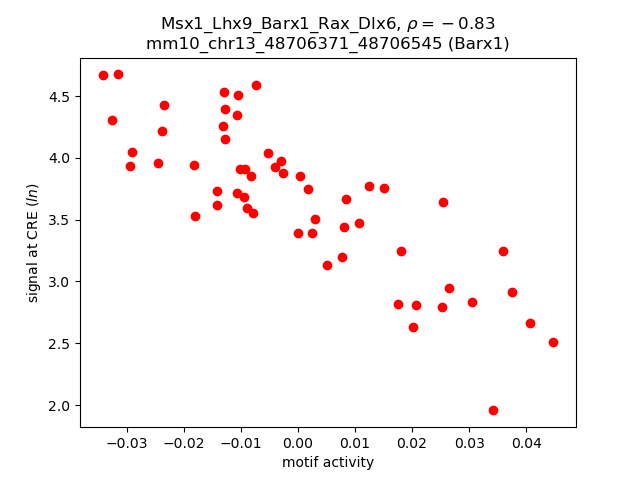
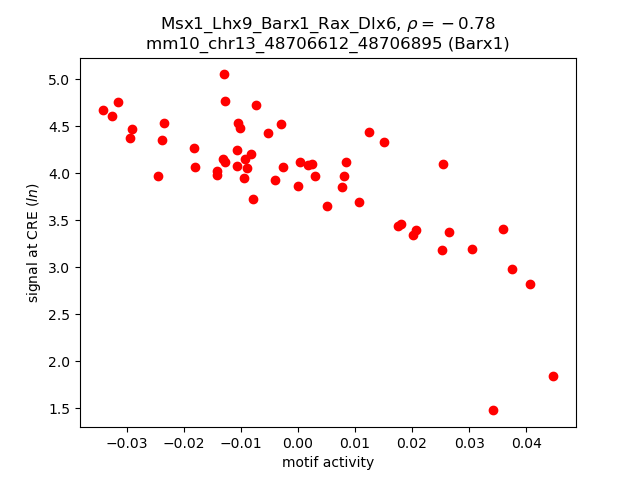
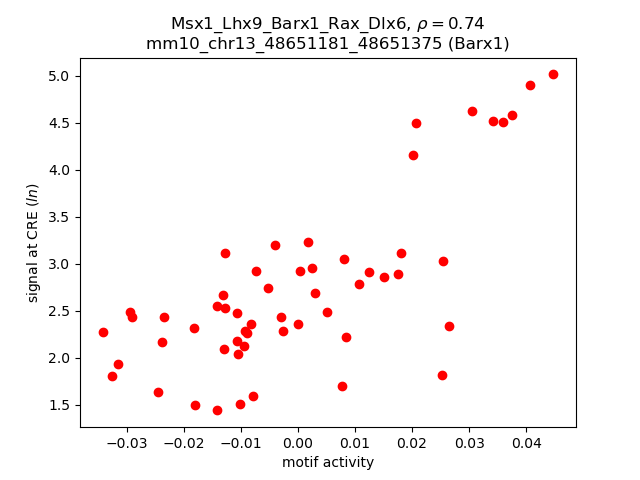
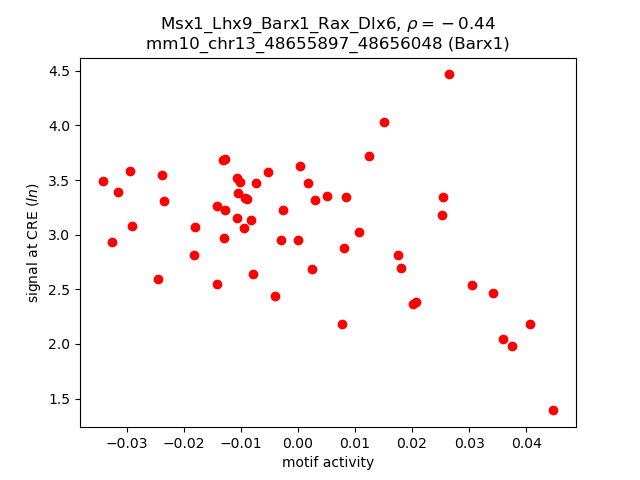
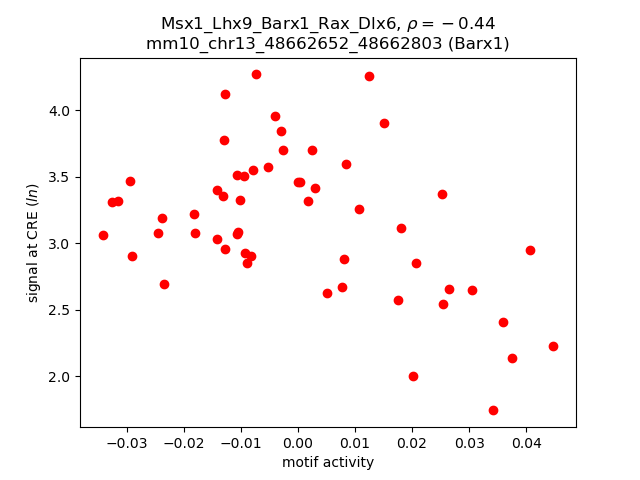
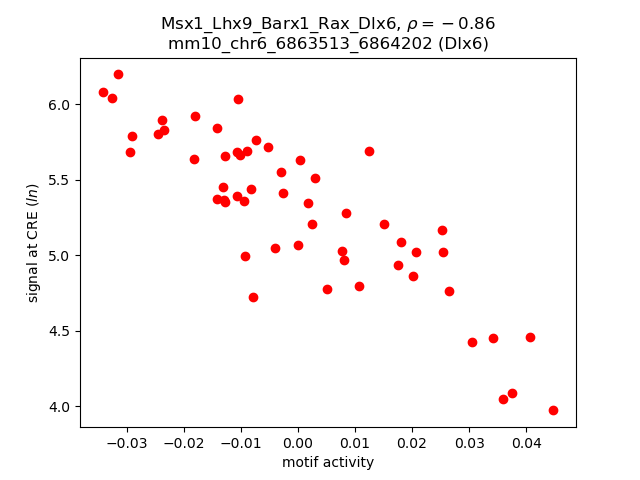
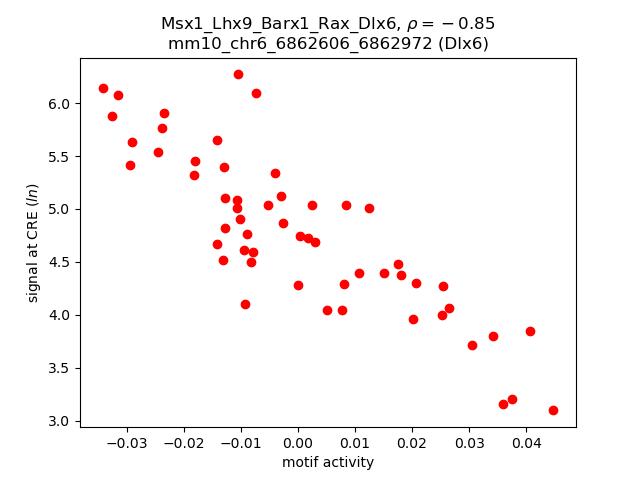
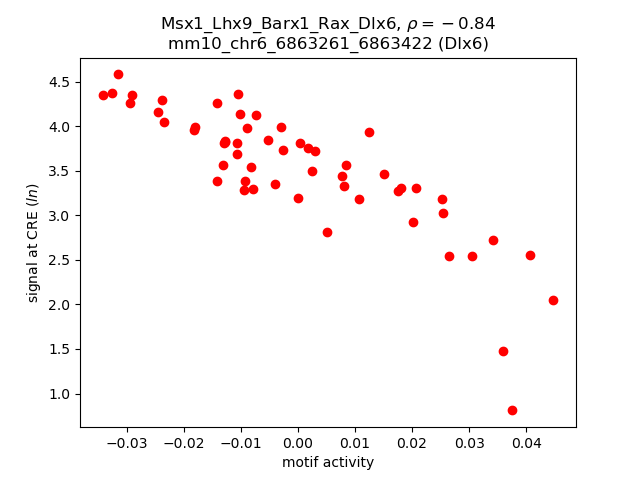
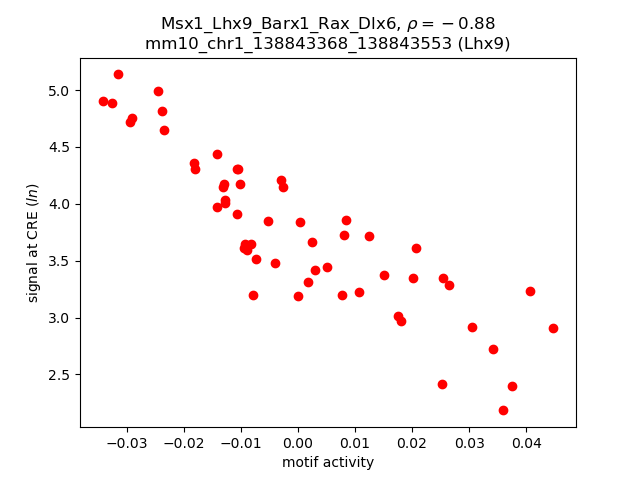
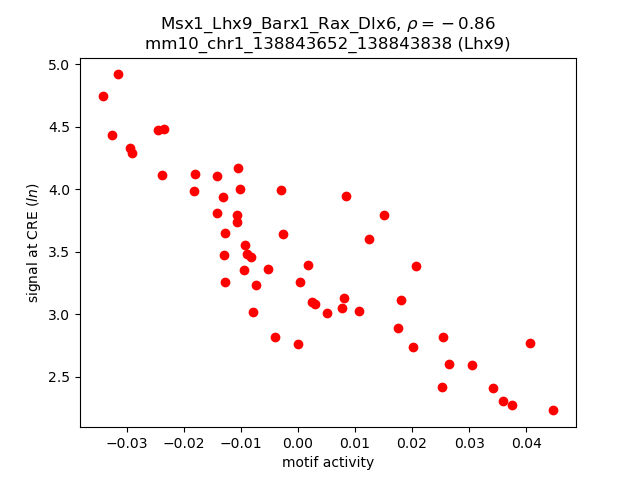
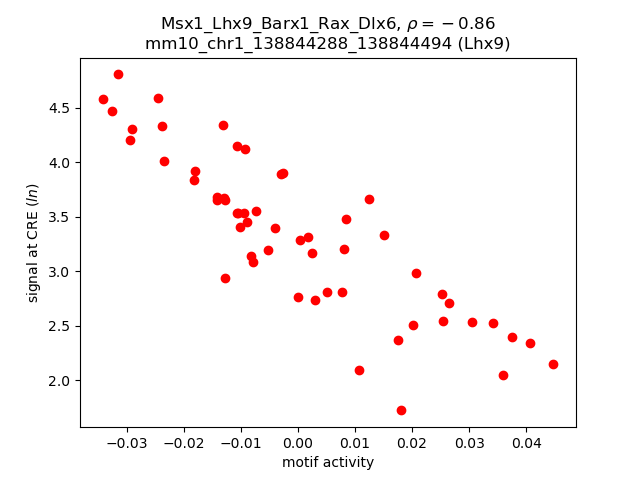
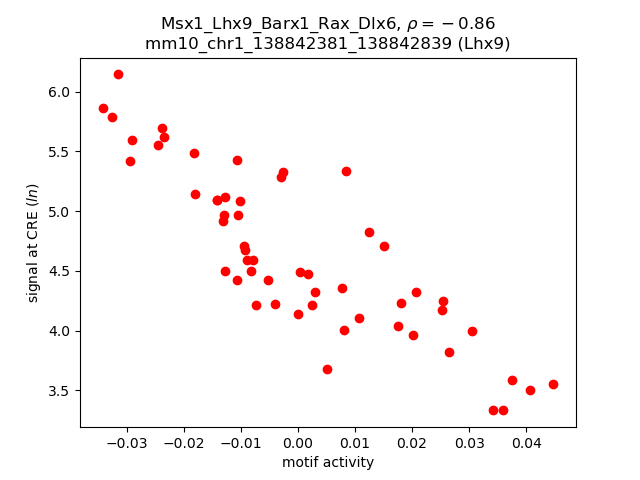
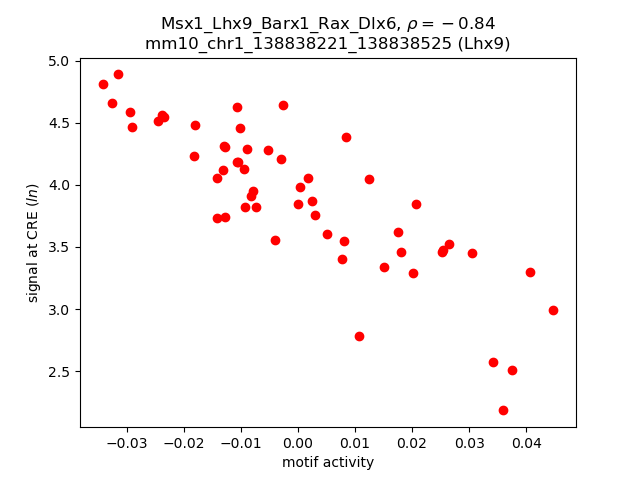
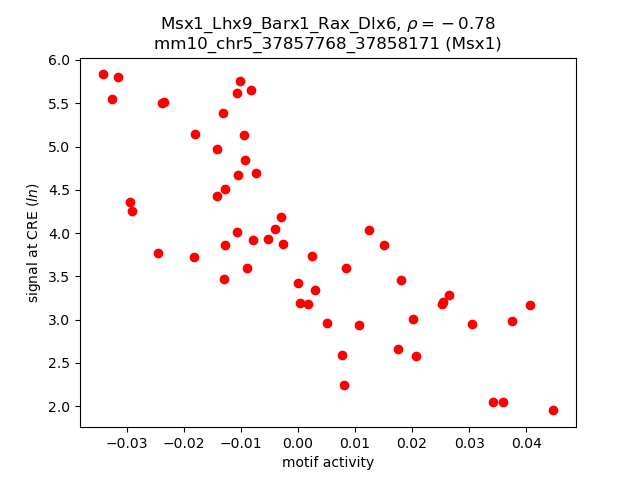
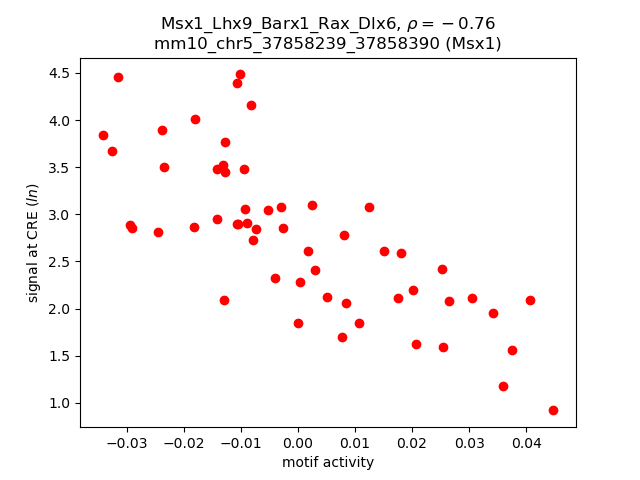
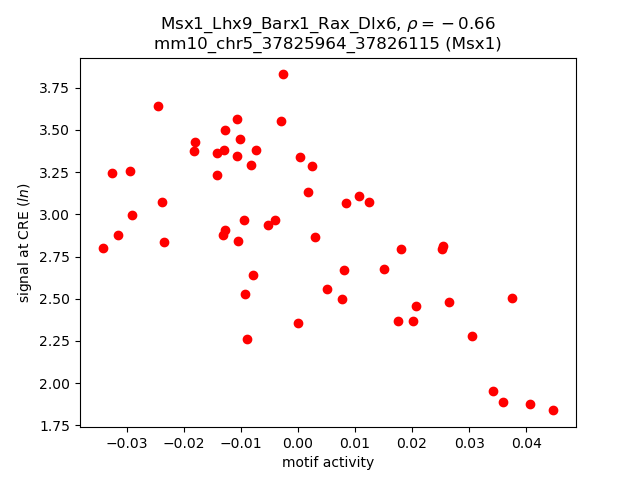
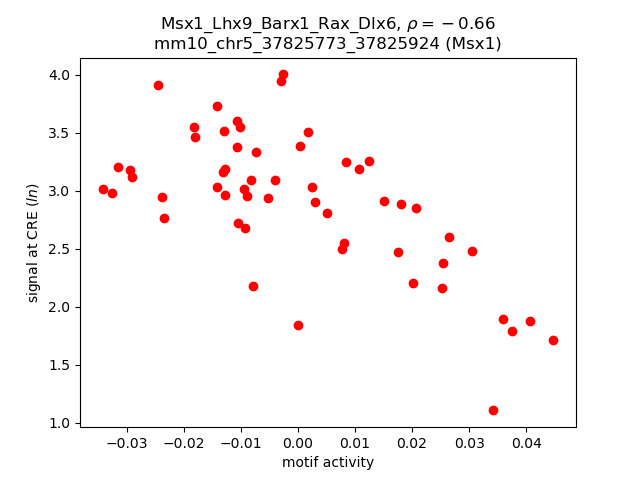
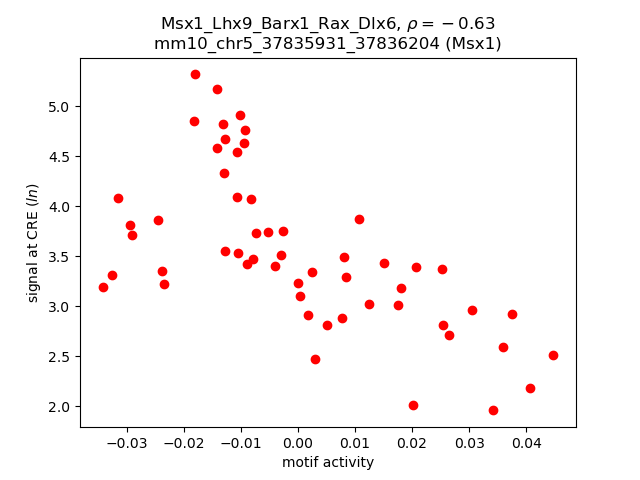
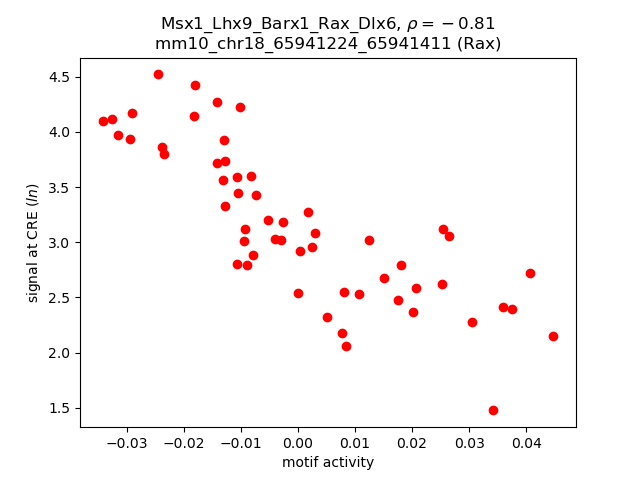
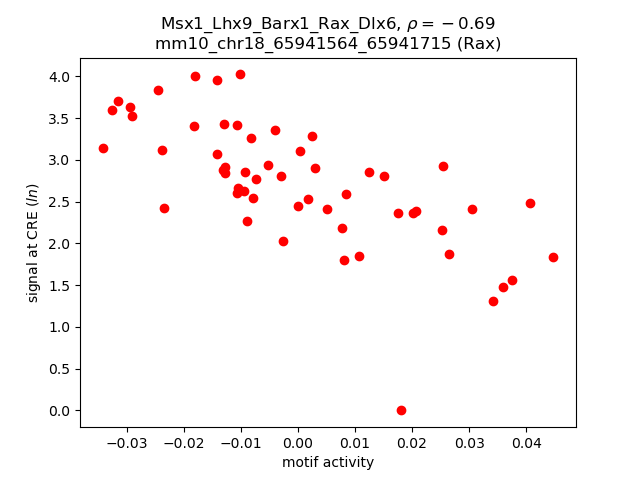
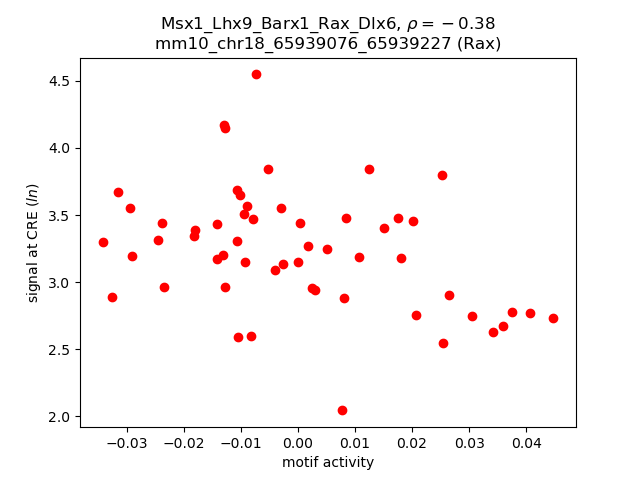
Correlations of motif activity and signal intensity at CREs associated with the motif's TFs:
This plot shows correlation between observed signal intensity of a CRE associated with the transcription factor across all samples and activity of the motif.
For each TF, only the top 5 correlated CREs are shown.
| CRE | Gene | Distance | Association probability | Pearson corr. coef. | P-value | Plot |
|---|---|---|---|---|---|---|
| Barx1 | chr13_48706371_48706545 | 43460 | 0.123879 | -0.83 | 4.8e-15 | Click! |
| Barx1 | chr13_48706612_48706895 | 43755 | 0.123283 | -0.78 | 1.5e-12 | Click! |
| Barx1 | chr13_48651181_48651375 | 11720 | 0.156451 | 0.74 | 9.8e-11 | Click! |
| Barx1 | chr13_48655897_48656048 | 7026 | 0.173591 | -0.44 | 7.4e-04 | Click! |
| Barx1 | chr13_48662652_48662803 | 271 | 0.907584 | -0.44 | 8.1e-04 | Click! |
| Dlx6 | chr6_6863513_6864202 | 59 | 0.941369 | -0.86 | 2.7e-17 | Click! |
| Dlx6 | chr6_6862606_6862972 | 545 | 0.573597 | -0.85 | 1.8e-16 | Click! |
| Dlx6 | chr6_6863261_6863422 | 7 | 0.951842 | -0.84 | 6.4e-16 | Click! |
| Lhx9 | chr1_138843368_138843553 | 1003 | 0.465486 | -0.88 | 1.4e-18 | Click! |
| Lhx9 | chr1_138843652_138843838 | 1288 | 0.372745 | -0.86 | 2.6e-17 | Click! |
| Lhx9 | chr1_138844288_138844494 | 1934 | 0.260897 | -0.86 | 4.8e-17 | Click! |
| Lhx9 | chr1_138842381_138842839 | 153 | 0.941699 | -0.86 | 7.9e-17 | Click! |
| Lhx9 | chr1_138838221_138838525 | 4056 | 0.177077 | -0.84 | 6.9e-16 | Click! |
| Msx1 | chr5_37857768_37858171 | 33386 | 0.148481 | -0.78 | 1.8e-12 | Click! |
| Msx1 | chr5_37858239_37858390 | 33731 | 0.147626 | -0.76 | 2.1e-11 | Click! |
| Msx1 | chr5_37825964_37826115 | 1456 | 0.428088 | -0.66 | 3.7e-08 | Click! |
| Msx1 | chr5_37825773_37825924 | 1265 | 0.476529 | -0.66 | 5.2e-08 | Click! |
| Msx1 | chr5_37835931_37836204 | 11484 | 0.196045 | -0.63 | 2.2e-07 | Click! |
| Rax | chr18_65941224_65941411 | 1530 | 0.220482 | -0.81 | 6.2e-14 | Click! |
| Rax | chr18_65941564_65941715 | 1852 | 0.184228 | -0.69 | 5.3e-09 | Click! |
| Rax | chr18_65939076_65939227 | 45 | 0.939697 | -0.38 | 4.2e-03 | Click! |
Activity of the Msx1_Lhx9_Barx1_Rax_Dlx6 motif across conditions
Conditions sorted by the z-value of the Msx1_Lhx9_Barx1_Rax_Dlx6 motif activity
Move your cursor over a bar to see sample name and corresponding Z-value.
Top target CREs of the motif:
| Cis Regulatory Element (CRE) | Target Score | Top associated gene | Gene Info | Distance of CRE to TSS | CRE/Gene association probability |
|---|---|---|---|---|---|
| chr17_71268038_71268559 | 0.30 |
Emilin2 |
elastin microfibril interfacer 2 |
299 |
0.88 |
| chr4_59292306_59292644 | 0.28 |
Susd1 |
sushi domain containing 1 |
23491 |
0.17 |
| chr5_33542035_33542598 | 0.24 |
Fam53a |
family with sequence similarity 53, member A |
86596 |
0.05 |
| chr1_165765728_165766269 | 0.24 |
Creg1 |
cellular repressor of E1A-stimulated genes 1 |
2252 |
0.15 |
| chr11_107337855_107338006 | 0.20 |
Gm11716 |
predicted gene 11716 |
120 |
0.72 |
| chr15_97229797_97229962 | 0.20 |
Pced1b |
PC-esterase domain containing 1B |
17228 |
0.19 |
| chr13_104285003_104285221 | 0.18 |
Adamts6 |
a disintegrin-like and metallopeptidase (reprolysin type) with thrombospondin type 1 motif, 6 |
2723 |
0.29 |
| chr13_90844052_90844203 | 0.18 |
Gm18518 |
predicted gene, 18518 |
23479 |
0.19 |
| chr6_120579566_120580923 | 0.17 |
Gm44124 |
predicted gene, 44124 |
68 |
0.96 |
| chr10_105423144_105423438 | 0.16 |
Gm48203 |
predicted gene, 48203 |
29005 |
0.15 |
| chr1_191592063_191592214 | 0.15 |
Gm37349 |
predicted gene, 37349 |
5509 |
0.16 |
| chr5_137981681_137981832 | 0.15 |
Azgp1 |
alpha-2-glycoprotein 1, zinc |
188 |
0.88 |
| chr2_6098764_6098915 | 0.14 |
Proser2 |
proline and serine rich 2 |
31300 |
0.13 |
| chr18_84858298_84858518 | 0.14 |
Gm16146 |
predicted gene 16146 |
1139 |
0.43 |
| chr5_86065496_86065926 | 0.13 |
Cenpc1 |
centromere protein C1 |
128 |
0.92 |
| chr6_72109263_72109487 | 0.13 |
Gm29438 |
predicted gene 29438 |
5174 |
0.13 |
| chr12_71854387_71854538 | 0.12 |
Gm7985 |
predicted gene 7985 |
7171 |
0.22 |
| chr15_10685814_10686120 | 0.12 |
Rai14 |
retinoic acid induced 14 |
27573 |
0.16 |
| chr2_128565979_128566130 | 0.09 |
Gm14006 |
predicted gene 14006 |
7820 |
0.14 |
| chr12_116938001_116938505 | 0.09 |
Gm48119 |
predicted gene, 48119 |
85151 |
0.1 |
| chr15_102999185_102999572 | 0.09 |
Hoxc6 |
homeobox C6 |
1121 |
0.27 |
| chr9_93186720_93187149 | 0.08 |
1700034K08Rik |
RIKEN cDNA 1700034K08 gene |
181195 |
0.03 |
| chr3_141952957_141953255 | 0.08 |
Bmpr1b |
bone morphogenetic protein receptor, type 1B |
21583 |
0.27 |
| chr5_100199218_100199369 | 0.08 |
Gm9932 |
predicted gene 9932 |
2682 |
0.25 |
| chr15_99130441_99130592 | 0.07 |
Gm25183 |
predicted gene, 25183 |
2656 |
0.15 |
| chr11_19941233_19941710 | 0.06 |
Spred2 |
sprouty-related EVH1 domain containing 2 |
13099 |
0.26 |
| chr7_45216791_45217034 | 0.05 |
Tead2 |
TEA domain family member 2 |
239 |
0.77 |
| chr18_67536356_67536550 | 0.04 |
Spire1 |
spire type actin nucleation factor 1 |
12799 |
0.16 |
| chr8_77251232_77251390 | 0.04 |
Gm45406 |
predicted gene 45406 |
31550 |
0.15 |
| chr6_39455848_39456029 | 0.04 |
Dennd2a |
DENN/MADD domain containing 2A |
14386 |
0.13 |
| chr14_121383859_121384181 | 0.04 |
Gm49031 |
predicted gene, 49031 |
1936 |
0.33 |
| chr8_47036614_47036956 | 0.03 |
4930579M01Rik |
RIKEN cDNA 4930579M01 gene |
1392 |
0.42 |
| chr7_116092643_116093012 | 0.03 |
1700003G18Rik |
RIKEN cDNA 1700003G18 gene |
271 |
0.66 |
| chr7_101896553_101896858 | 0.03 |
Anapc15 |
anaphase promoting complex C subunit 15 |
158 |
0.89 |
| chr13_91128573_91128974 | 0.03 |
Atg10 |
autophagy related 10 |
3163 |
0.34 |
| chr12_21286763_21286960 | 0.03 |
Cpsf3 |
cleavage and polyadenylation specificity factor 3 |
462 |
0.45 |
| chr2_94002409_94002585 | 0.03 |
Alkbh3 |
alkB homolog 3, alpha-ketoglutarate-dependent dioxygenase |
2690 |
0.21 |
| chr5_49813468_49813730 | 0.03 |
Gm7988 |
predicted gene 7988 |
88703 |
0.09 |
| chr12_112948465_112948616 | 0.02 |
Gm26583 |
predicted gene, 26583 |
1972 |
0.16 |
| chr1_63995942_63996104 | 0.01 |
Gm13749 |
predicted gene 13749 |
31296 |
0.16 |
| chr16_87597580_87598021 | 0.00 |
Gm22808 |
predicted gene, 22808 |
23320 |
0.15 |
| chr6_148831698_148831943 | 0.00 |
Ipo8 |
importin 8 |
353 |
0.47 |
| chr11_97702477_97703034 | 0.00 |
Psmb3 |
proteasome (prosome, macropain) subunit, beta type 3 |
644 |
0.45 |
| chr2_3764227_3764378 | 0.00 |
Fam107b |
family with sequence similarity 107, member B |
6406 |
0.19 |
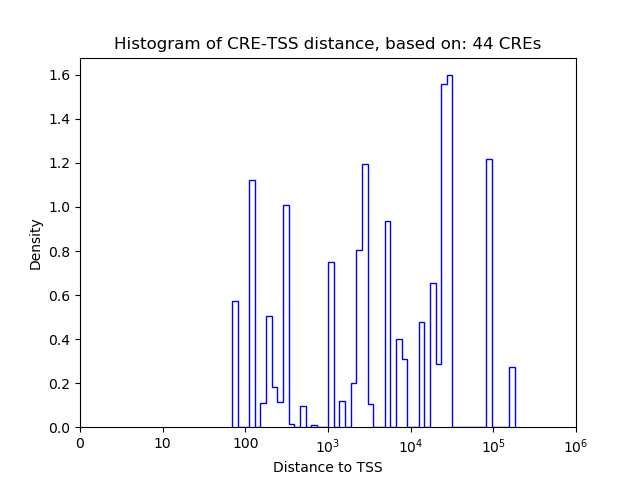
Histogram of CRE-TSS distances for CREs targeted by :
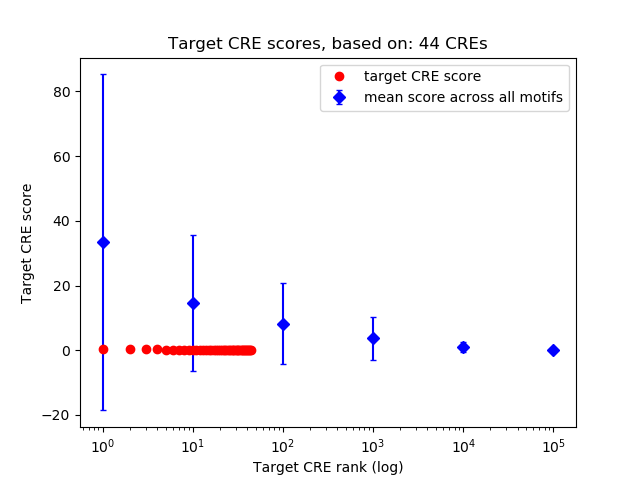
Rank distribution of CRE target scores:
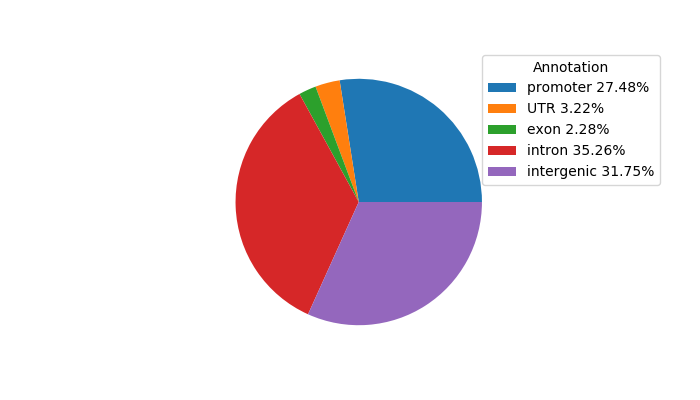
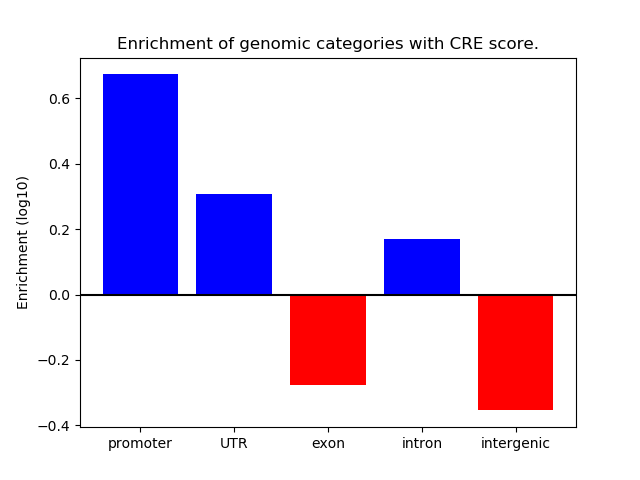
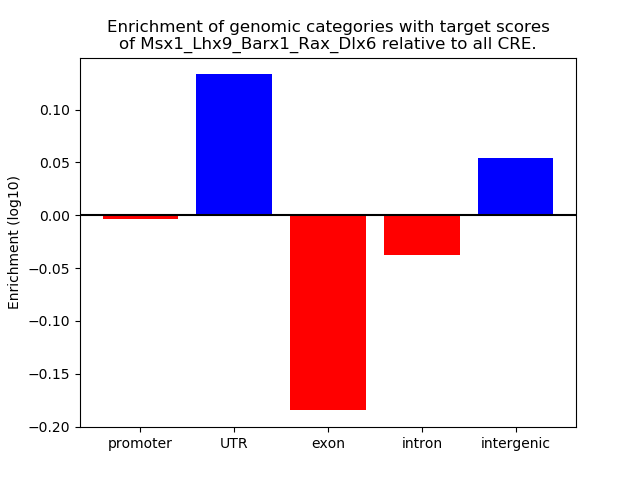
Distribution of target CREs across different genomic regions:
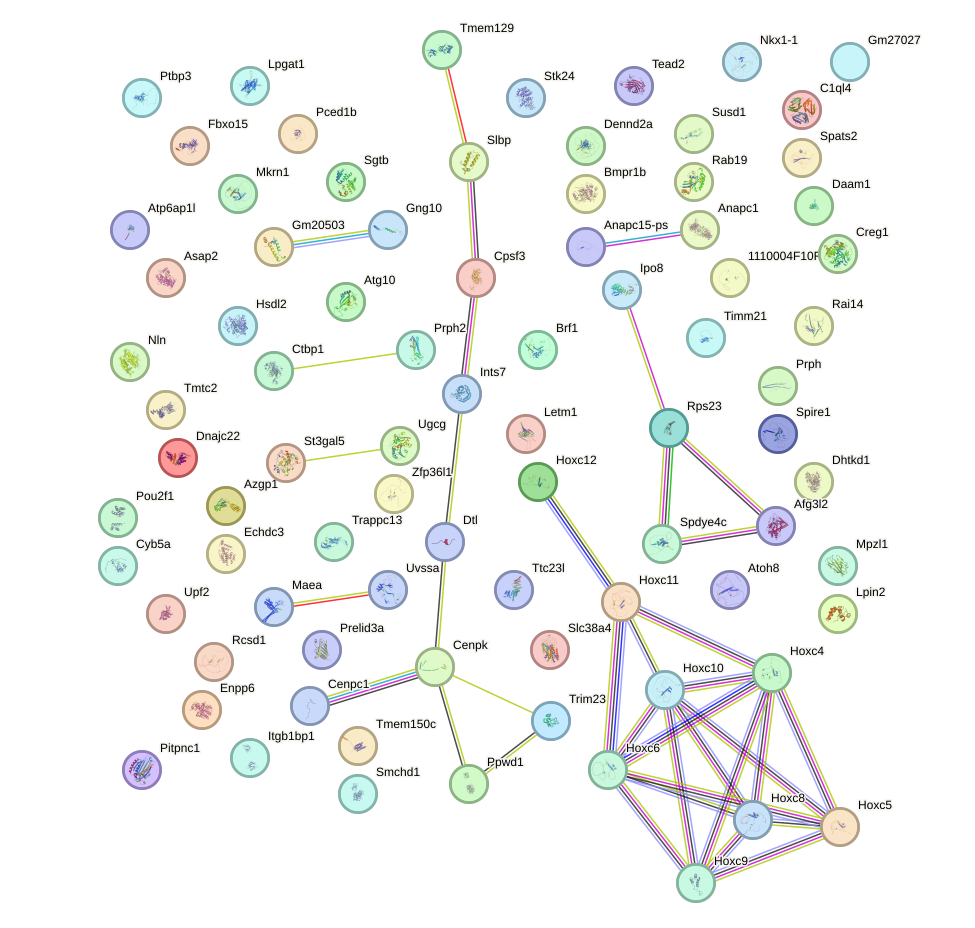
Network of associatons between targets according to the STRING database.
Gene Ontology Analysis
Gene overrepresentation in biological process category:
| Log-likelihood per target | Total log-likelihood | Term | Description |
|---|---|---|---|
| 0.0 | 0.1 | GO:0051382 | kinetochore assembly(GO:0051382) |
Gene overrepresentation in cellular component category:
| Log-likelihood per target | Total log-likelihood | Term | Description |
|---|---|---|---|
| 0.0 | 0.1 | GO:0042612 | MHC class I protein complex(GO:0042612) |
Gene overrepresentation in molecular function category:
| Log-likelihood per target | Total log-likelihood | Term | Description |
|---|---|---|---|
| 0.0 | 0.1 | GO:0019237 | centromeric DNA binding(GO:0019237) |