Project
ENCSR904DTN: DNase-seq of mouse liver in constant darkness
Navigation
Downloads

Results for Glis1
Z-value: 0.32
Motif logo
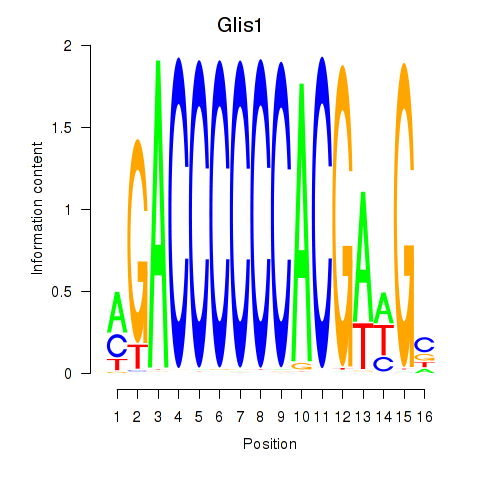
Transcription factors associated with Glis1
| Gene Symbol | Gene ID | Gene Info |
|---|---|---|
|
Glis1
|
ENSMUSG00000034762.3 | GLIS family zinc finger 1 |
Correlations of motif activity and signal intensity at CREs associated with the motif's TFs:
This plot shows correlation between observed signal intensity of a CRE associated with the transcription factor across all samples and activity of the motif.
For each TF, only the top 5 correlated CREs are shown.
| CRE | Gene | Distance | Association probability | Pearson corr. coef. | P-value | Plot |
|---|---|---|---|---|---|---|
| chr4_107453720_107453880 | Glis1 | 14802 | 0.165999 | -0.86 | 2.7e-02 | Click! |
| chr4_107637784_107637943 | Glis1 | 22863 | 0.135560 | -0.24 | 6.4e-01 | Click! |
| chr4_107617669_107617841 | Glis1 | 2755 | 0.258146 | 0.23 | 6.6e-01 | Click! |
| chr4_107597307_107597488 | Glis1 | 16194 | 0.184274 | 0.07 | 9.0e-01 | Click! |
Activity of the Glis1 motif across conditions
Conditions sorted by the z-value of the Glis1 motif activity
Move your cursor over a bar to see sample name and corresponding Z-value.
Top target CREs of the motif:
| Cis Regulatory Element (CRE) | Target Score | Top associated gene | Gene Info | Distance of CRE to TSS | CRE/Gene association probability |
|---|---|---|---|---|---|
| chr2_25453352_25453548 | 0.88 |
Clic3 |
chloride intracellular channel 3 |
3388 |
0.09 |
| chr12_112977056_112977207 | 0.62 |
Btbd6 |
BTB (POZ) domain containing 6 |
185 |
0.88 |
| chr6_89239871_89240105 | 0.45 |
Gm25961 |
predicted gene, 25961 |
9614 |
0.13 |
| chrX_101419042_101419230 | 0.24 |
Zmym3 |
zinc finger, MYM-type 3 |
662 |
0.61 |
| chr13_52928944_52929562 | 0.24 |
Auh |
AU RNA binding protein/enoyl-coenzyme A hydratase |
205 |
0.95 |
| chr2_158095379_158095534 | 0.19 |
2010009K17Rik |
RIKEN cDNA 2010009K17 gene |
3659 |
0.19 |
| chr16_38088370_38088613 | 0.10 |
Gsk3b |
glycogen synthase kinase 3 beta |
510 |
0.83 |
| chr14_66009383_66009534 | 0.08 |
Gulo |
gulonolactone (L-) oxidase |
251 |
0.91 |
| chr6_85254139_85254316 | 0.04 |
Sfxn5 |
sideroflexin 5 |
10706 |
0.16 |
| chr9_120933701_120933852 | 0.04 |
Ctnnb1 |
catenin (cadherin associated protein), beta 1 |
42 |
0.95 |
| chr2_23069288_23069457 | 0.03 |
Acbd5 |
acyl-Coenzyme A binding domain containing 5 |
45 |
0.97 |
| chr18_67724603_67724771 | 0.02 |
Ptpn2 |
protein tyrosine phosphatase, non-receptor type 2 |
92 |
0.97 |
| chr9_96437861_96438072 | 0.02 |
BC043934 |
cDNA sequence BC043934 |
172 |
0.94 |
| chr11_117202535_117202686 | 0.01 |
Septin9 |
septin 9 |
2949 |
0.23 |
| chr6_38345915_38346090 | 0.01 |
Zc3hav1 |
zinc finger CCCH type, antiviral 1 |
8271 |
0.13 |
| chr6_138075559_138075718 | 0.00 |
Slc15a5 |
solute carrier family 15, member 5 |
2442 |
0.4 |
| chr15_99474388_99474557 | 0.00 |
Bcdin3d |
BCDIN3 domain containing |
236 |
0.86 |
| chr8_126903632_126903783 | 0.00 |
Gm31718 |
predicted gene, 31718 |
4508 |
0.2 |
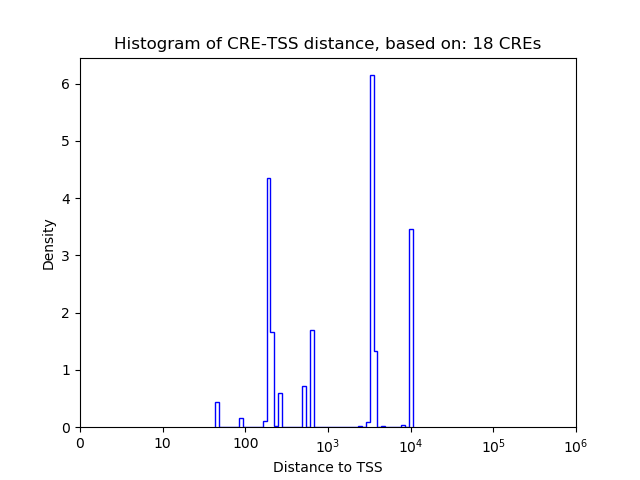
Histogram of CRE-TSS distances for CREs targeted by :
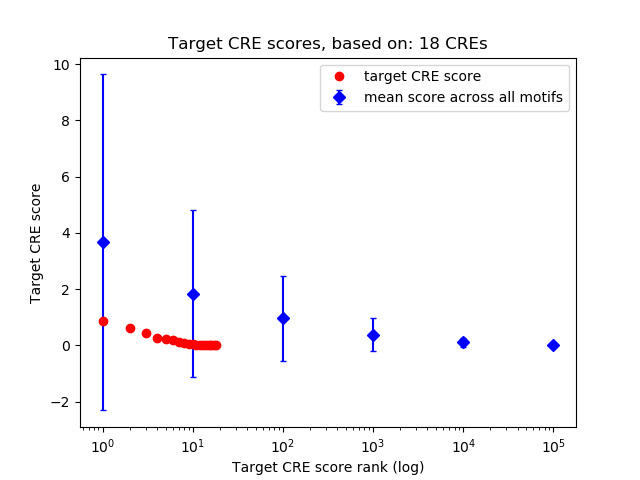
Rank distribution of CRE target scores:
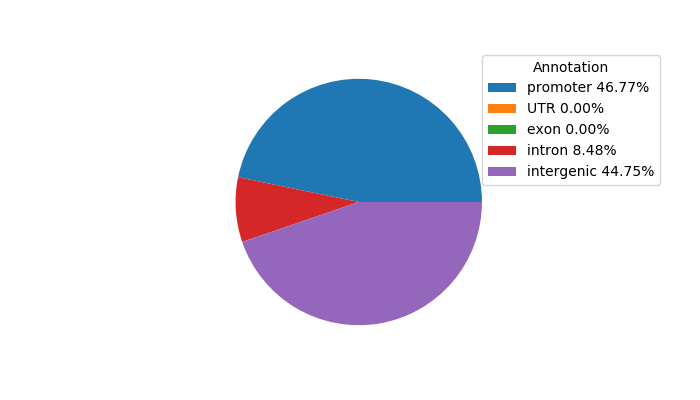
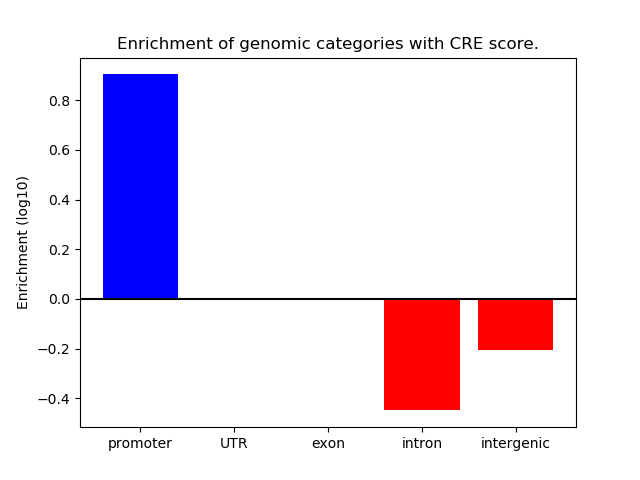
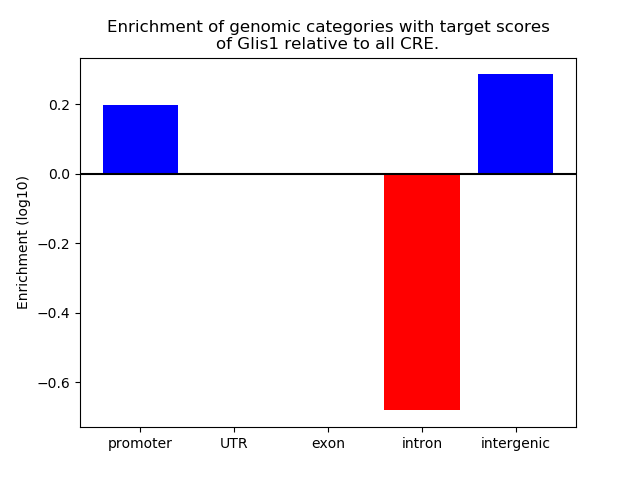
Distribution of target CREs across different genomic regions:
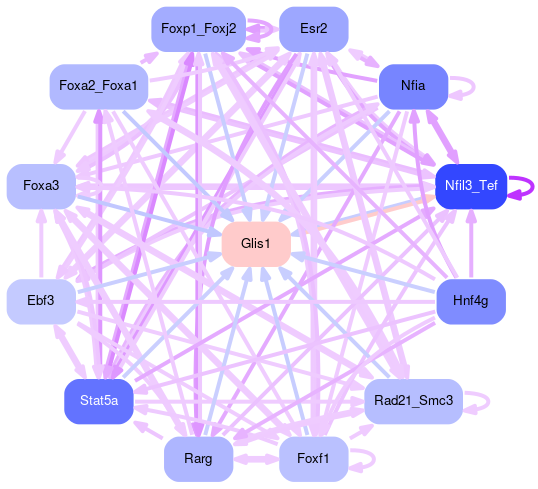
Network of associatons between targets according to the STRING database.

Gene Ontology Analysis
Gene overrepresentation in biological process category:
| Log-likelihood per target | Total log-likelihood | Term | Description |
|---|---|---|---|
| 0.0 | 0.1 | GO:0044337 | canonical Wnt signaling pathway involved in positive regulation of apoptotic process(GO:0044337) negative regulation of dopaminergic neuron differentiation(GO:1904339) |
| 0.0 | 0.2 | GO:0009083 | branched-chain amino acid catabolic process(GO:0009083) |
| 0.0 | 0.1 | GO:0032380 | regulation of intracellular lipid transport(GO:0032377) regulation of intracellular sterol transport(GO:0032380) regulation of intracellular cholesterol transport(GO:0032383) |
| 0.0 | 0.1 | GO:0019853 | L-ascorbic acid biosynthetic process(GO:0019853) |
| 0.0 | 0.1 | GO:2000255 | negative regulation of male germ cell proliferation(GO:2000255) |
| 0.0 | 0.0 | GO:0003340 | negative regulation of mesenchymal to epithelial transition involved in metanephros morphogenesis(GO:0003340) |
Gene overrepresentation in cellular component category:
| Log-likelihood per target | Total log-likelihood | Term | Description |
|---|---|---|---|
| 0.0 | 0.1 | GO:1990909 | Wnt signalosome(GO:1990909) |
| 0.0 | 0.6 | GO:0019005 | SCF ubiquitin ligase complex(GO:0019005) |
Gene overrepresentation in molecular function category:
| Log-likelihood per target | Total log-likelihood | Term | Description |
|---|---|---|---|
| 0.0 | 0.2 | GO:0004300 | enoyl-CoA hydratase activity(GO:0004300) |
| 0.0 | 0.1 | GO:0016899 | oxidoreductase activity, acting on the CH-OH group of donors, oxygen as acceptor(GO:0016899) |
| 0.0 | 0.1 | GO:0004667 | prostaglandin-D synthase activity(GO:0004667) |
| 0.0 | 0.0 | GO:1990188 | euchromatin binding(GO:1990188) |
Gene overrepresentation in curated gene sets: REACTOME pathways category:
| Log-likelihood per target | Total log-likelihood | Term | Description |
|---|---|---|---|
| 0.0 | 0.2 | REACTOME BRANCHED CHAIN AMINO ACID CATABOLISM | Genes involved in Branched-chain amino acid catabolism |