Project
ENCSR904DTN: DNase-seq of mouse liver in constant darkness
Navigation
Downloads

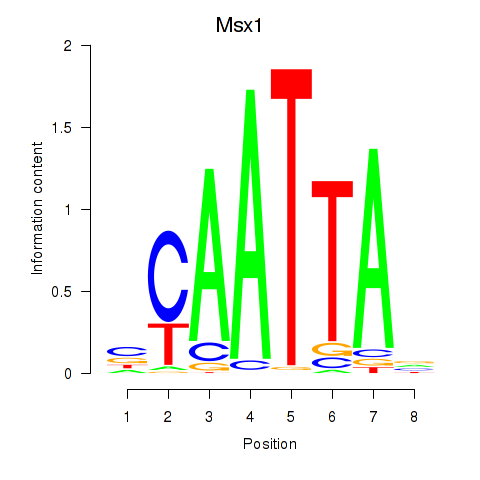
Results for Msx1_Lhx9_Barx1_Rax_Dlx6
Z-value: 0.05
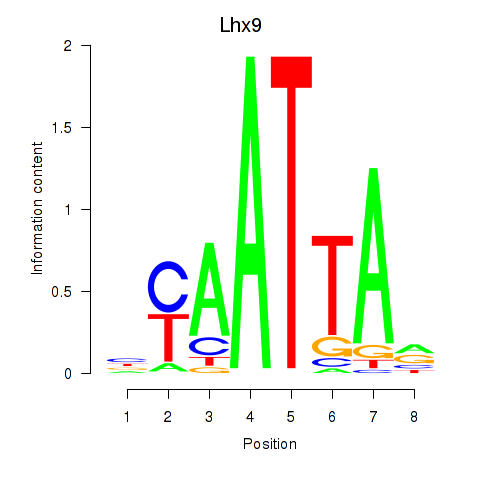
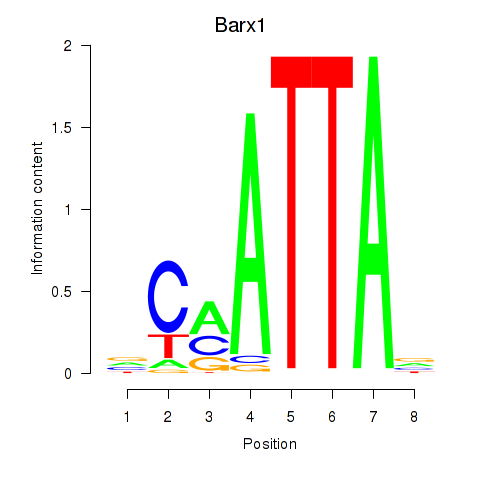
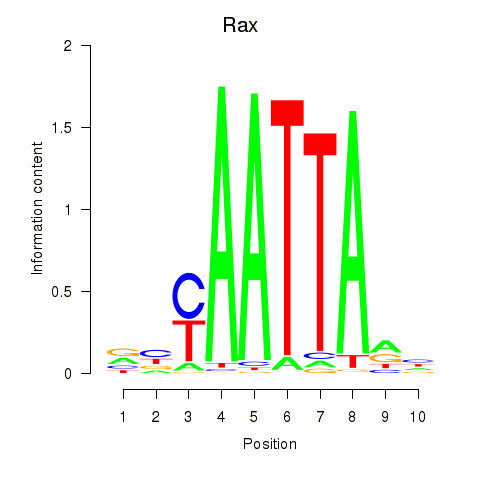
Motif logo
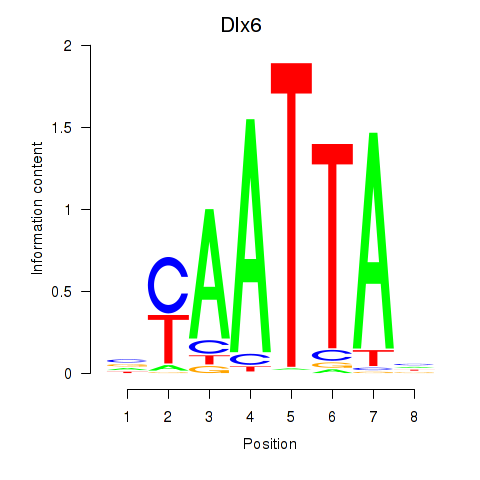
Transcription factors associated with Msx1_Lhx9_Barx1_Rax_Dlx6
| Gene Symbol | Gene ID | Gene Info |
|---|---|---|
|
Msx1
|
ENSMUSG00000048450.10 | msh homeobox 1 |
|
Lhx9
|
ENSMUSG00000019230.8 | LIM homeobox protein 9 |
|
Barx1
|
ENSMUSG00000021381.4 | BarH-like homeobox 1 |
|
Rax
|
ENSMUSG00000024518.3 | retina and anterior neural fold homeobox |
|
Dlx6
|
ENSMUSG00000029754.7 | distal-less homeobox 6 |
Correlations of motif activity and signal intensity at CREs associated with the motif's TFs:
This plot shows correlation between observed signal intensity of a CRE associated with the transcription factor across all samples and activity of the motif.
For each TF, only the top 5 correlated CREs are shown.
| CRE | Gene | Distance | Association probability | Pearson corr. coef. | P-value | Plot |
|---|---|---|---|---|---|---|
| chr13_48659009_48659160 | Barx1 | 3914 | 0.205127 | 0.44 | 3.8e-01 | Click! |
| chr13_48653912_48654075 | Barx1 | 9005 | 0.165057 | 0.37 | 4.7e-01 | Click! |
| chr13_48655742_48655905 | Barx1 | 7175 | 0.172819 | -0.24 | 6.5e-01 | Click! |
| chr1_138831356_138831675 | Lhx9 | 2144 | 0.261649 | 0.83 | 4.1e-02 | Click! |
| chr1_138826941_138827260 | Lhx9 | 6559 | 0.168684 | 0.10 | 8.5e-01 | Click! |
| chr1_138835461_138835621 | Lhx9 | 1882 | 0.281997 | 0.04 | 9.4e-01 | Click! |
| chr5_37823370_37823527 | Msx1 | 1134 | 0.515557 | 0.66 | 1.6e-01 | Click! |
| chr5_37818319_37818501 | Msx1 | 6172 | 0.207235 | 0.62 | 1.9e-01 | Click! |
| chr5_37824534_37824701 | Msx1 | 34 | 0.978696 | 0.44 | 3.9e-01 | Click! |
| chr5_37849248_37849752 | Msx1 | 24917 | 0.168881 | 0.39 | 4.5e-01 | Click! |
| chr5_37848731_37849060 | Msx1 | 24312 | 0.170261 | 0.25 | 6.3e-01 | Click! |
Activity of the Msx1_Lhx9_Barx1_Rax_Dlx6 motif across conditions
Conditions sorted by the z-value of the Msx1_Lhx9_Barx1_Rax_Dlx6 motif activity
Move your cursor over a bar to see sample name and corresponding Z-value.
Top target CREs of the motif:
| Cis Regulatory Element (CRE) | Target Score | Top associated gene | Gene Info | Distance of CRE to TSS | CRE/Gene association probability |
|---|---|---|---|---|---|
| chr10_59786230_59786381 | 0.01 |
Gm17059 |
predicted gene 17059 |
13949 |
0.14 |
| chr8_122697244_122697412 | 0.01 |
Gm10612 |
predicted gene 10612 |
532 |
0.59 |
| chr7_143068403_143068570 | 0.00 |
Tssc4 |
tumor-suppressing subchromosomal transferable fragment 4 |
763 |
0.46 |
| chr4_33248900_33249090 | 0.00 |
Pnrc1 |
proline-rich nuclear receptor coactivator 1 |
485 |
0.78 |
| chr1_165766009_165766175 | 0.00 |
Creg1 |
cellular repressor of E1A-stimulated genes 1 |
2346 |
0.15 |
| chr6_94273521_94273693 | 0.00 |
Magi1 |
membrane associated guanylate kinase, WW and PDZ domain containing 1 |
9418 |
0.24 |
| chr1_23146038_23146850 | 0.00 |
Ppp1r14bl |
protein phosphatase 1, regulatory inhibitor subunit 14B like |
44191 |
0.14 |
| chr2_115888561_115888772 | 0.00 |
Meis2 |
Meis homeobox 2 |
15704 |
0.28 |
| chr13_114348449_114348600 | 0.00 |
Ndufs4 |
NADH:ubiquinone oxidoreductase core subunit S4 |
39525 |
0.14 |
| chr5_137981657_137981816 | 0.00 |
Azgp1 |
alpha-2-glycoprotein 1, zinc |
168 |
0.89 |
| chr15_102999275_102999447 | 0.00 |
Hoxc6 |
homeobox C6 |
1104 |
0.28 |
| chr2_153584454_153584637 | 0.00 |
Commd7 |
COMM domain containing 7 |
48186 |
0.1 |
| chr15_10685820_10685975 | 0.00 |
Rai14 |
retinoic acid induced 14 |
27643 |
0.16 |
| chr14_70530138_70530323 | 0.00 |
Lgi3 |
leucine-rich repeat LGI family, member 3 |
455 |
0.68 |
| chr12_7987781_7988288 | 0.00 |
Apob |
apolipoprotein B |
10255 |
0.22 |
| chr11_76908664_76908965 | 0.00 |
Tmigd1 |
transmembrane and immunoglobulin domain containing 1 |
4252 |
0.2 |
| chr5_117089265_117089549 | 0.00 |
Suds3 |
suppressor of defective silencing 3 homolog (S. cerevisiae) |
9404 |
0.15 |
| chr8_70528786_70528992 | 0.00 |
Fkbp8 |
FK506 binding protein 8 |
73 |
0.91 |
| chr15_25623849_25624065 | 0.00 |
Myo10 |
myosin X |
1408 |
0.41 |
| chr3_127005234_127005396 | 0.00 |
Gm25501 |
predicted gene, 25501 |
54 |
0.96 |
| chr18_84858118_84858492 | 0.00 |
Gm16146 |
predicted gene 16146 |
1242 |
0.4 |
| chr3_132835072_132835238 | 0.00 |
Gm9403 |
predicted gene 9403 |
7241 |
0.15 |
| chr4_123652088_123652262 | 0.00 |
Macf1 |
microtubule-actin crosslinking factor 1 |
12577 |
0.13 |
| chr6_120579907_120580085 | 0.00 |
Gm44124 |
predicted gene, 44124 |
180 |
0.92 |
| chr19_55855694_55855845 | 0.00 |
Ppnr |
per-pentamer repeat gene |
14097 |
0.24 |
| chr11_107337882_107338046 | 0.00 |
Gm11716 |
predicted gene 11716 |
86 |
0.79 |
| chr11_120819707_120820136 | 0.00 |
Fasn |
fatty acid synthase |
3859 |
0.11 |
| chr7_101896586_101896755 | 0.00 |
Anapc15 |
anaphase promoting complex C subunit 15 |
193 |
0.86 |
| chr4_59292456_59292607 | 0.00 |
Susd1 |
sushi domain containing 1 |
23435 |
0.17 |
| chr5_89416345_89416742 | 0.00 |
Gc |
vitamin D binding protein |
19085 |
0.24 |
| chr17_27907441_27908078 | 0.00 |
Taf11 |
TATA-box binding protein associated factor 11 |
24 |
0.5 |
| chr14_20245752_20245947 | 0.00 |
Gm2048 |
predicted gene 2048 |
15083 |
0.11 |
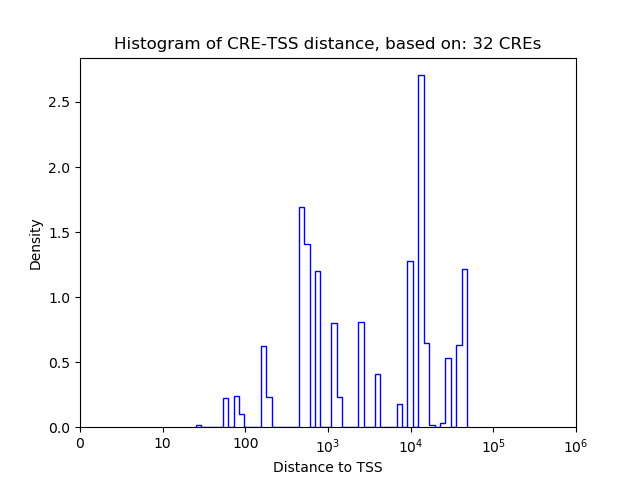
Histogram of CRE-TSS distances for CREs targeted by :
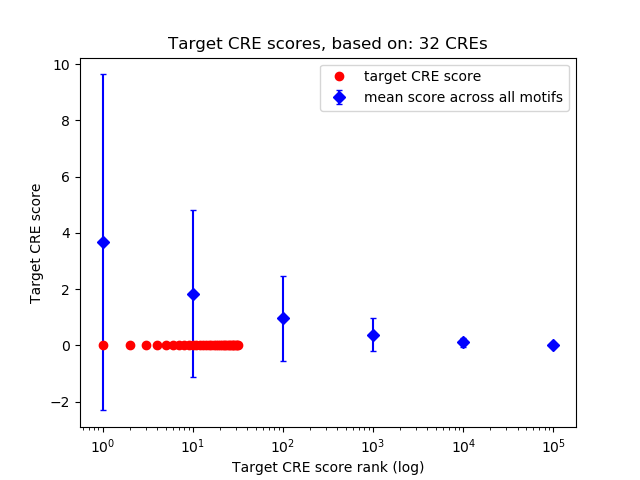
Rank distribution of CRE target scores:
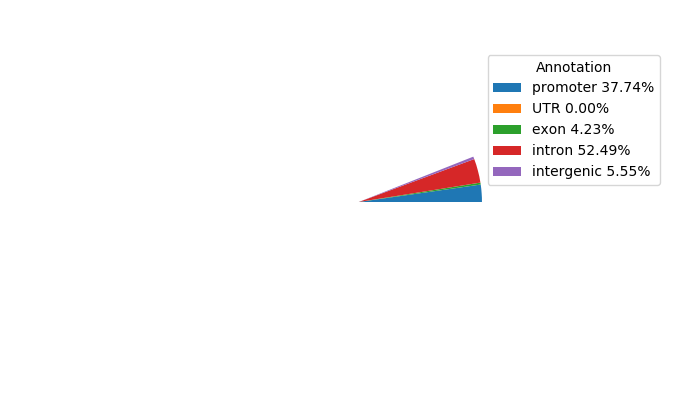
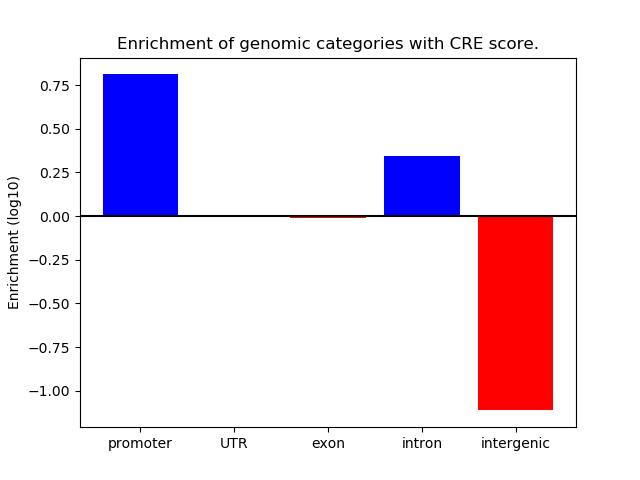
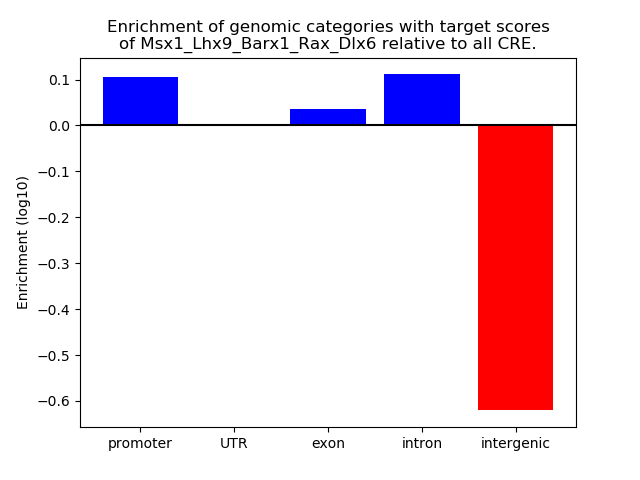
Distribution of target CREs across different genomic regions:
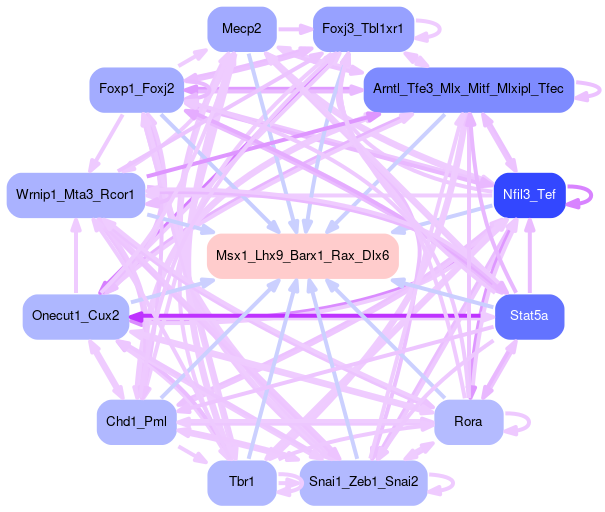
Network of associatons between targets according to the STRING database.
