Project
ENCODE: ATAC-seq of different tissues during embryonic development
Navigation
Downloads
Sample name: intestine_E16.5
QC summary table
QC statistics for this sample |
Comparison with ChIP-Seq ENCODE datasets |
||
Mapping |
|||
Fraction of mapped reads for the IP replicates: |
0.883 | 77th percentile | |
ChIP enrichment signal intensity |
|||
Noise level ChIP signal intensity: |
0.473 | 99th percentile | |
Peak statistics |
|||
Number of peaks: |
73980 | 96th percentile | |
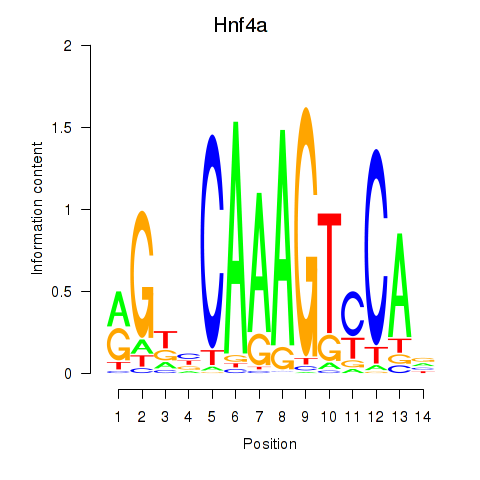
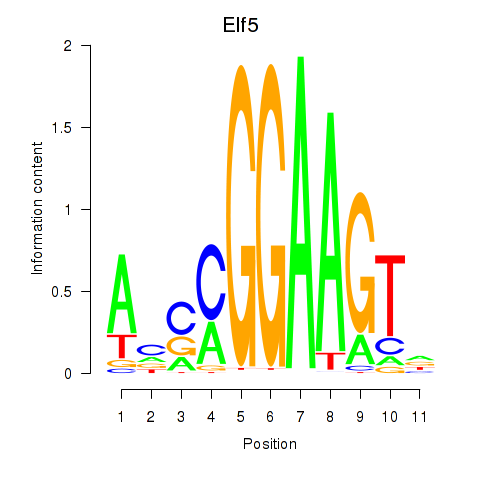
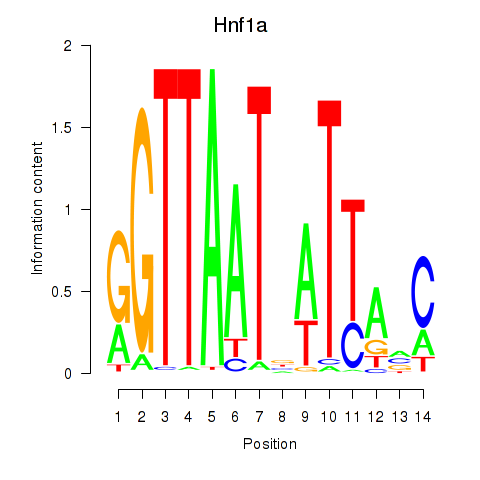
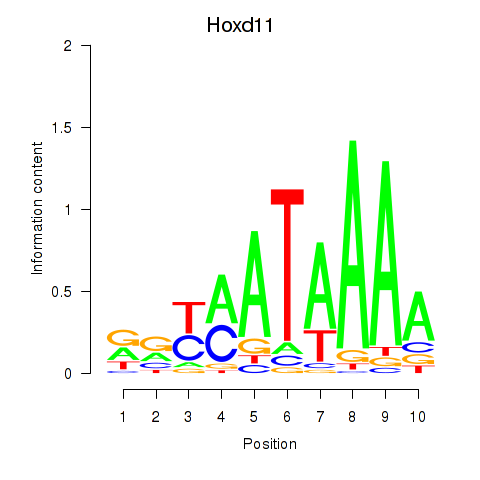
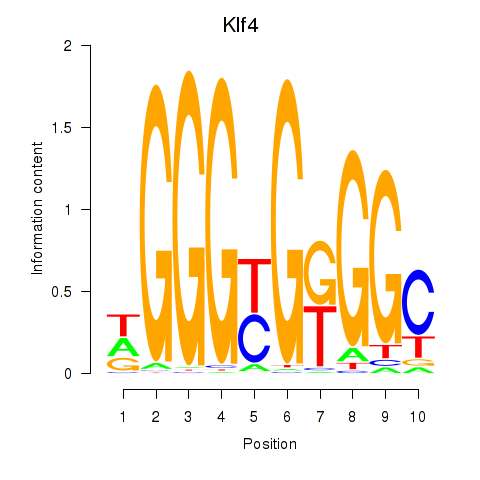
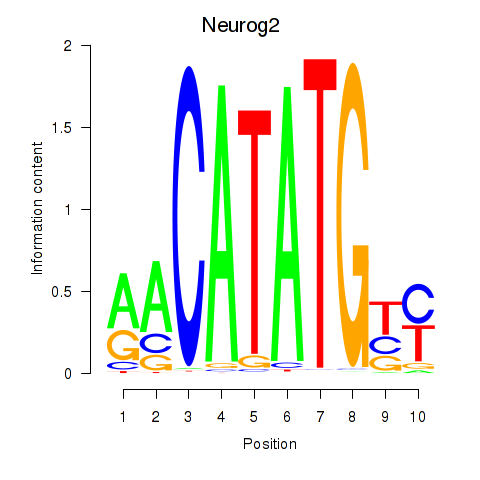
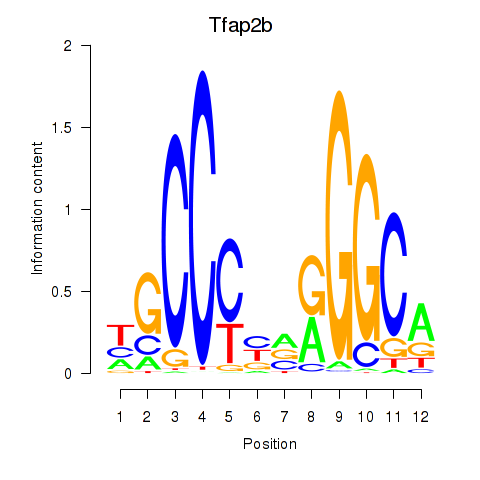
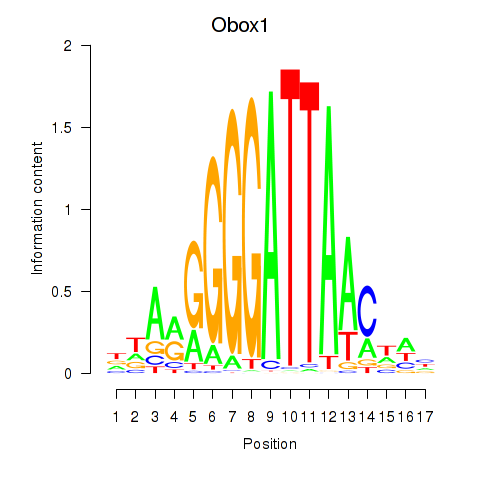
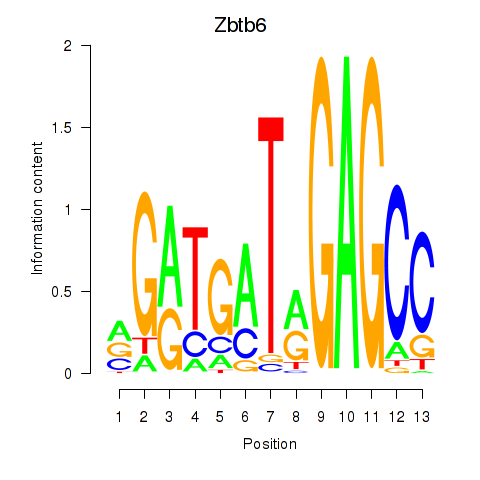
Regulatory motifs sorted by significance (z-value) for sample intestine_E16.5.
Regulatory motifs sorted by significance (z-value).
| WM name | Z-value | Associated genes | Logo |
|---|---|---|---|
| Hnf4a | 77.771 |
|
|
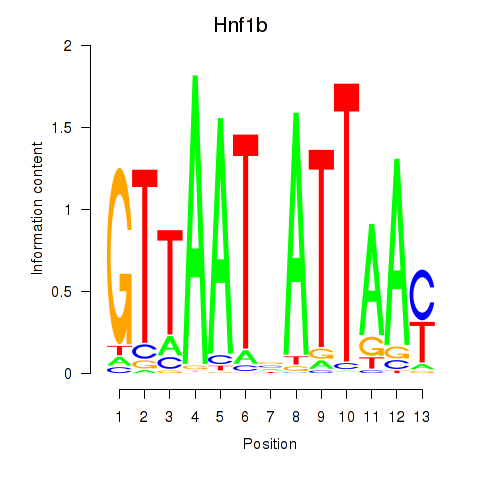
| Hnf1b | 53.013 |
|
|
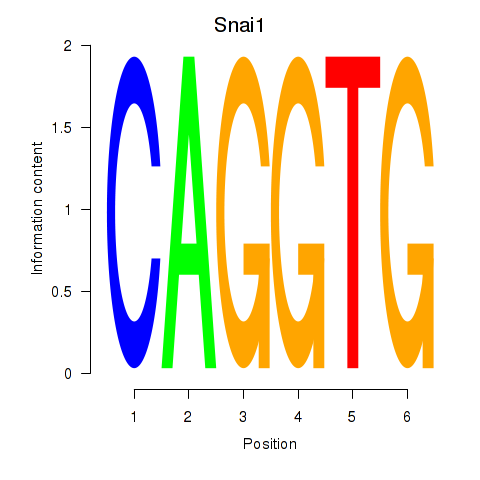
| Snai1_Zeb1_Snai2 | 27.356 |
|
|
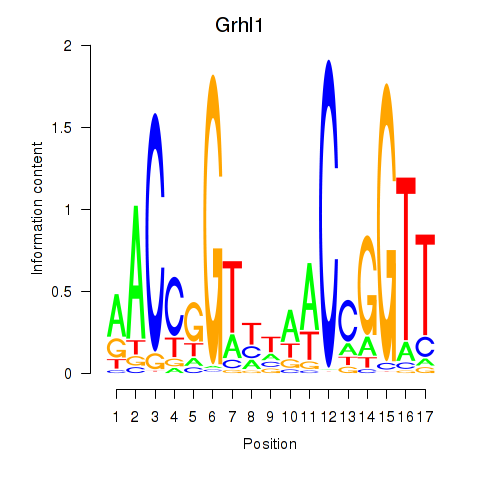
| Grhl1 | 26.390 |
|
|
| Elf5 | 25.756 |
|
|
| Hnf1a | 23.054 |
|
|
| Hoxd11_Cdx1_Hoxc11 | 22.970 |
|
|
| Klf4_Sp3 | 22.573 |
|
|
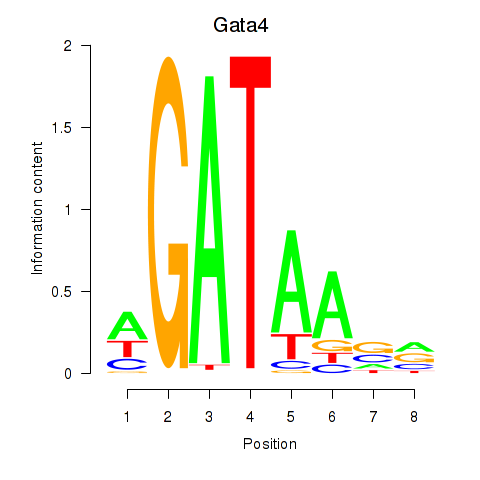
| Gata4 | 19.597 |
|
|
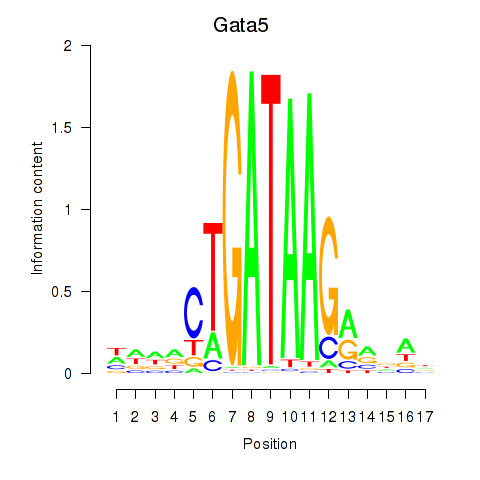
| Gata5 | 19.269 |
|
|
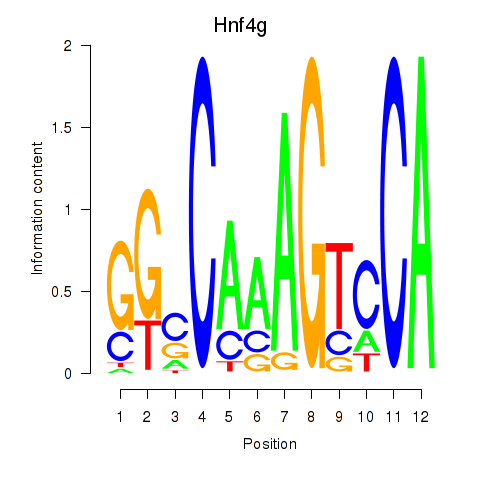
| Hnf4g | 17.073 |
|
|
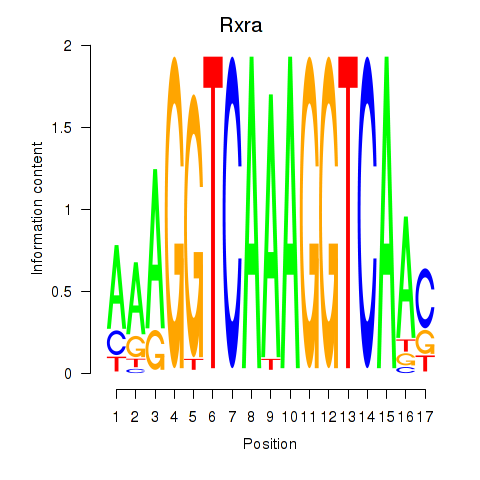
| Rxra | 16.143 |
|
|
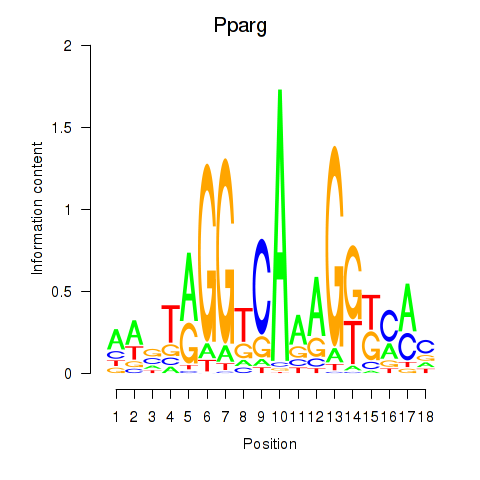
| Pparg_Rxrg | 15.559 |
|
|
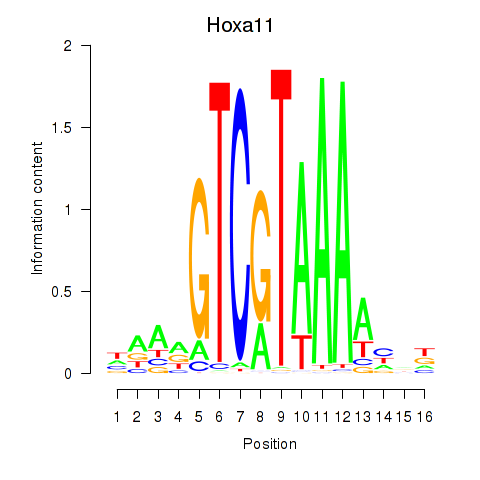
| Hoxa11_Hoxc12 | 15.501 |
|
|
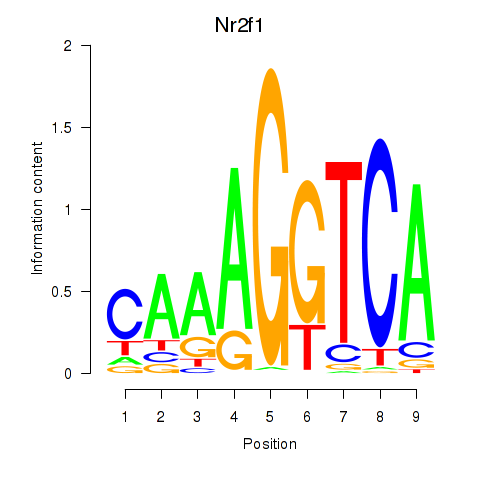
| Nr2f1_Nr4a1 | 12.807 |
|
|
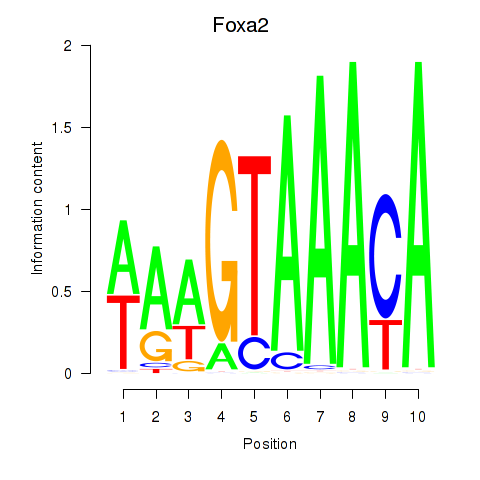
| Foxa2_Foxa1 | 12.711 |
|
|
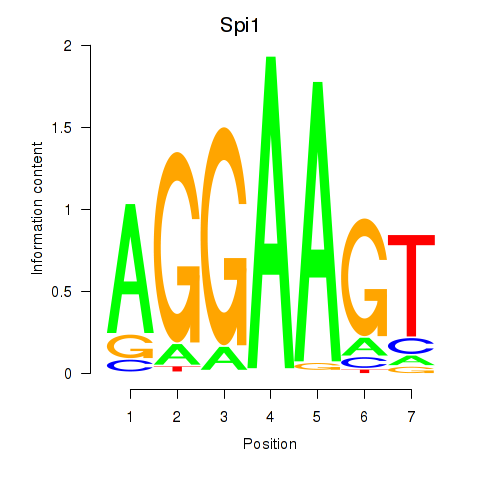
| Spi1 | 11.764 |
|
|
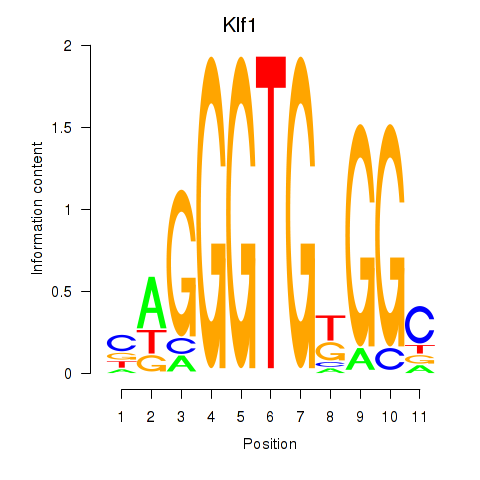
| Klf1 | 11.262 |
|
|
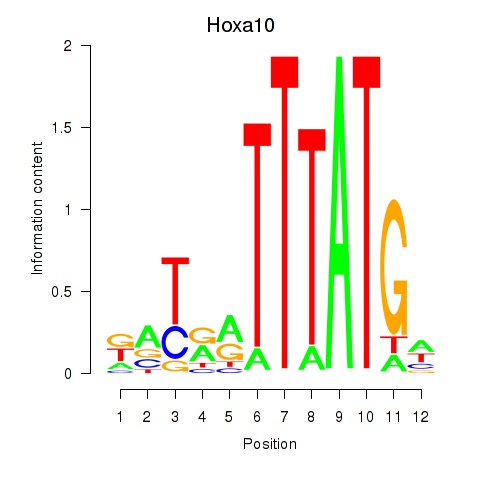
| Hoxa10 | 10.641 |
|
|
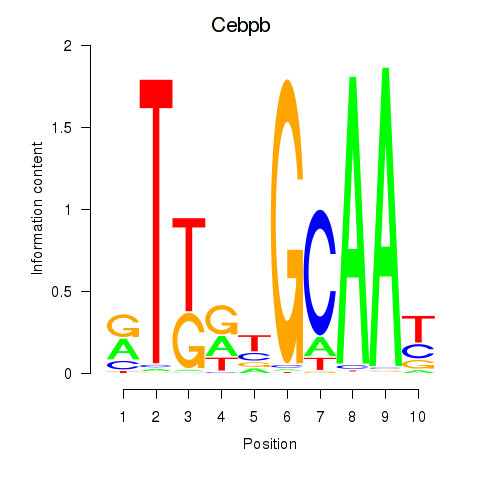
| Cebpb | 9.761 |
|
|
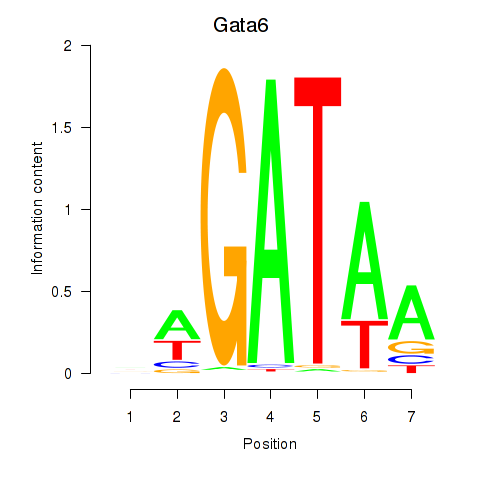
| Gata6 | 9.693 |
|
|
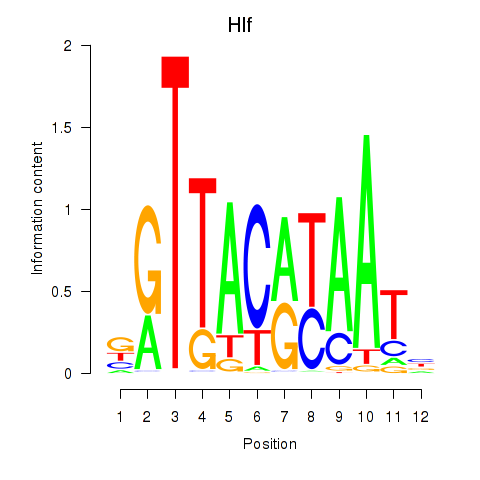
| Hlf | 8.566 |
|
|
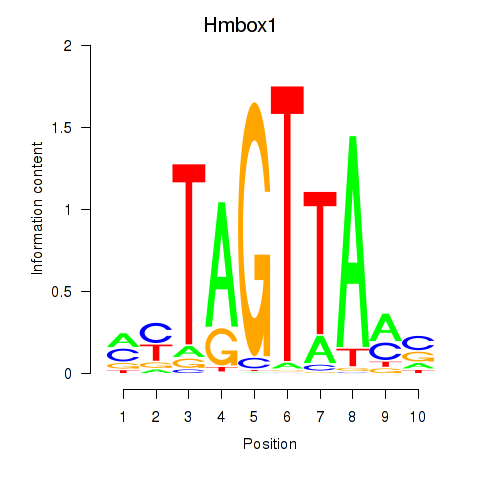
| Hmbox1 | 8.304 |
|
|
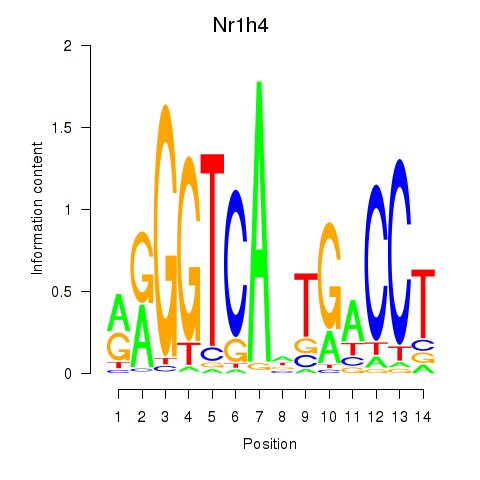
| Nr1h4 | 8.198 |
|
|
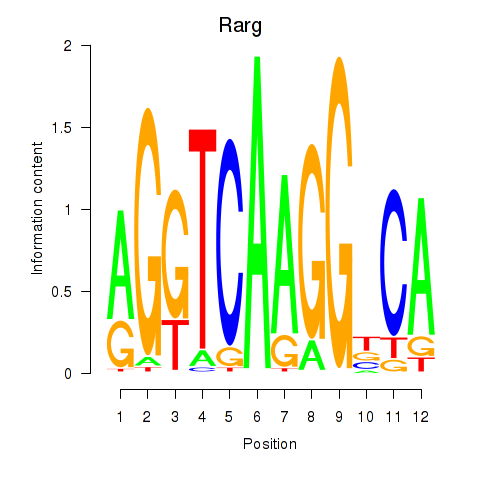
| Rarg | 8.187 |
|
|
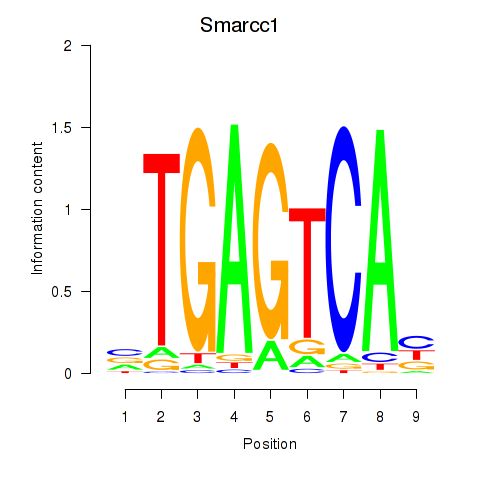
| Smarcc1_Fosl1 | 8.063 |
|
|
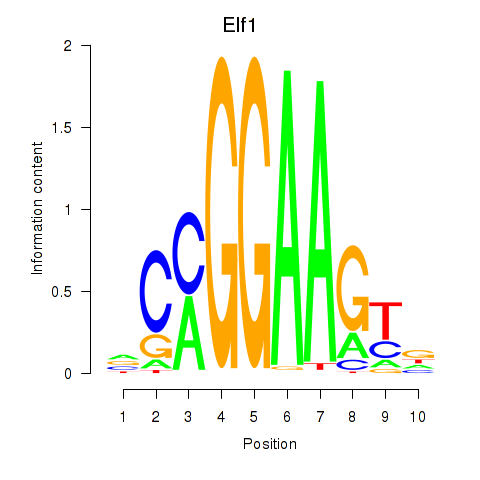
| Elf1_Elf2_Etv2_Elf4 | 7.767 |
|
|
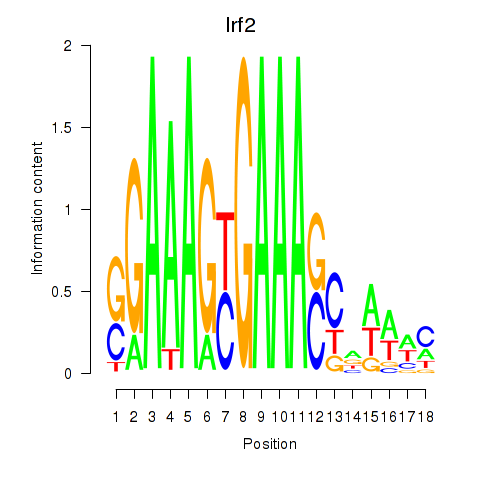
| Irf2_Irf1_Irf8_Irf9_Irf7 | 7.723 |
|
|
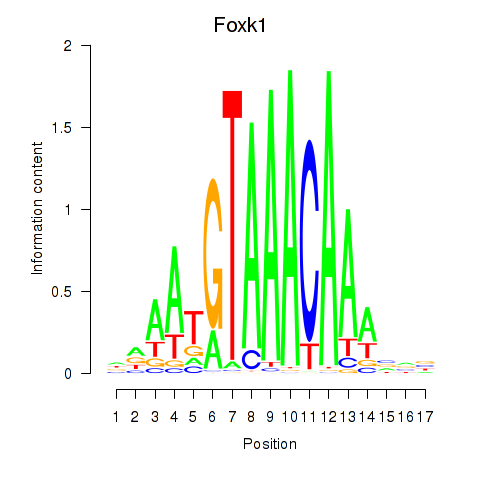
| Foxk1_Foxj1 | 7.478 |
|
|
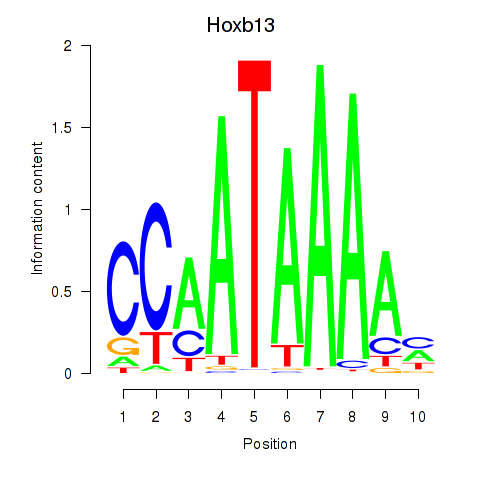
| Hoxb13 | 7.158 |
|
|
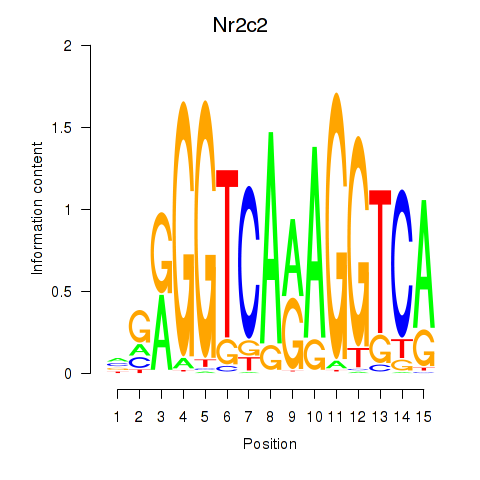
| Nr2c2 | 6.508 |
|
|
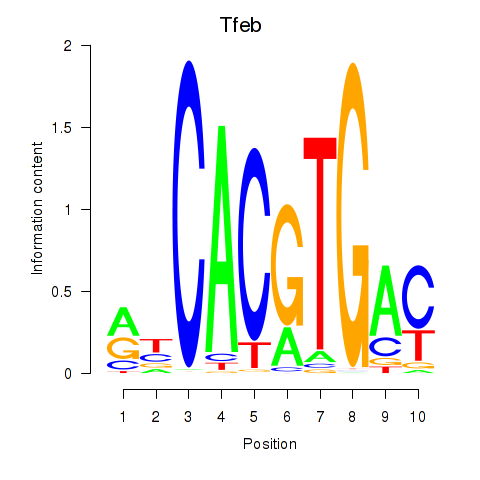
| Tfeb_Usf1_Srebf1_Usf2_Bhlhe41_Srebf2 | 6.394 |
|
|
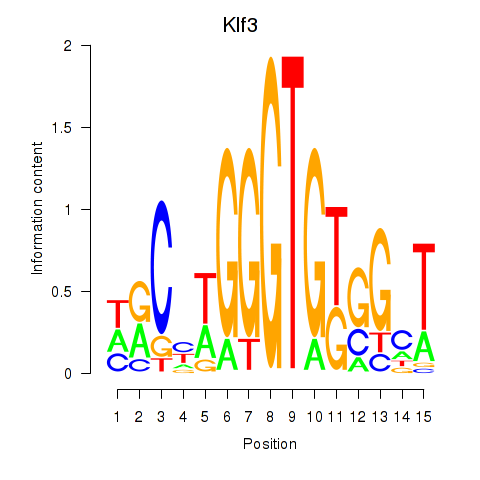
| Klf3 | 6.052 |
|
|
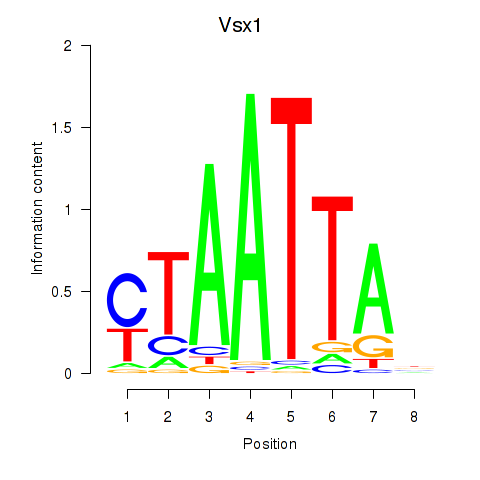
| Vsx1_Uncx_Prrx2_Shox2_Noto | 5.981 |
|
|
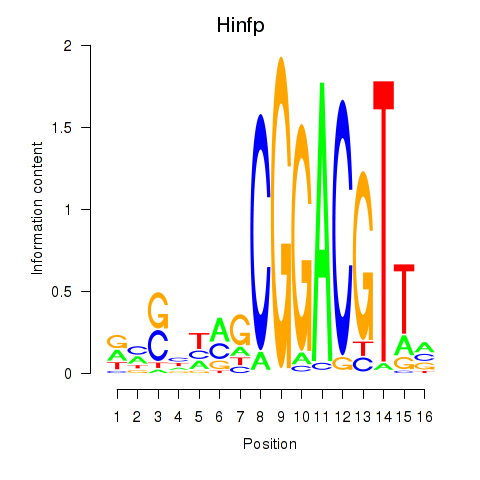
| Hinfp | 5.978 |
|
|
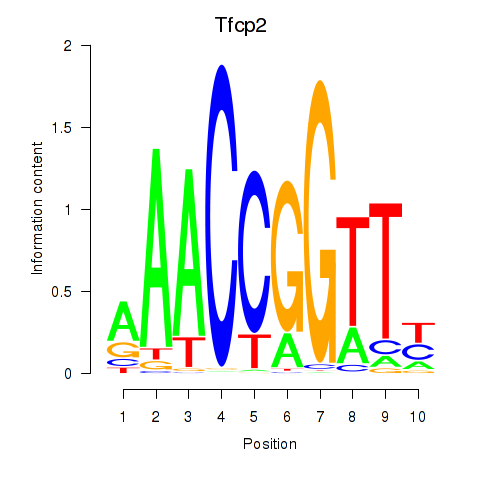
| Tfcp2 | 5.413 |
|
|
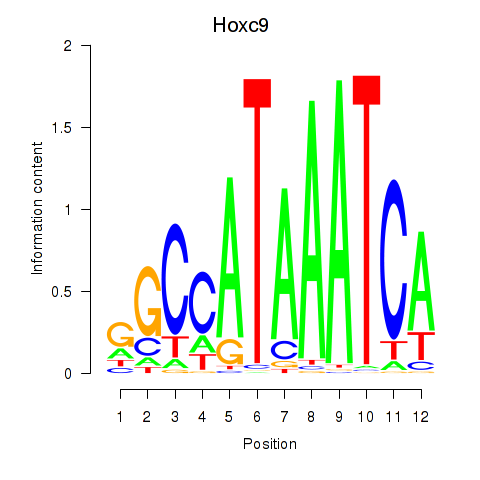
| Hoxc9 | 5.299 |
|
|
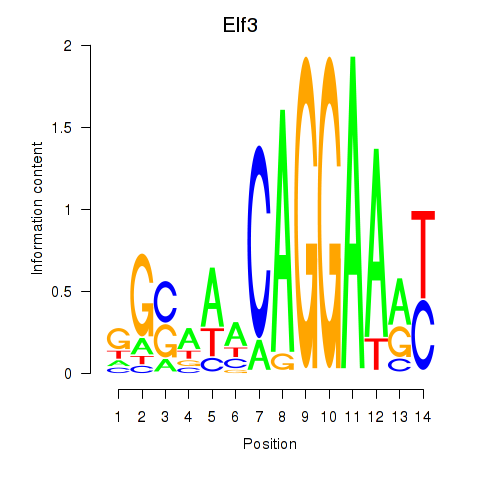
| Elf3 | 5.252 |
|
|
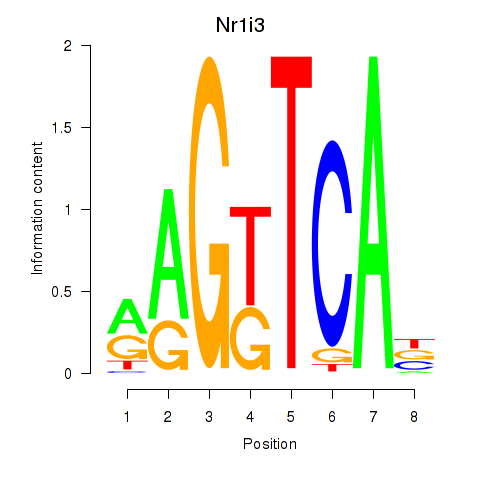
| Nr1i3 | 5.176 |
|
|
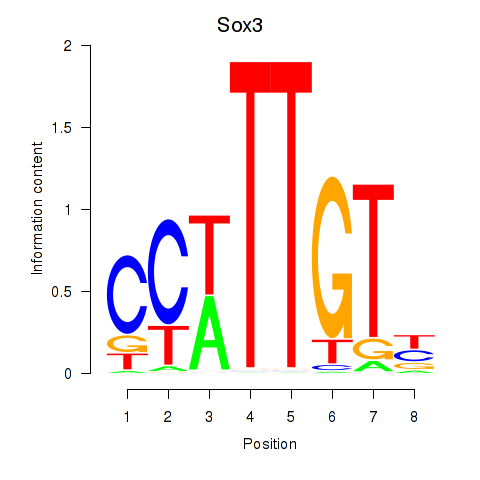
| Sox3_Sox10 | 5.112 |
|
|
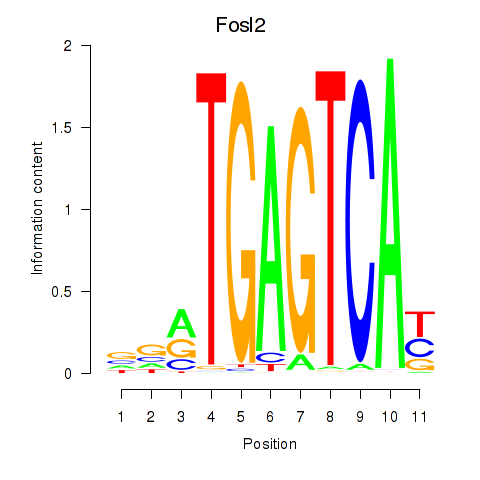
| Fosl2_Bach2 | 5.027 |
|
|
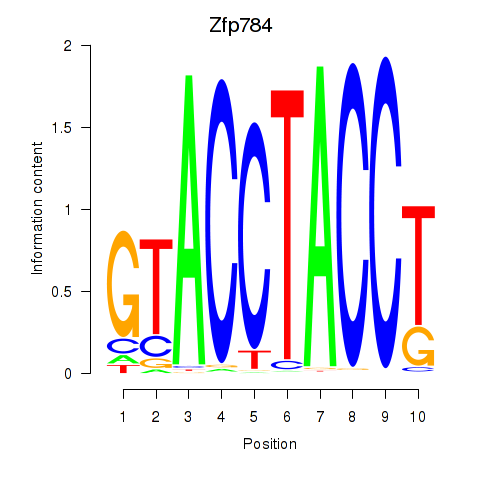
| Zfp784 | 4.952 |
|
|
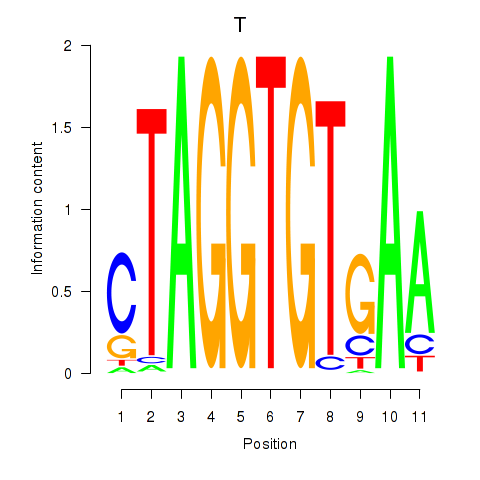
| T | 4.943 |
|
|
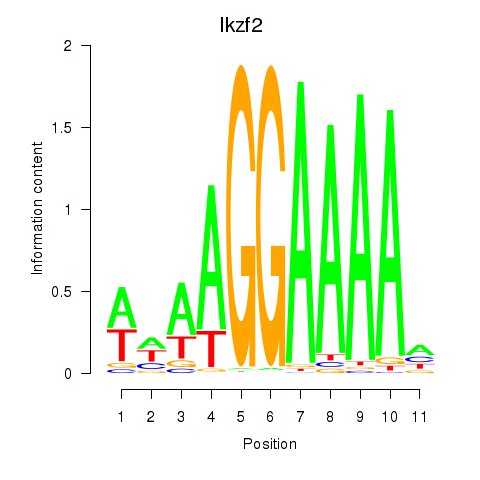
| Ikzf2 | 4.859 |
|
|
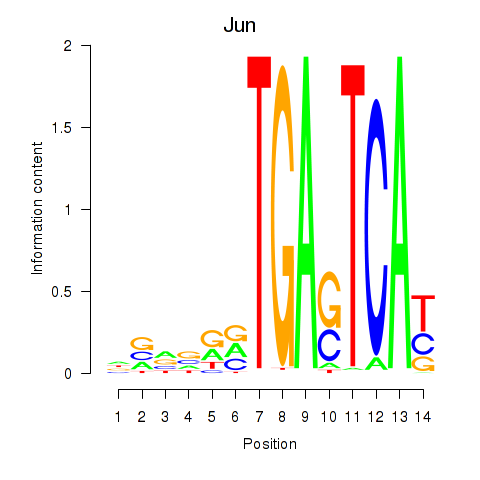
| Jun | 4.856 |
|
|
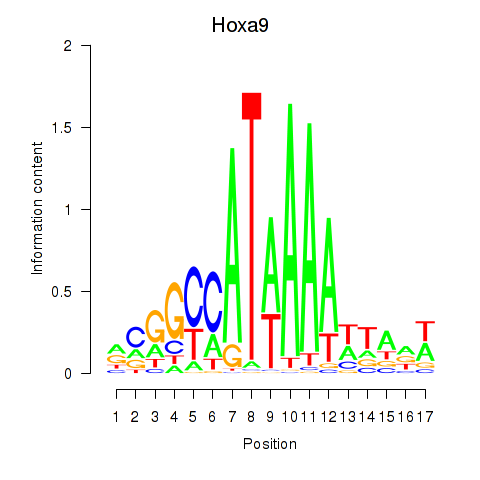
| Hoxa9_Hoxb9 | 4.827 |
|
|
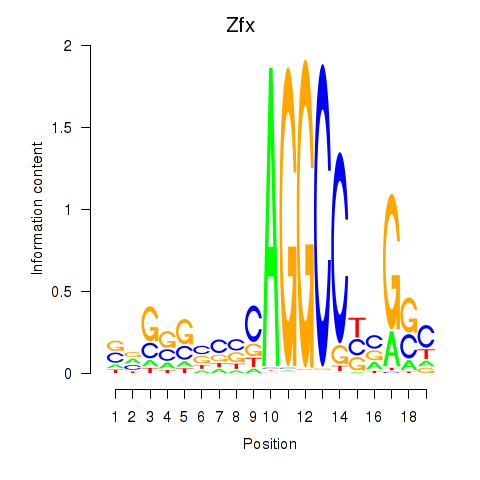
| Zfx_Zfp711 | 4.767 |
|
|
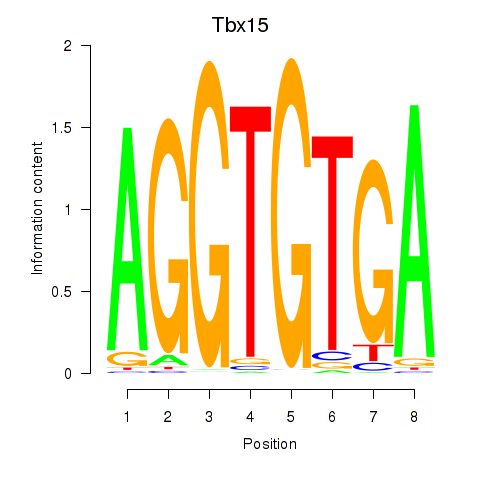
| Tbx15 | 4.698 |
|
|
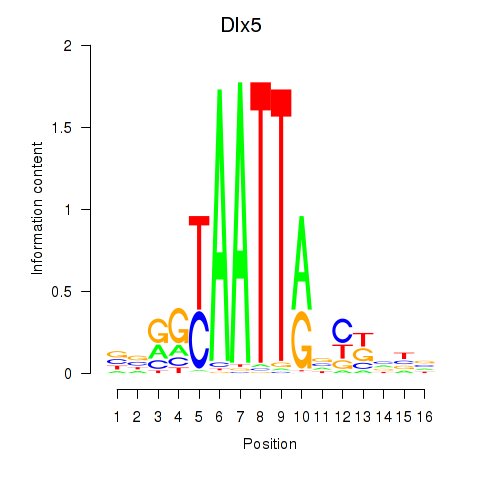
| Dlx5_Dlx4 | 4.624 |
|
|
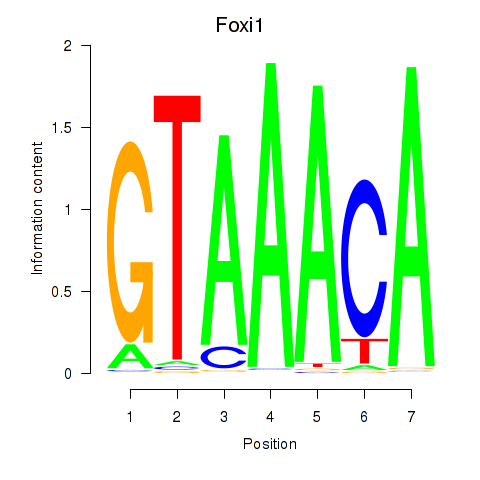
| Foxi1_Foxo1 | 4.581 |
|
|
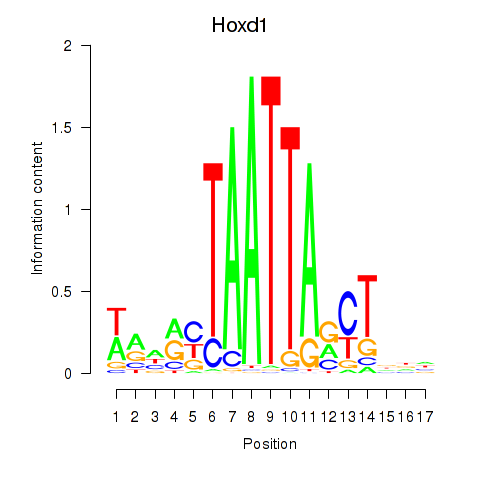
| Hoxd1 | 4.575 |
|
|
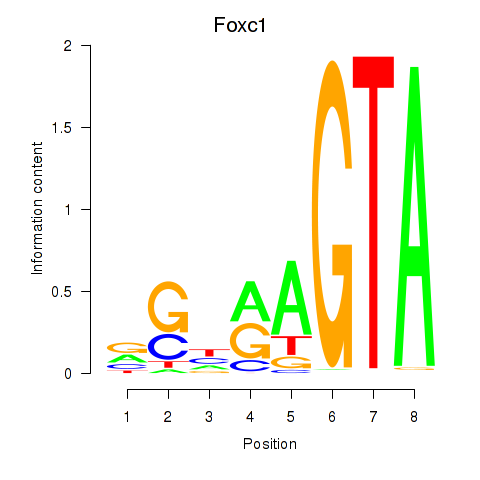
| Foxc1 | 4.563 |
|
|
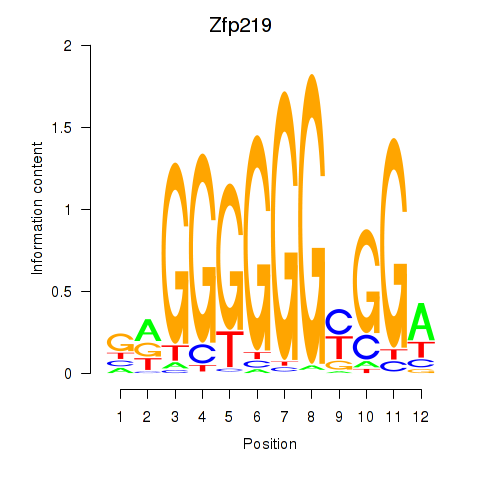
| Zfp219_Zfp740 | 4.550 |
|
|
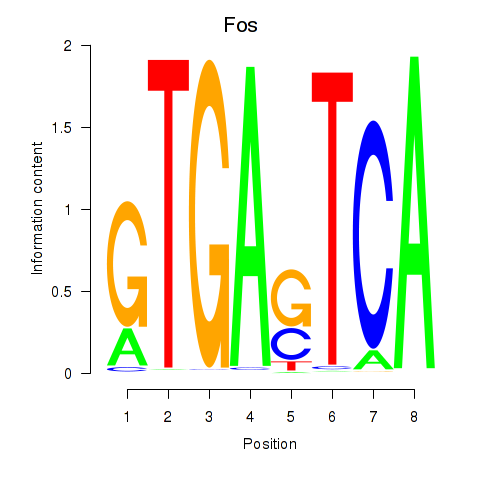
| Fos | 4.409 |
|
|
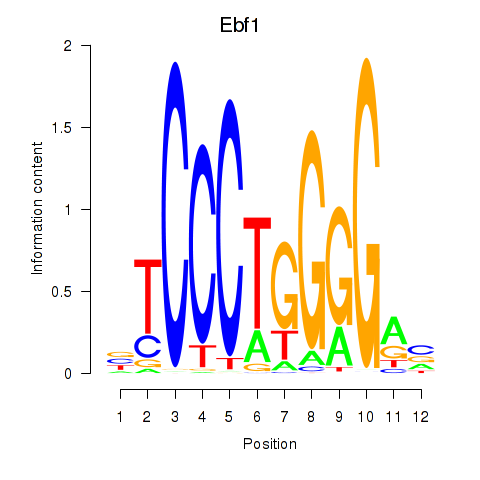
| Ebf1 | 4.375 |
|
|
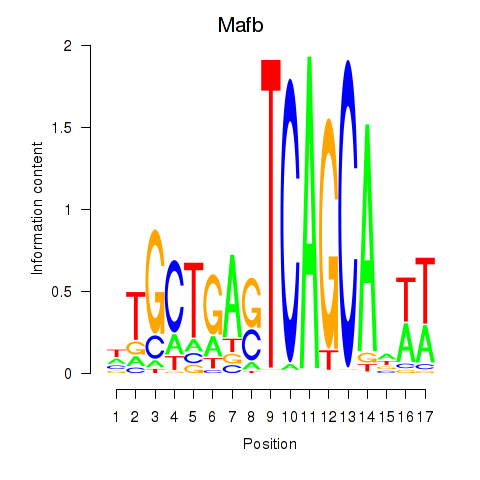
| Mafb | 4.243 |
|
|
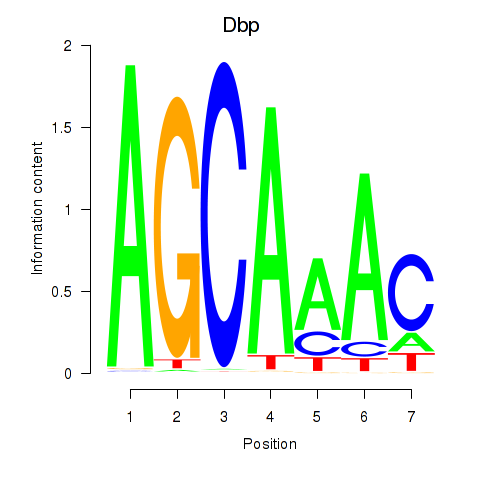
| Dbp | 3.971 |
|
|
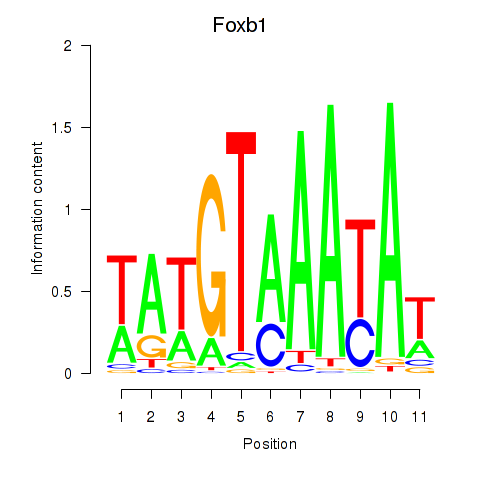
| Foxb1 | 3.876 |
|
|
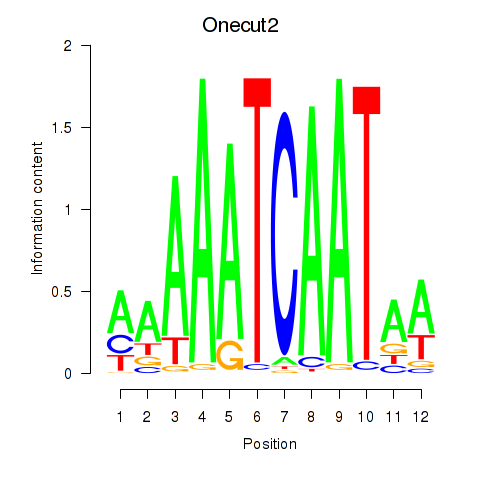
| Onecut2_Onecut3 | 3.750 |
|
|
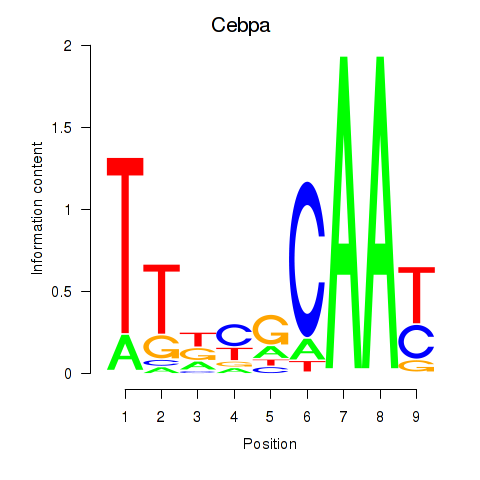
| Cebpa_Cebpg | 3.677 |
|
|
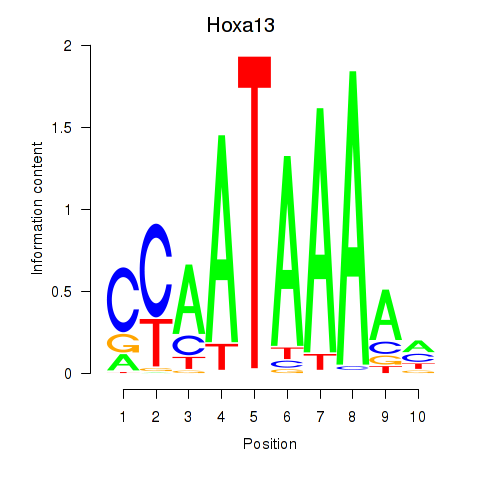
| Hoxa13 | 3.666 |
|
|
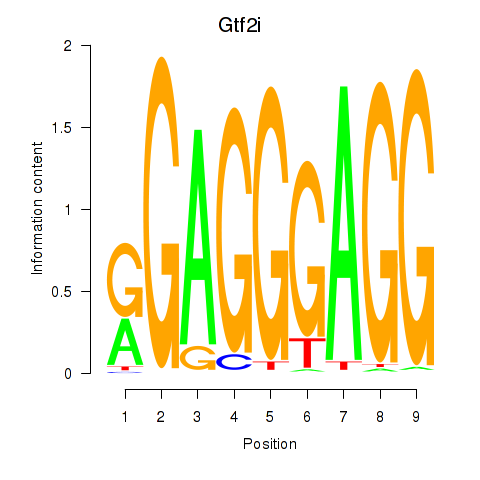
| Gtf2i_Gtf2f1 | 3.661 |
|
|
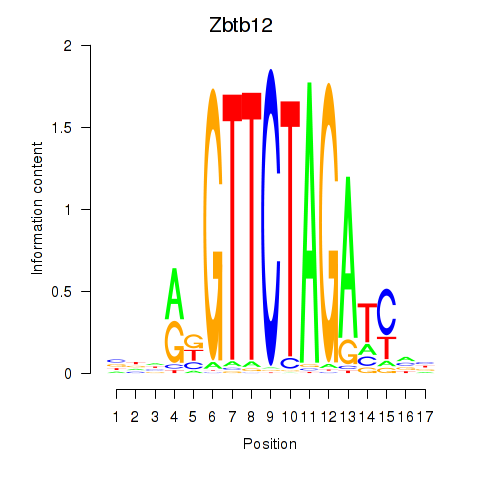
| Zbtb12 | 3.622 |
|
|
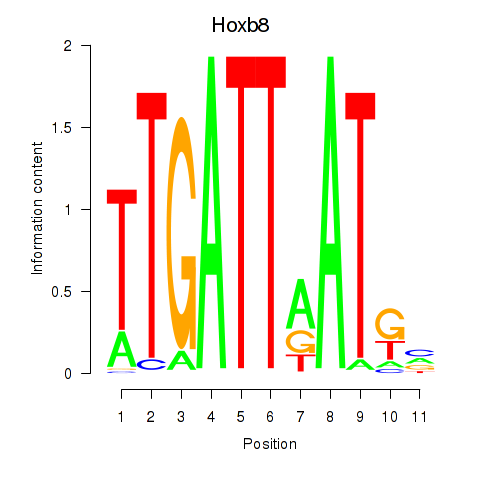
| Hoxb8_Pdx1 | 3.601 |
|
|
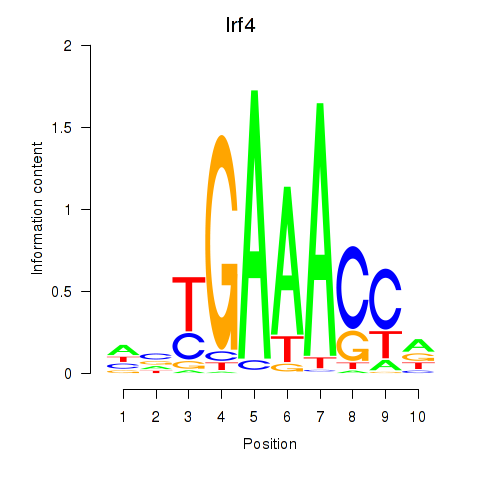
| Irf4 | 3.559 |
|
|
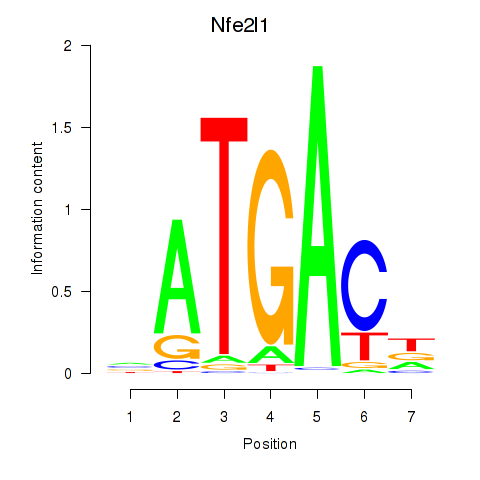
| Nfe2l1_Mafg | 3.525 |
|
|
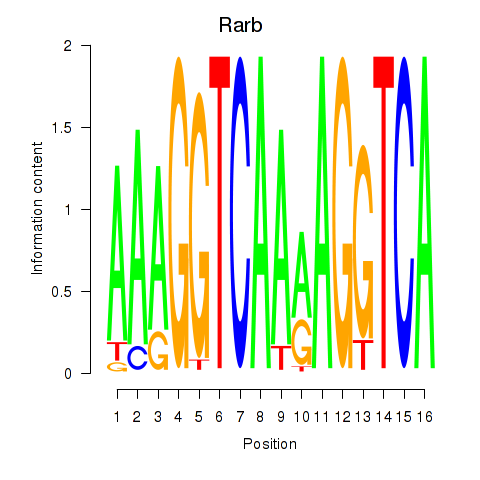
| Rarb | 3.503 |
|
|
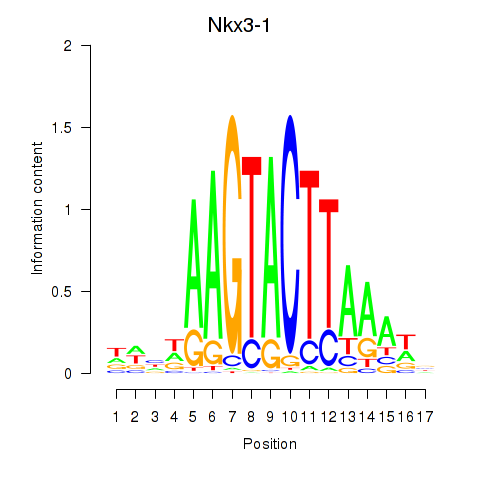
| Nkx3-1 | 3.494 |
|
|
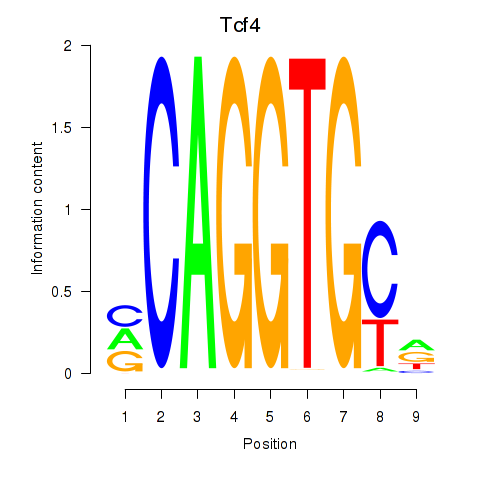
| Tcf4_Mesp1 | 3.470 |
|
|
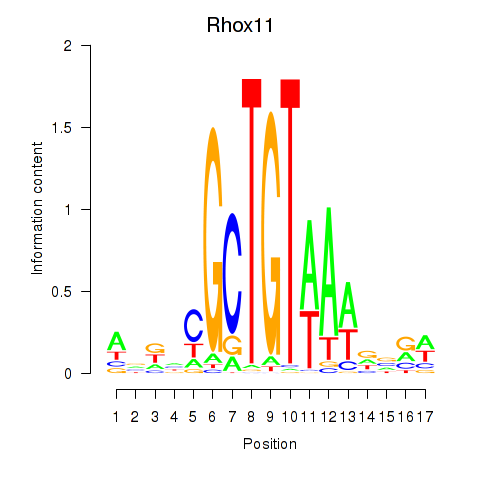
| Rhox11 | 3.416 |
|
|
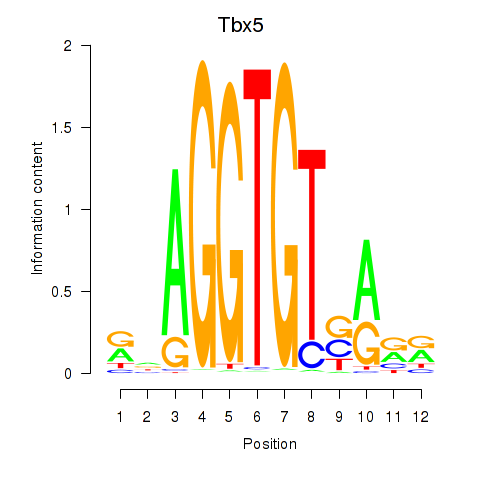
| Tbx5 | 3.387 |
|
|
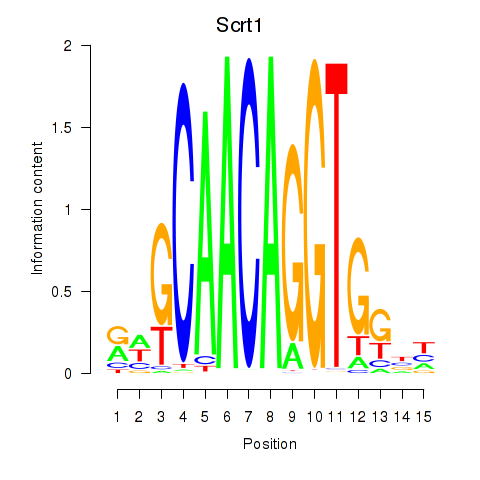
| Scrt1 | 3.348 |
|
|
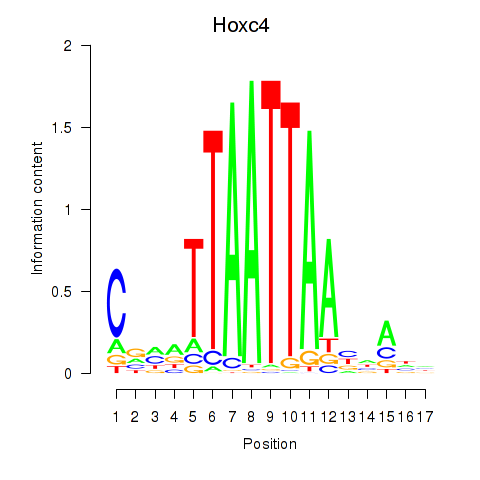
| Hoxc4_Arx_Otp_Esx1_Phox2b | 3.320 |
|
|
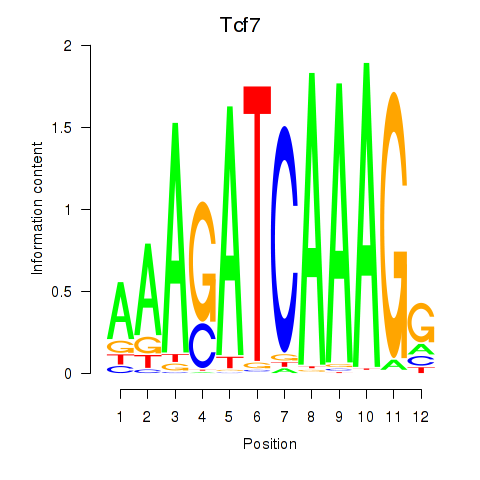
| Tcf7_Tcf7l2 | 3.313 |
|
|
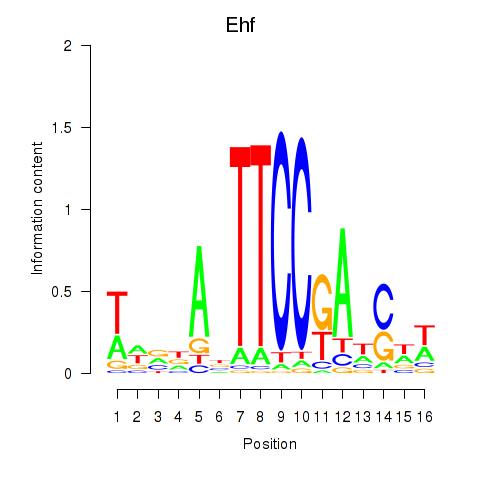
| Ehf | 3.308 |
|
|
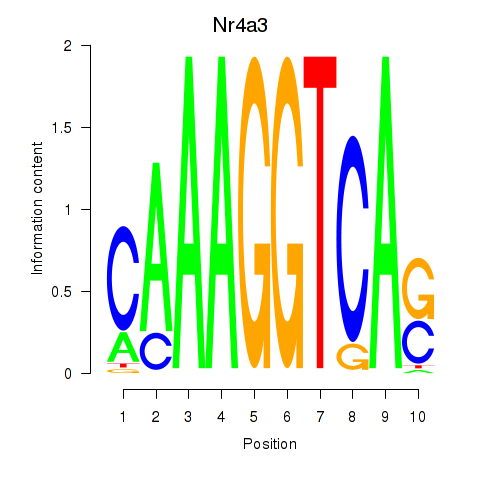
| Nr4a3 | 3.242 |
|
|
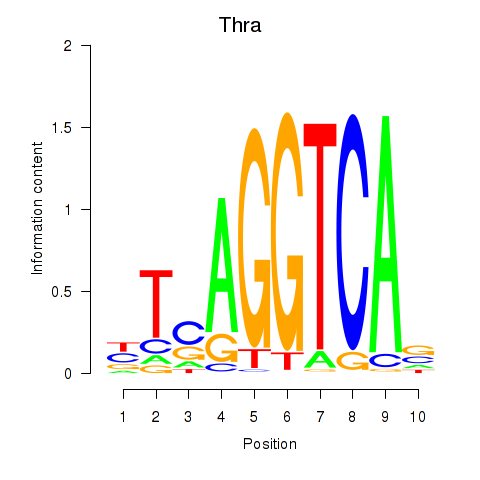
| Thra | 3.135 |
|
|
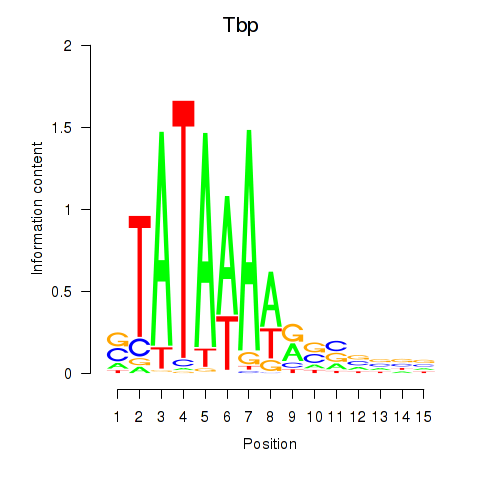
| Tbp | 3.114 |
|
|
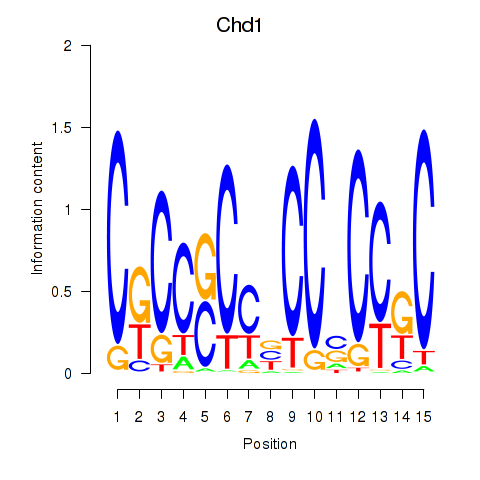
| Chd1_Pml | 3.053 |
|
|
| Pitx3 | 3.032 |
|

|
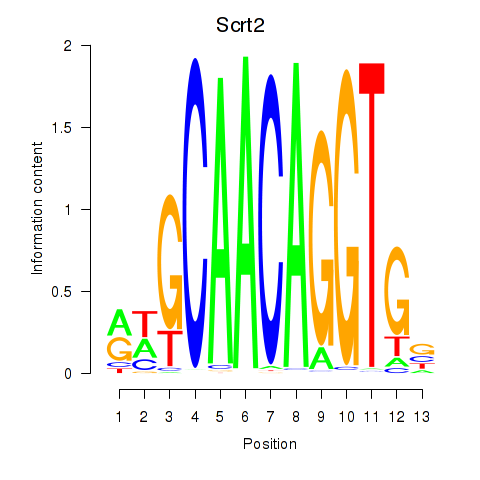
| Scrt2 | 3.020 |
|
|
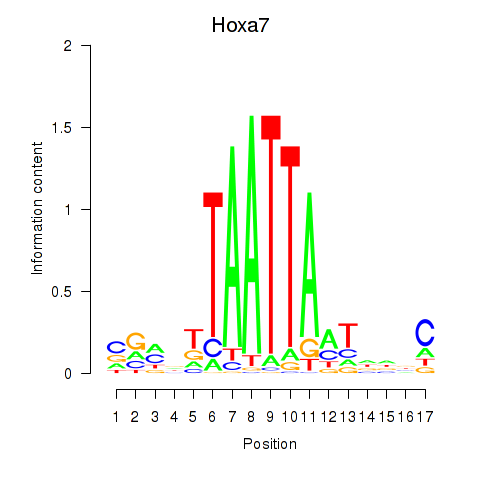
| Hoxa7_Hoxc8 | 3.003 |
|
|
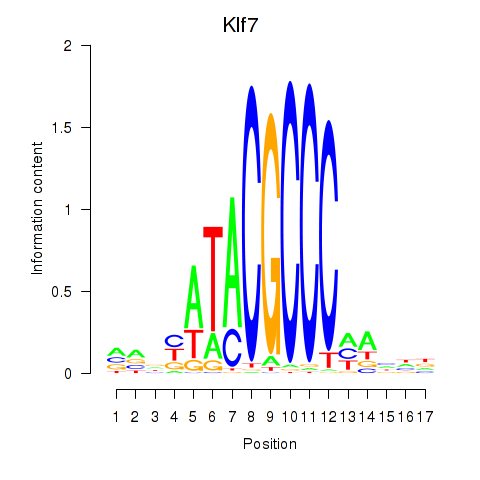
| Klf7 | 2.953 |
|
|
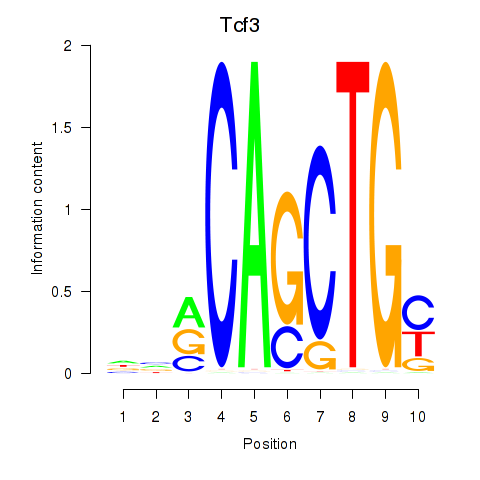
| Tcf3 | 2.951 |
|
|
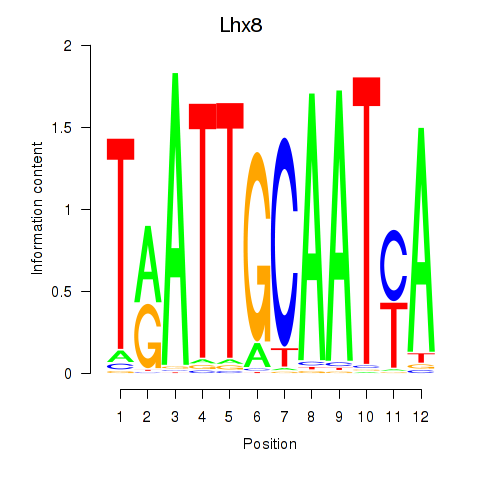
| Lhx8 | 2.847 |
|
|
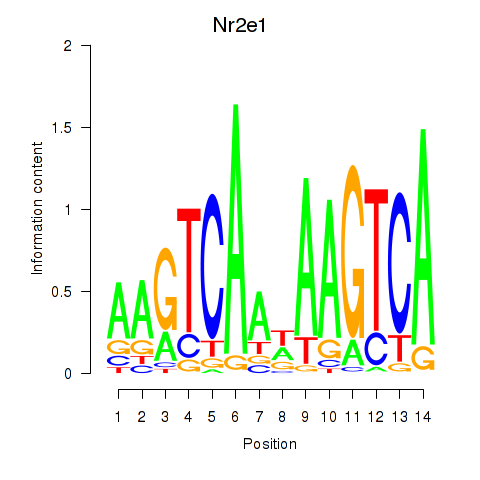
| Nr2e1 | 2.792 |
|
|
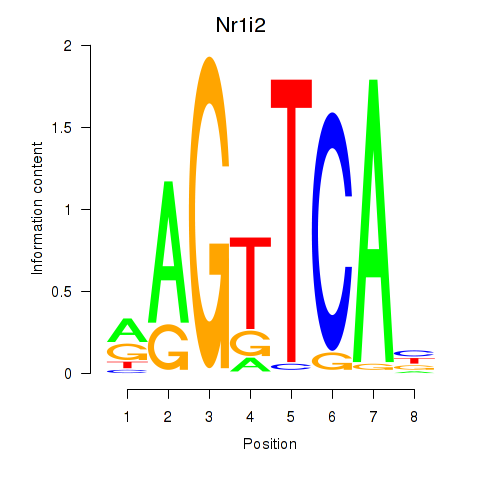
| Nr1i2 | 2.781 |
|
|
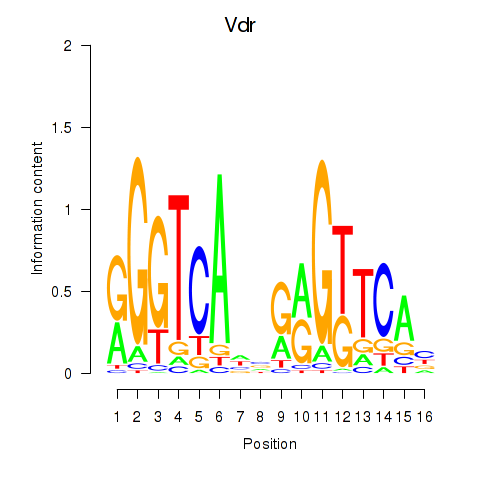
| Vdr | 2.780 |
|
|
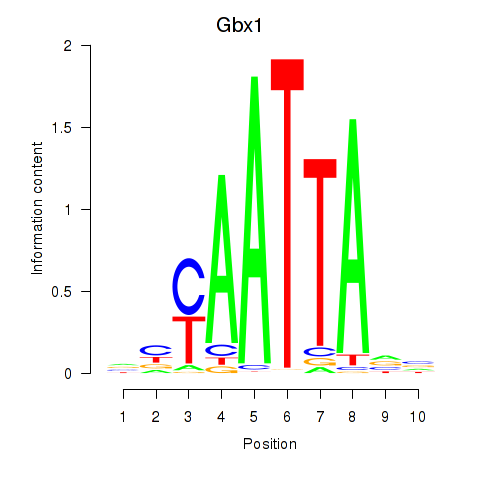
| Gbx1_Nobox_Alx3 | 2.769 |
|
|
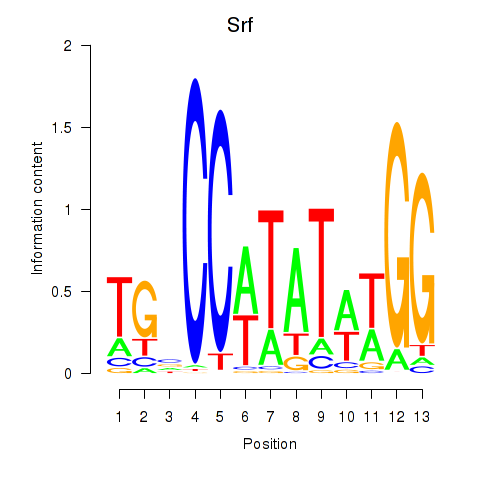
| Srf | 2.721 |
|
|
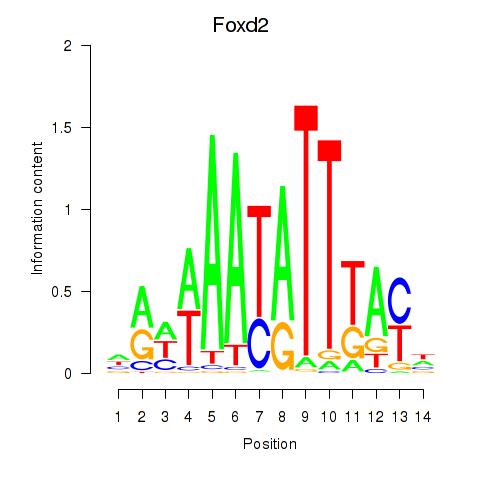
| Foxd2 | 2.709 |
|
|
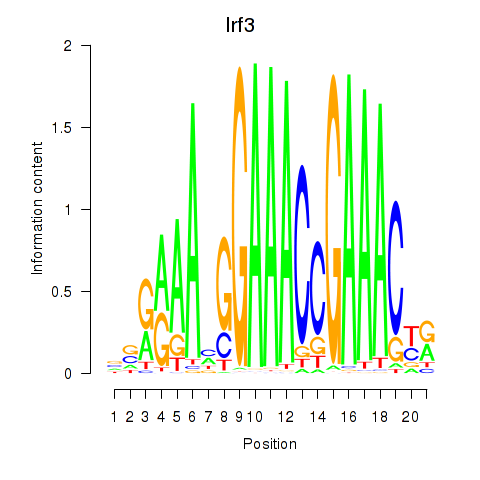
| Irf3 | 2.666 |
|
|
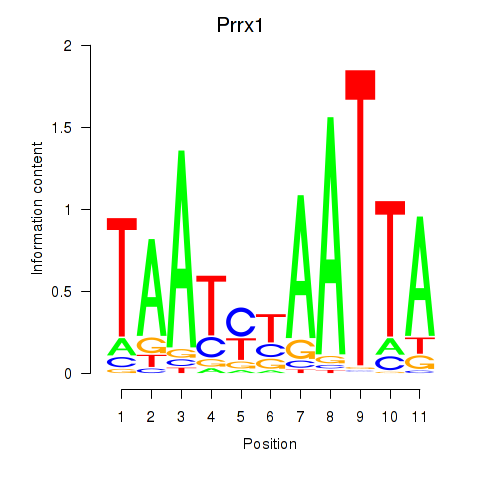
| Prrx1_Isx_Prrxl1 | 2.663 |
|
|
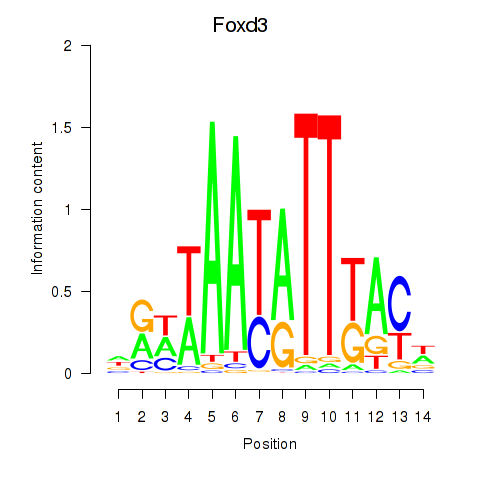
| Foxd3 | 2.644 |
|
|
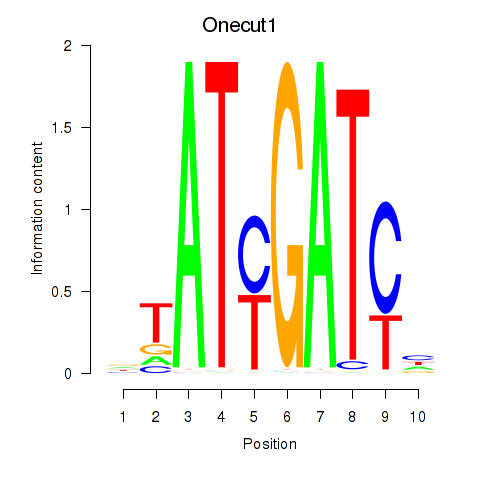
| Onecut1_Cux2 | 2.625 |
|
|
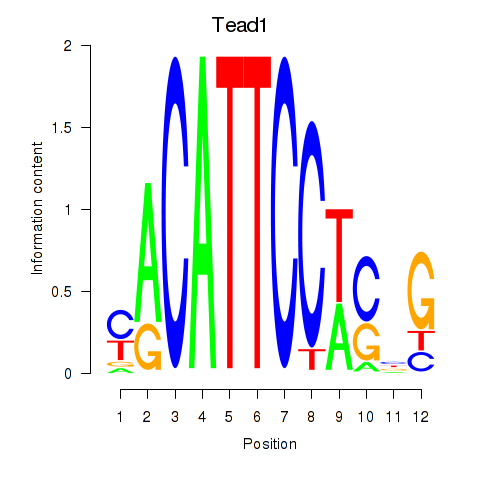
| Tead1 | 2.616 |
|
|
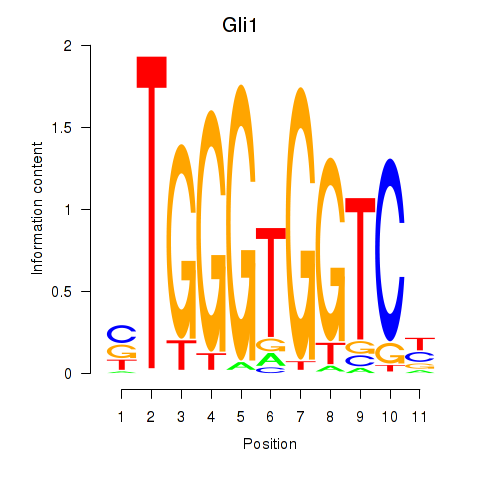
| Gli1 | 2.512 |
|
|
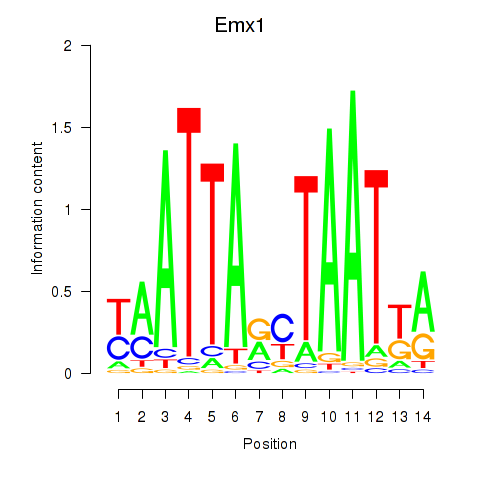
| Emx1_Emx2 | 2.483 |
|
|
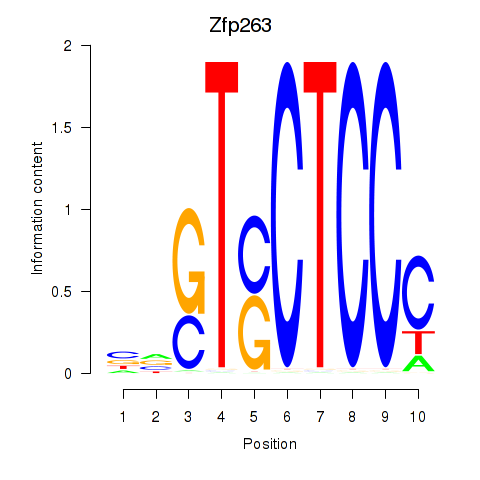
| Zfp263 | 2.481 |
|
|
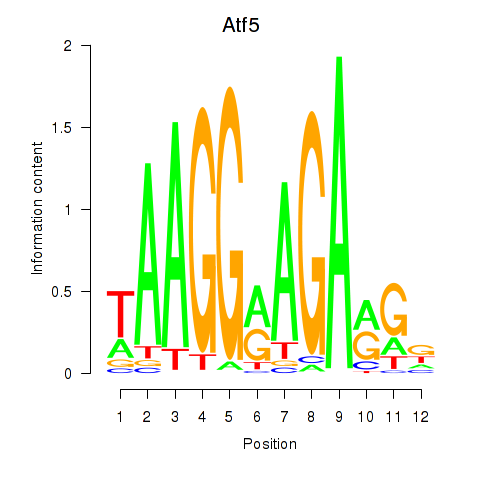
| Atf5 | 2.374 |
|
|
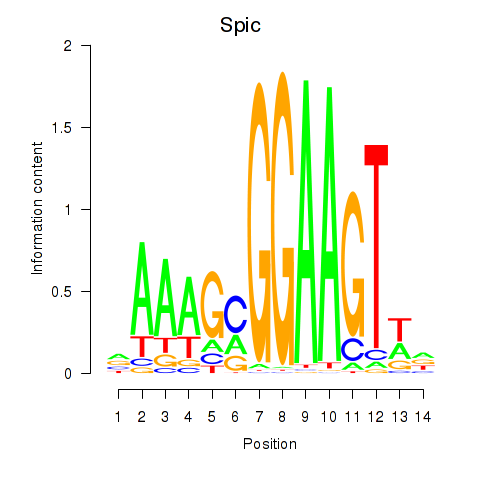
| Spic | 2.326 |
|
|
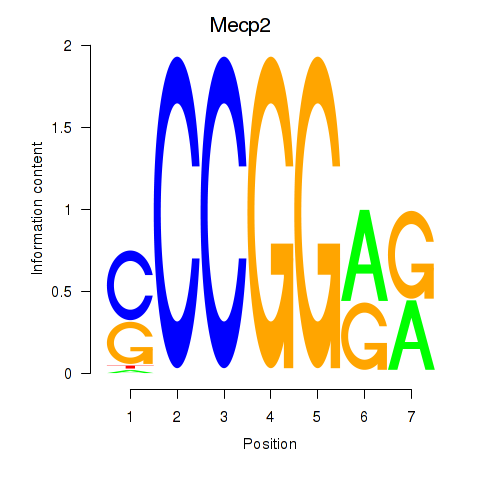
| Mecp2 | 2.314 |
|
|
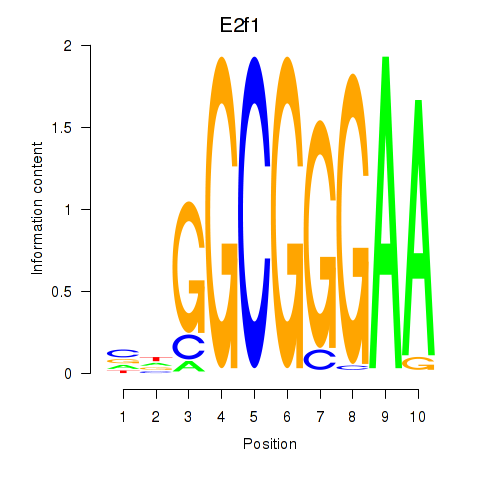
| E2f1 | 2.250 |
|
|
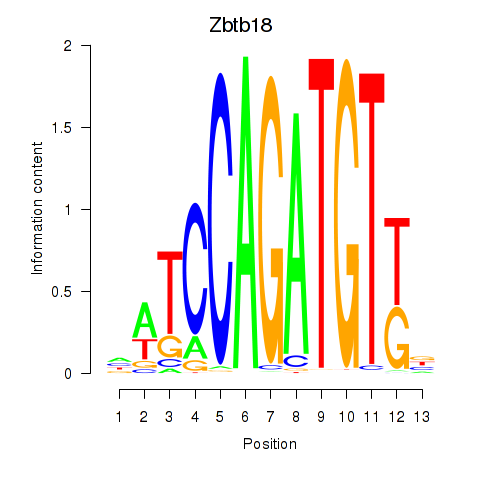
| Zbtb18 | 2.244 |
|
|
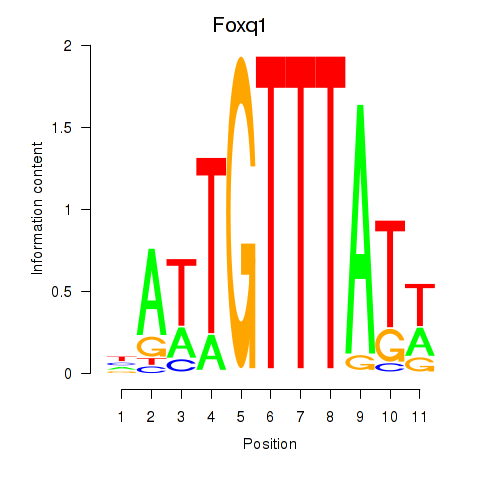
| Foxq1 | 2.239 |
|
|
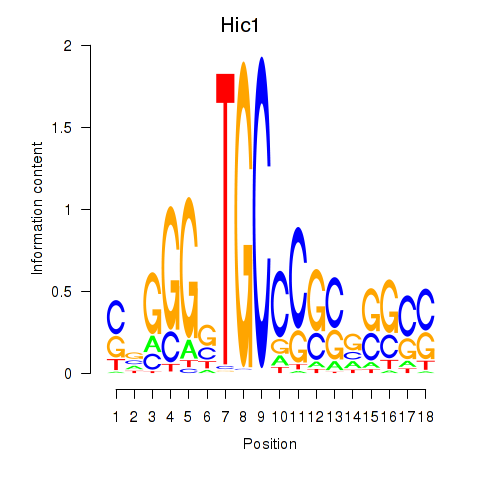
| Hic1 | 2.211 |
|
|
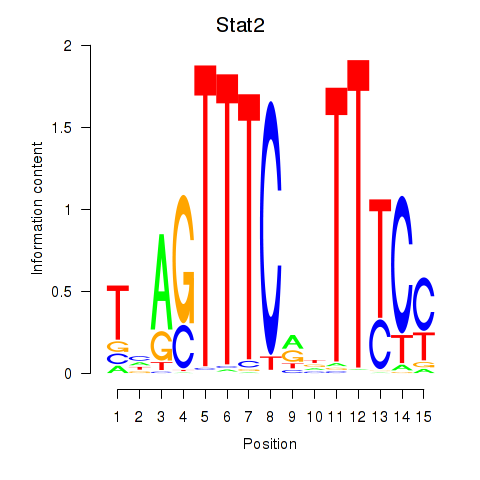
| Stat2 | 2.194 |
|
|
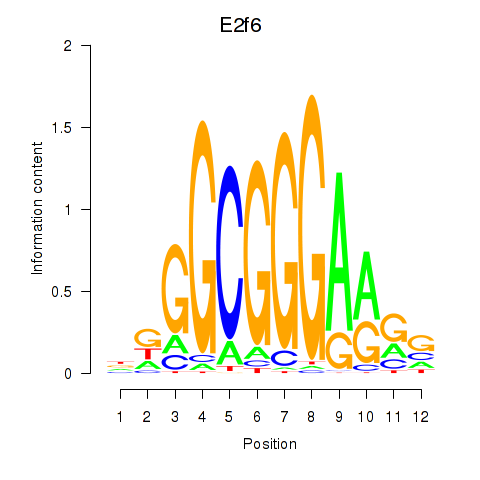
| E2f6 | 2.186 |
|
|
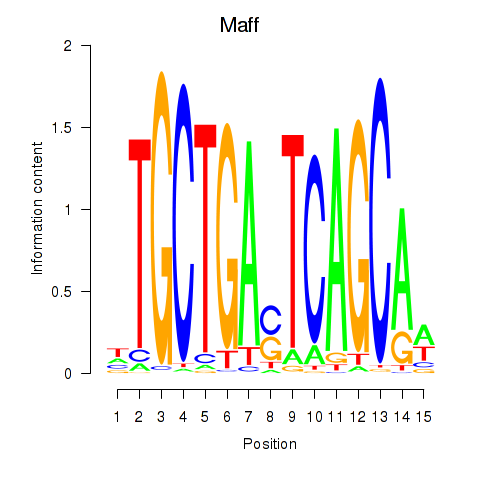
| Maff | 2.184 |
|
|
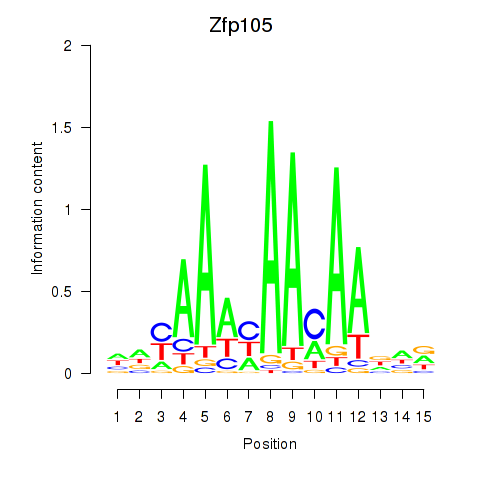
| Zfp105 | 2.090 |
|
|
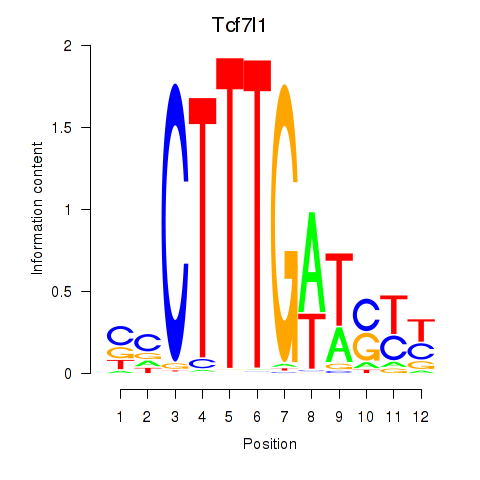
| Tcf7l1 | 2.090 |
|
|
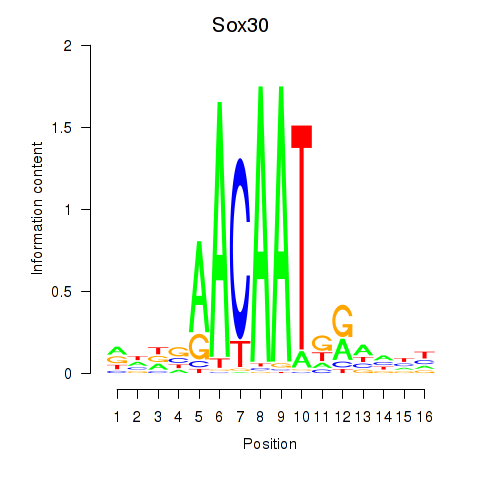
| Sox30 | 2.049 |
|
|
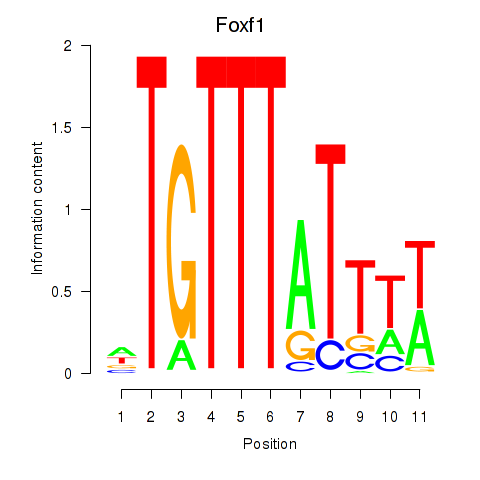
| Foxf1 | 2.045 |
|
|
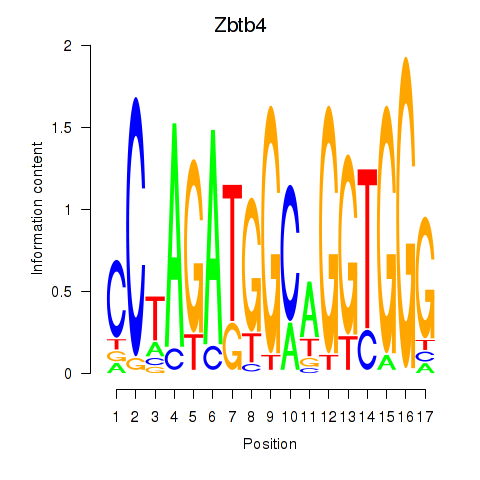
| Zbtb4 | 2.008 |
|
|
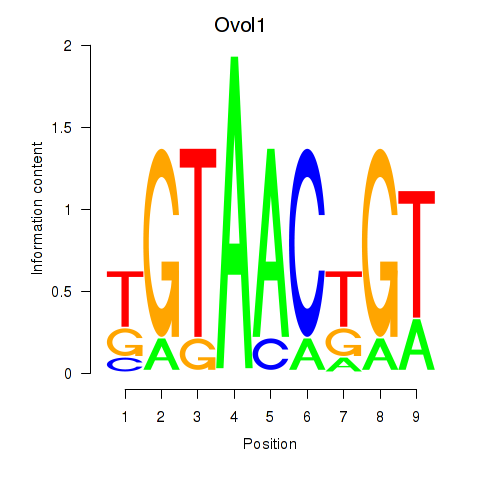
| Ovol1 | 1.990 |
|
|
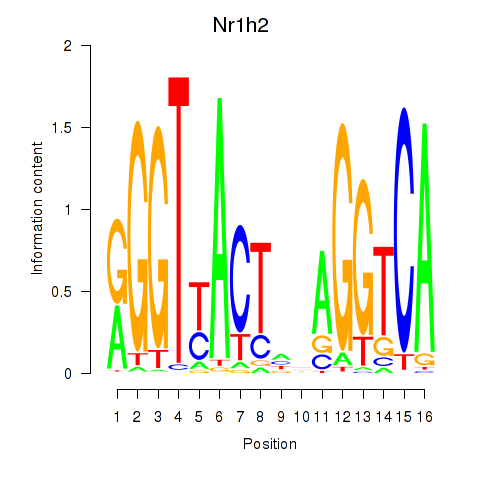
| Nr1h2 | 1.944 |
|
|
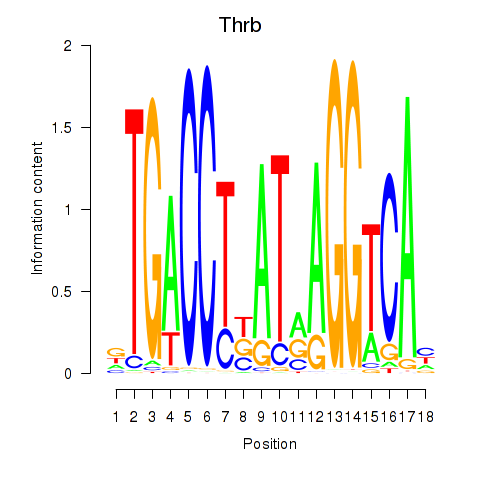
| Thrb | 1.941 |
|
|
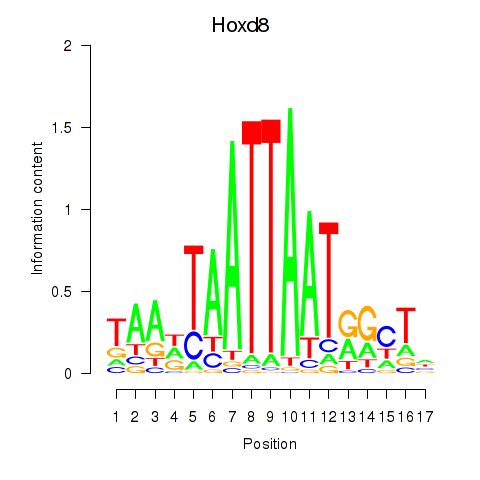
| Hoxd8 | 1.933 |
|
|
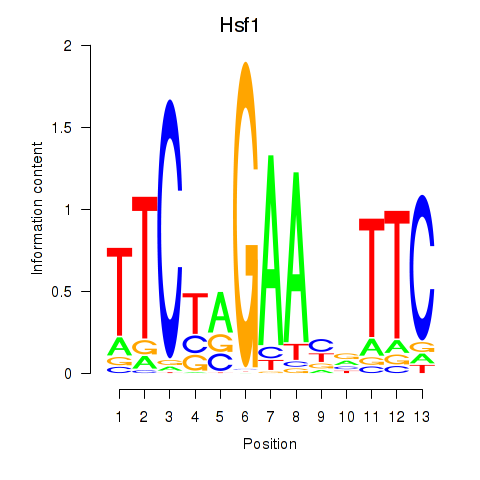
| Hsf1 | 1.927 |
|
|
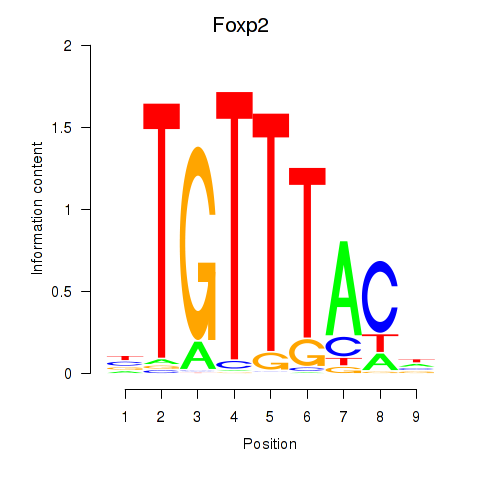
| Foxp2_Foxp3 | 1.897 |
|
|
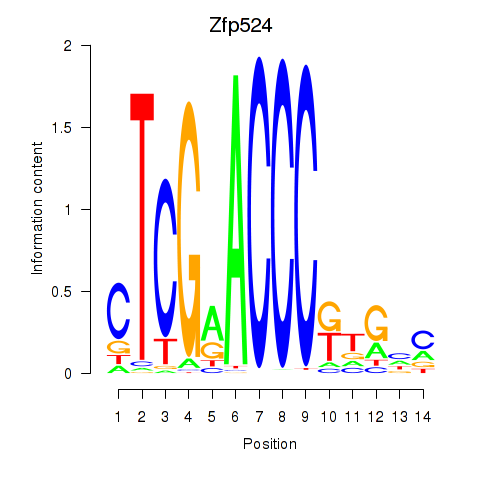
| Zfp524 | 1.882 |
|
|
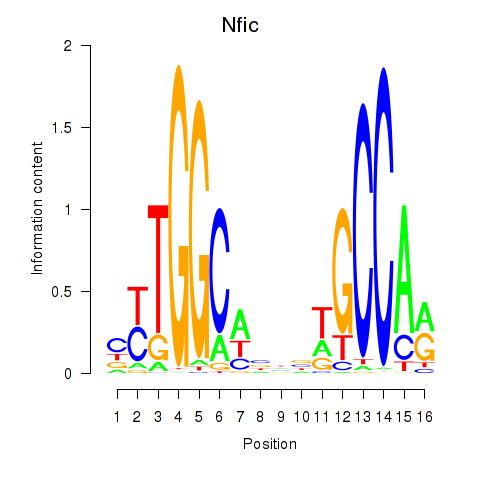
| Nfic_Nfib | 1.860 |
|
|
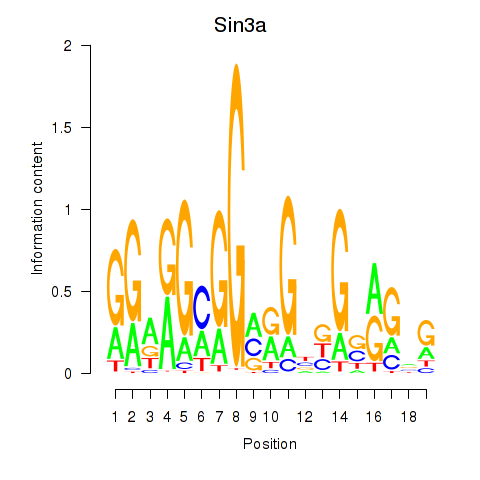
| Sin3a | 1.824 |
|
|
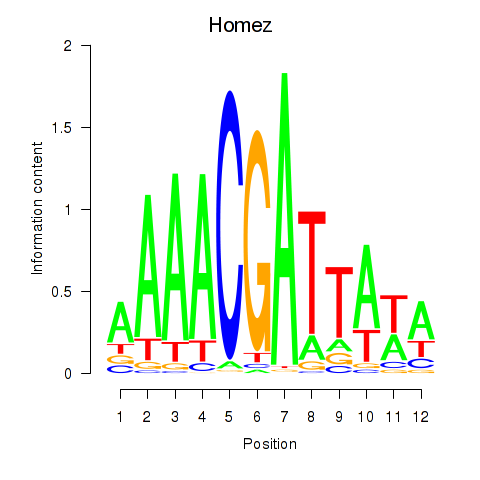
| Homez | 1.816 |
|
|
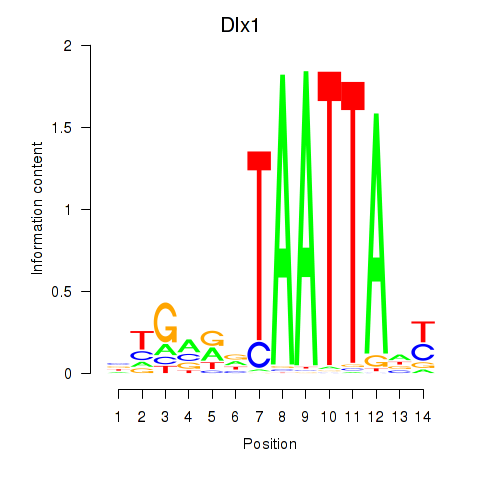
| Dlx1 | 1.799 |
|
|
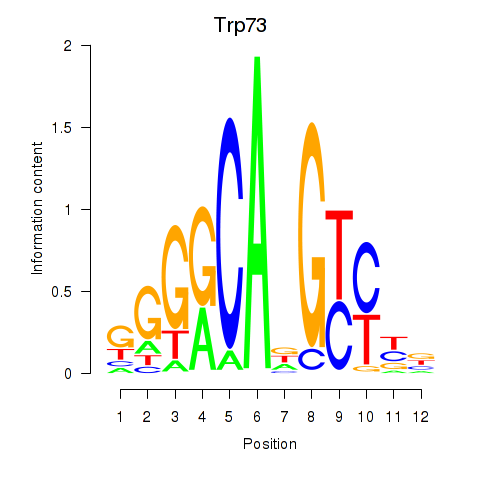
| Trp73 | 1.750 |
|
|
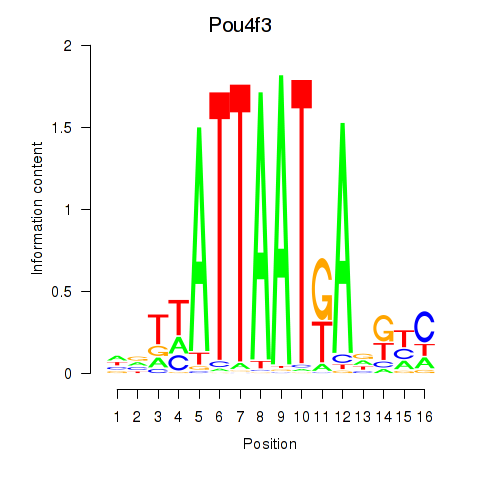
| Pou4f3 | 1.735 |
|
|
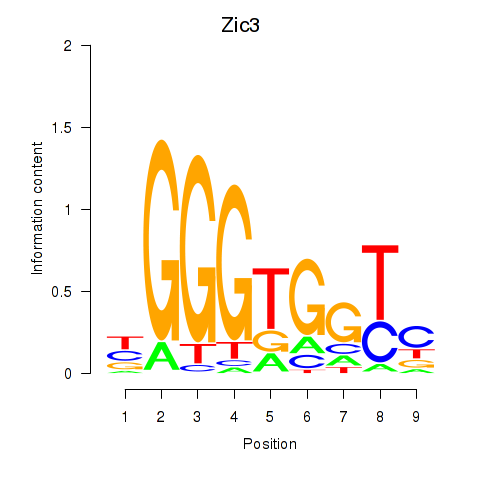
| Zic3 | 1.690 |
|
|
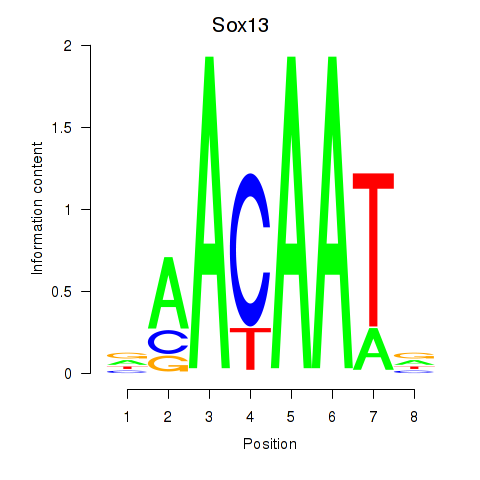
| Sox13 | 1.666 |
|
|
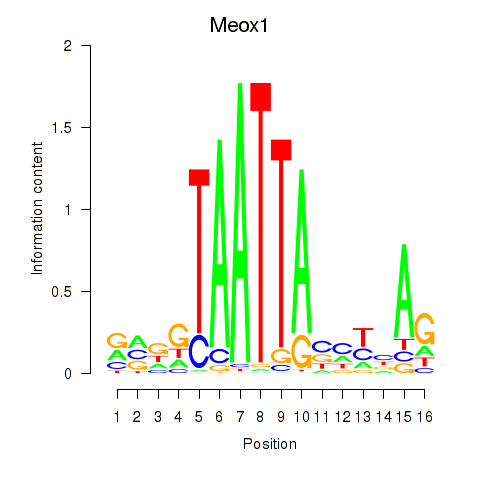
| Meox1 | 1.659 |
|
|
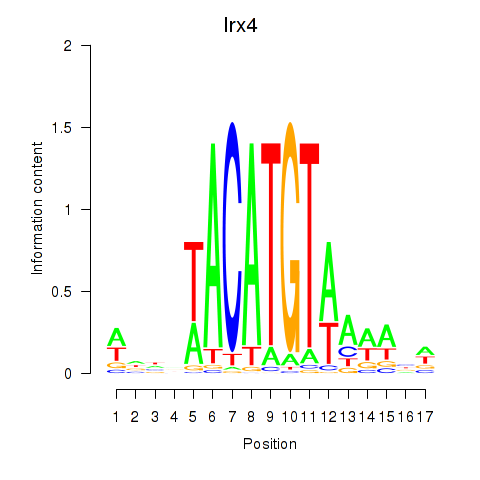
| Irx4 | 1.600 |
|
|
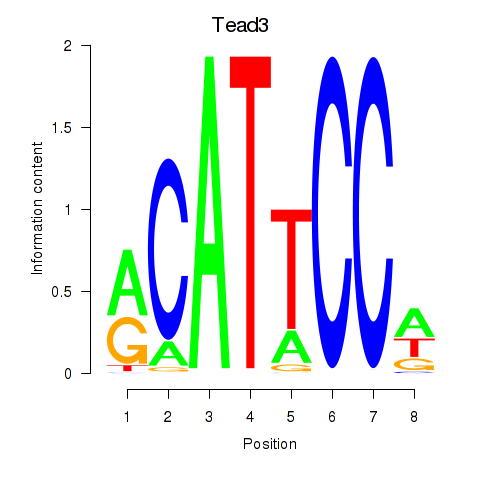
| Tead3_Tead4 | 1.600 |
|
|
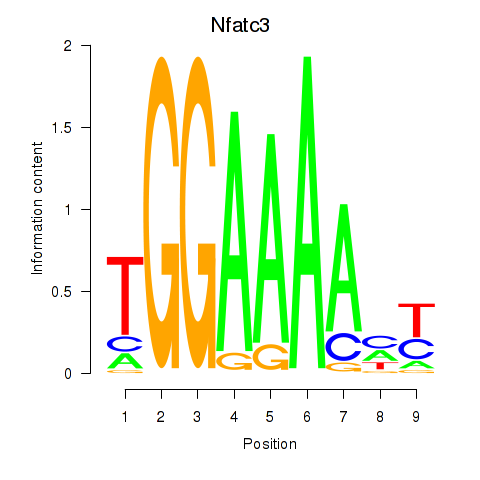
| Nfatc3 | 1.590 |
|
|
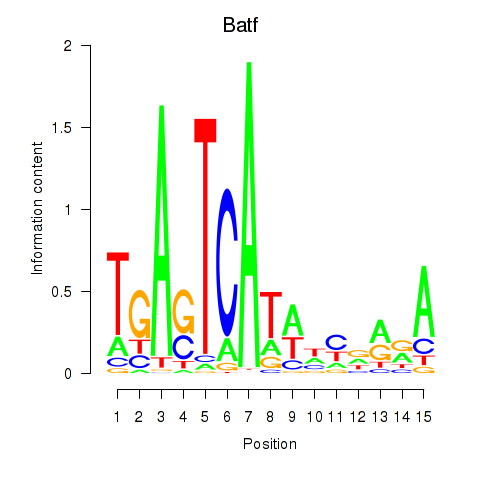
| Batf | 1.586 |
|
|
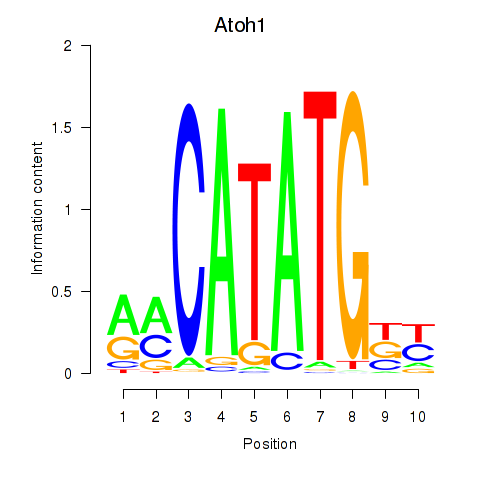
| Atoh1_Bhlhe23 | 1.546 |
|
|
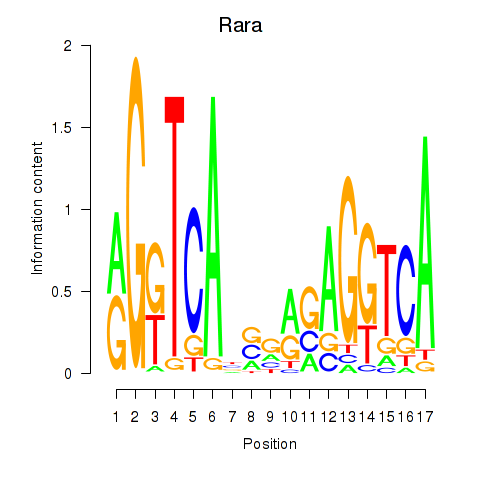
| Rara | 1.541 |
|
|
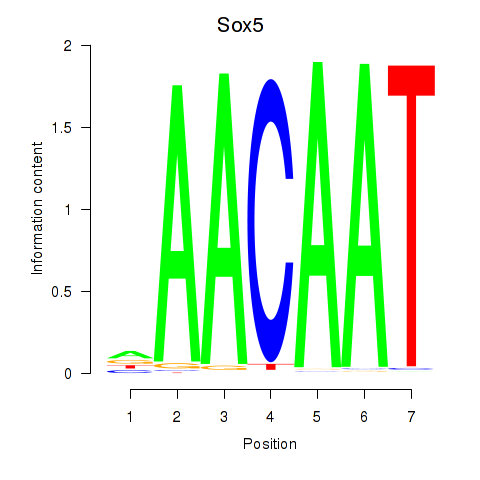
| Sox5_Sry | 1.514 |
|
|
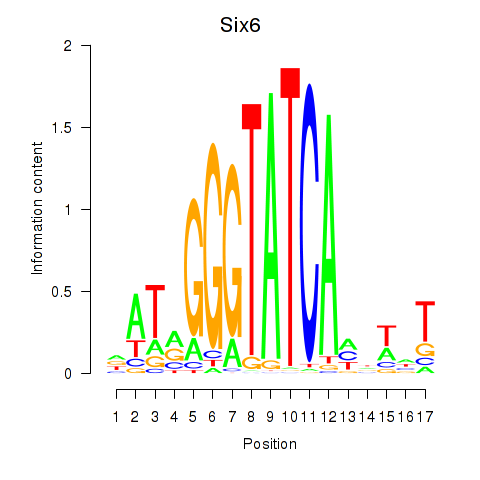
| Six6 | 1.491 |
|
|
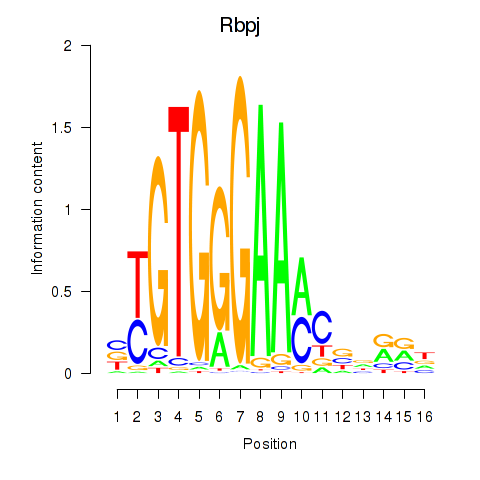
| Rbpj | 1.491 |
|
|
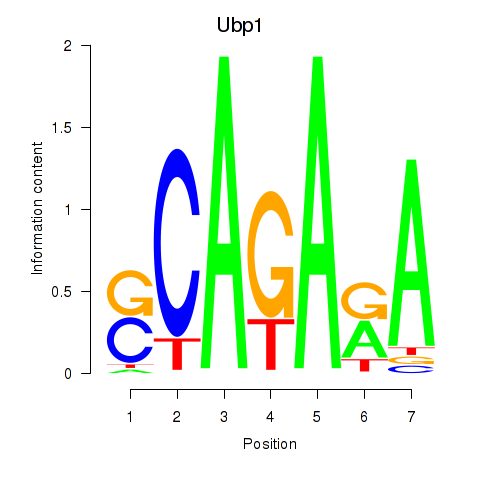
| Ubp1 | 1.480 |
|
|
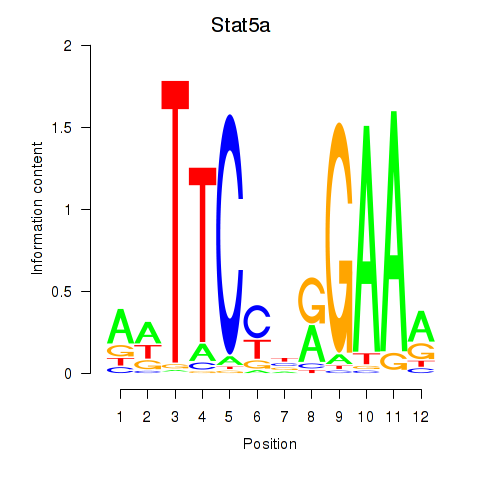
| Stat5a | 1.469 |
|
|
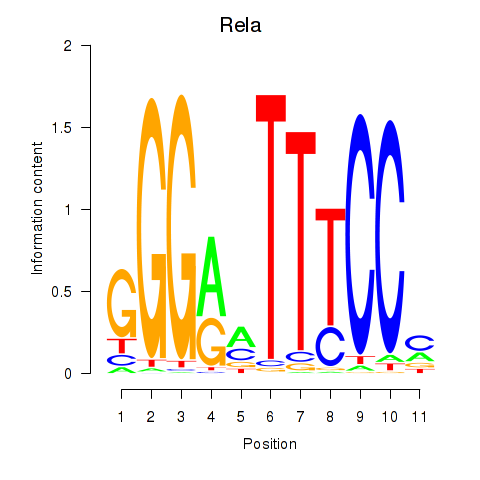
| Rela_Rel_Nfkb1 | 1.453 |
|
|
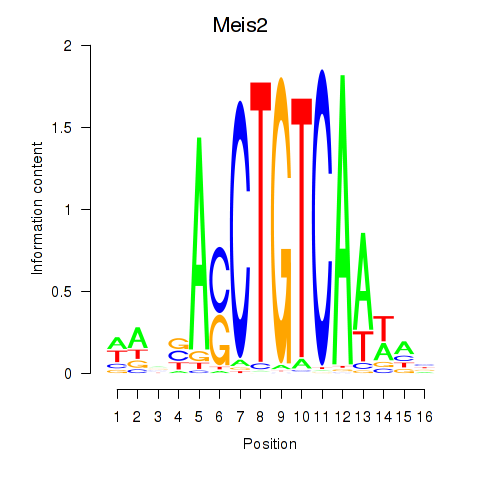
| Meis2 | 1.433 |
|
|
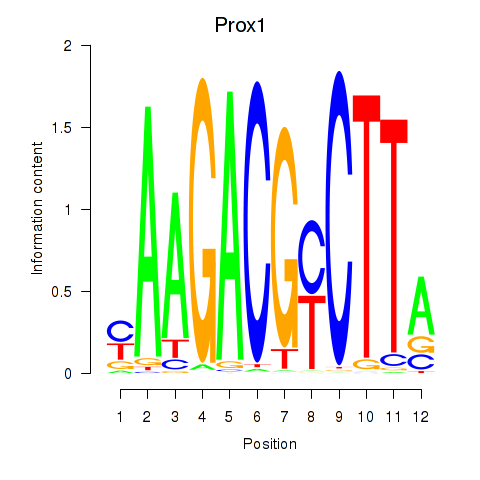
| Prox1 | 1.361 |
|
|
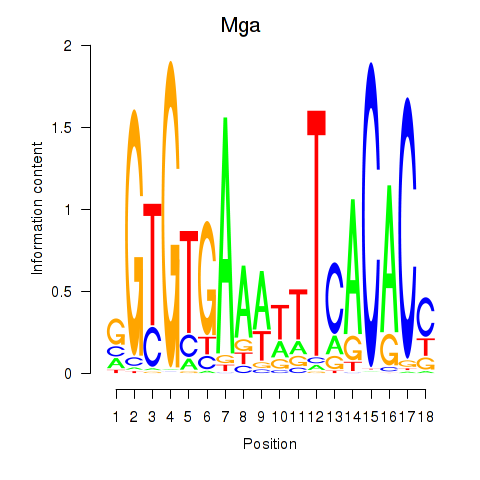
| Mga | 1.357 |
|
|
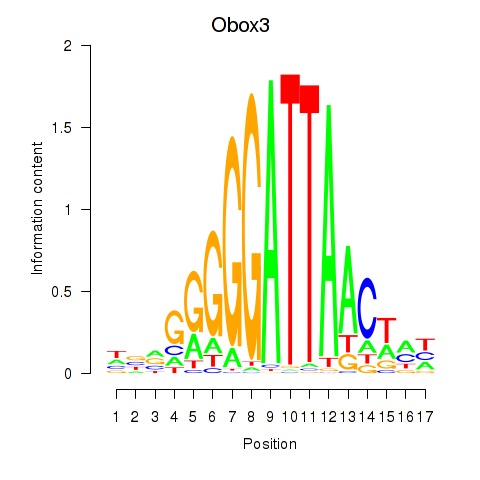
| Obox3 | 1.343 |
|
|
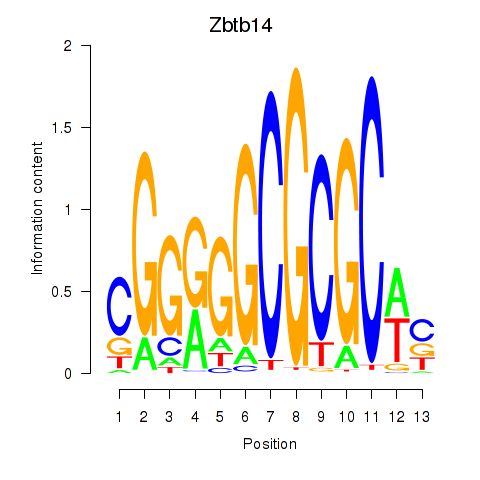
| Zbtb14 | 1.340 |
|
|
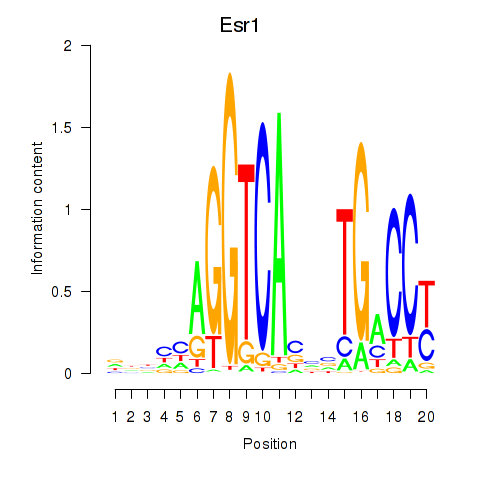
| Esr1 | 1.322 |
|
|
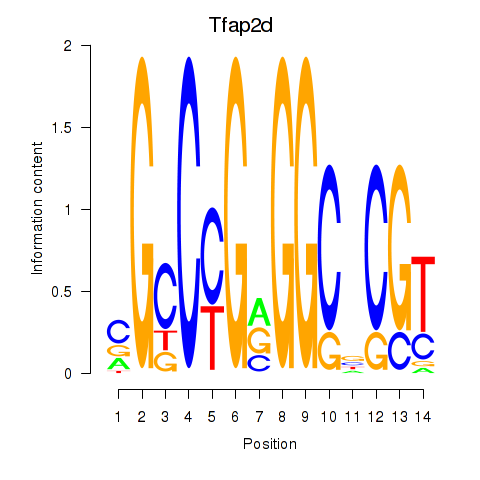
| Tfap2d | 1.311 |
|
|
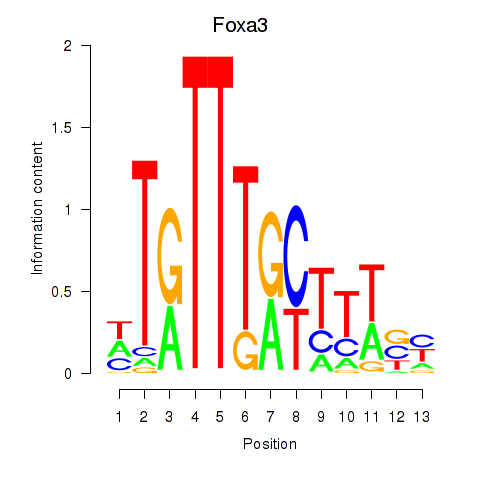
| Foxa3 | 1.202 |
|
|
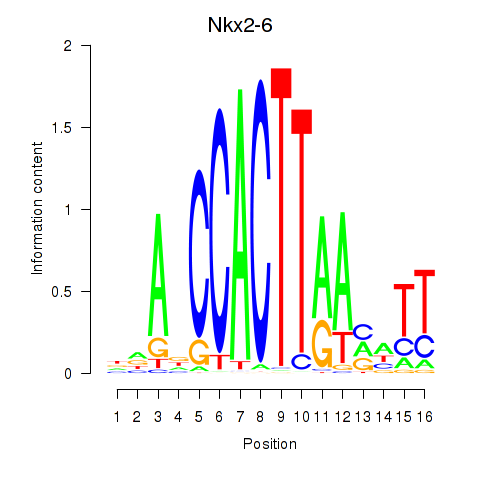
| Nkx2-6 | 1.196 |
|
|
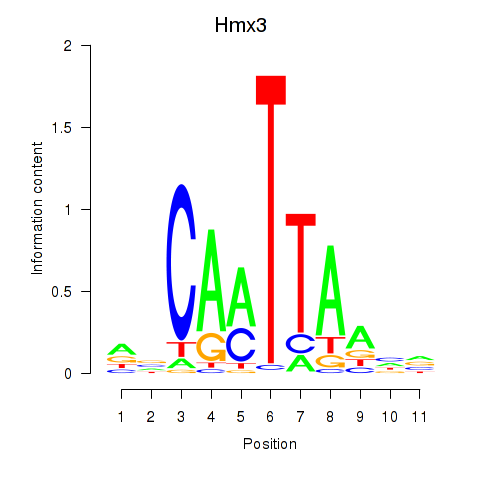
| Hmx3 | 1.192 |
|
|
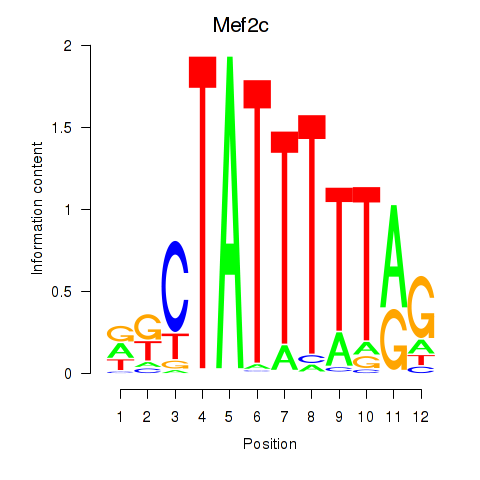
| Mef2c | 1.127 |
|
|
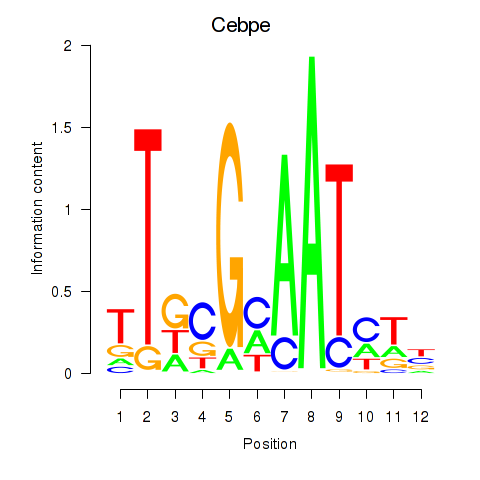
| Cebpe | 1.120 |
|
|
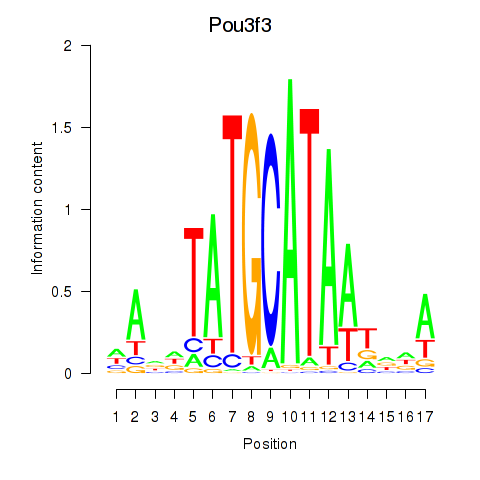
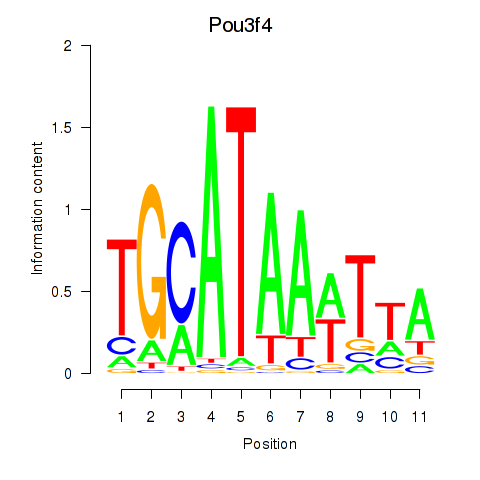
| Pou3f3 | 1.120 |
|
|
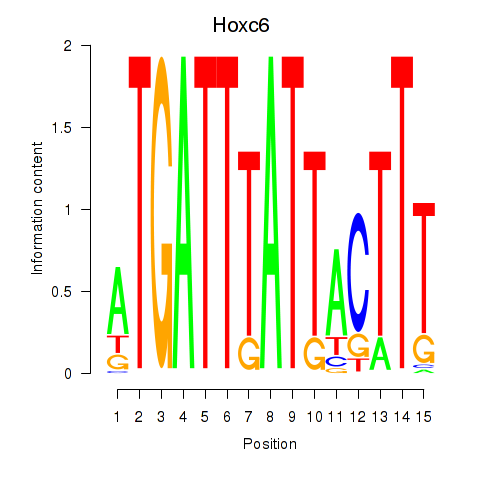
| Hoxc6 | 1.114 |
|
|
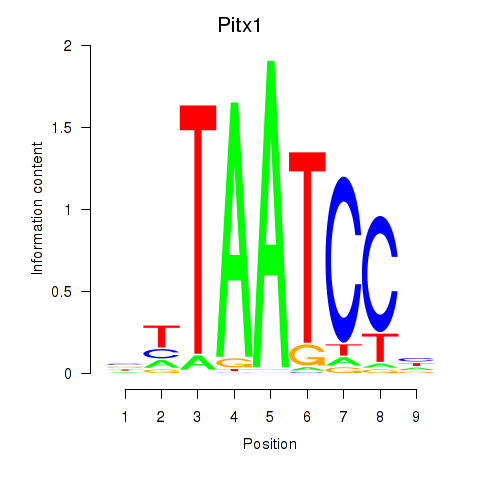
| Pitx1 | 1.113 |
|
|
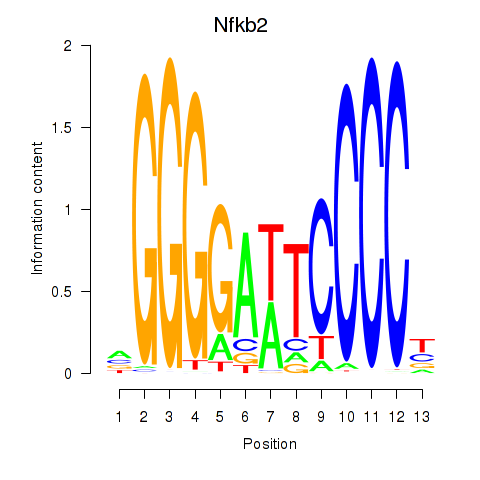
| Nfkb2 | 1.092 |
|
|
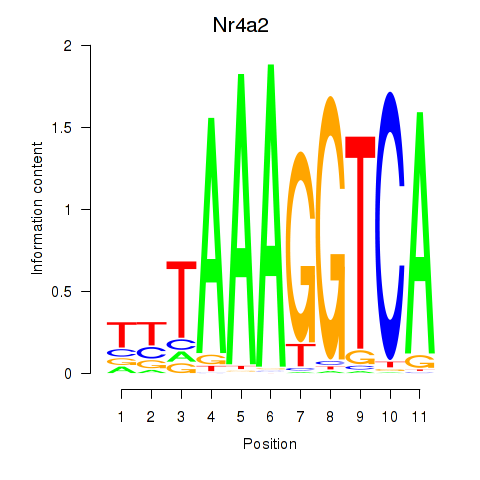
| Nr4a2 | 1.042 |
|
|
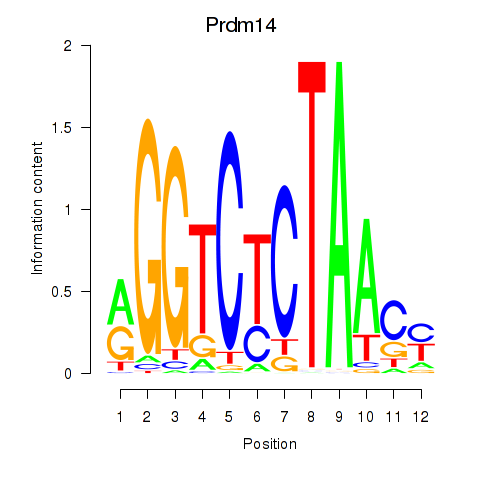
| Prdm14 | 0.994 |
|
|
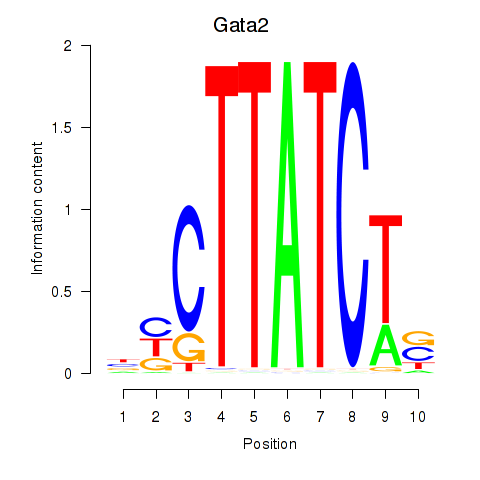
| Gata2_Gata1 | 0.983 |
|
|
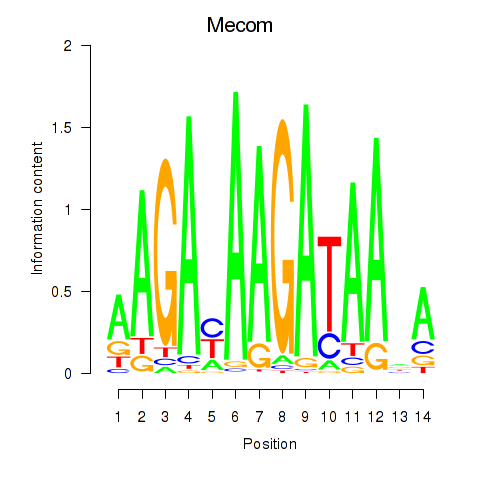
| Mecom | 0.977 |
|
|
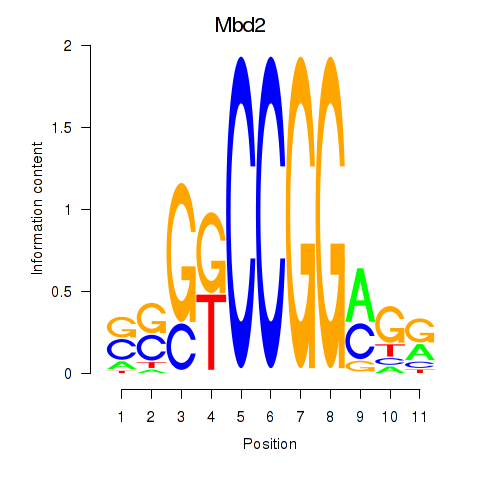
| Mbd2 | 0.943 |
|
|
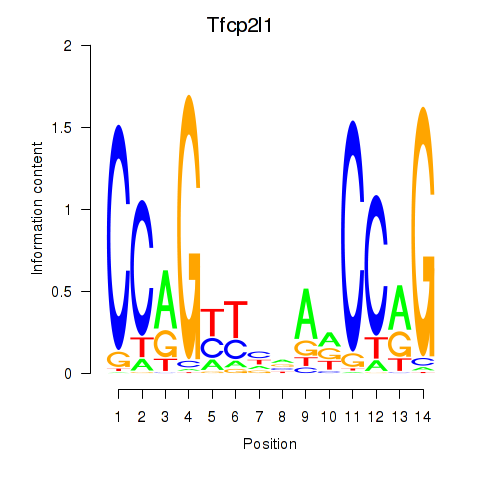
| Tfcp2l1 | 0.923 |
|
|
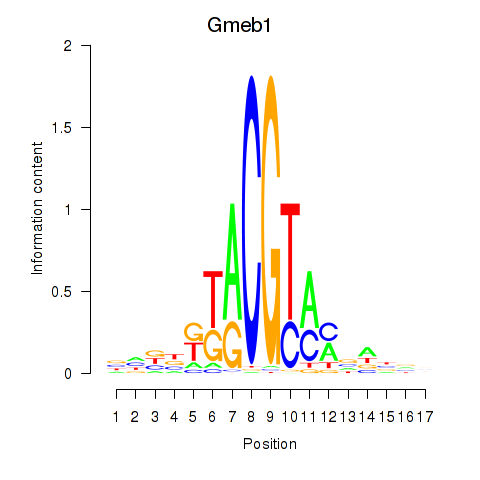
| Gmeb1 | 0.905 |
|
|
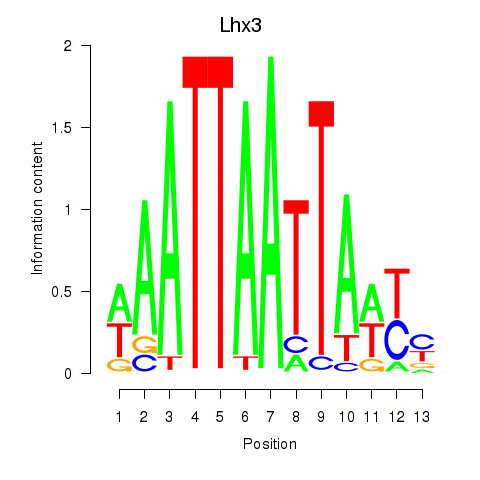
| Lhx3 | 0.871 |
|
|
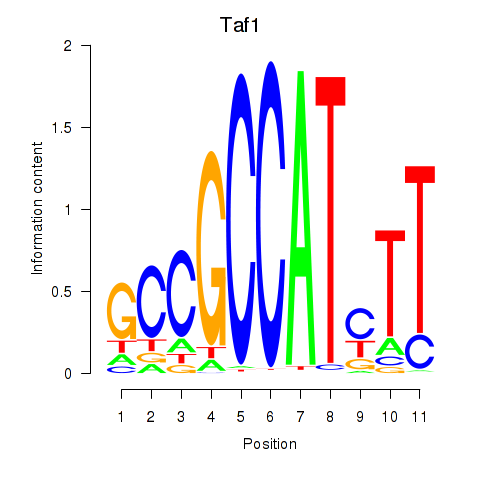
| Taf1 | 0.863 |
|
|
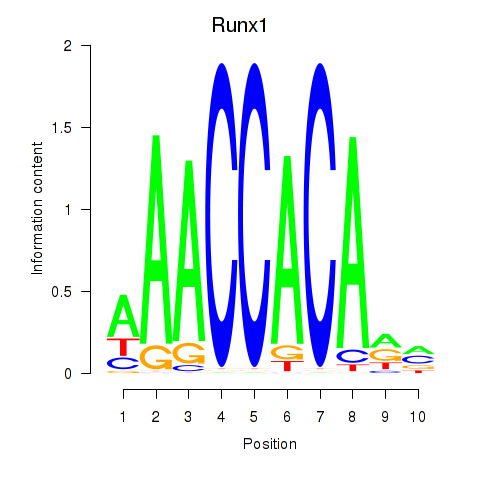
| Runx1 | 0.838 |
|
|
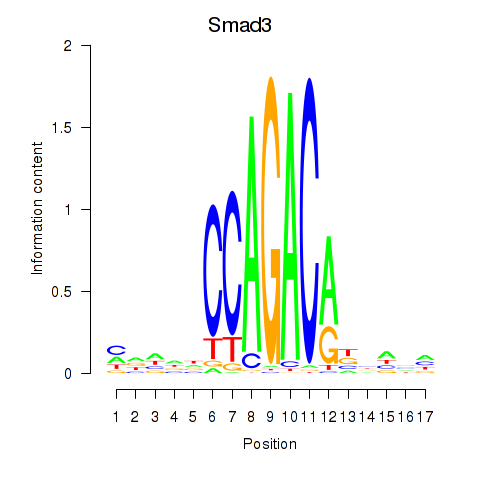
| Smad3 | 0.806 |
|
|
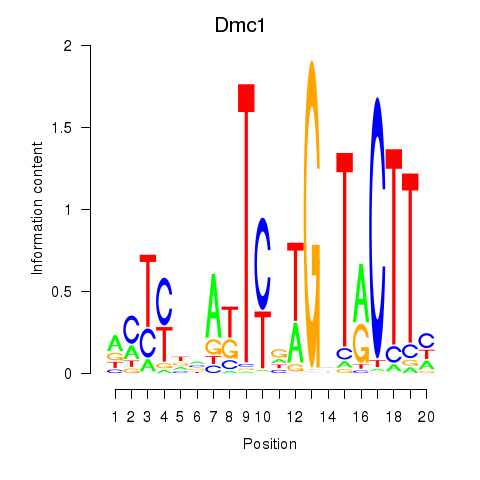
| Dmc1 | 0.790 |
|
|
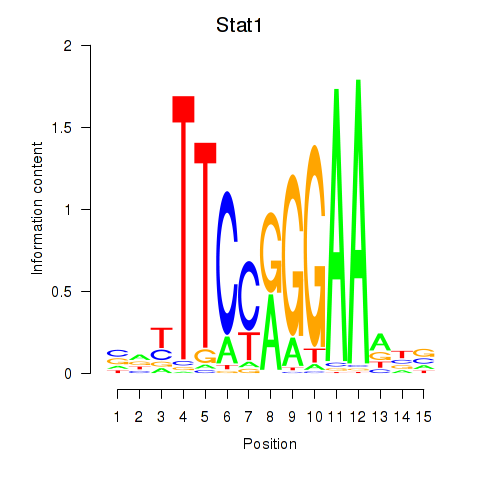
| Stat1 | 0.784 |
|
|
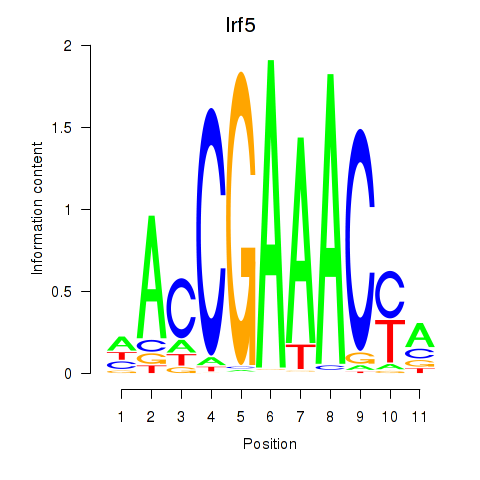
| Irf5_Irf6 | 0.763 |
|
|
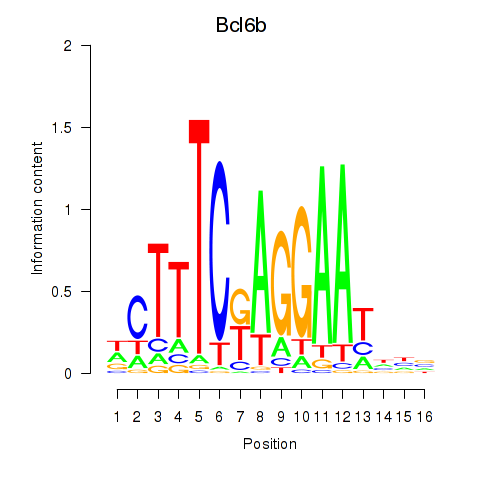
| Bcl6b | 0.762 |
|
|
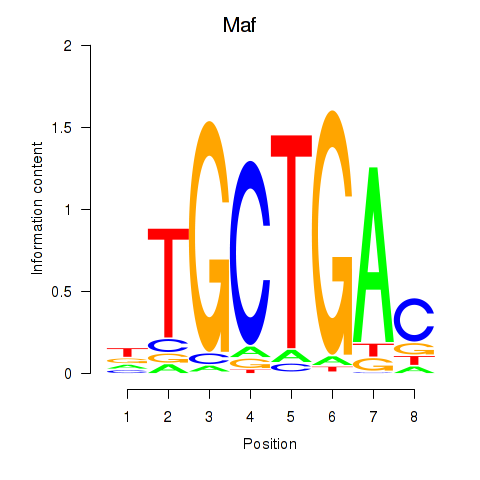
| Maf_Nrl | 0.744 |
|
|
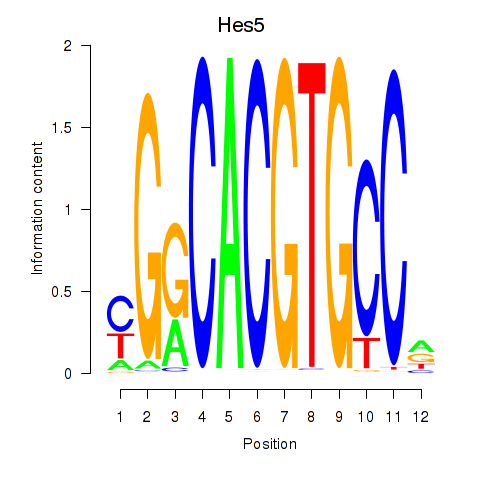
| Hes5_Hes7 | 0.724 |
|
|
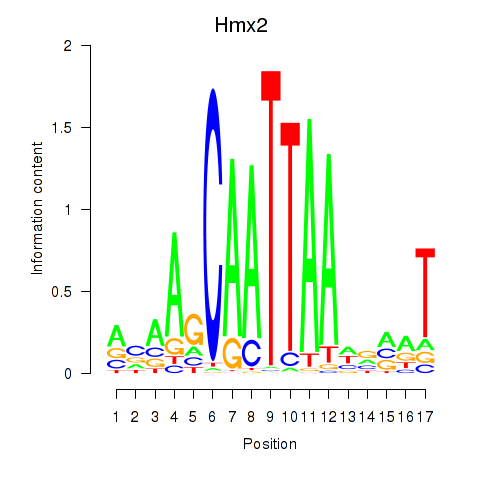
| Hmx2 | 0.714 |
|
|
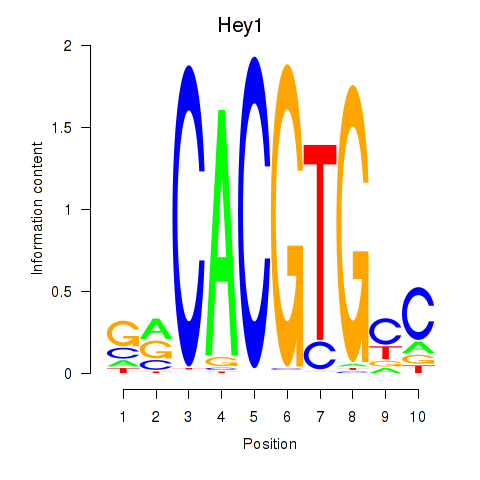
| Hey1_Myc_Mxi1 | 0.701 |
|
|
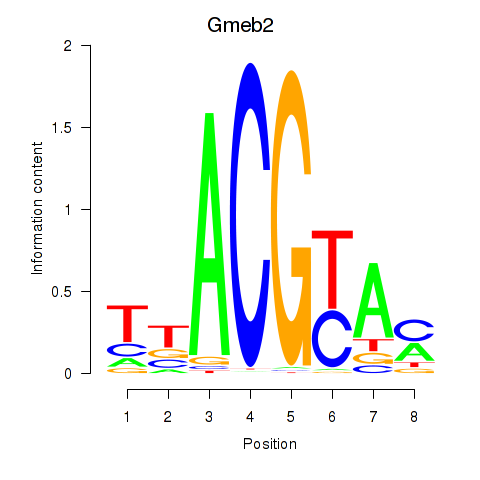
| Gmeb2 | 0.688 |
|
|
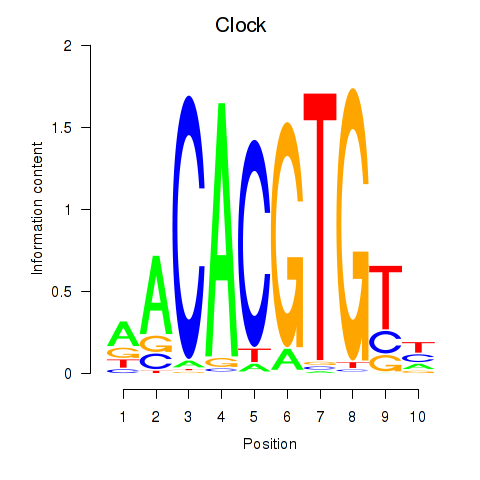
| Clock | 0.665 |
|
|
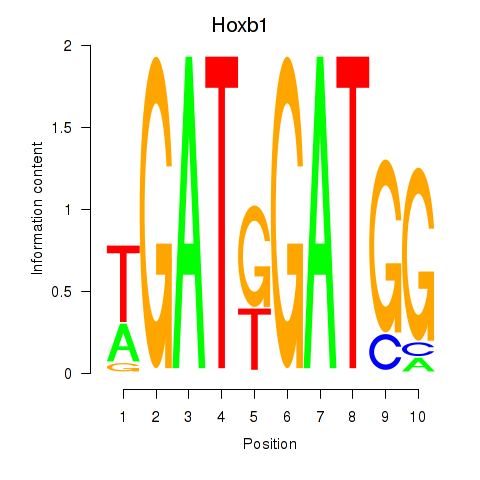
| Hoxb1 | 0.665 |
|
|
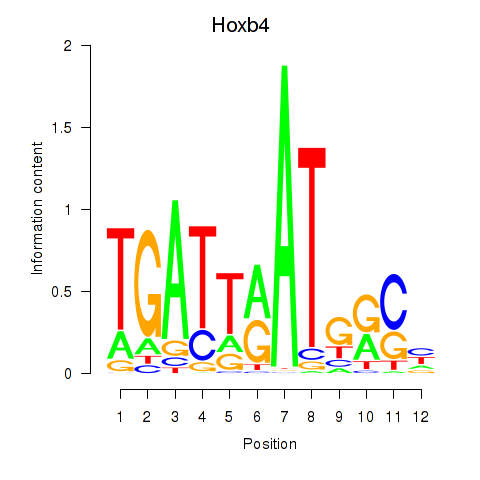
| Hoxb4 | 0.651 |
|
|
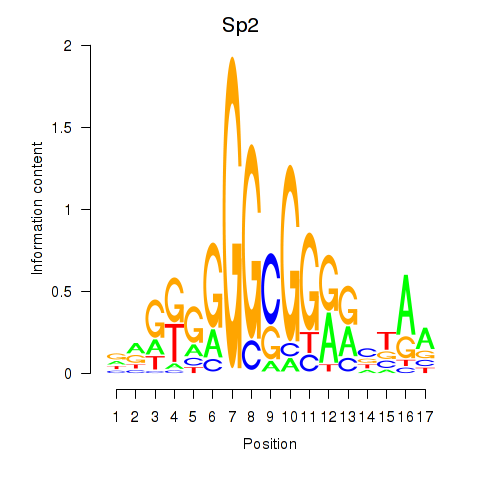
| Sp2 | 0.624 |
|
|
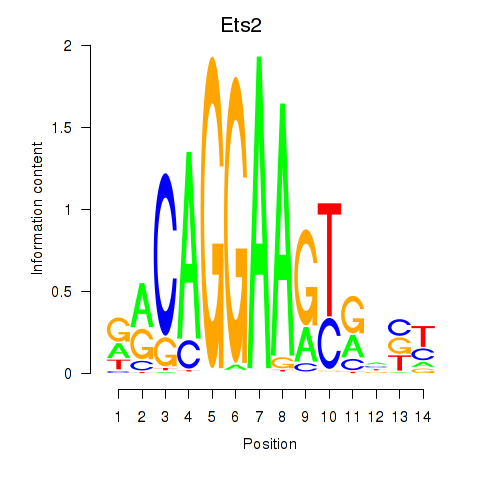
| Ets2 | 0.618 |
|
|
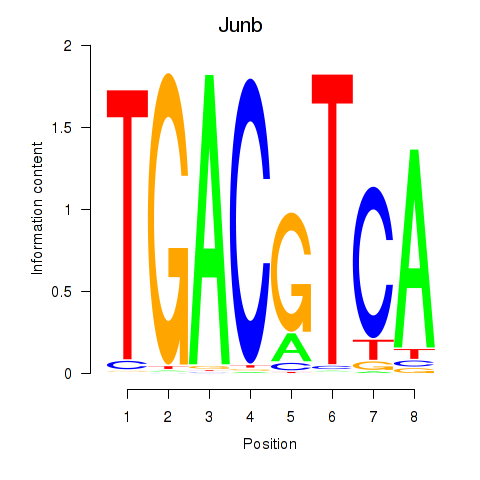
| Junb_Jund | 0.597 |
|
|
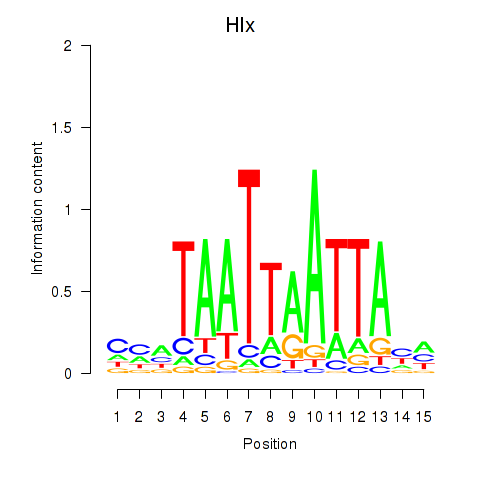
| Hlx | 0.596 |
|
|
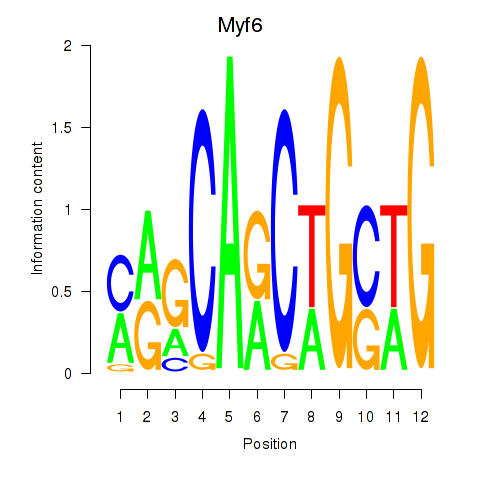
| Myf6 | 0.583 |
|
|
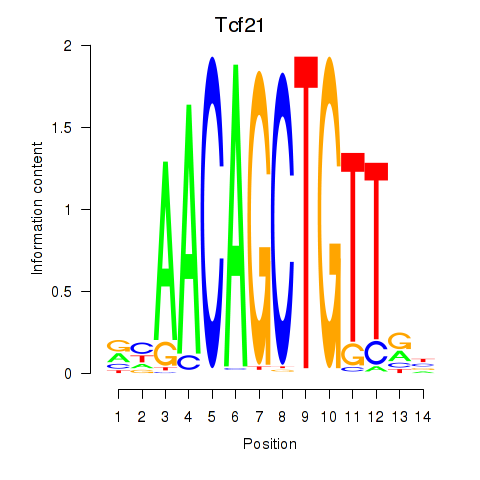
| Tcf21_Msc | 0.578 |
|
|
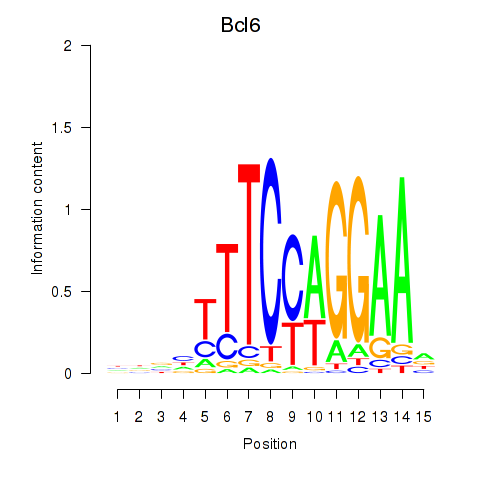
| Bcl6 | 0.568 |
|
|
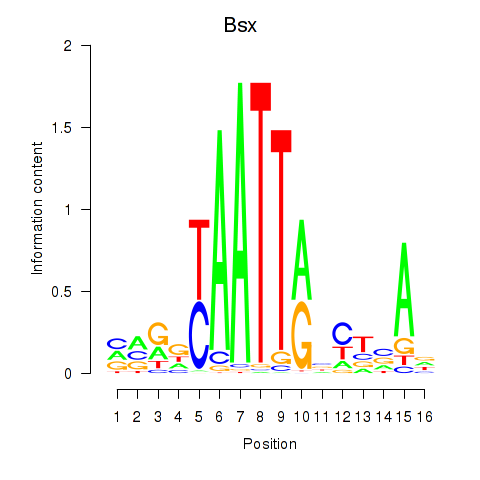
| Bsx | 0.556 |
|
|
| E2f8 | 0.551 |
|
|
| Zscan4c | 0.540 |
|
|
| Zic4 | 0.526 |
|
|
| Hivep1 | 0.517 |
|
|
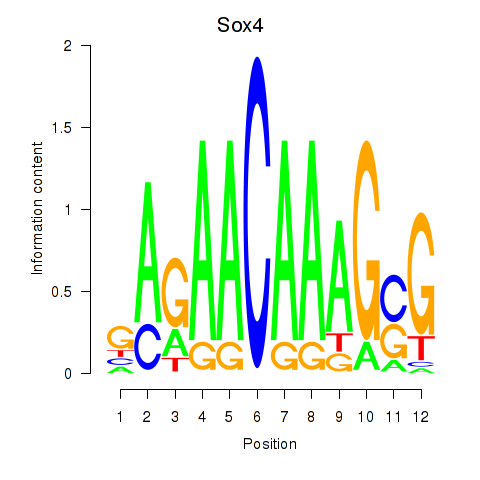
| Sox4 | 0.513 |
|
|
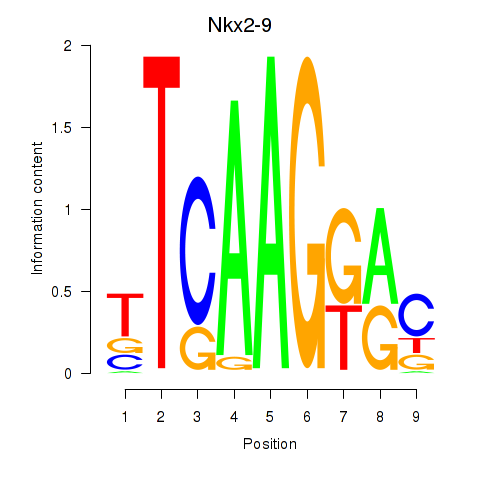
| Nkx2-9 | 0.510 |
|
|
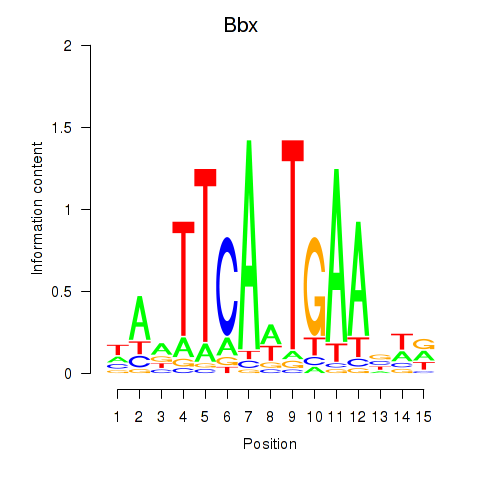
| Bbx | 0.466 |
|
|
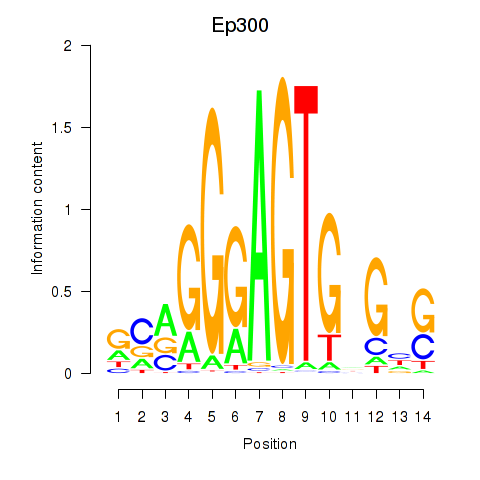
| Ep300 | 0.463 |
|
|
| Rxrb | 0.454 |
|
|
| Xbp1_Creb3l1 | 0.437 |
|
|
| Creb3l2 | 0.427 |
|
|
| Hif1a | 0.426 |
|
|
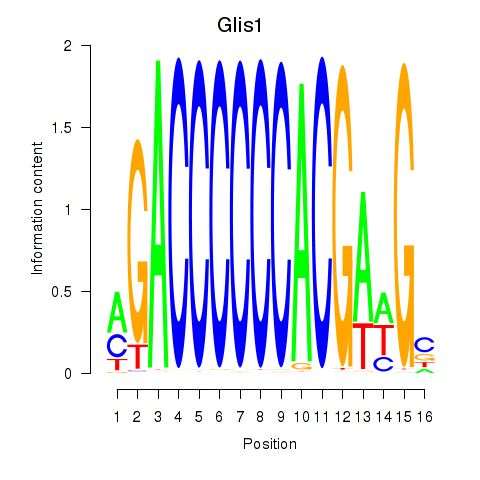
| Glis1 | 0.397 |
|
|
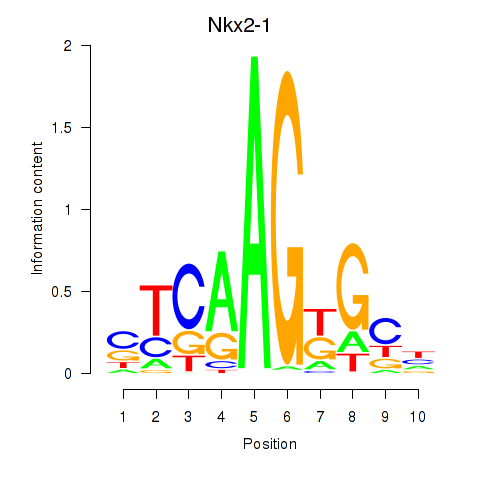
| Nkx2-1 | 0.393 |
|
|
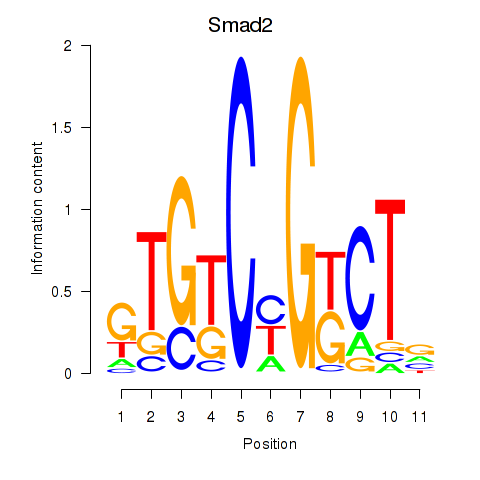
| Smad2 | 0.374 |
|
|
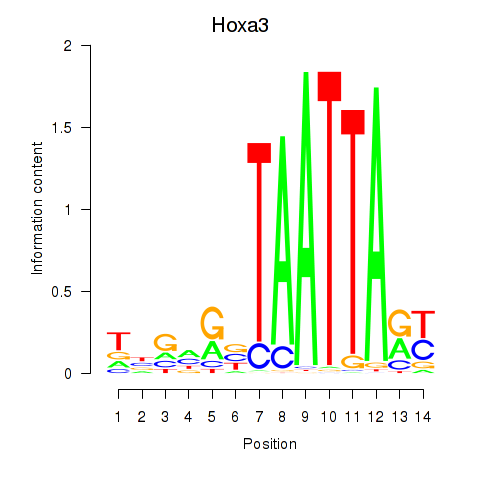
| Hoxa3 | 0.360 |
|
|
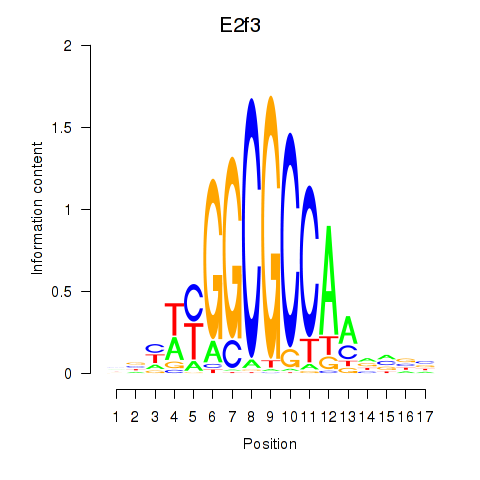
| E2f3 | 0.360 |
|
|
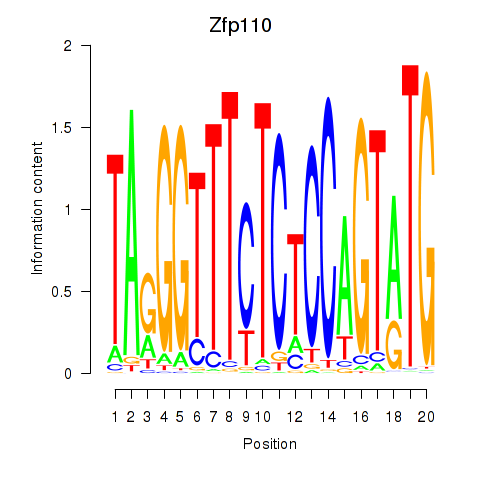
| Zfp110 | 0.352 |
|
|
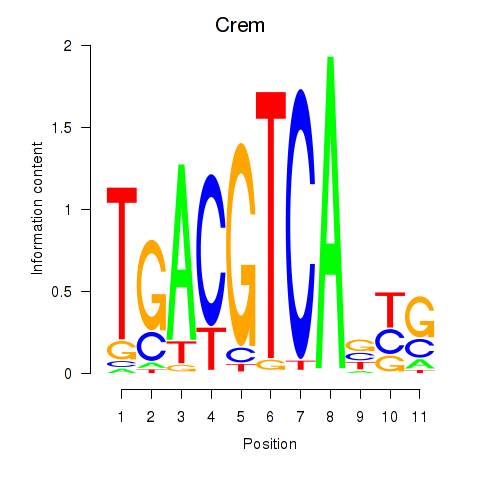
| Crem_Jdp2 | 0.352 |
|
|
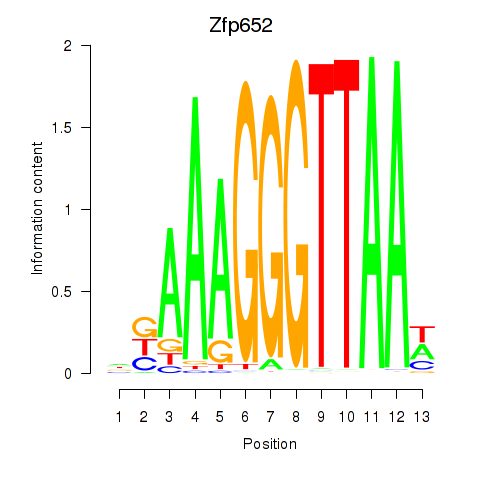
| Zfp652 | 0.314 |
|
|
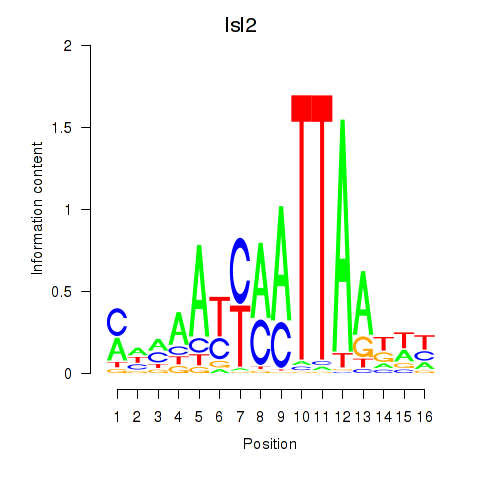
| Isl2 | 0.279 |
|
|
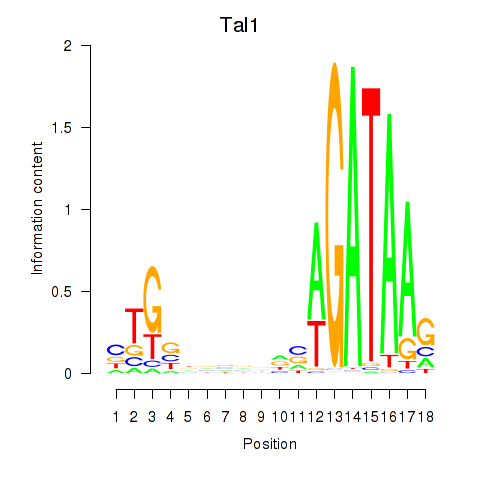
| Tal1 | 0.266 |
|
|
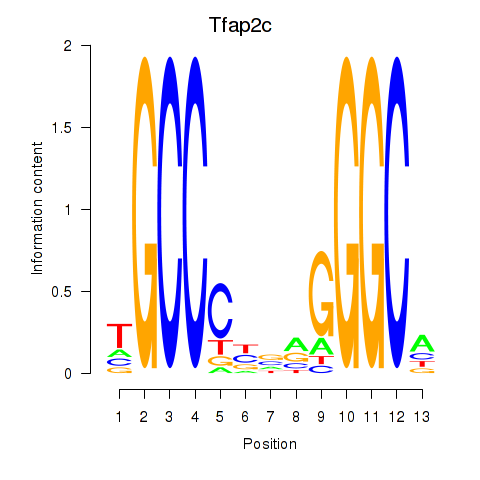
| Tfap2c | 0.213 |
|
|
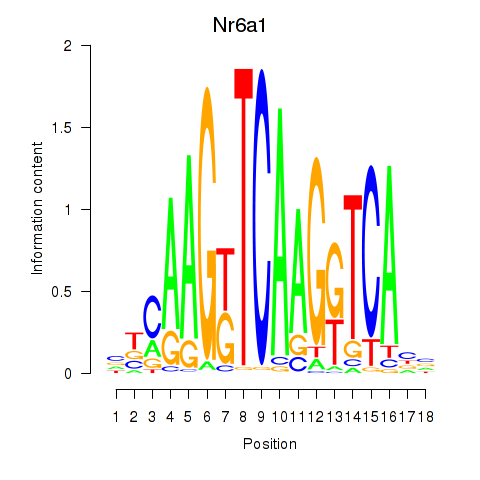
| Nr6a1 | 0.177 |
|
|
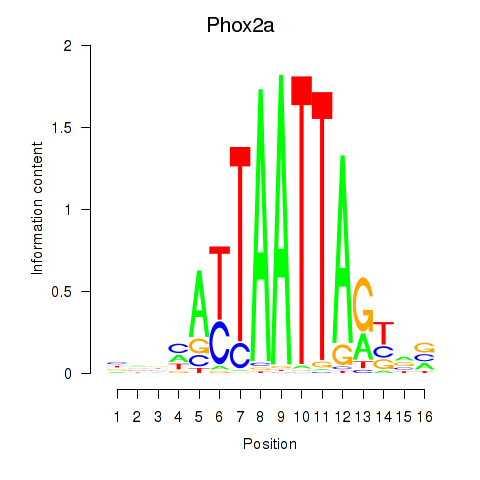
| Phox2a | 0.159 |
|
|
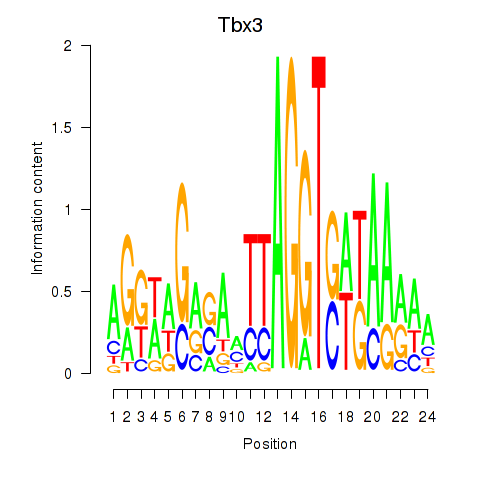
| Tbx3 | 0.147 |
|
|
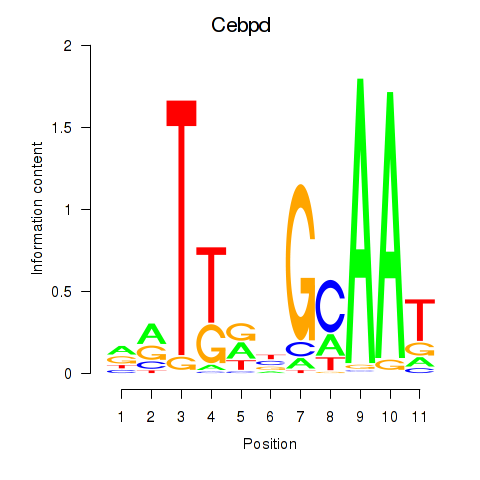
| Cebpd | 0.133 |
|
|
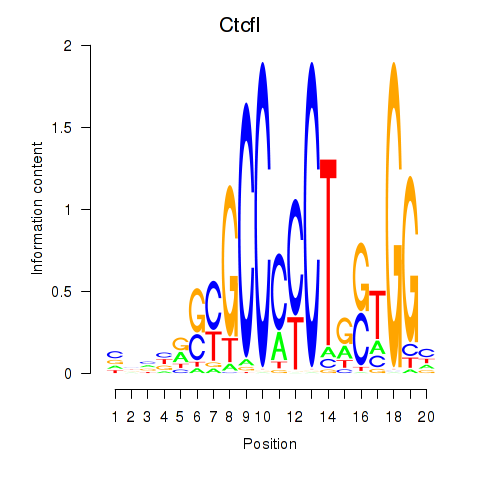
| Ctcfl_Ctcf | 0.128 |
|
|
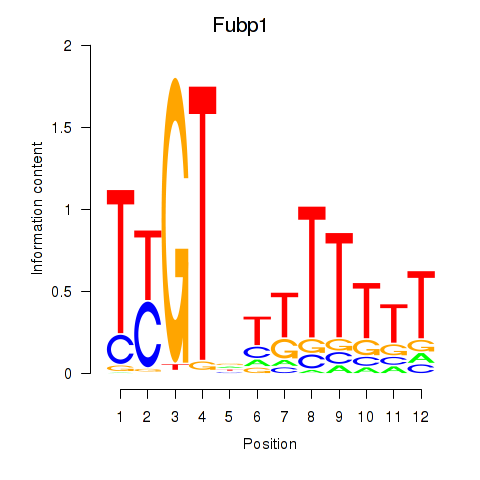
| Fubp1 | 0.126 |
|
|
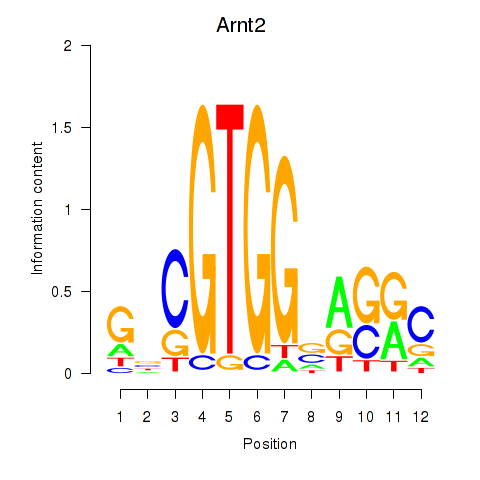
| Arnt2 | 0.119 |
|
|
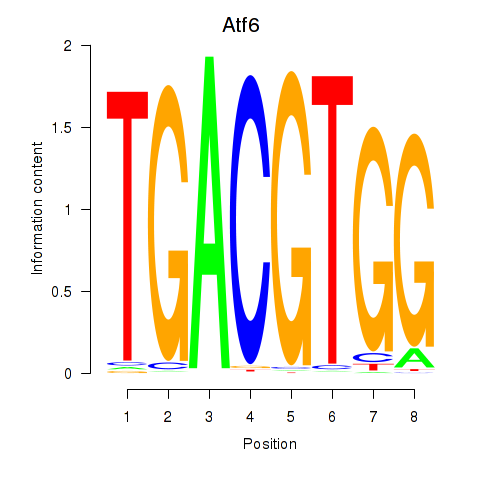
| Atf6 | 0.096 |
|
|
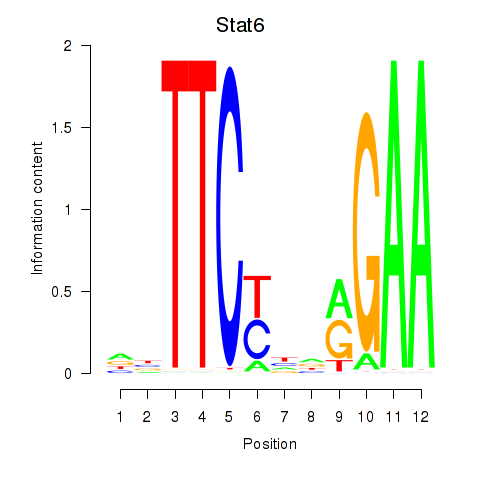
| Stat6 | 0.082 |
|
|
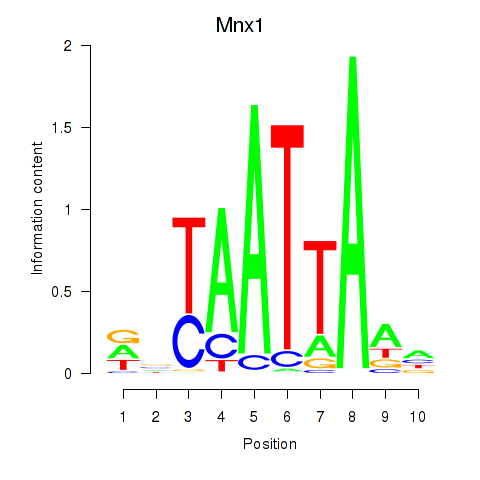
| Mnx1_Lhx6_Lmx1a | 0.063 |
|
|
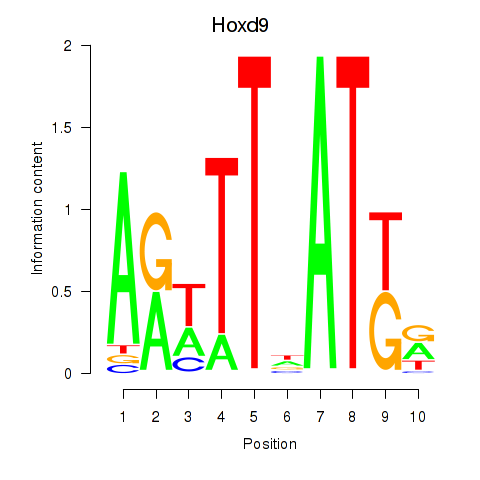
| Hoxd9 | 0.024 |
|
|
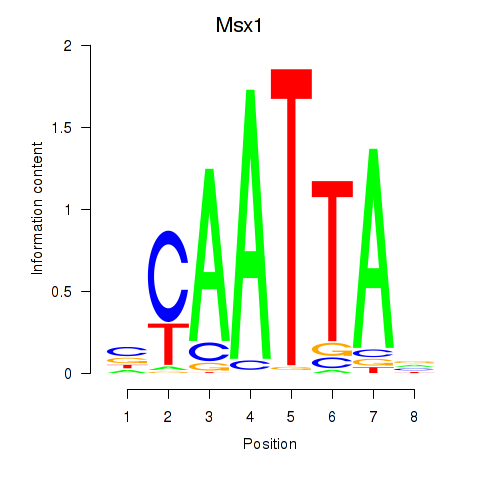
| Msx1_Lhx9_Barx1_Rax_Dlx6 | 0.023 |
|
|
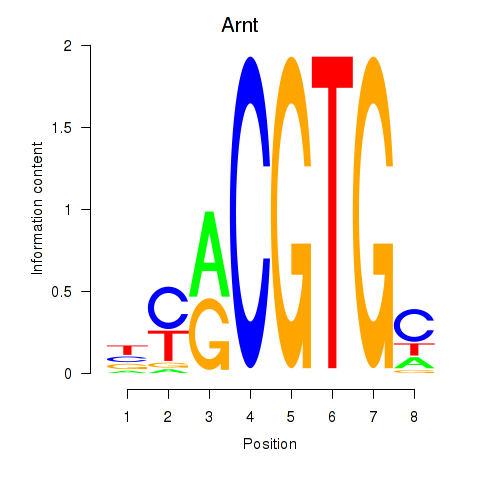
| Arnt | -0.000 |
|
|
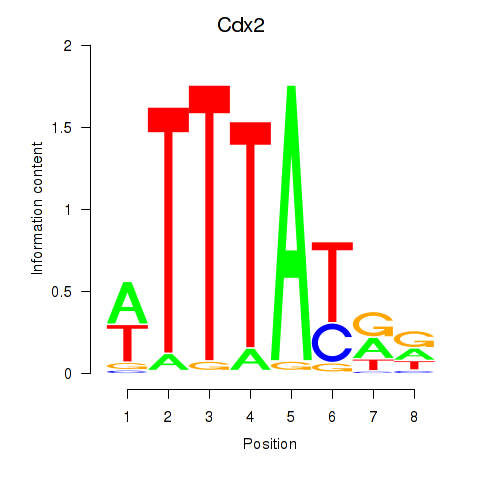
| Cdx2 | -0.000 |
|
|
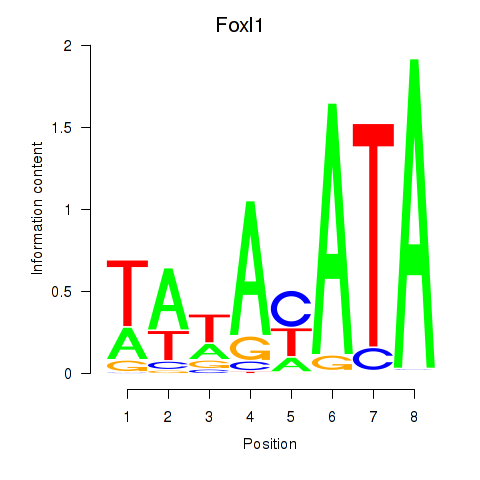
| Foxl1 | 0.000 |
|
|
| Hoxa6 | -0.000 |
|

|
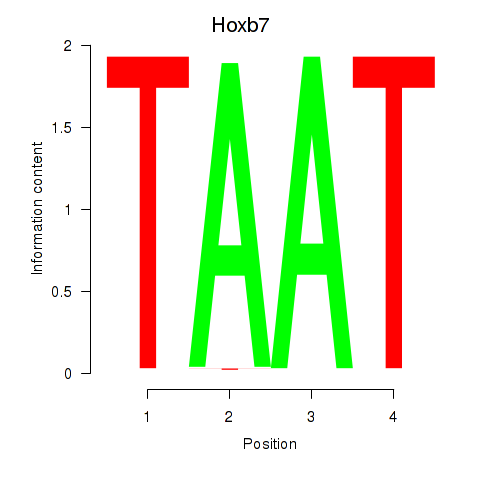
| Hoxb7 | 0.000 |
|
|
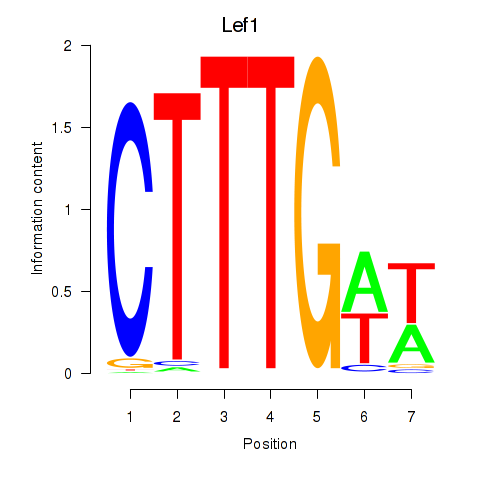
| Lef1 | 0.000 |
|
|
| Mzf1 | -0.000 |
|
|
| Pax2 | -0.000 |
|
|
| Pgr_Nr3c1 | -0.000 |
|
|
| Sox15 | 0.000 |
|
|
| Batf3 | -0.000 |
|
|
| Gbx2 | -0.011 |
|
|
| Rorc_Nr1d1 | -0.020 |
|
|
| Zbtb16 | -0.033 |
|
|
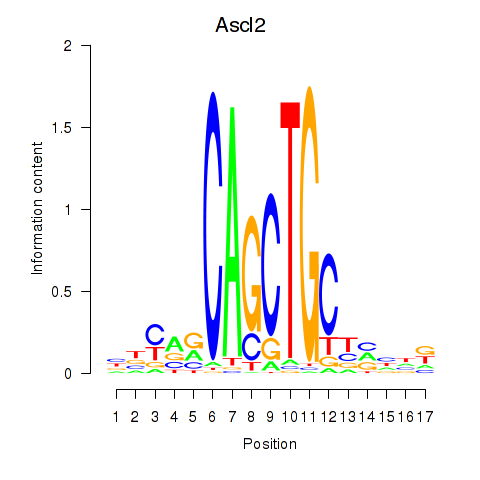
| Ascl2 | -0.071 |
|
|
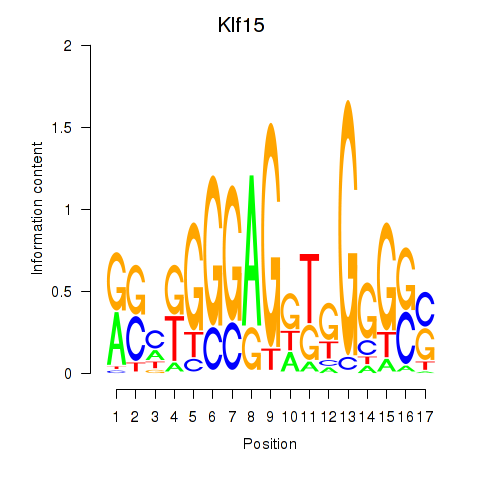
| Klf15 | -0.086 |
|
|
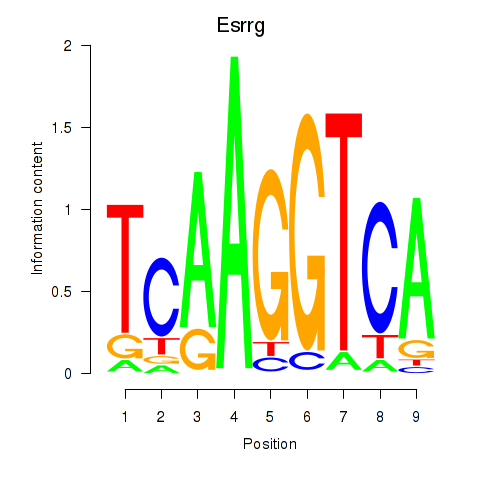
| Esrrg | -0.098 |
|
|
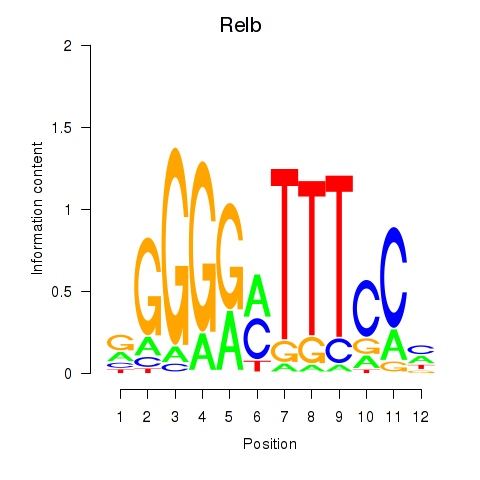
| Relb | -0.100 |
|
|
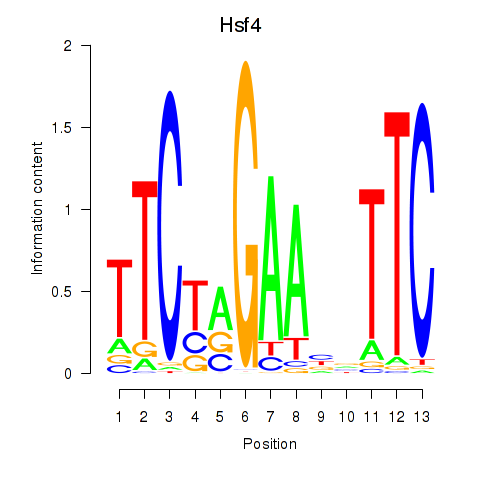
| Hsf4 | -0.116 |
|
|
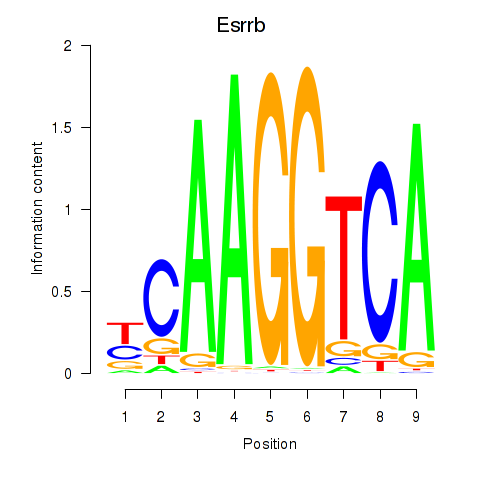
| Esrrb_Esrra | -0.135 |
|
|
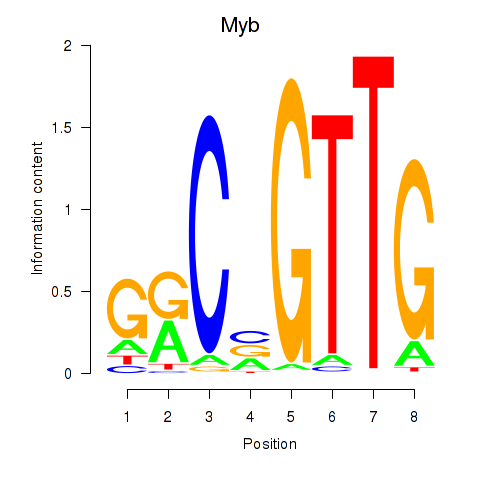
| Myb | -0.164 |
|
|
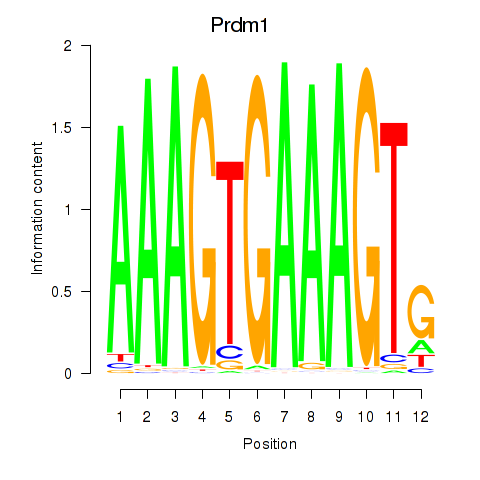
| Prdm1 | -0.178 |
|
|
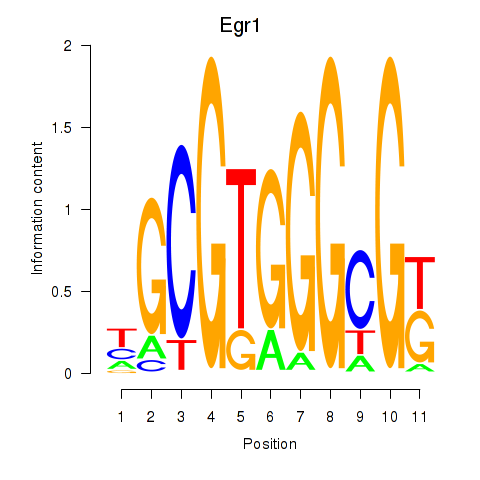
| Egr1 | -0.185 |
|
|
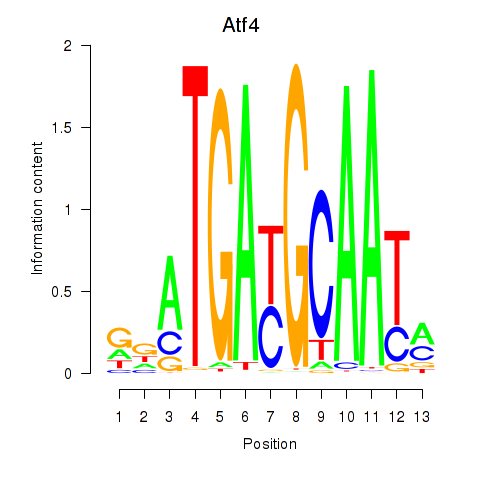
| Atf4 | -0.187 |
|
|
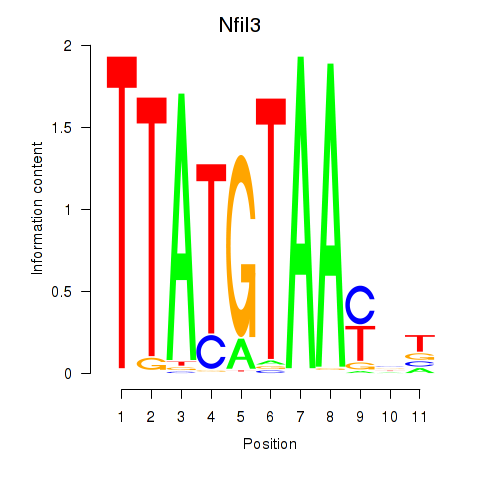
| Nfil3_Tef | -0.190 |
|
|
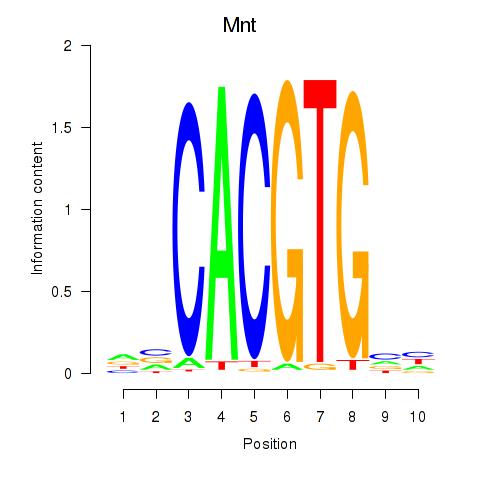
| Mnt | -0.197 |
|
|
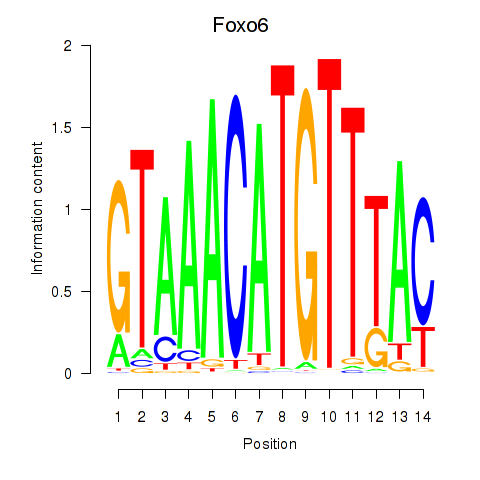
| Foxo6 | -0.212 |
|
|
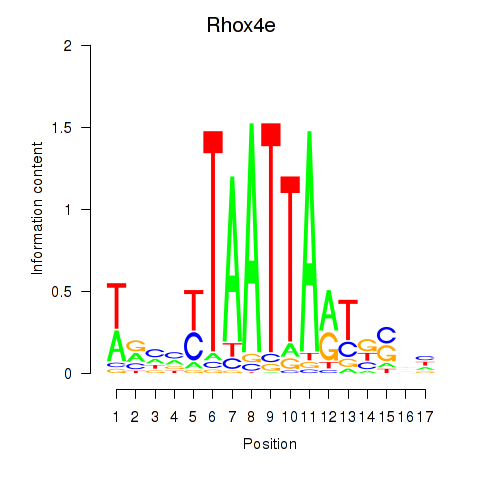
| Rhox4e_Rhox6_Vax2 | -0.215 |
|
|
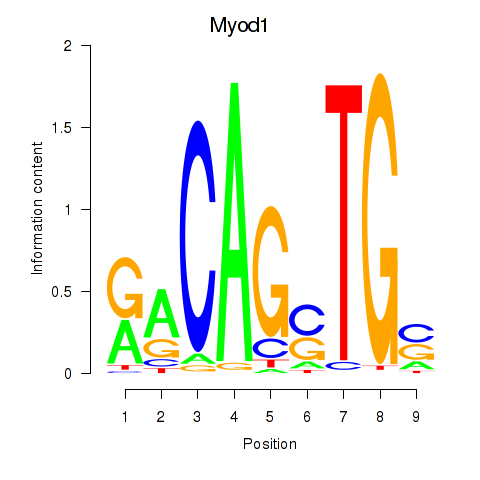
| Myod1 | -0.218 |
|
|
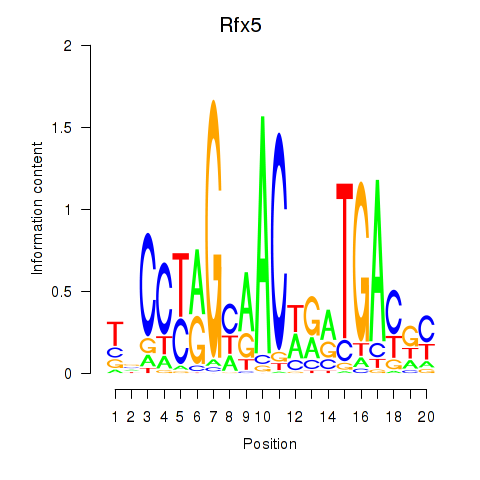
| Rfx5 | -0.234 |
|
|
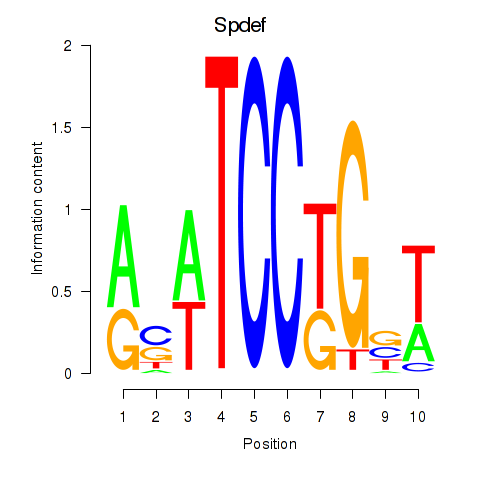
| Spdef | -0.235 |
|
|
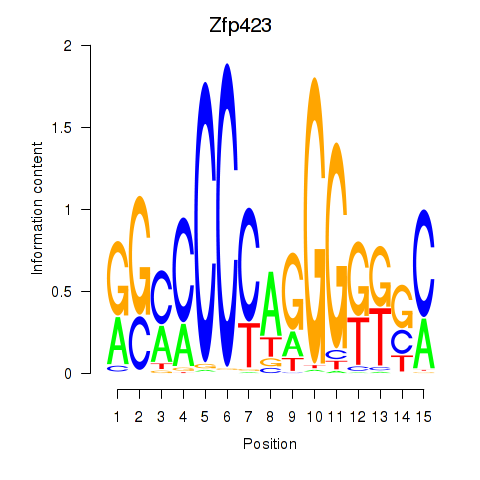
| Zfp423 | -0.245 |
|
|
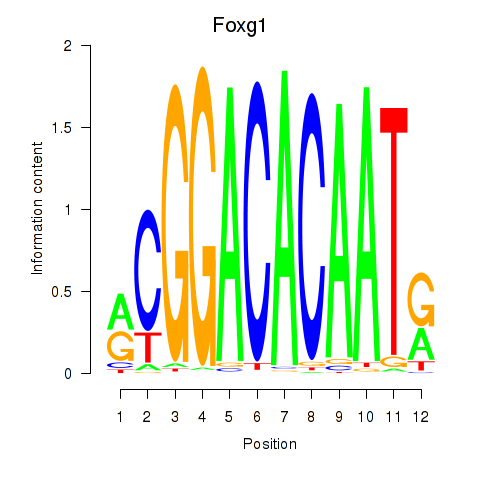
| Foxg1 | -0.252 |
|
|
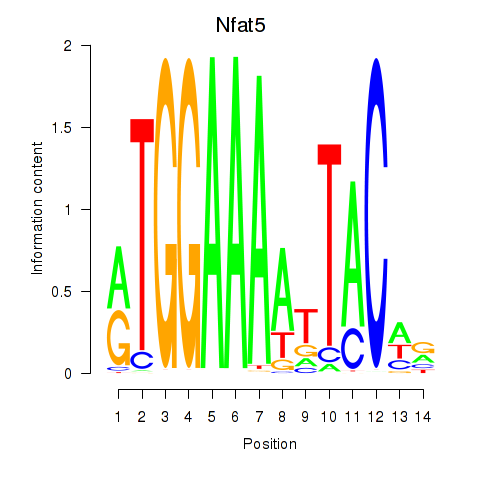
| Nfat5 | -0.261 |
|
|
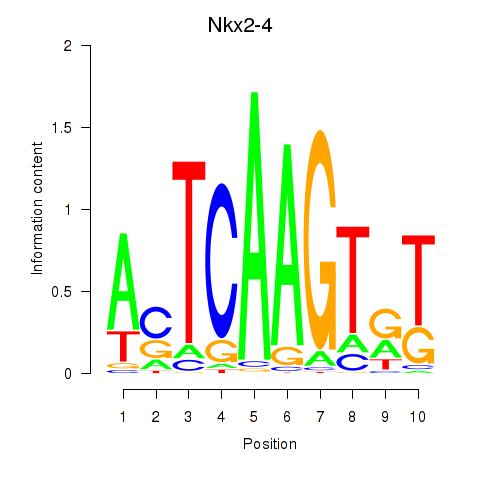
| Nkx2-4 | -0.266 |
|
|
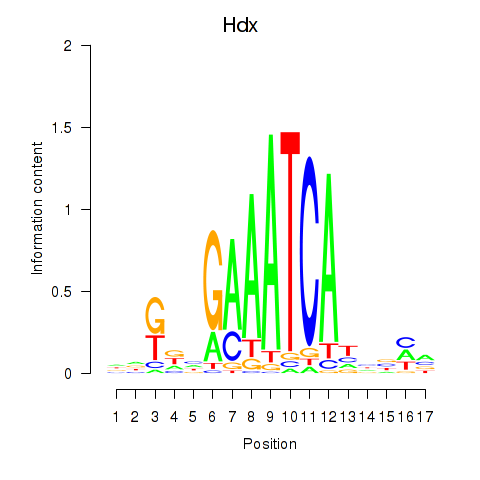
| Hdx | -0.276 |
|
|
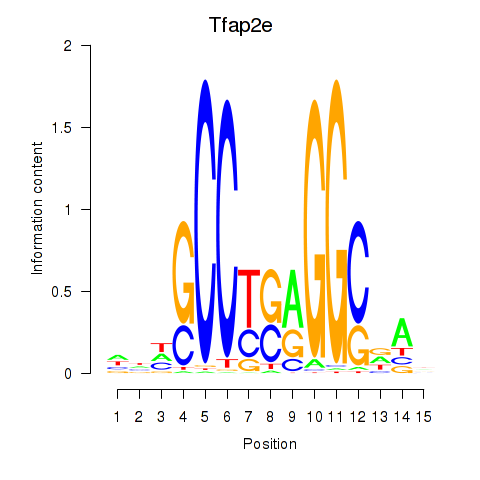
| Tfap2e | -0.296 |
|
|
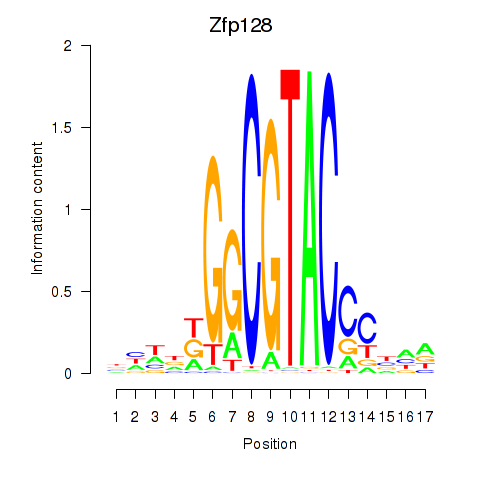
| Zfp128 | -0.304 |
|
|
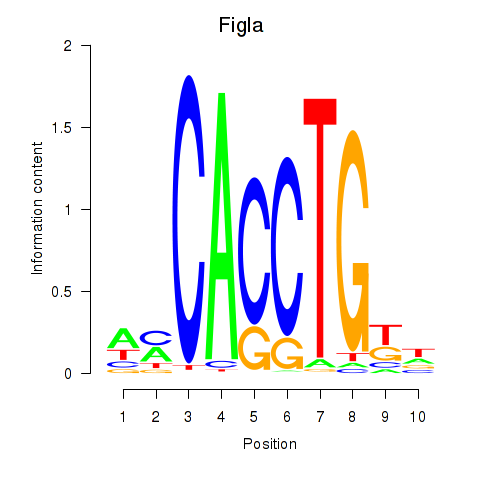
| Figla | -0.338 |
|
|
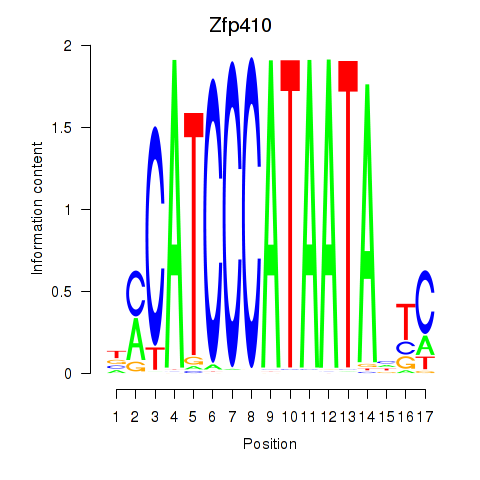
| Zfp410 | -0.340 |
|
|
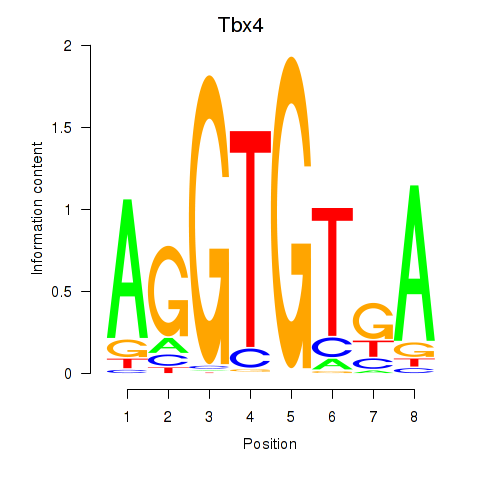
| Tbx4 | -0.344 |
|
|
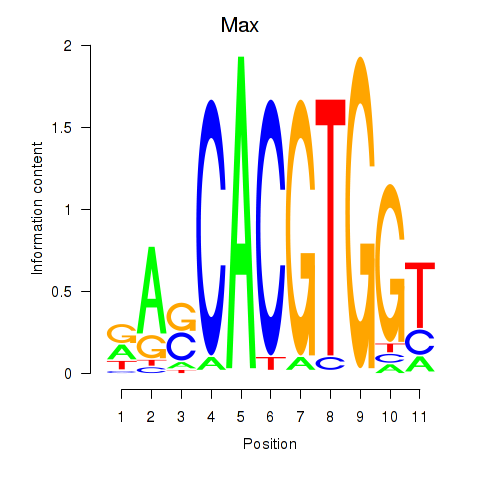
| Max_Mycn | -0.352 |
|
|
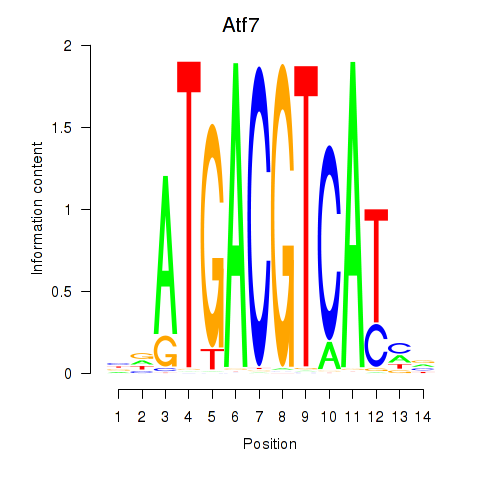
| Atf7_E4f1 | -0.363 |
|
|
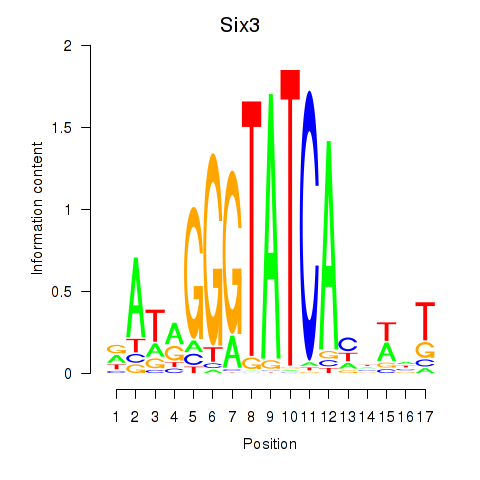
| Six3_Six1_Six2 | -0.365 |
|
|
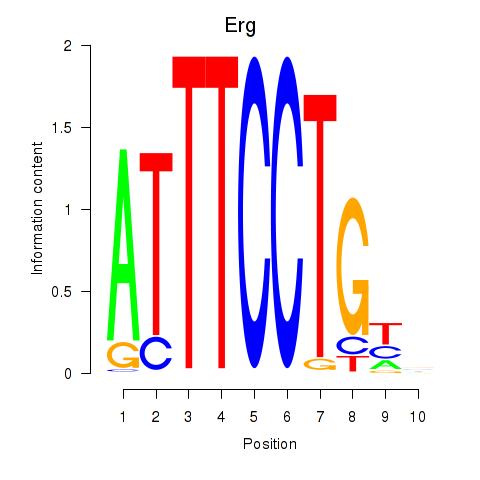
| Erg | -0.370 |
|
|
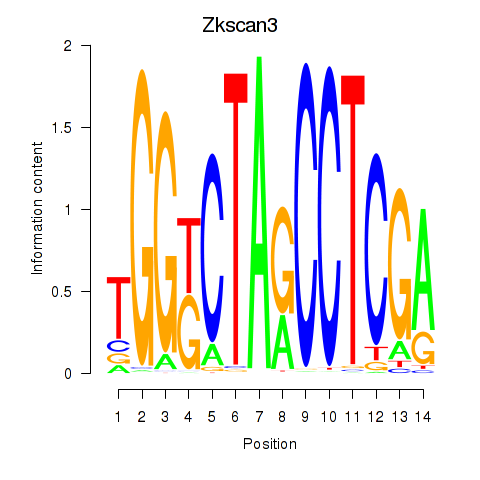
| Zkscan3 | -0.372 |
|
|
| Hmx1 | -0.415 |
|
|
| Nfatc4 | -0.428 |
|
|
| Glis3 | -0.443 |
|
|
| E2f7 | -0.448 |
|
|
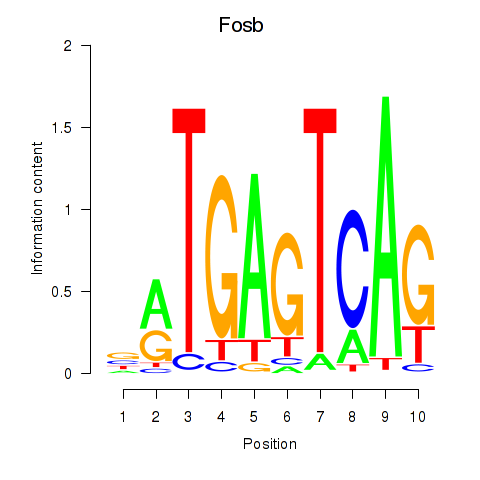
| Fosb | -0.449 |
|
|
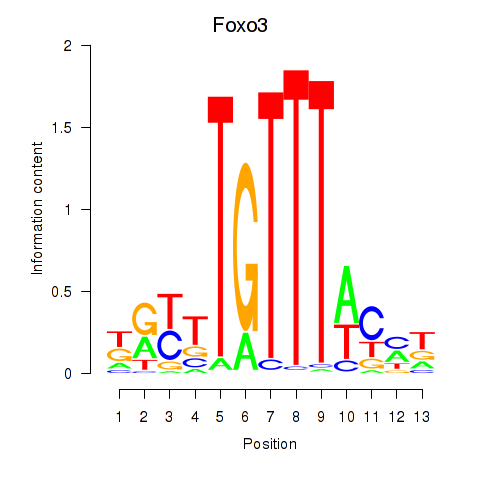
| Foxo3 | -0.457 |
|
|
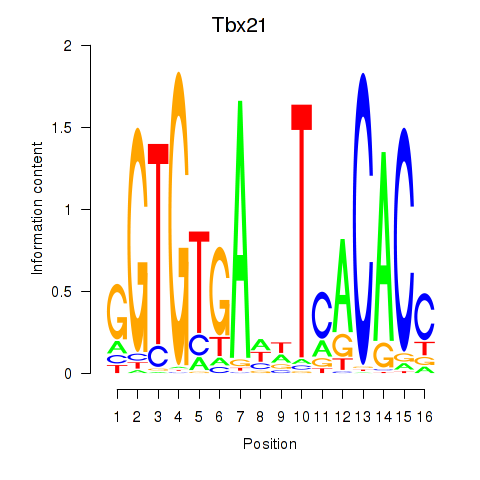
| Tbx21 | -0.463 |
|
|
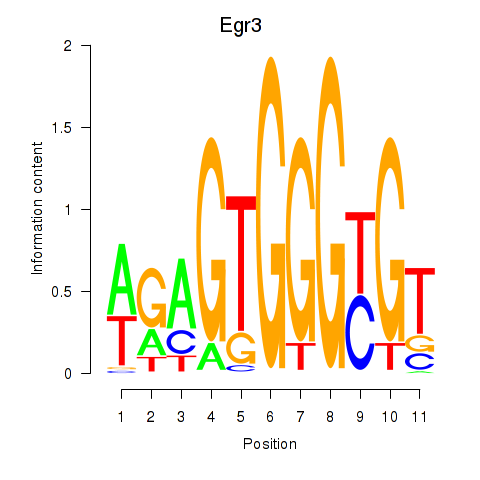
| Egr3 | -0.471 |
|
|
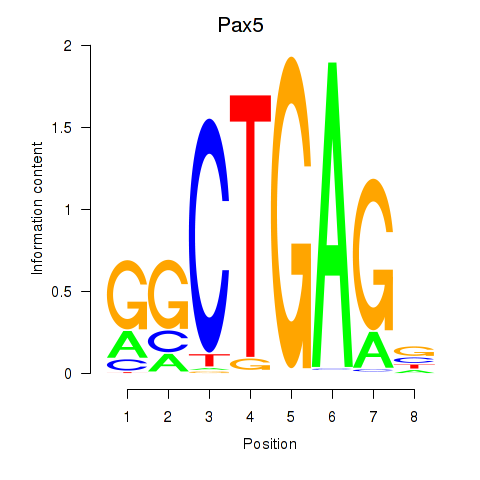
| Pax5 | -0.483 |
|
|
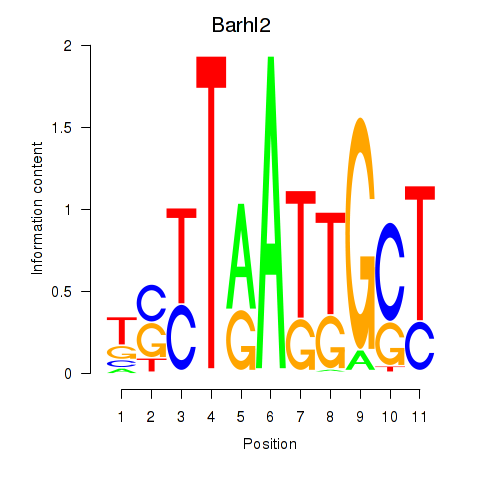
| Barhl2 | -0.495 |
|
|
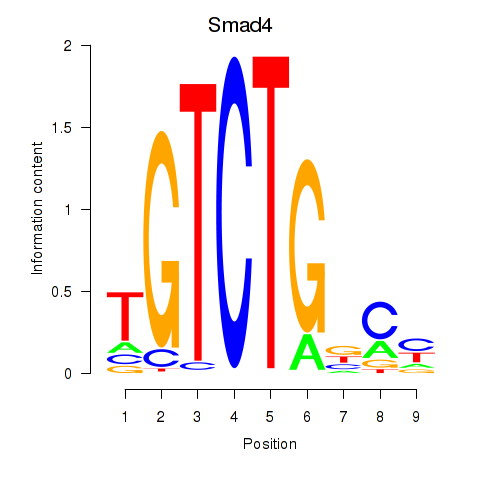
| Smad4 | -0.502 |
|
|
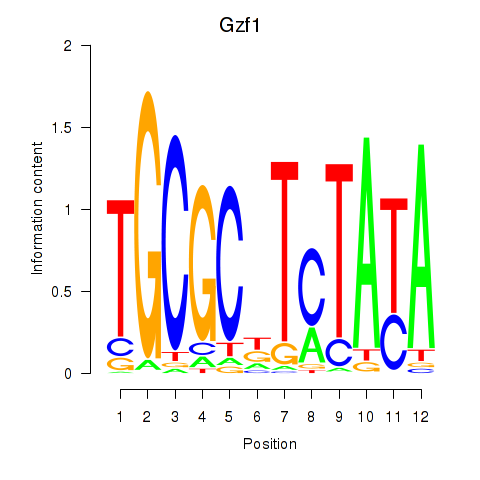
| Gzf1 | -0.503 |
|
|
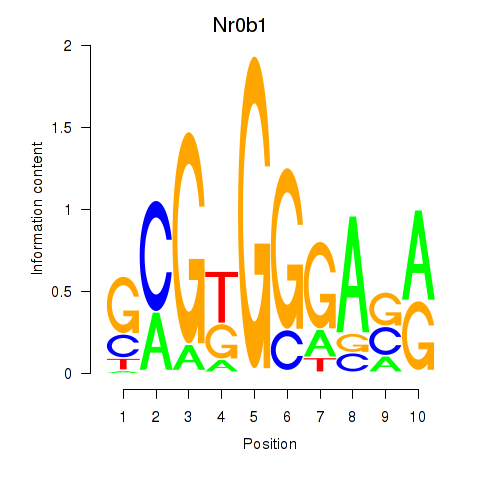
| Nr0b1 | -0.511 |
|
|
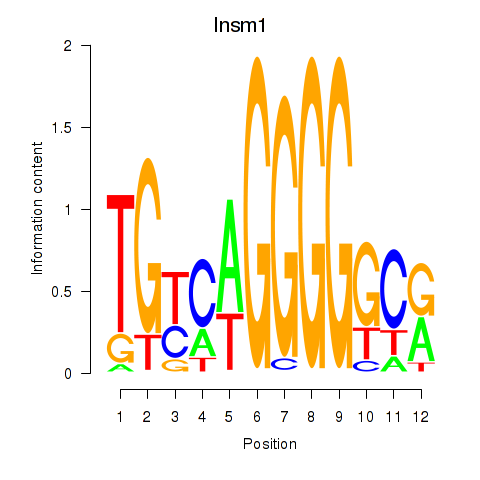
| Insm1 | -0.522 |
|
|
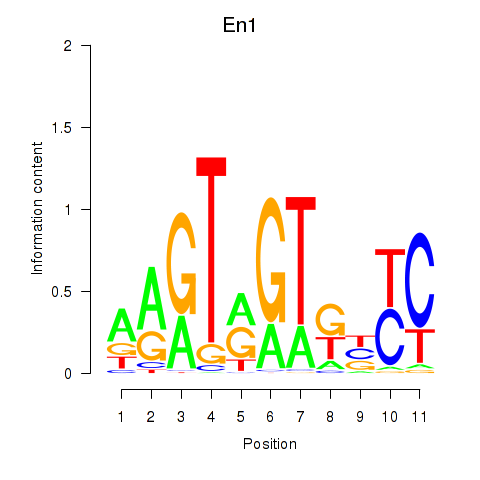
| En1 | -0.523 |
|
|
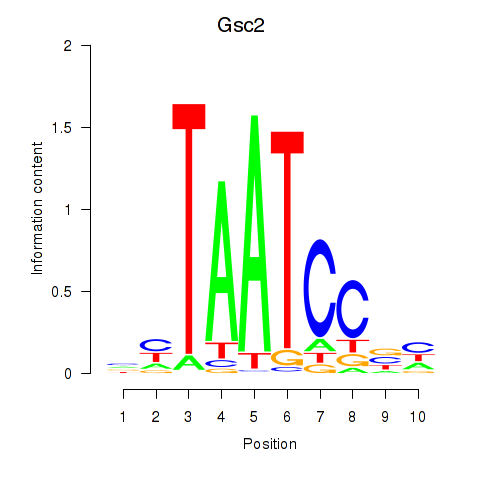
| Gsc2_Dmbx1 | -0.563 |
|
|
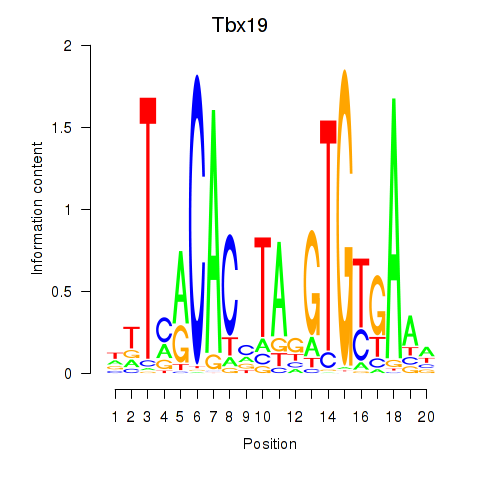
| Tbx19 | -0.563 |
|
|
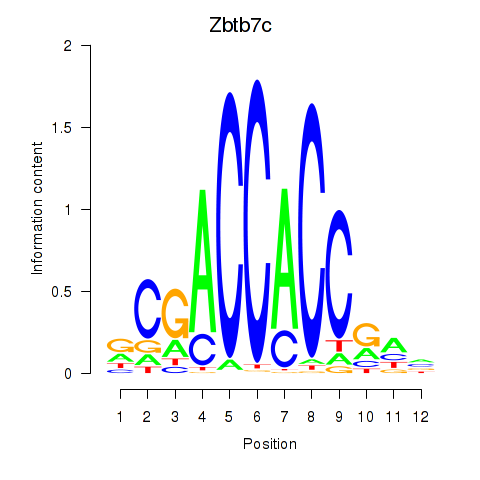
| Zbtb7c | -0.578 |
|
|
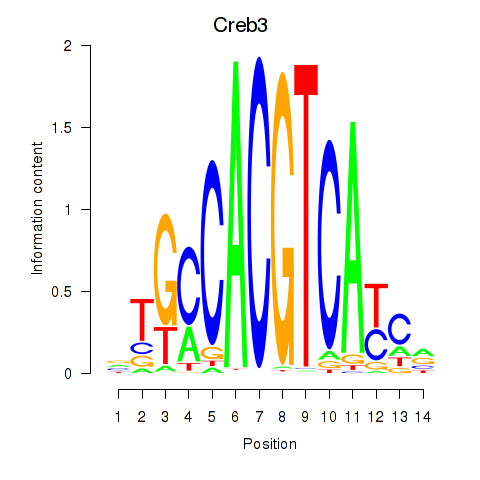
| Creb3 | -0.600 |
|
|
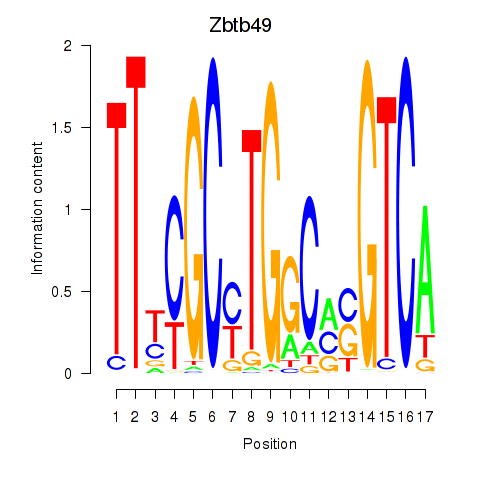
| Zbtb49 | -0.615 |
|
|
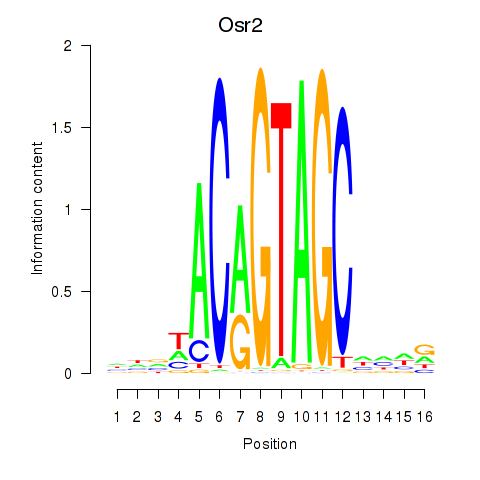
| Osr2_Osr1 | -0.618 |
|
|
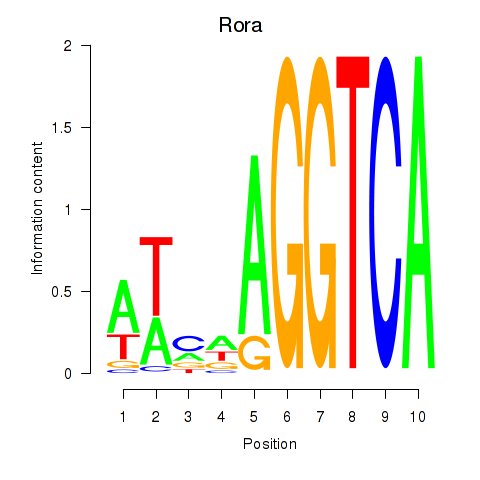
| Rora | -0.623 |
|
|
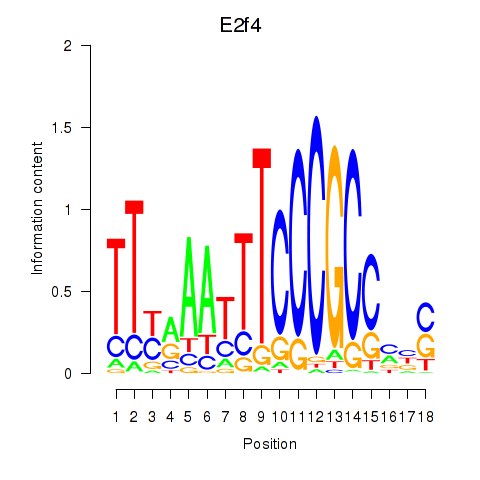
| E2f4 | -0.644 |
|
|
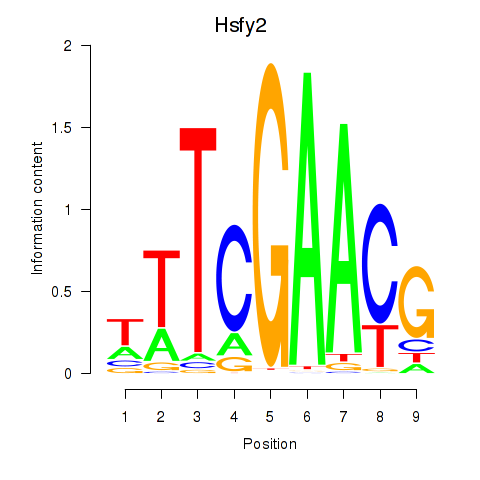
| Hsfy2 | -0.648 |
|
|
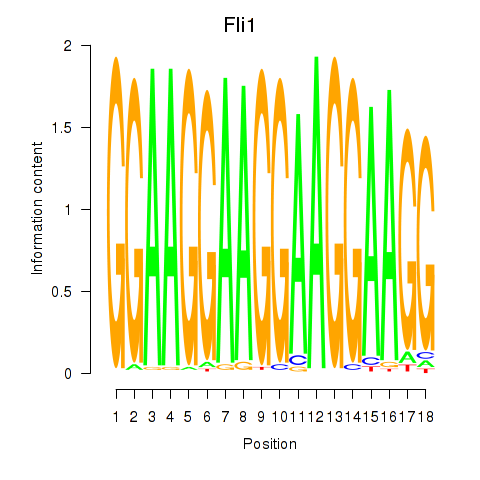
| Fli1 | -0.659 |
|
|
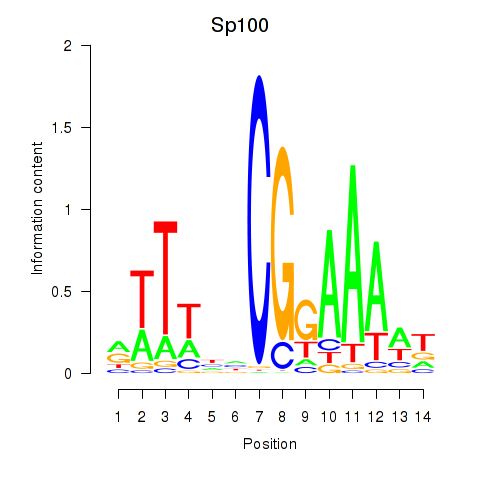
| Sp100 | -0.678 |
|
|
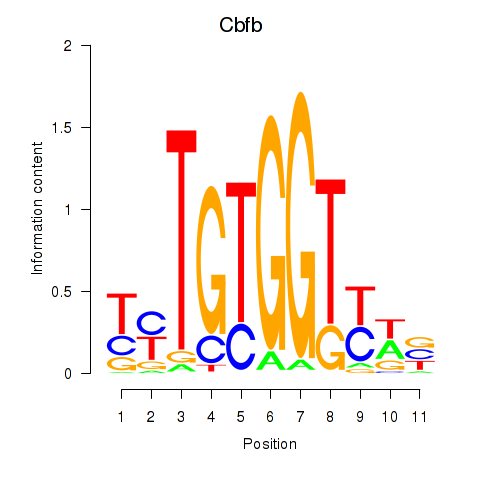
| Cbfb | -0.690 |
|
|
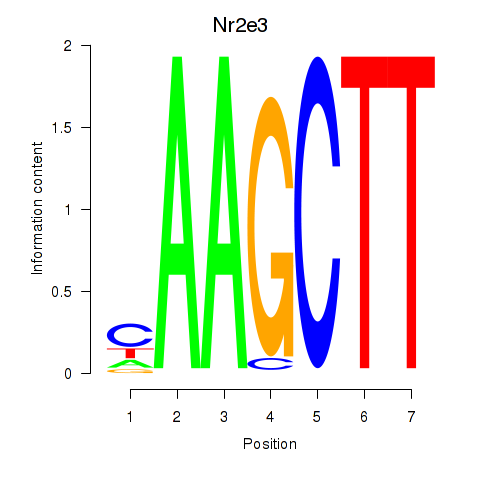
| Nr2e3 | -0.703 |
|
|
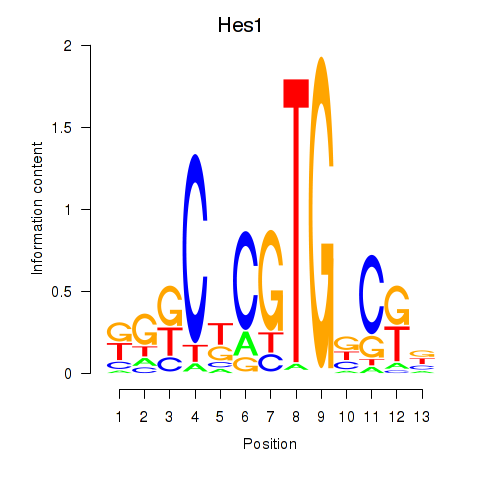
| Hes1 | -0.717 |
|
|
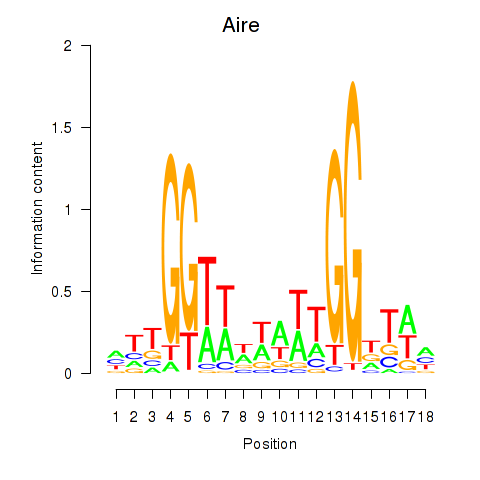
| Aire | -0.730 |
|
|
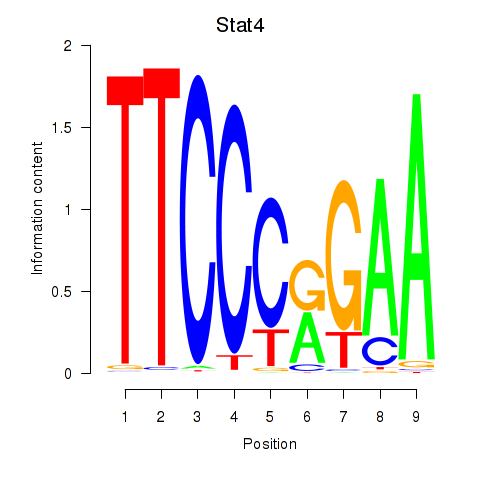
| Stat4_Stat3_Stat5b | -0.811 |
|
|
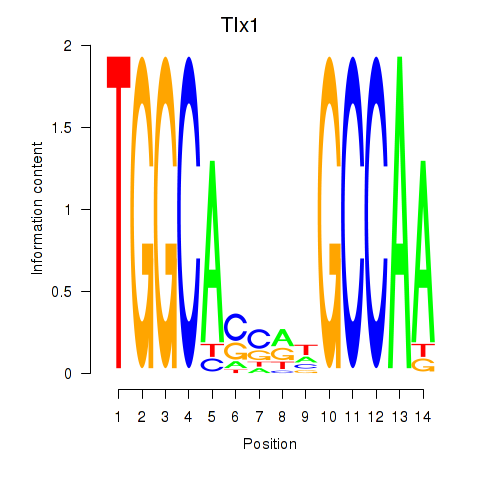
| Tlx1 | -0.825 |
|
|
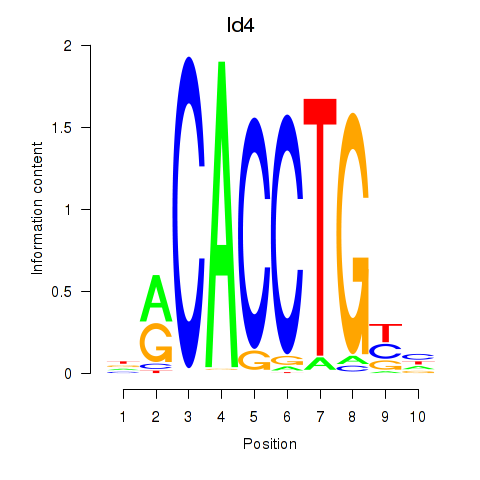
| Id4 | -0.869 |
|
|
| Mtf1 | -0.886 |
|

|
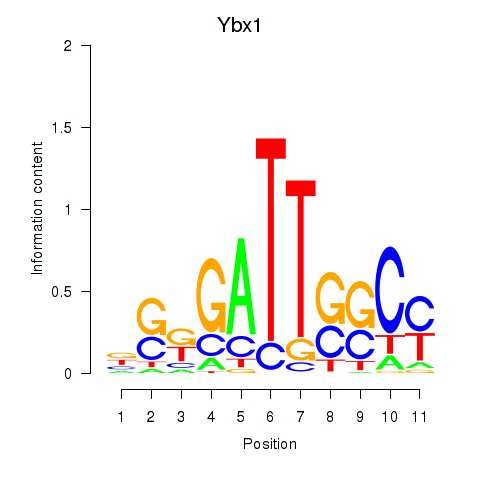
| Ybx1_Nfya_Nfyb_Nfyc_Cebpz | -0.893 |
|
|
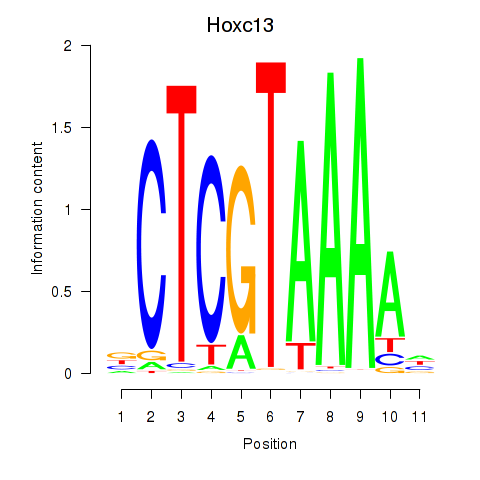
| Hoxc13_Hoxd13 | -0.903 |
|
|
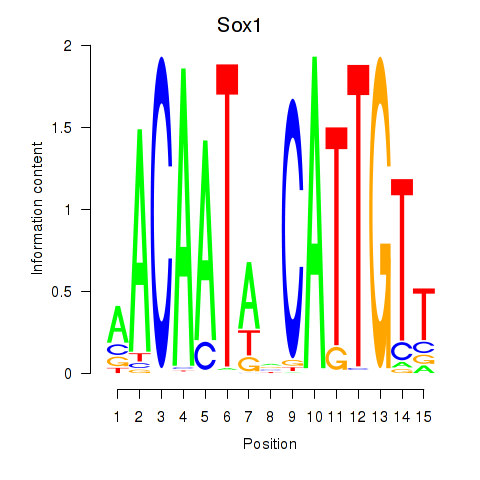
| Sox1 | -0.954 |
|
|
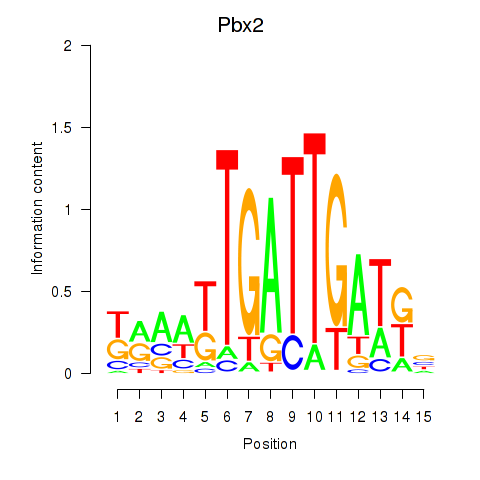
| Pbx2 | -0.954 |
|
|
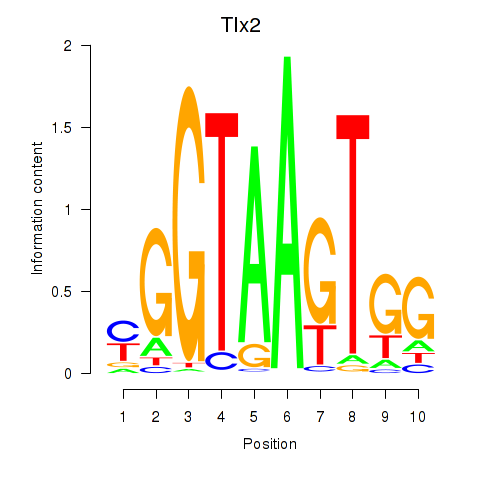
| Tlx2 | -0.956 |
|
|
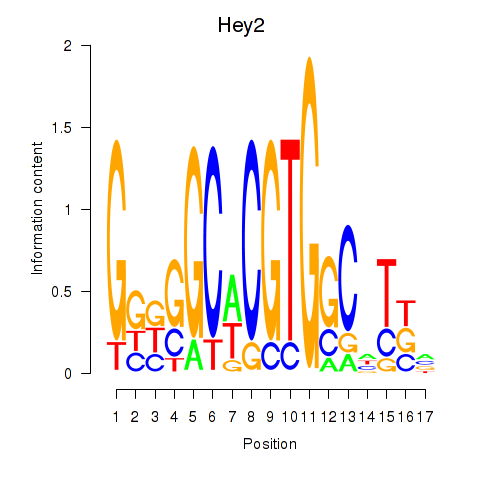
| Hey2 | -0.956 |
|
|
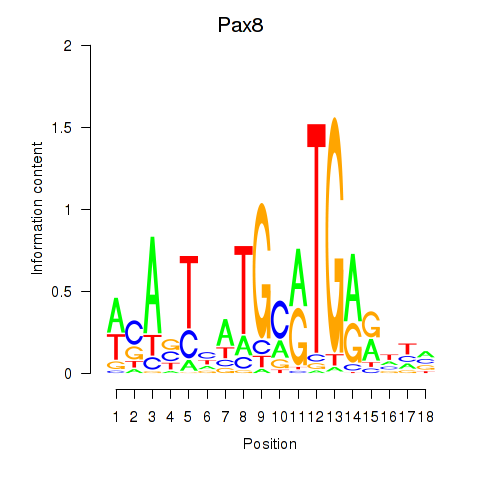
| Pax8 | -1.001 |
|
|
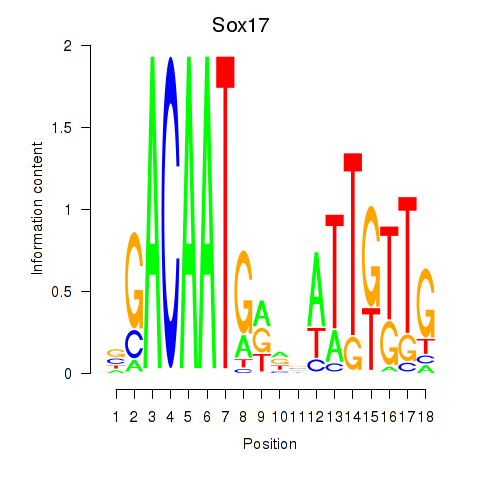
| Sox17 | -1.001 |
|
|
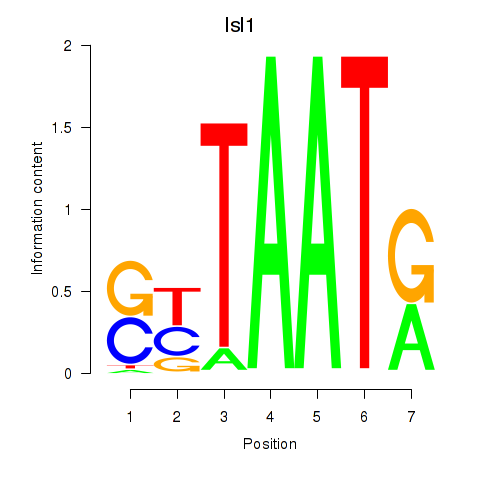
| Isl1 | -1.016 |
|
|
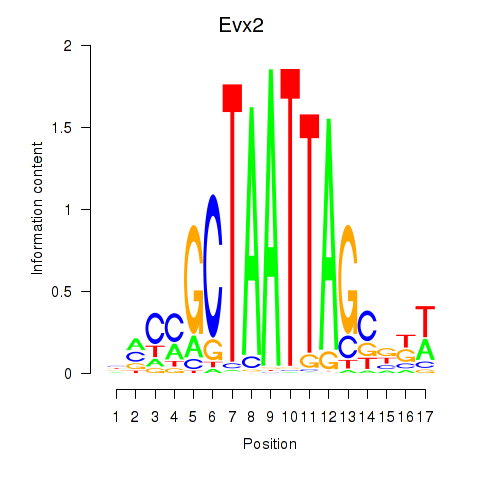
| Evx2 | -1.028 |
|
|
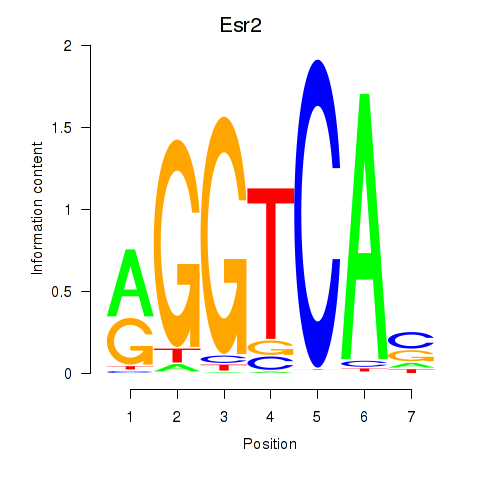
| Esr2 | -1.039 |
|
|
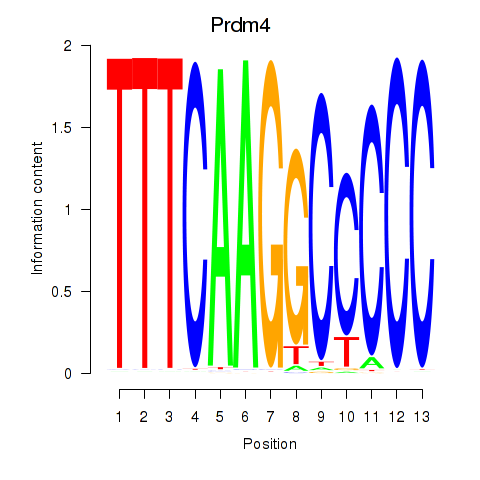
| Prdm4 | -1.054 |
|
|
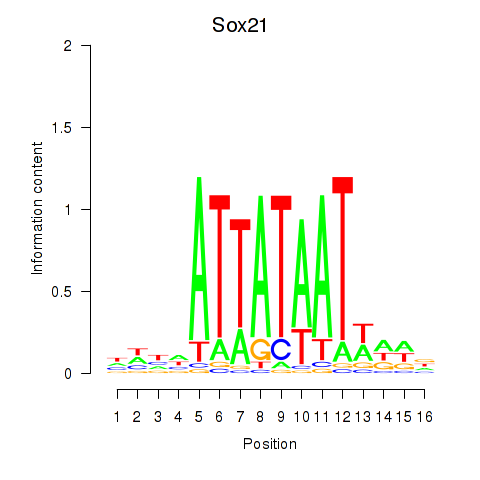
| Sox21 | -1.076 |
|
|
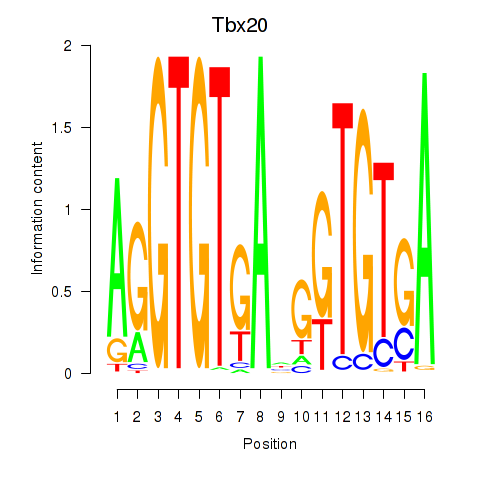
| Tbx20 | -1.103 |
|
|
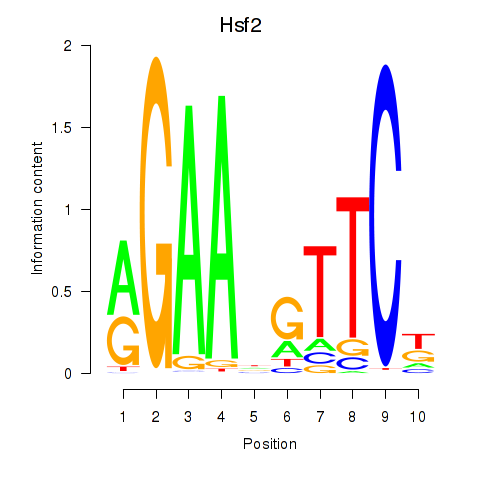
| Hsf2 | -1.125 |
|
|
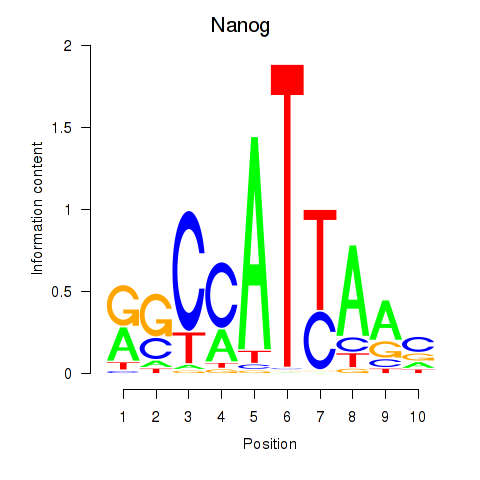
| Nanog | -1.138 |
|
|
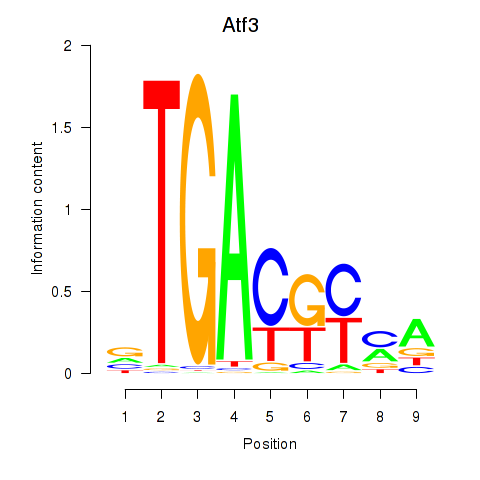
| Atf3 | -1.154 |
|
|
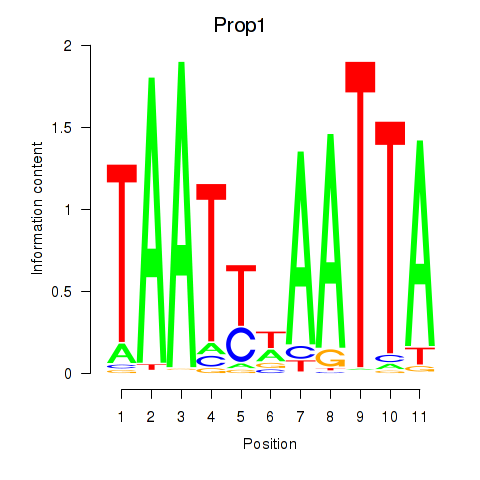
| Prop1 | -1.160 |
|
|
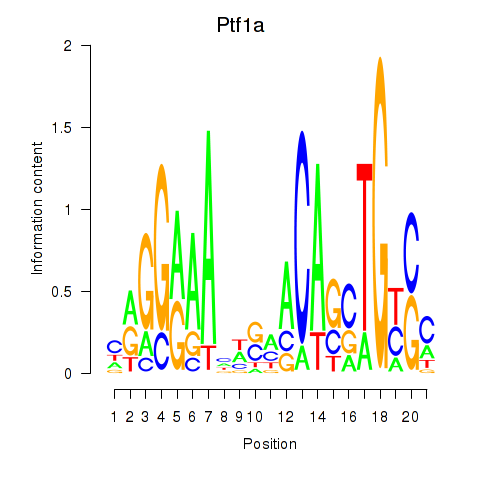
| Ptf1a | -1.174 |
|
|
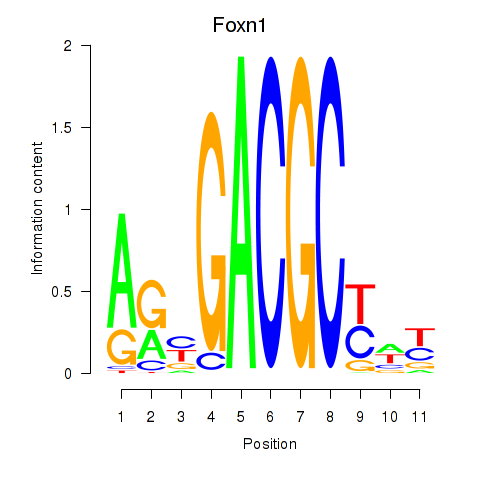
| Foxn1 | -1.184 |
|
|
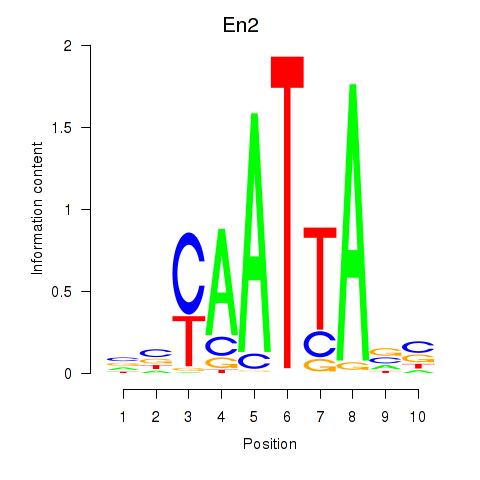
| En2 | -1.205 |
|
|
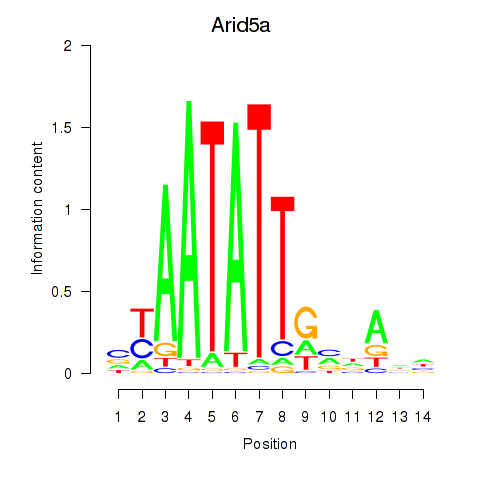
| Arid5a | -1.207 |
|
|
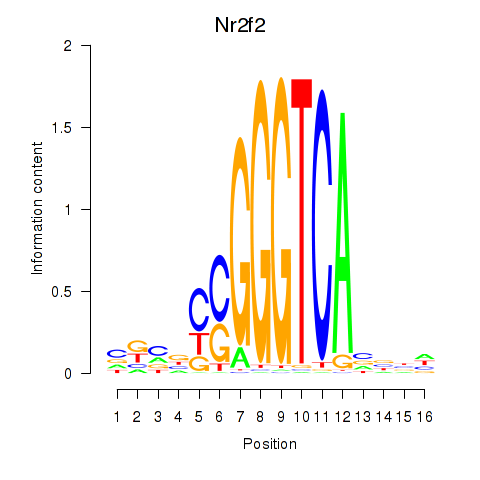
| Nr2f2 | -1.272 |
|
|
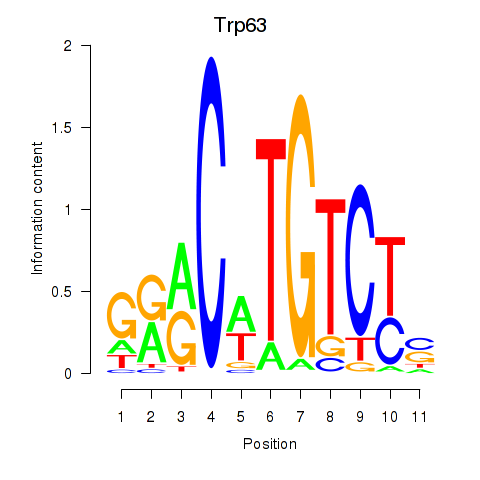
| Trp63 | -1.283 |
|
|
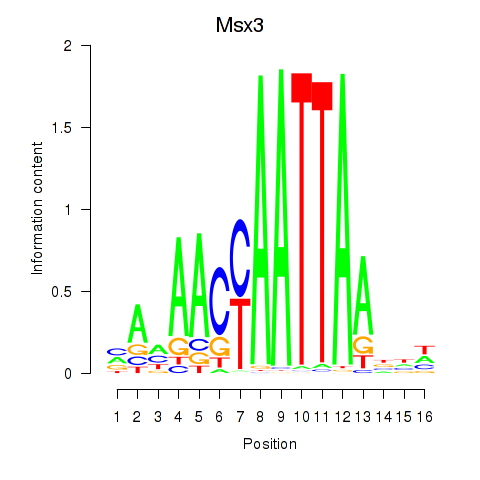
| Msx3 | -1.304 |
|
|
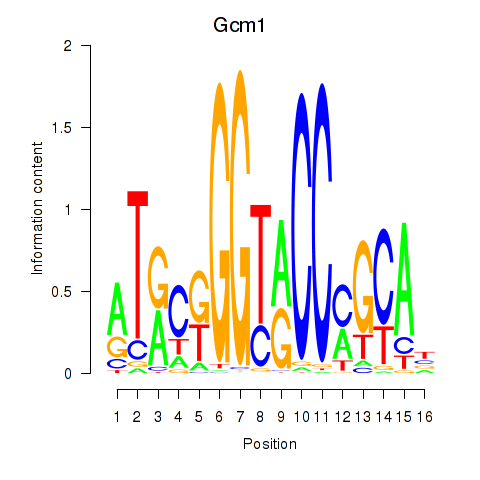
| Gcm1 | -1.324 |
|
|
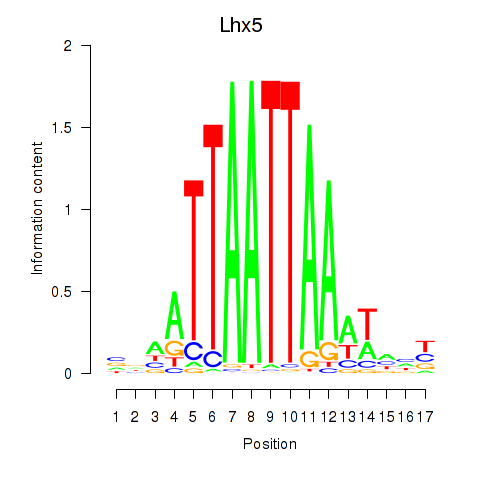
| Lhx5_Lmx1b_Lhx1 | -1.350 |
|
|
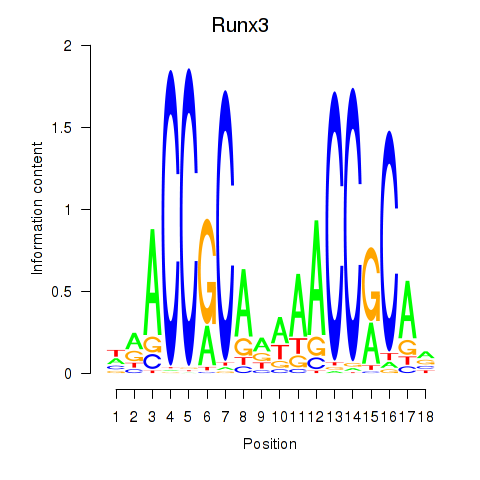
| Runx3 | -1.372 |
|
|
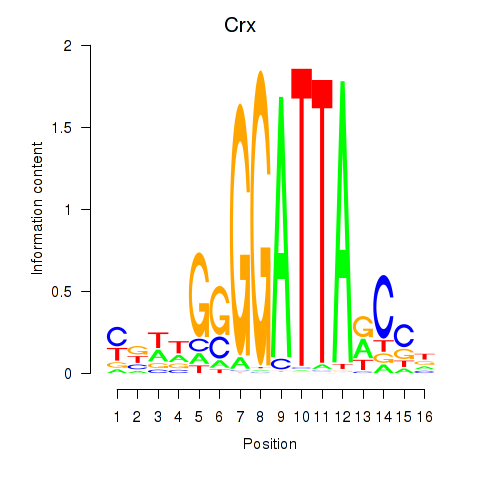
| Crx_Gsc | -1.397 |
|
|
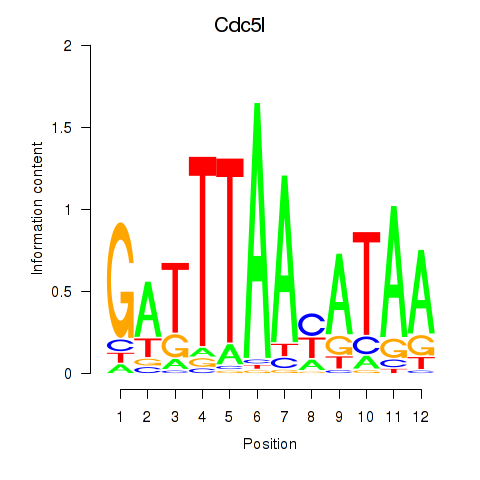
| Cdc5l | -1.415 |
|
|
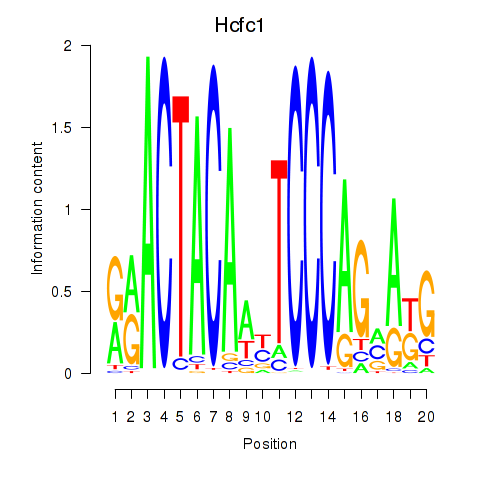
| Hcfc1_Six5_Smarcc2_Zfp143 | -1.424 |
|
|
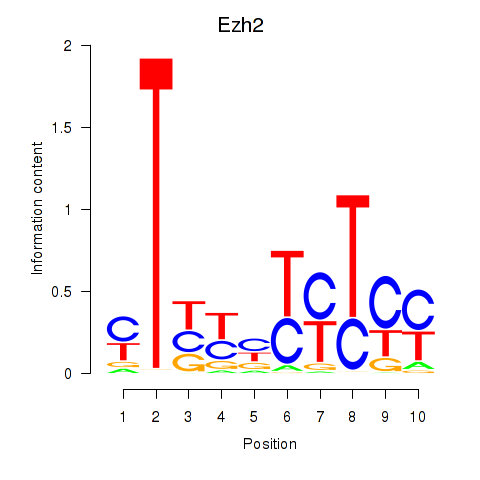
| Ezh2_Atf2_Ikzf1 | -1.435 |
|
|
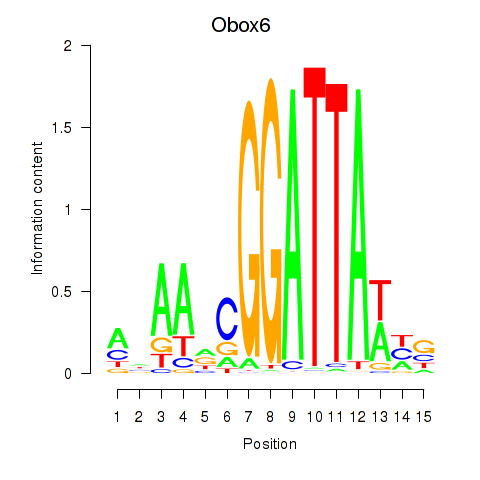
| Obox6_Obox5 | -1.437 |
|
|
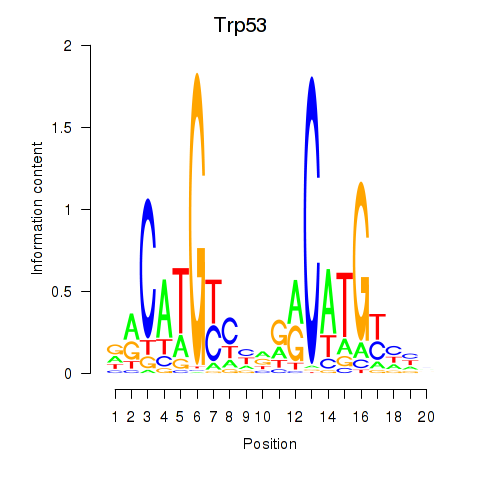
| Trp53 | -1.449 |
|
|
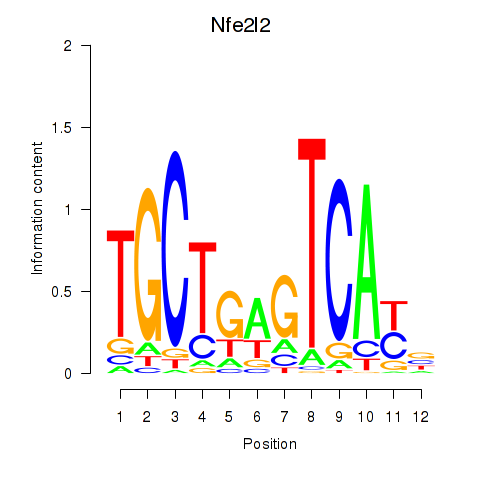
| Nfe2l2 | -1.455 |
|
|
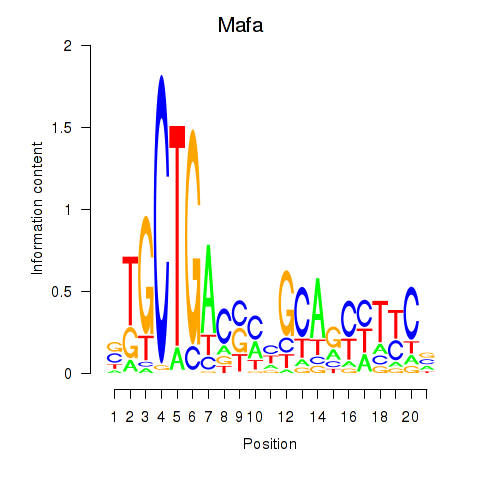
| Mafa | -1.470 |
|
|
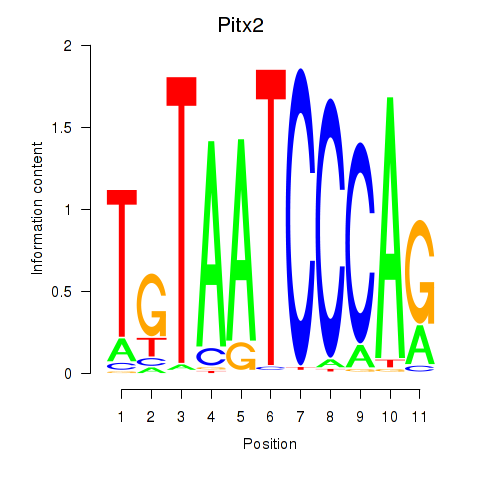
| Pitx2_Otx2 | -1.521 |
|
|
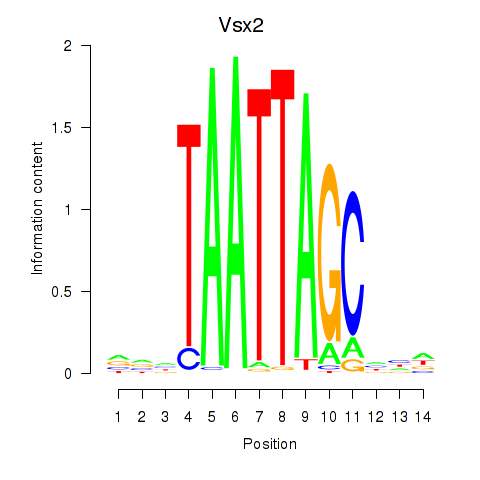
| Vsx2_Dlx3 | -1.534 |
|
|
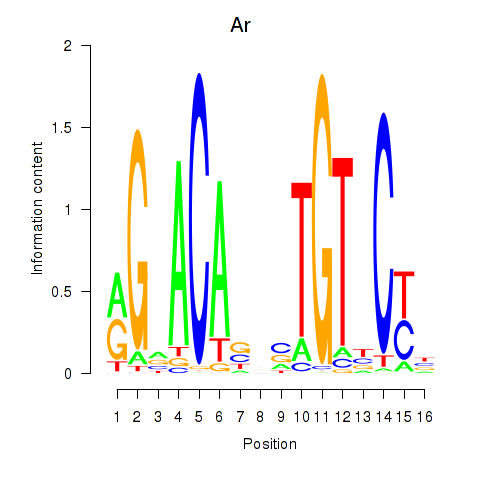
| Ar | -1.549 |
|
|
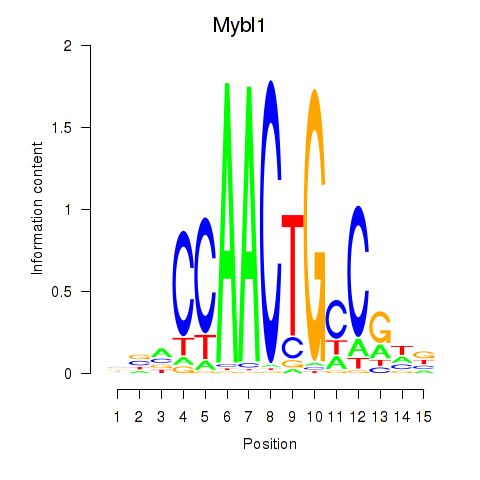
| Mybl1 | -1.583 |
|
|
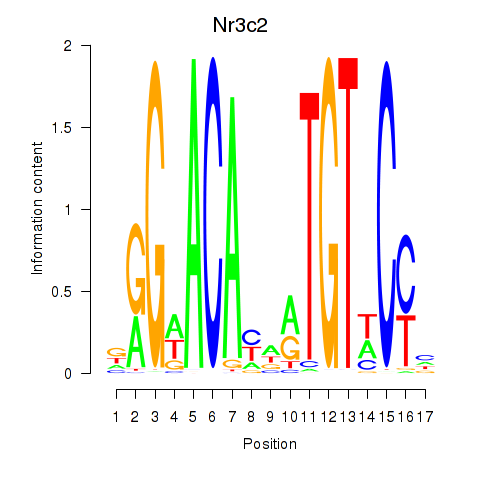
| Nr3c2 | -1.598 |
|
|
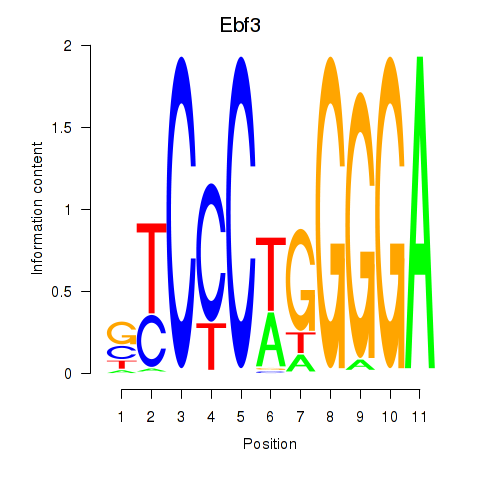
| Ebf3 | -1.615 |
|
|
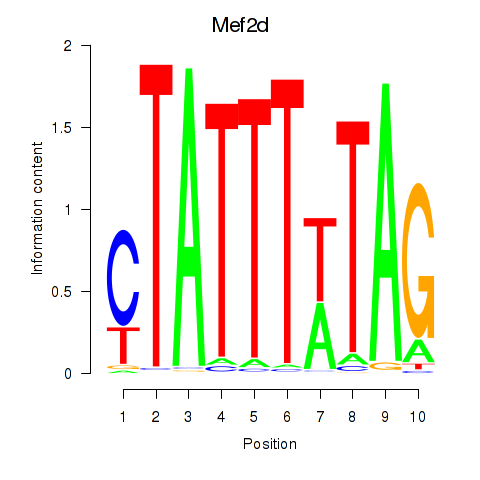
| Mef2d_Mef2a | -1.621 |
|
|
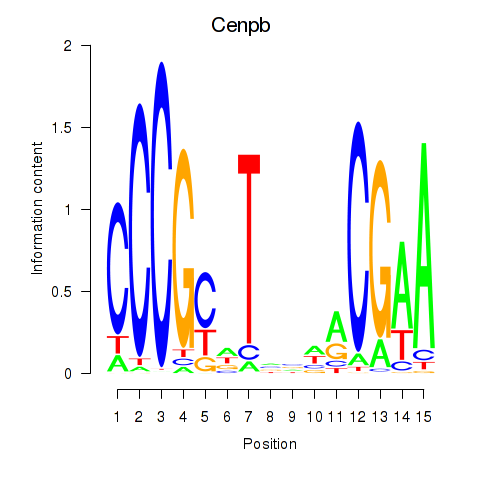
| Cenpb | -1.636 |
|
|
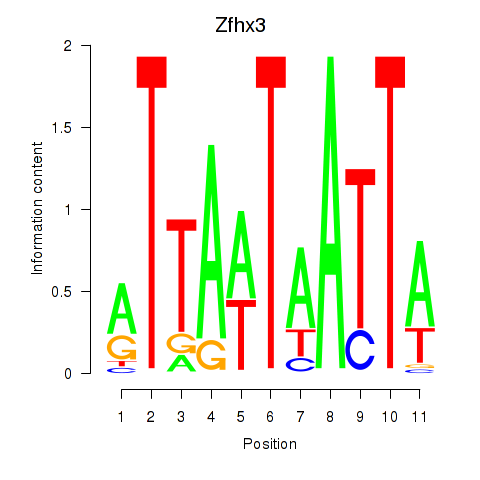
| Zfhx3 | -1.669 |
|
|
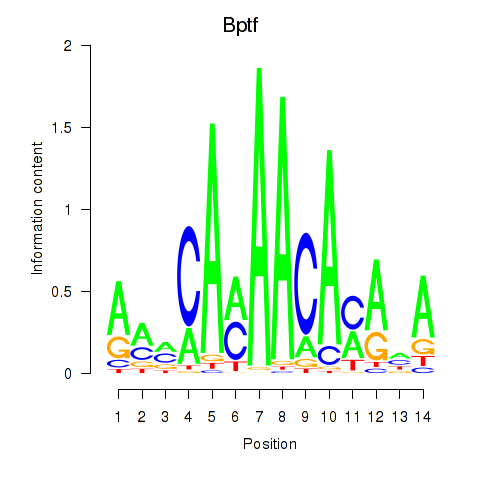
| Bptf | -1.672 |
|
|
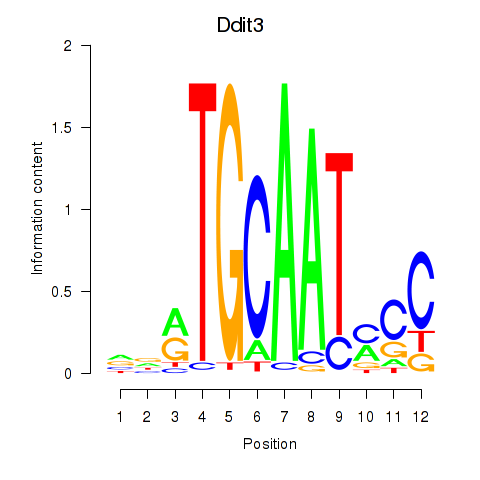
| Ddit3 | -1.698 |
|
|
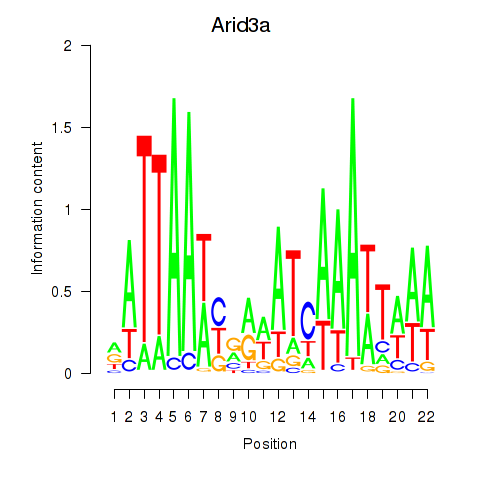
| Arid3a | -1.759 |
|
|
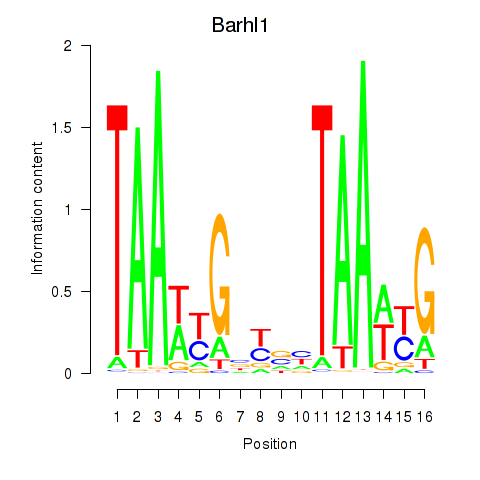
| Barhl1 | -1.777 |
|
|
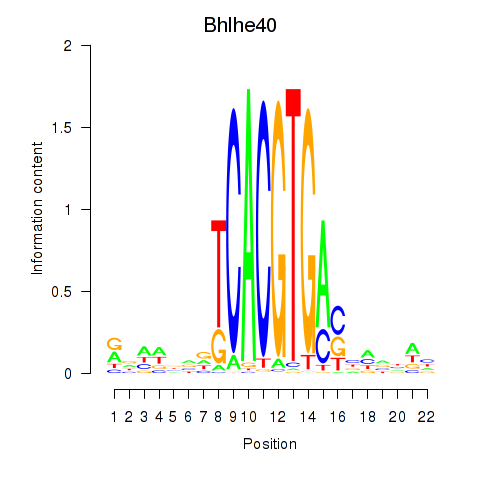
| Bhlhe40 | -1.802 |
|
|
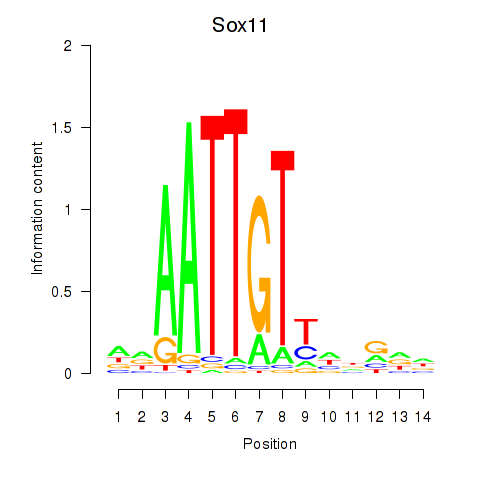
| Sox11 | -1.809 |
|
|
| Etv4 | -1.833 |
|
|
| Sox7 | -1.838 |
|
|
| Egr4 | -1.889 |
|
|
| Foxp1_Foxj2 | -1.905 |
|
|
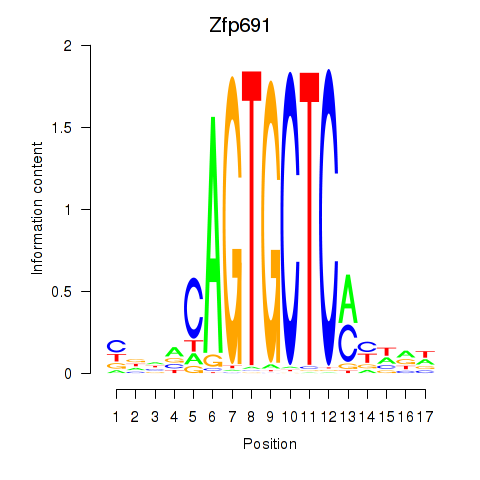
| Zfp691 | -1.917 |
|
|
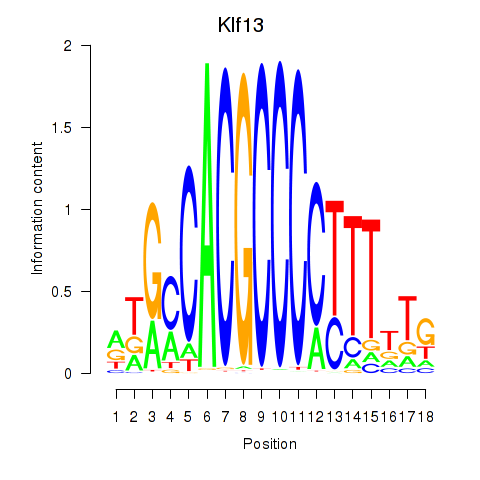
| Klf13 | -1.932 |
|
|
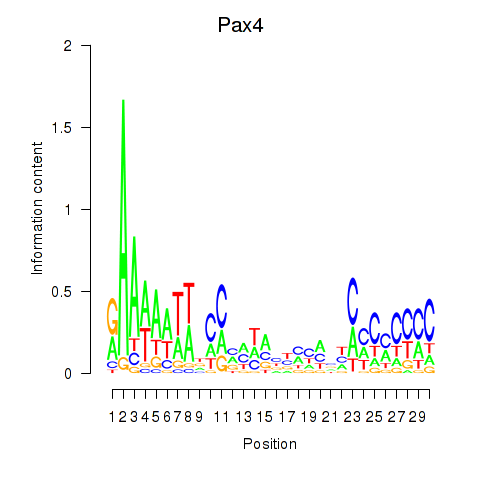
| Pax4 | -1.948 |
|
|
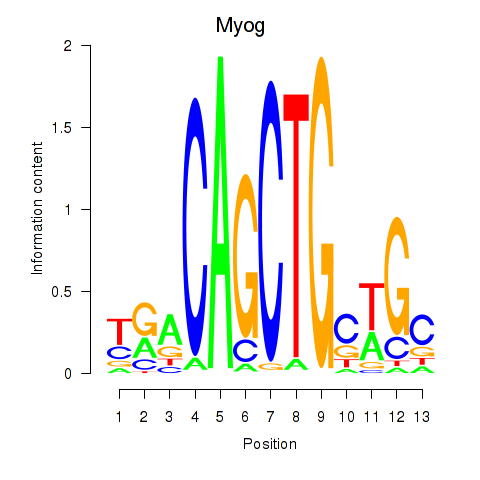
| Myog_Tcf12 | -1.949 |
|
|
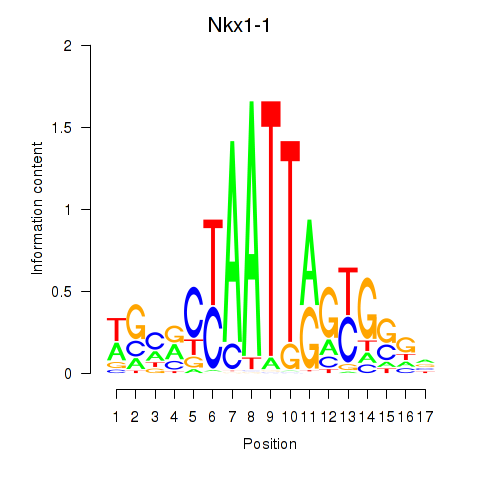
| Nkx1-1_Nkx1-2 | -1.953 |
|
|
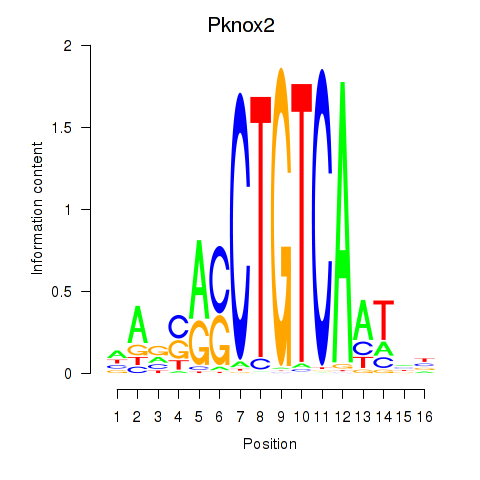
| Pknox2_Pknox1 | -1.969 |
|
|
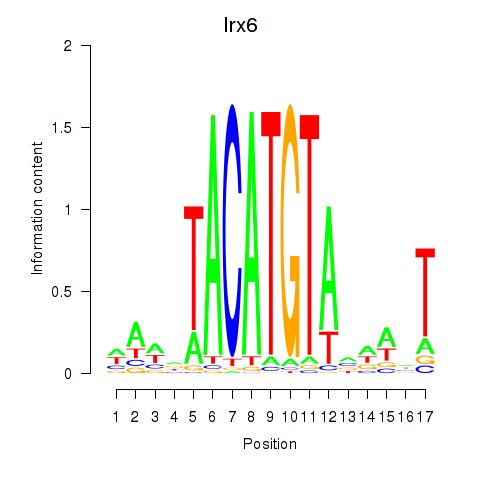
| Irx6_Irx2_Irx3 | -1.975 |
|
|
| Hoxb5 | -1.981 |
|

|
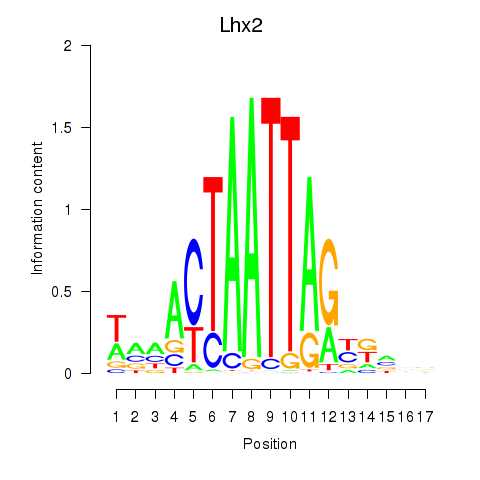
| Lhx2_Hoxc5 | -1.996 |
|
|
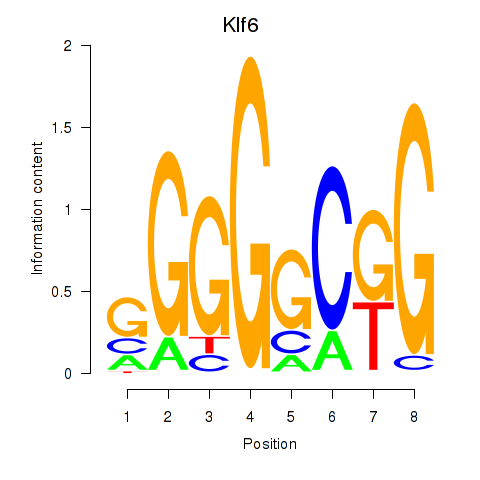
| Klf6_Patz1 | -2.013 |
|
|
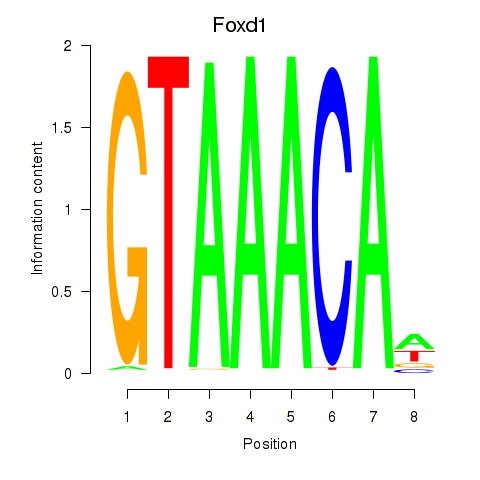
| Foxd1 | -2.036 |
|
|
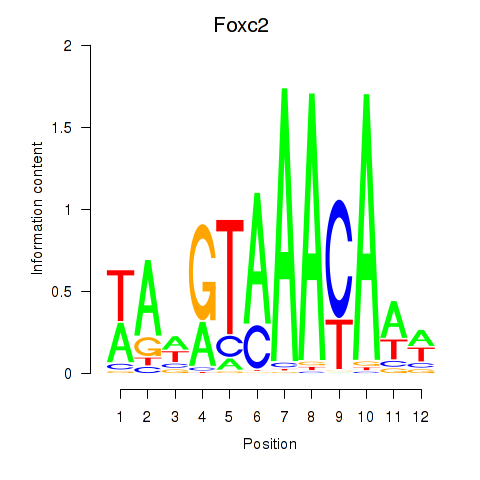
| Foxc2 | -2.049 |
|
|
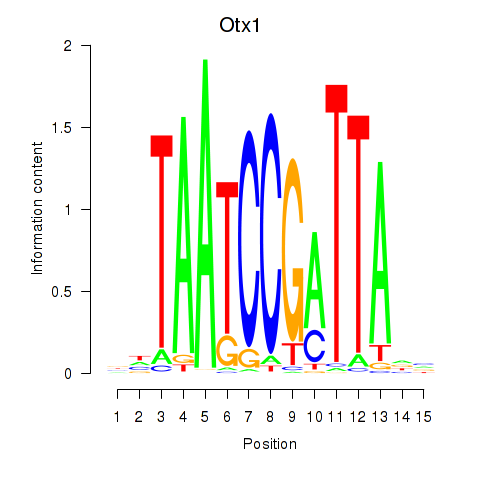
| Otx1 | -2.066 |
|
|
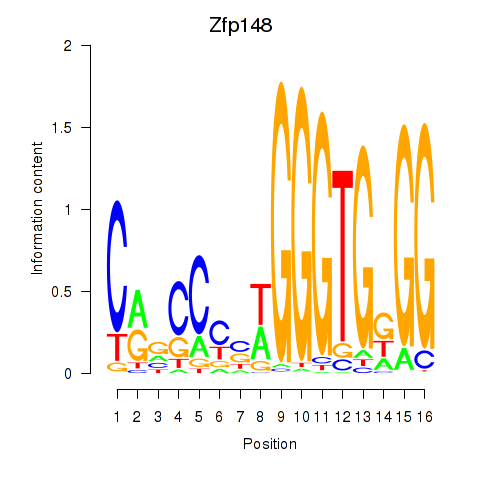
| Zfp148 | -2.080 |
|
|
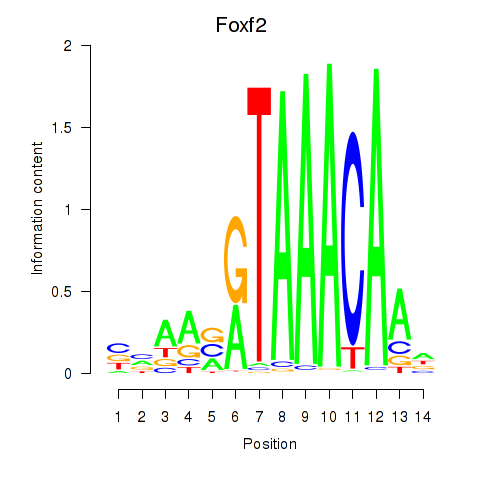
| Foxf2 | -2.126 |
|
|
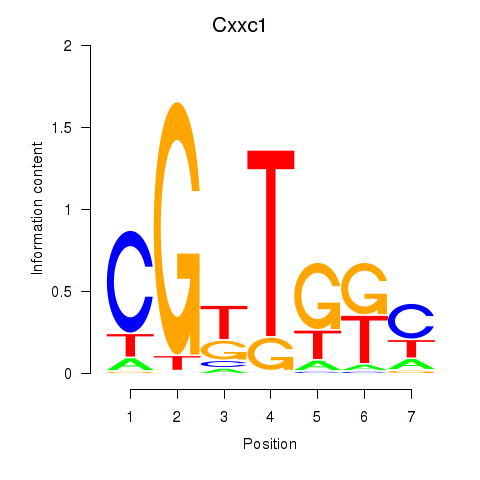
| Cxxc1 | -2.128 |
|
|
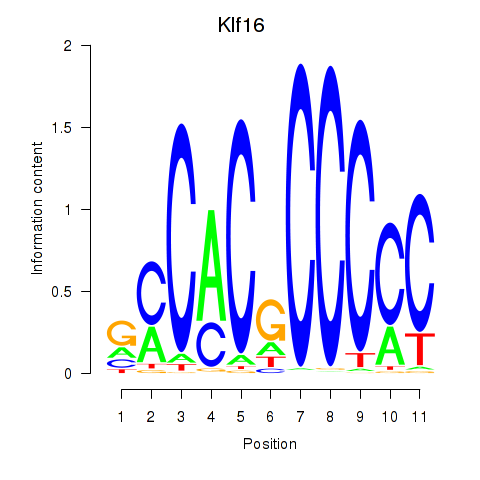
| Klf16_Sp8 | -2.150 |
|
|
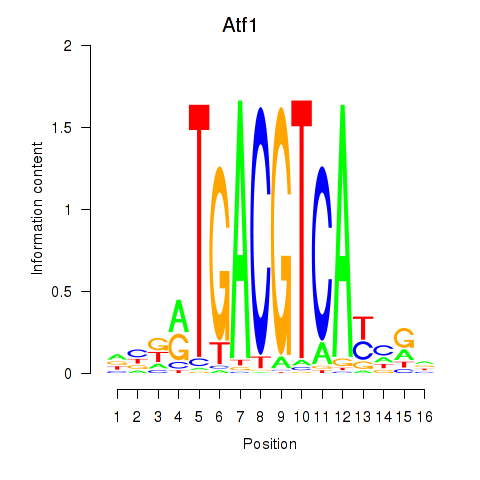
| Atf1_Creb5 | -2.161 |
|
|
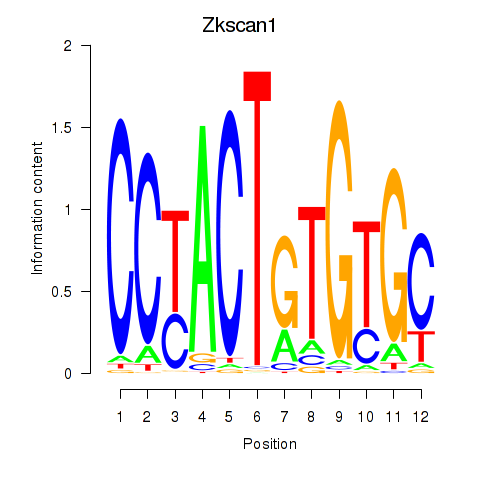
| Zkscan1 | -2.233 |
|
|
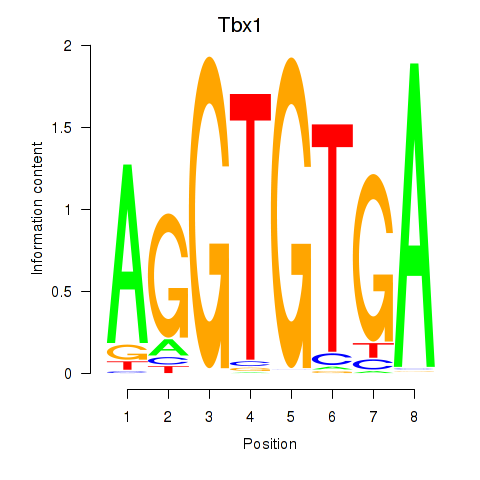
| Tbx1_Eomes | -2.264 |
|
|
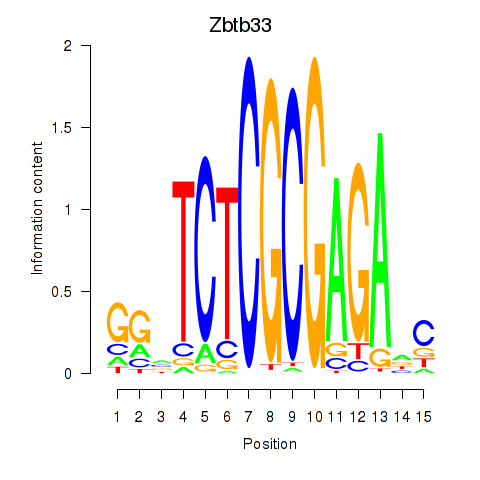
| Zbtb33_Chd2 | -2.266 |
|
|
| Hoxb3 | -2.268 |
|
|
| Pou2f1 | -2.281 |
|
|
| Meis1 | -2.316 |
|
|
| Nkx2-3 | -2.324 |
|
|
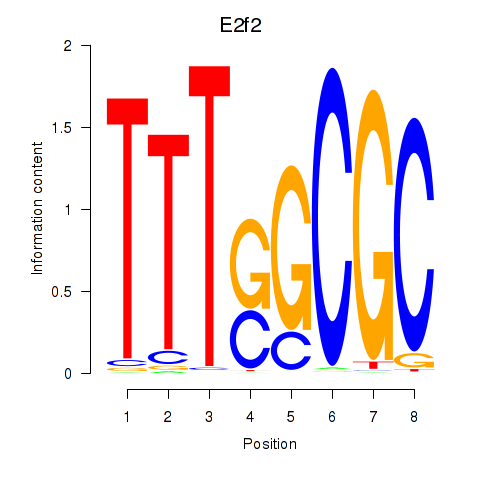
| E2f2_E2f5 | -2.346 |
|
|
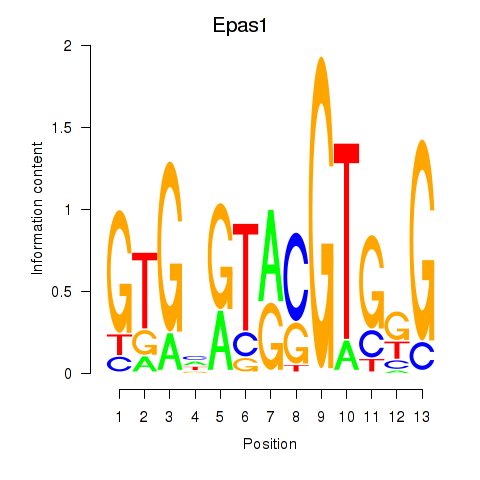
| Epas1_Bcl3 | -2.358 |
|
|
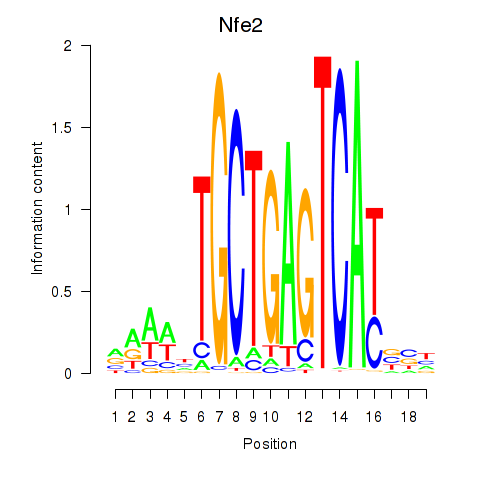
| Nfe2_Bach1_Mafk | -2.391 |
|
|
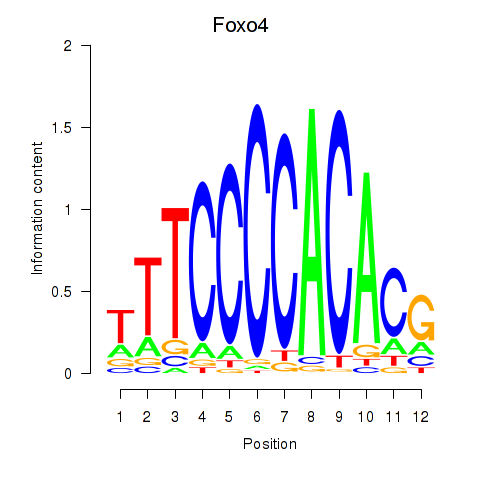
| Foxo4 | -2.394 |
|
|
| Neurog2 | -2.398 |
|
|
| Tfap2b | -2.418 |
|
|
| Obox1 | -2.434 |
|
|
| Zbtb6 | -2.463 |
|
|
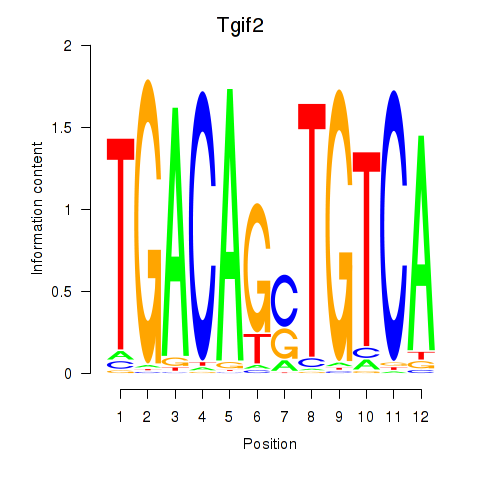
| Tgif2_Tgif2lx1_Tgif2lx2 | -2.504 |
|
|
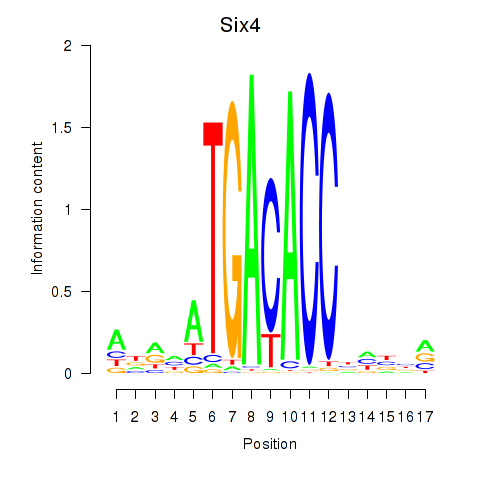
| Six4 | -2.536 |
|
|
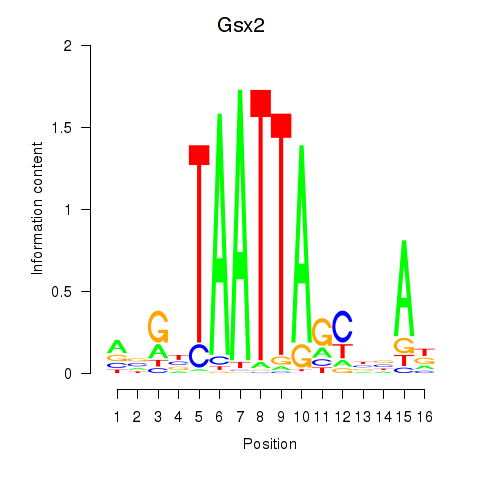
| Gsx2_Hoxd3_Vax1 | -2.577 |
|
|
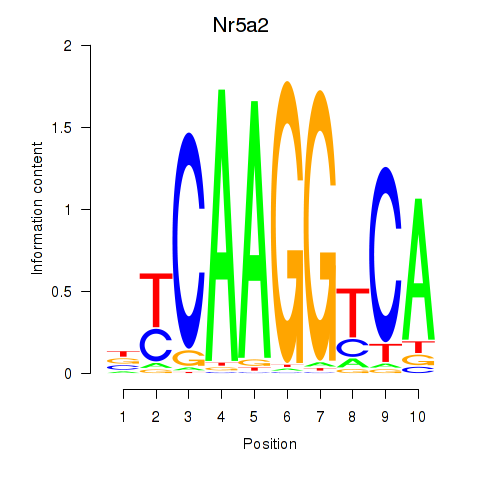
| Nr5a2 | -2.589 |
|
|
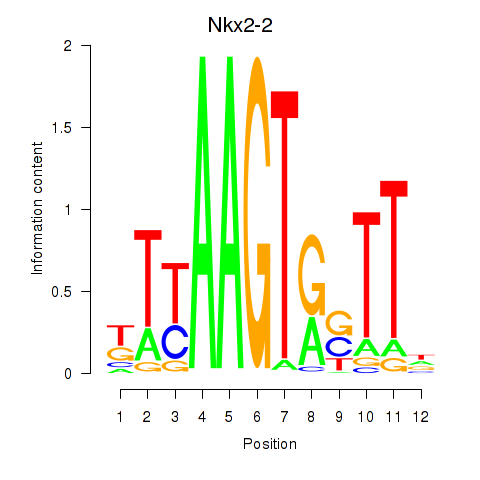
| Nkx2-2 | -2.628 |
|
|
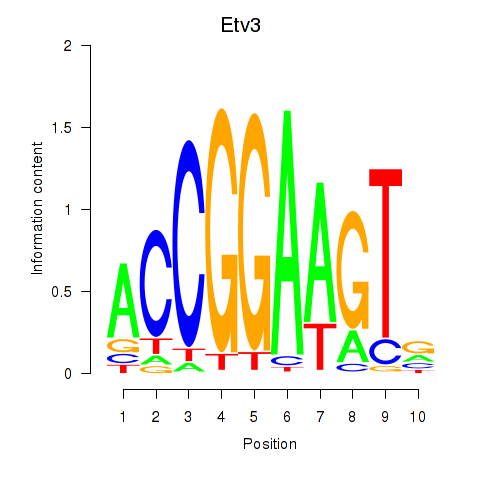
| Etv3_Erf_Fev_Elk4_Elk1_Elk3 | -2.632 |
|
|
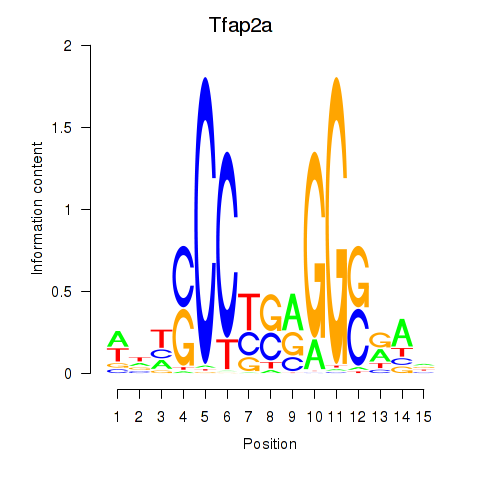
| Tfap2a | -2.647 |
|
|
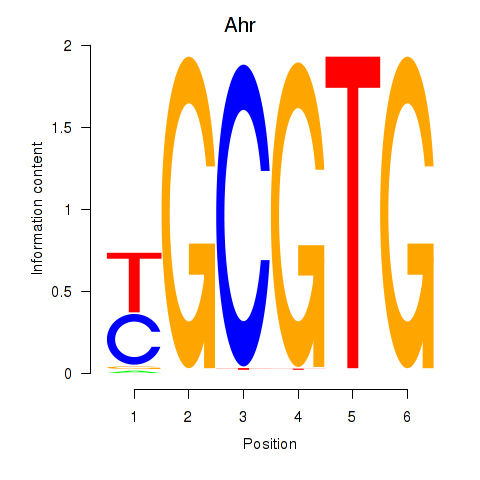
| Ahr | -2.648 |
|
|
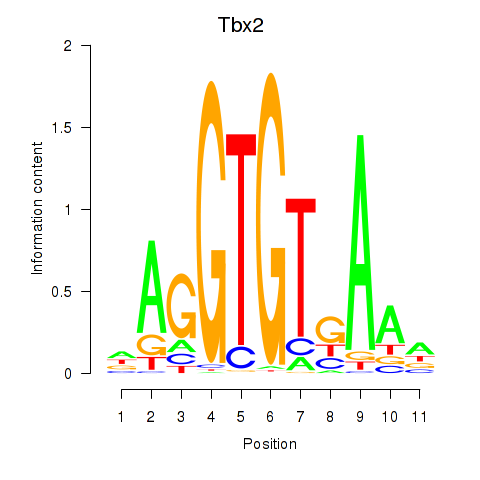
| Tbx2 | -2.711 |
|
|
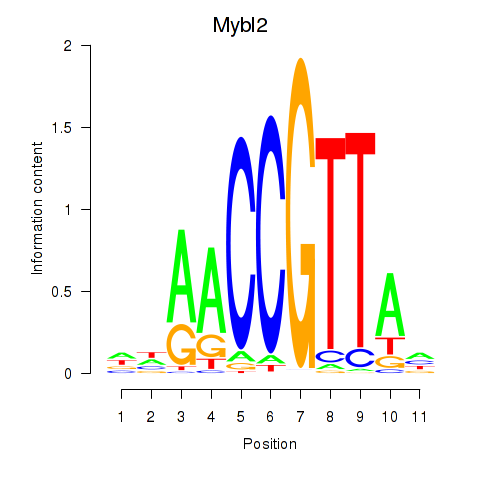
| Mybl2 | -2.757 |
|
|
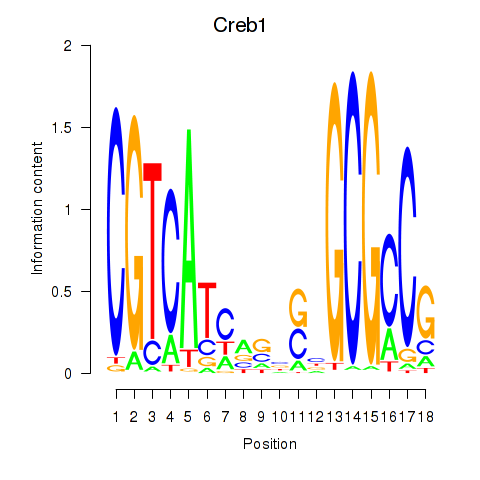
| Creb1 | -2.783 |
|
|
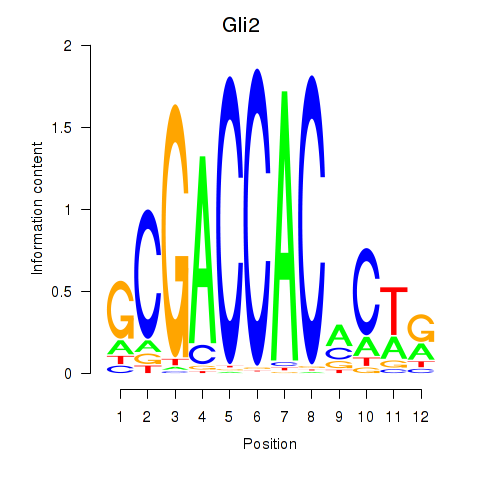
| Gli2 | -2.816 |
|
|
| Pax1_Pax9 | -2.826 |
|
|
| Pou5f1 | -2.907 |
|
|
| Zfp282 | -2.927 |
|
|
| Nkx6-1_Evx1_Hesx1 | -2.956 |
|
|
| Rest | -2.989 |
|
|
| Arntl_Tfe3_Mlx_Mitf_Mlxipl_Tfec | -3.083 |
|
|
| Etv6 | -3.086 |
|
|
| Hoxb6 | -3.091 |
|
|
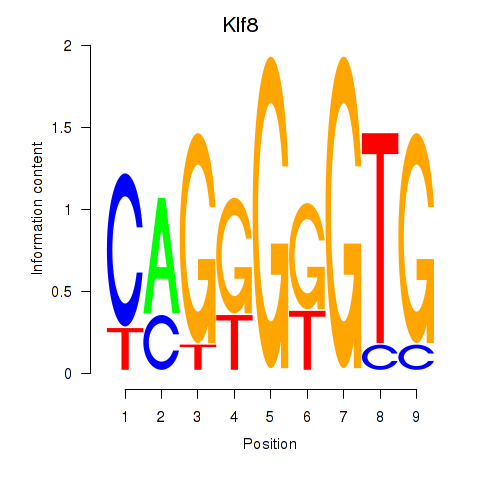
| Klf8 | -3.098 |
|
|
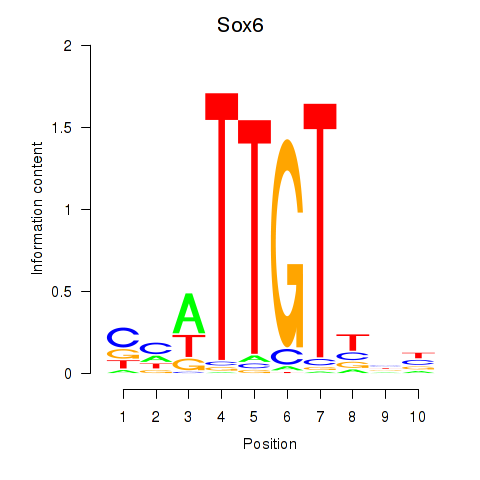
| Sox6_Sox9 | -3.112 |
|
|
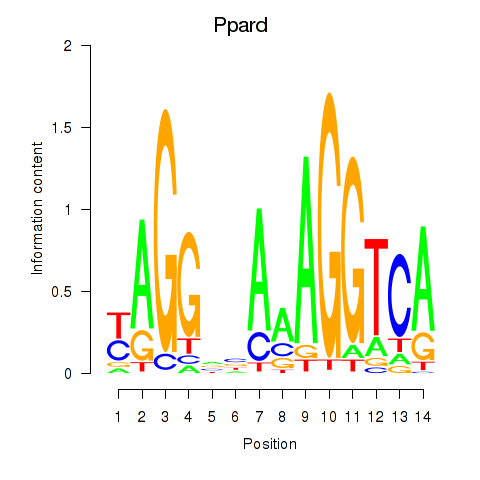
| Ppard | -3.157 |
|
|
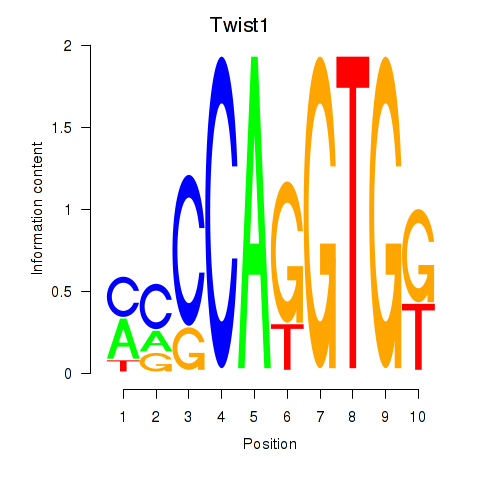
| Twist1 | -3.163 |
|
|
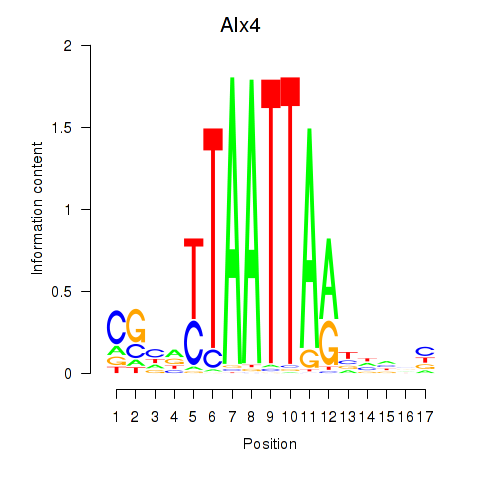
| Alx4 | -3.236 |
|
|
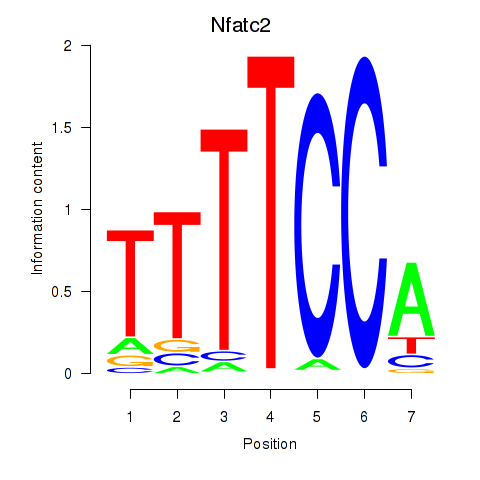
| Nfatc2 | -3.265 |
|
|
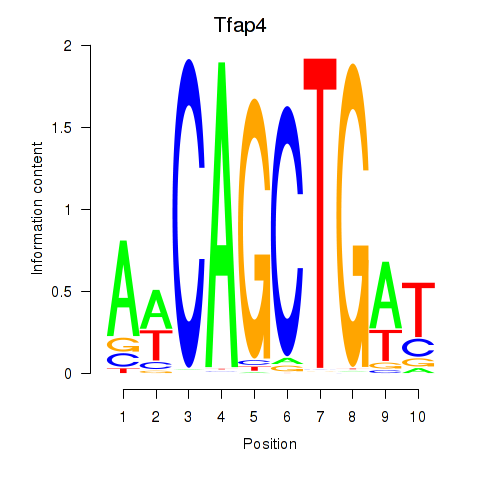
| Tfap4 | -3.269 |
|
|
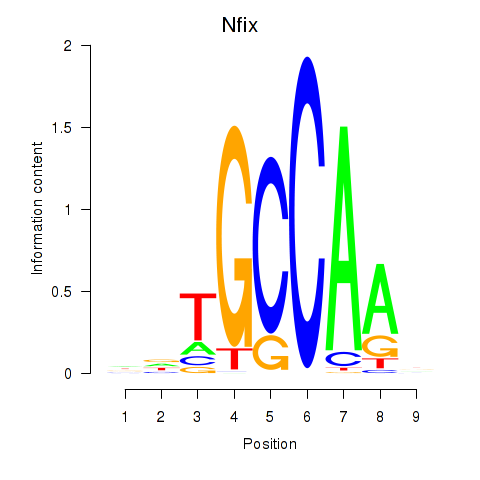
| Nfix | -3.356 |
|
|
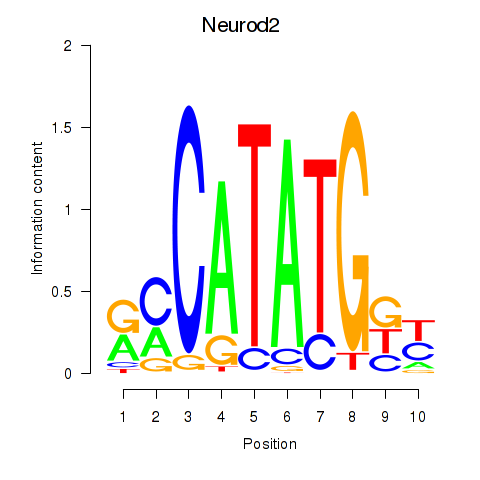
| Neurod2_Bhlha15_Bhlhe22_Olig1 | -3.376 |
|
|
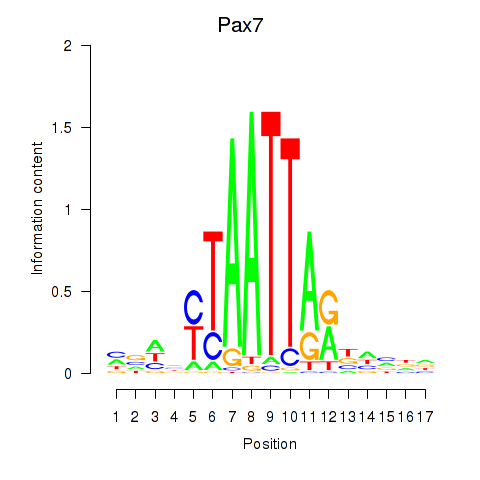
| Pax7 | -3.377 |
|
|
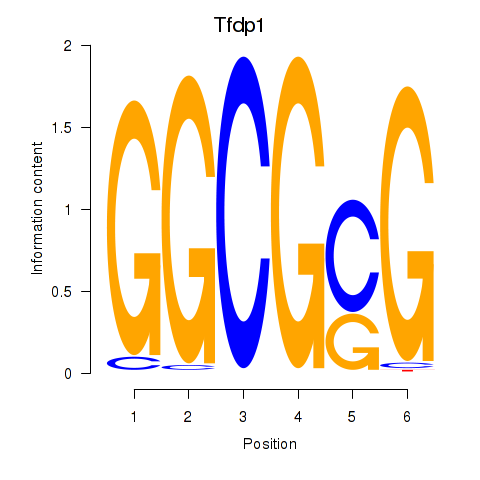
| Tfdp1_Wt1_Egr2 | -3.405 |
|
|
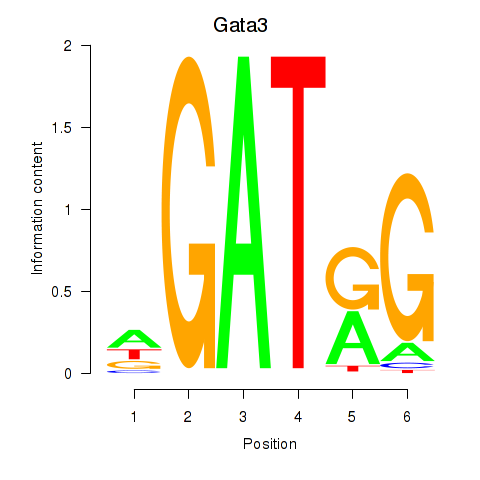
| Gata3 | -3.427 |
|
|
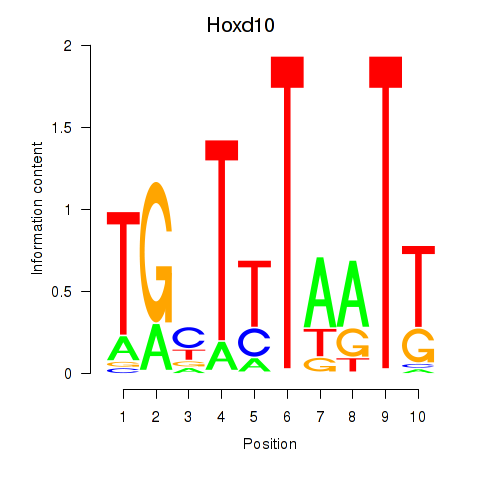
| Hoxd10 | -3.502 |
|
|
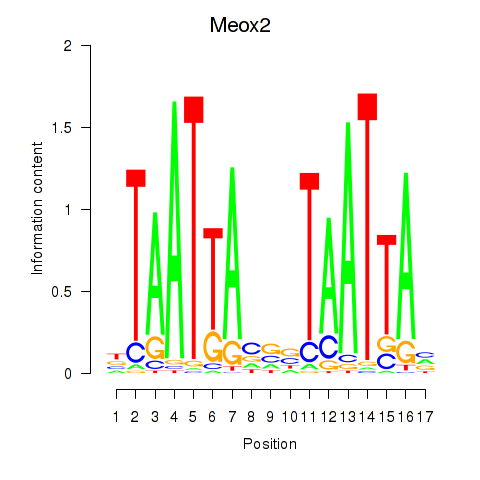
| Meox2 | -3.553 |
|
|
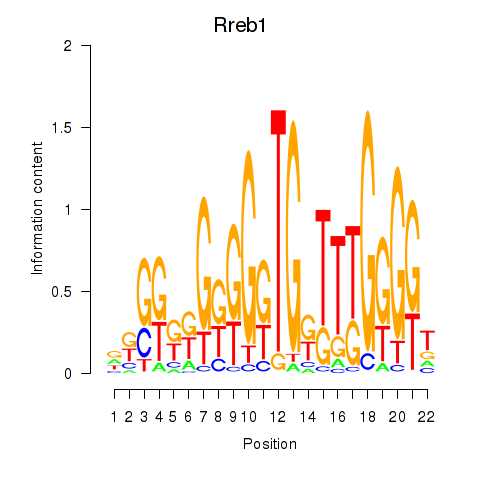
| Rreb1 | -3.595 |
|
|
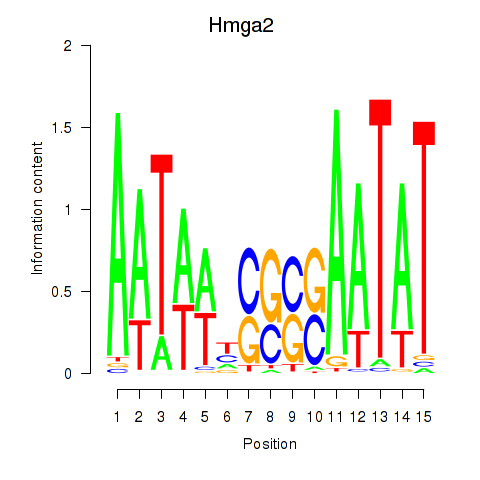
| Hmga2 | -3.647 |
|
|
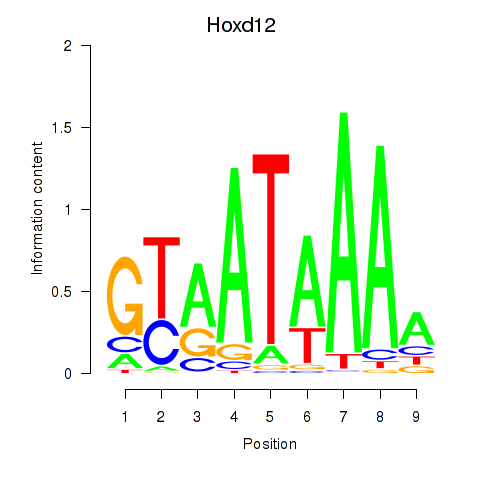
| Hoxd12 | -3.649 |
|
|
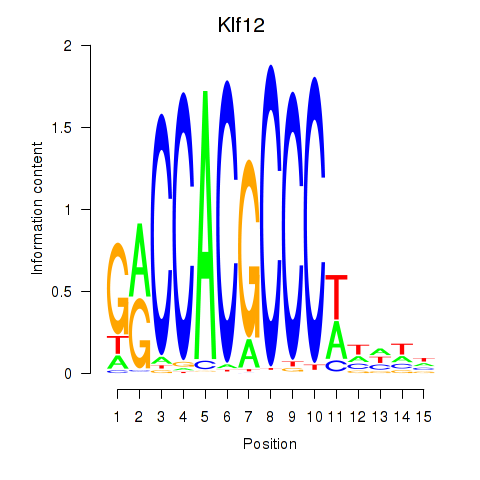
| Klf12_Klf14_Sp4 | -3.682 |
|
|
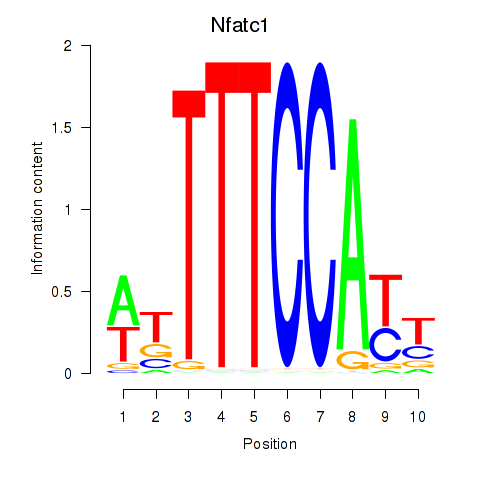
| Nfatc1 | -3.692 |
|
|
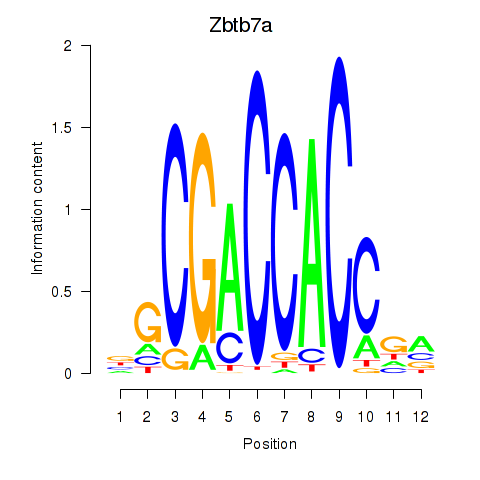
| Zbtb7a | -3.699 |
|
|
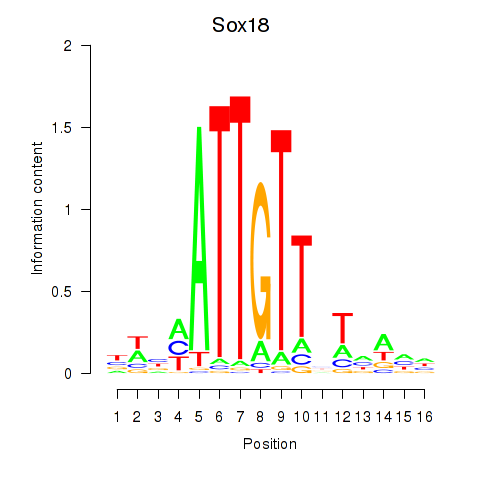
| Sox18_Sox12 | -3.713 |
|
|
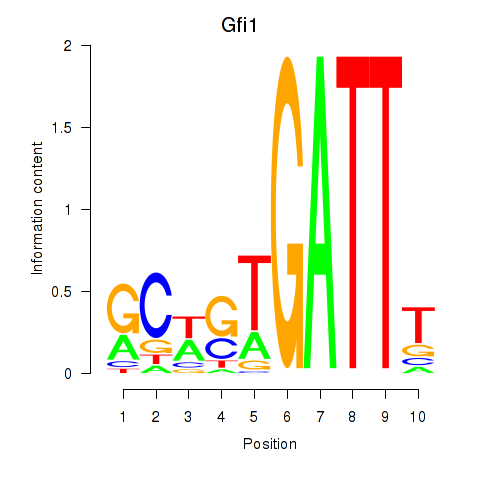
| Gfi1_Gfi1b | -3.752 |
|
|
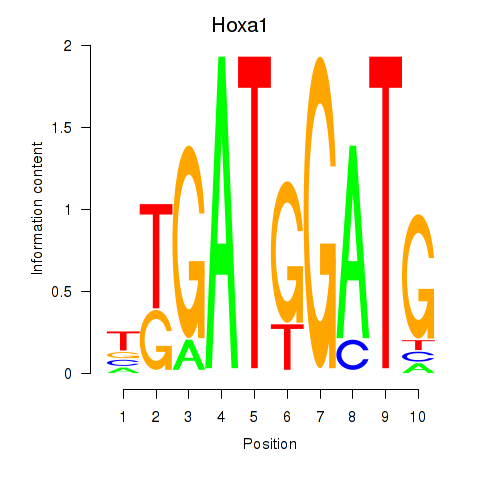
| Hoxa1 | -3.865 |
|
|
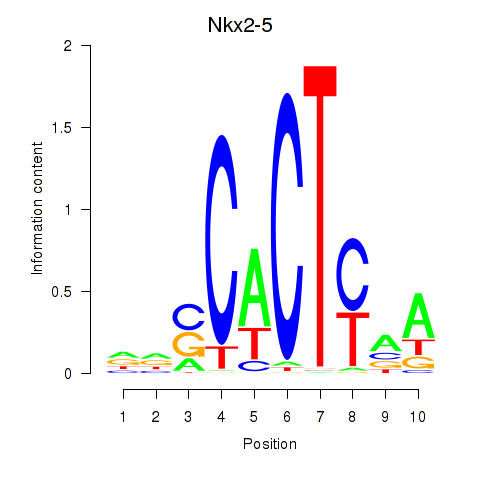
| Nkx2-5 | -3.881 |
|
|
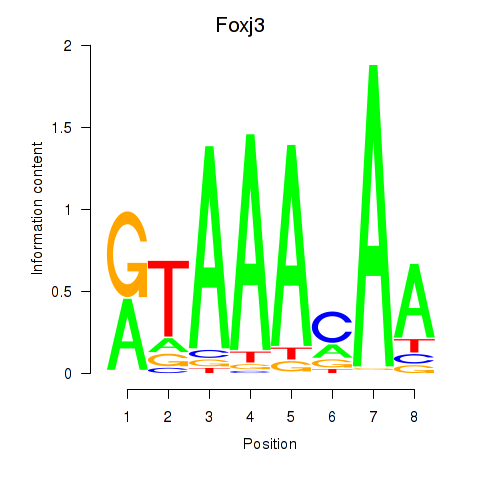
| Foxj3_Tbl1xr1 | -3.983 |
|
|
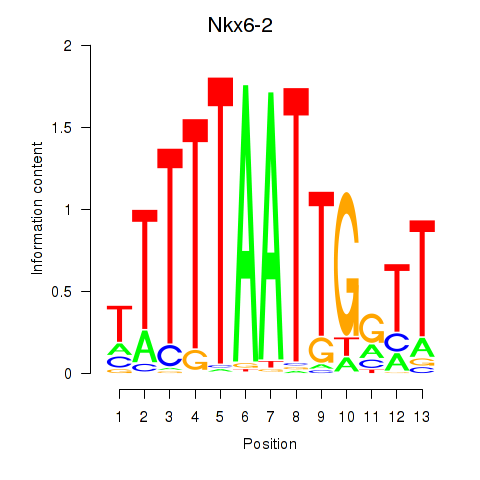
| Nkx6-2 | -4.017 |
|
|
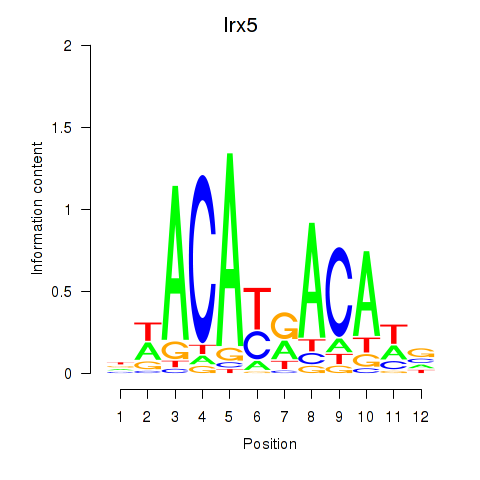
| Irx5 | -4.029 |
|
|
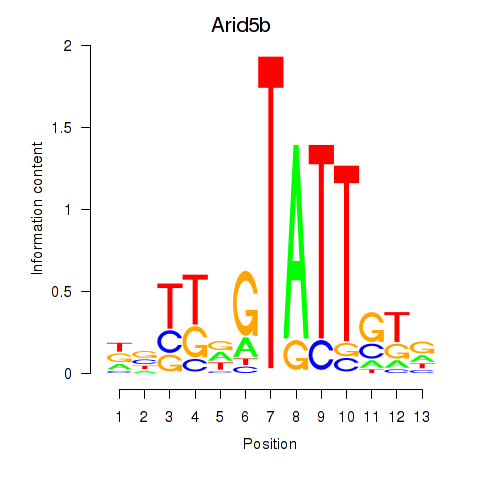
| Arid5b | -4.171 |
|
|
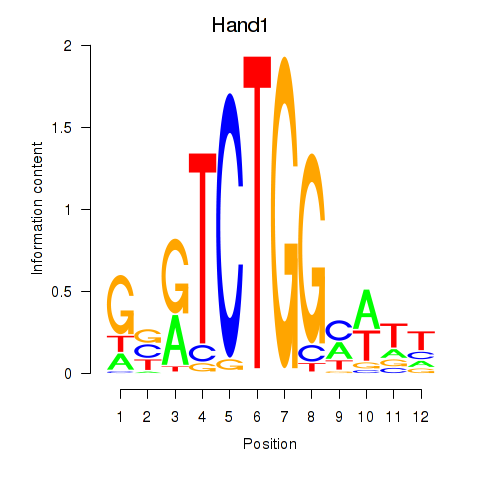
| Hand1 | -4.197 |
|
|
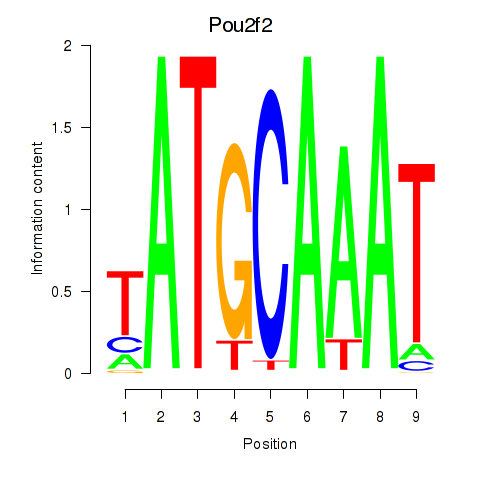
| Pou2f2_Pou3f1 | -4.213 |
|
|
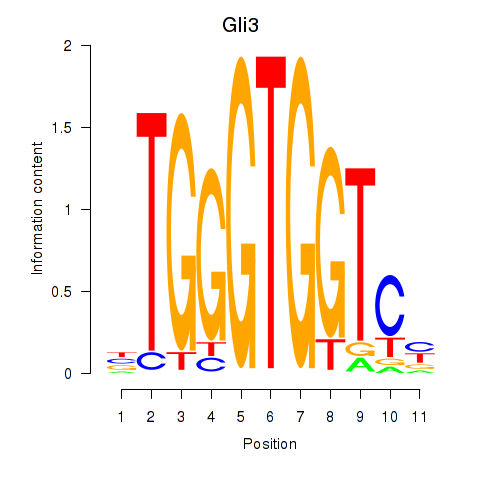
| Gli3_Zic1 | -4.228 |
|
|
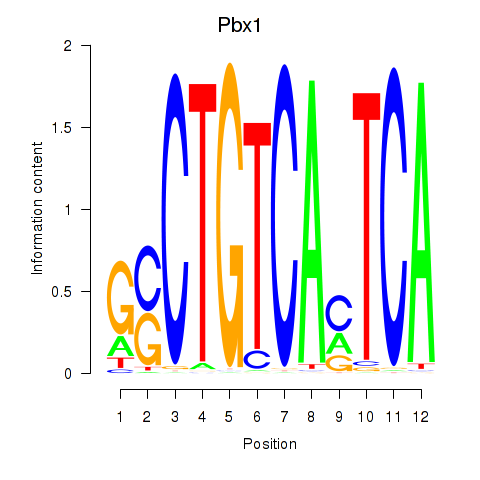
| Pbx1_Pbx3 | -4.250 |
|
|
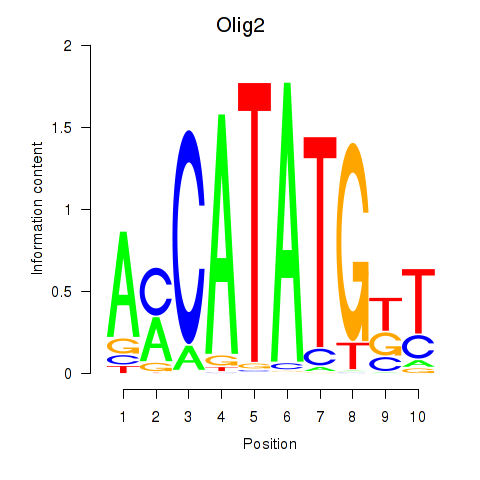
| Olig2_Olig3 | -4.328 |
|
|
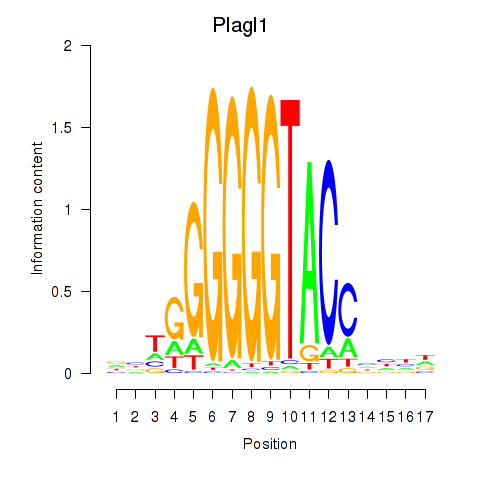
| Plagl1 | -4.362 |
|
|
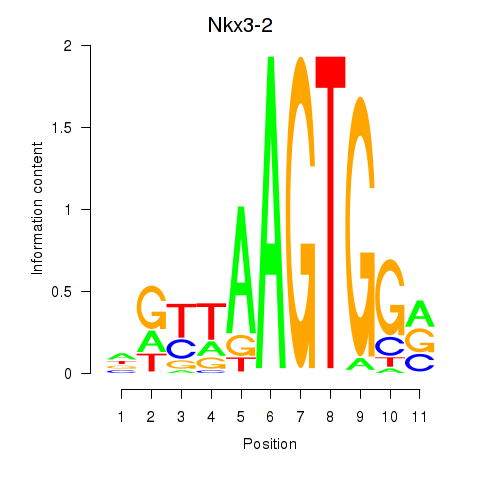
| Nkx3-2 | -4.387 |
|
|
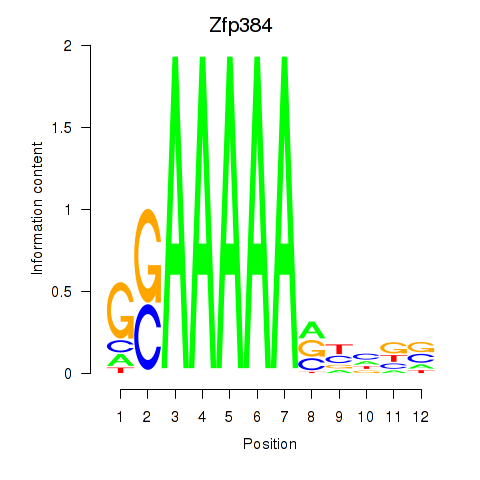
| Zfp384 | -4.521 |
|
|
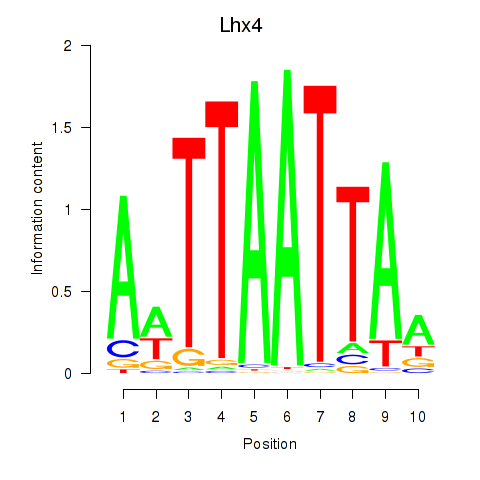
| Lhx4 | -4.549 |
|
|
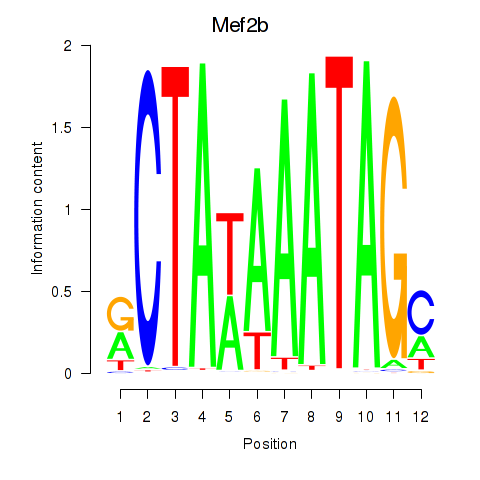
| Mef2b | -4.557 |
|
|
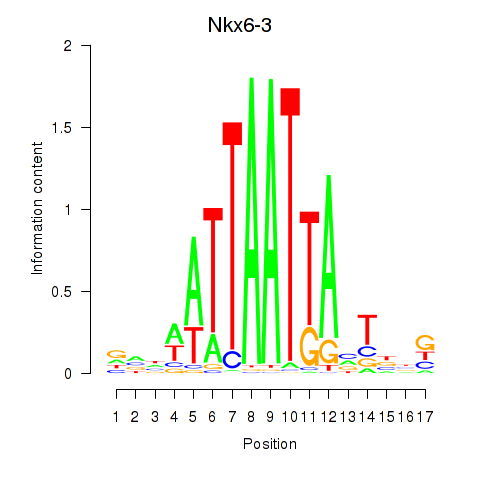
| Nkx6-3_Dbx2_Barx2 | -4.566 |
|
|
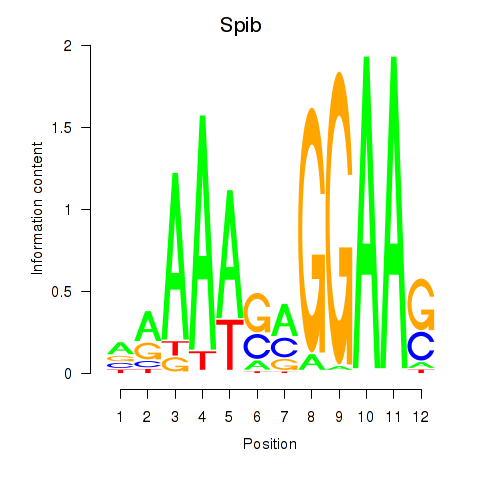
| Spib | -4.625 |
|
|
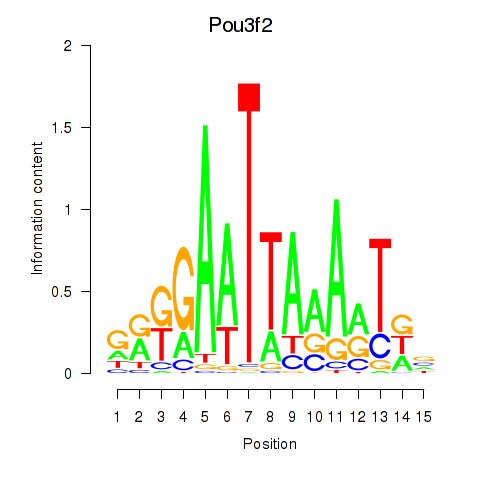
| Pou3f2 | -4.793 |
|
|
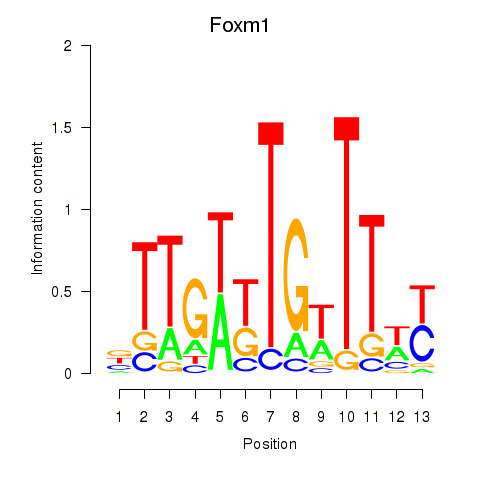
| Foxm1 | -4.863 |
|
|
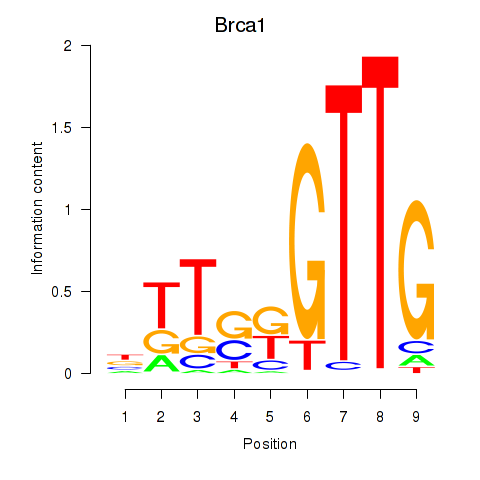
| Brca1 | -4.943 |
|
|
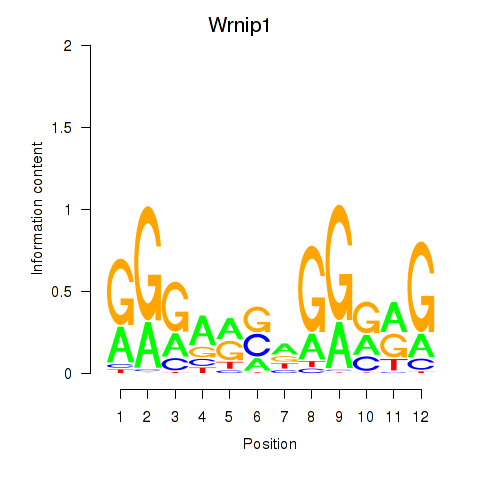
| Wrnip1_Mta3_Rcor1 | -5.205 |
|
|
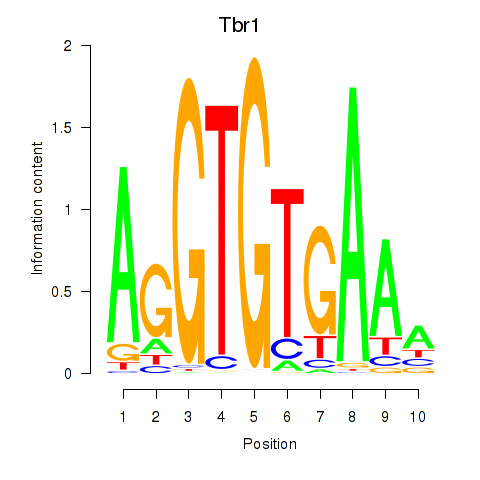
| Tbr1 | -5.218 |
|
|
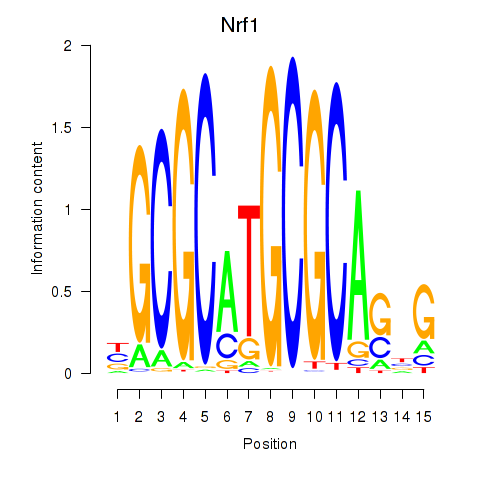
| Nrf1 | -5.424 |
|
|
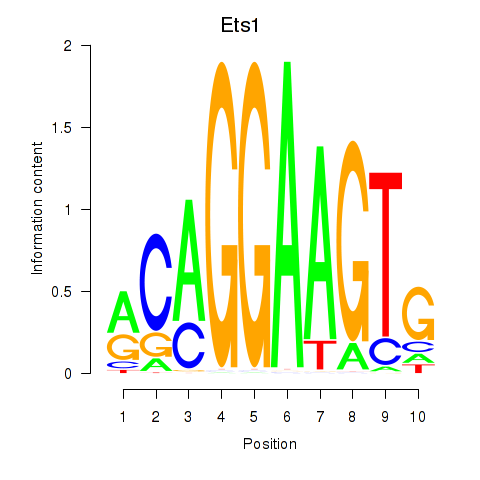
| Ets1 | -5.449 |
|
|
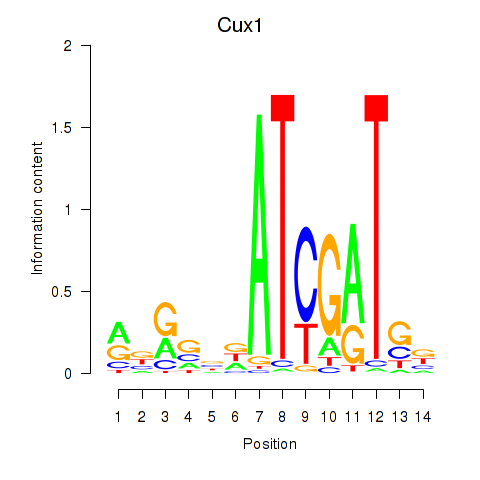
| Cux1 | -5.451 |
|
|
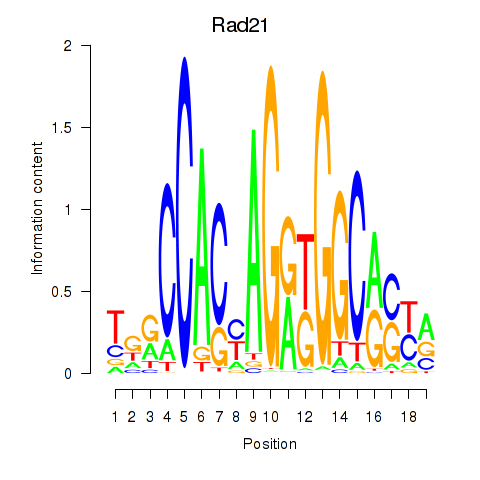
| Rad21_Smc3 | -5.489 |
|
|
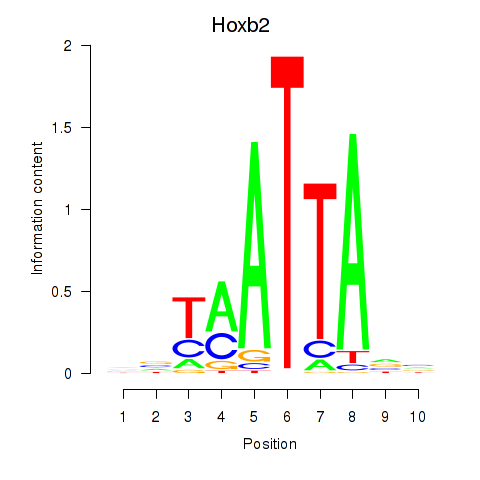
| Hoxb2_Dlx2 | -5.548 |
|
|
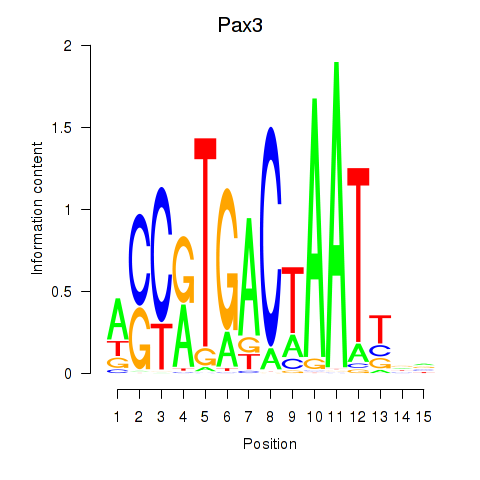
| Pax3 | -5.722 |
|
|
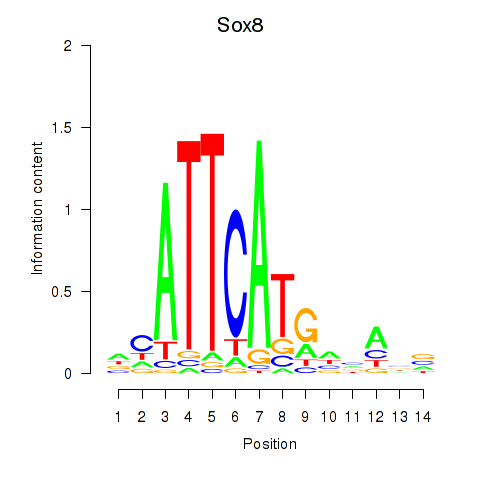
| Sox8 | -5.780 |
|
|
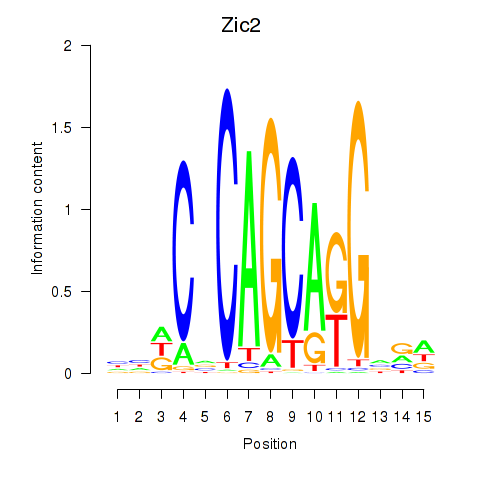
| Zic2 | -5.844 |
|
|
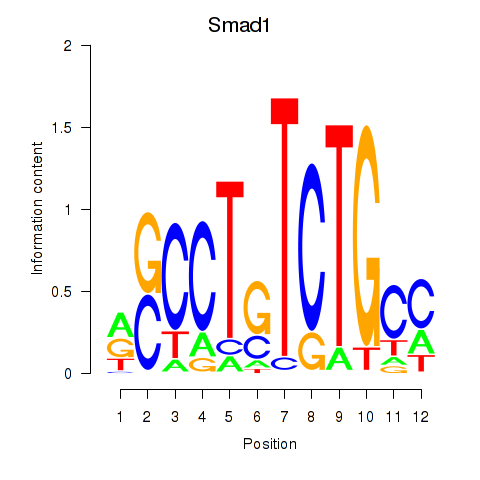
| Smad1 | -6.171 |
|
|
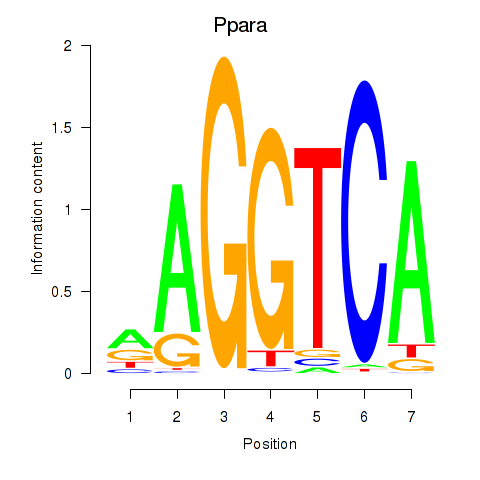
| Ppara | -6.187 |
|
|
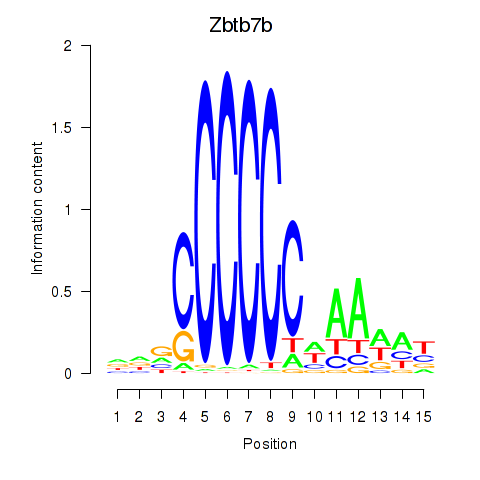
| Zbtb7b | -6.222 |
|
|
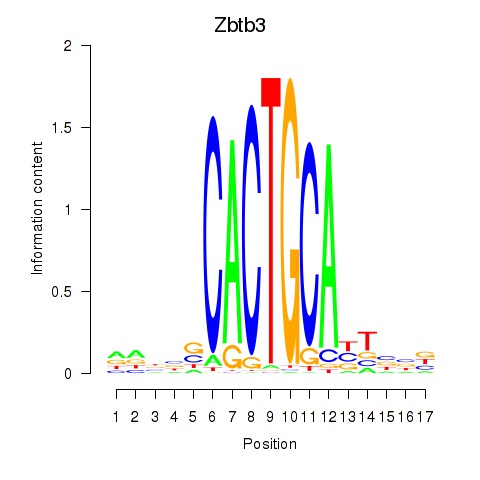
| Zbtb3 | -6.252 |
|
|
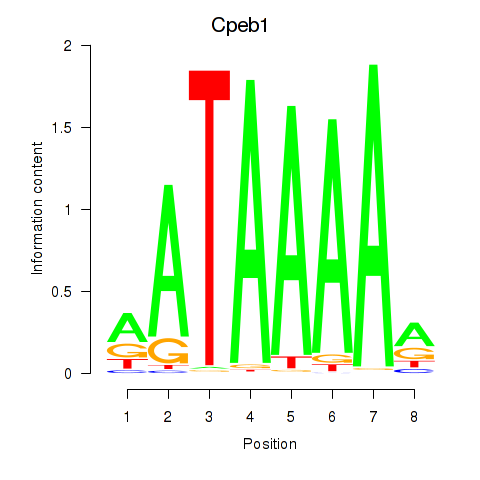
| Cpeb1 | -6.286 |
|
|
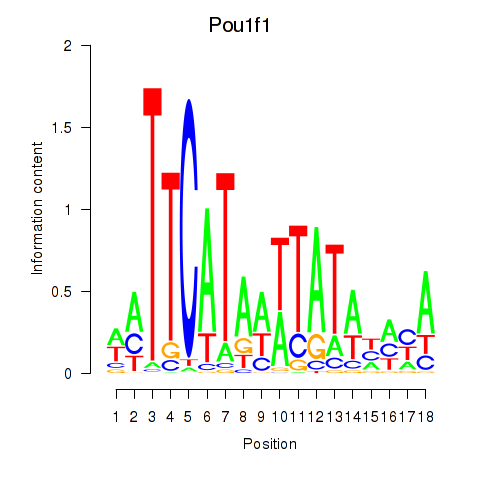
| Pou1f1 | -6.561 |
|
|
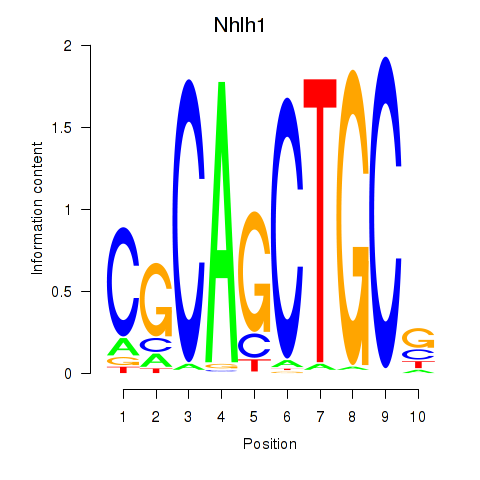
| Nhlh1 | -6.831 |
|
|
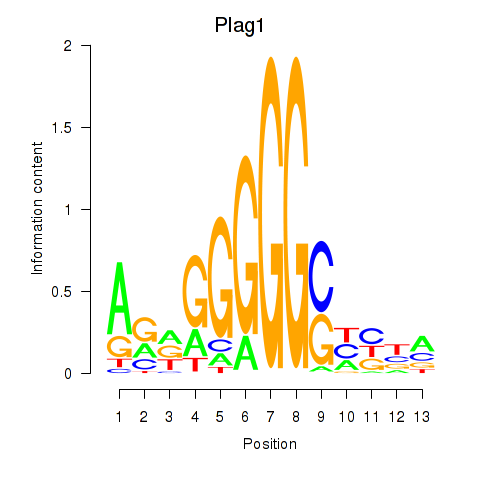
| Plag1 | -6.874 |
|
|
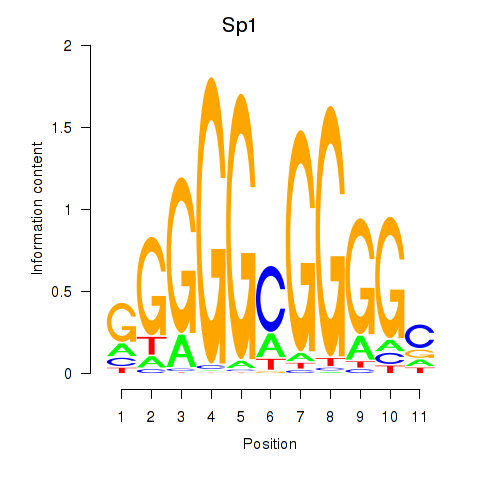
| Sp1 | -6.908 |
|
|
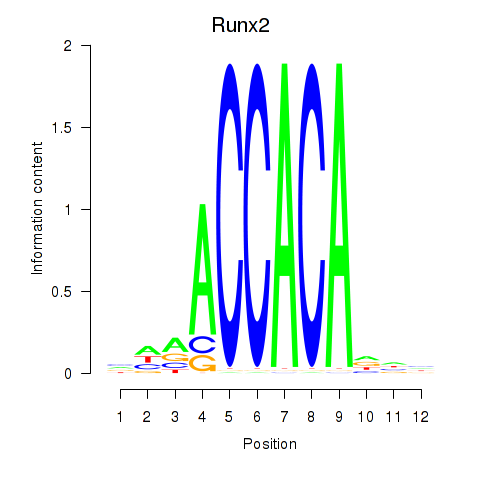
| Runx2_Bcl11a | -7.110 |
|
|
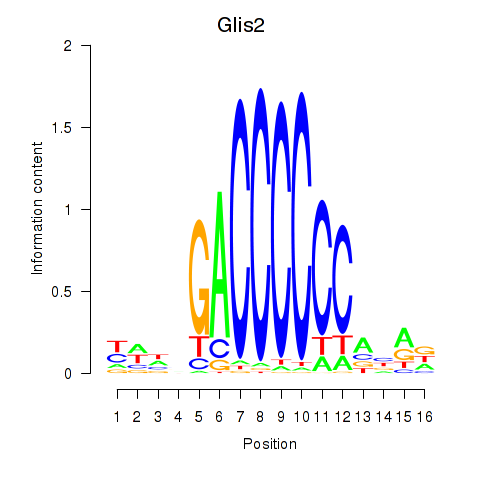
| Glis2 | -7.183 |
|
|
| Pou3f4 | -7.246 |
|
|
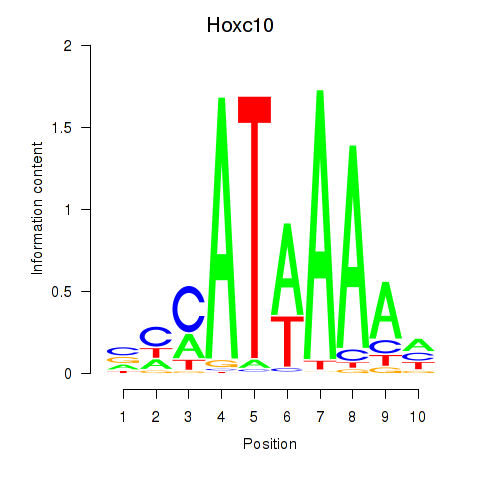
| Hoxc10 | -7.413 |
|
|
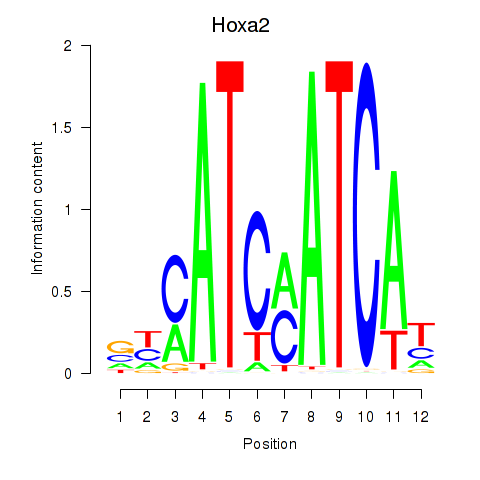
| Hoxa2 | -7.453 |
|
|
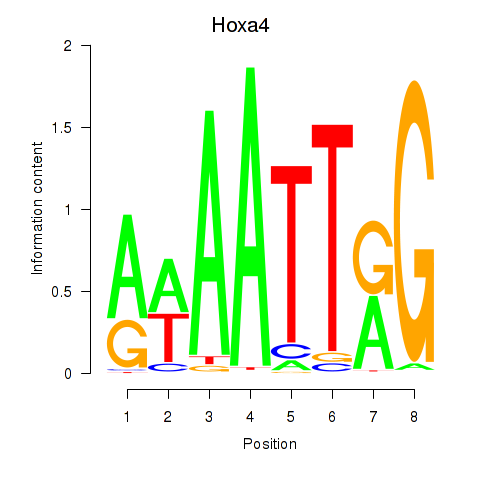
| Hoxa4 | -7.746 |
|
|
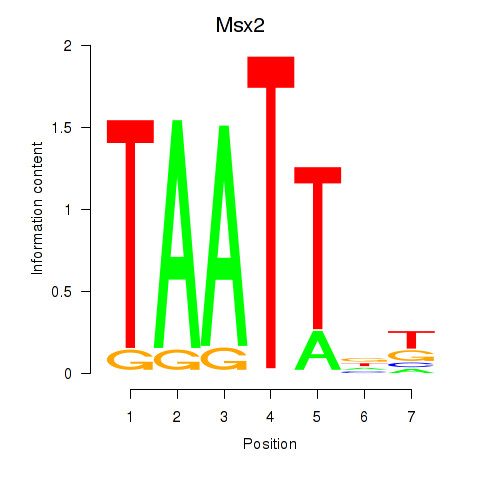
| Msx2_Hoxd4 | -7.918 |
|
|
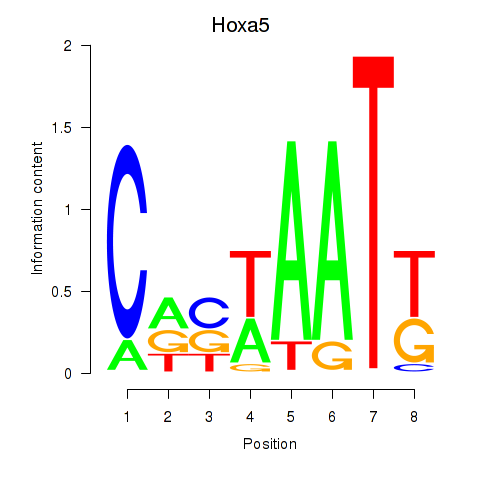
| Hoxa5 | -8.100 |
|
|
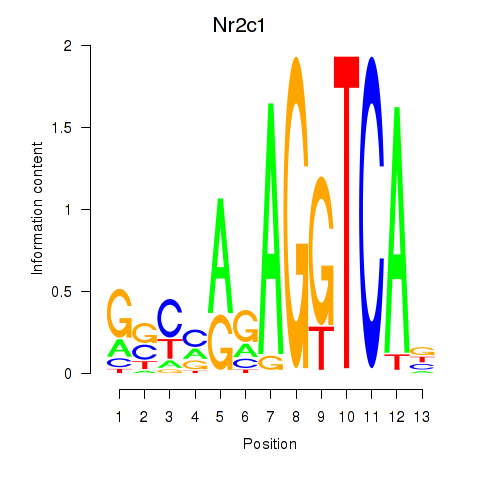
| Nr2c1 | -8.169 |
|
|
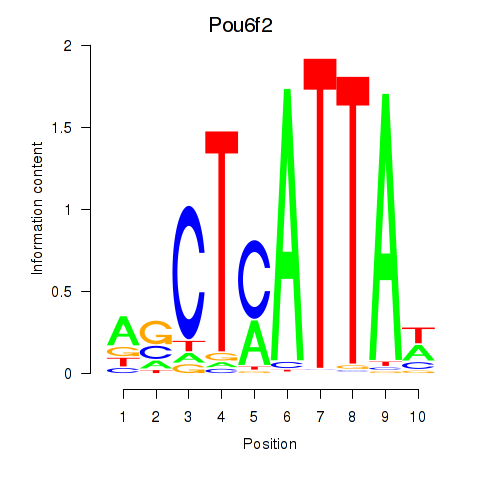
| Pou6f2_Pou4f2 | -8.472 |
|
|
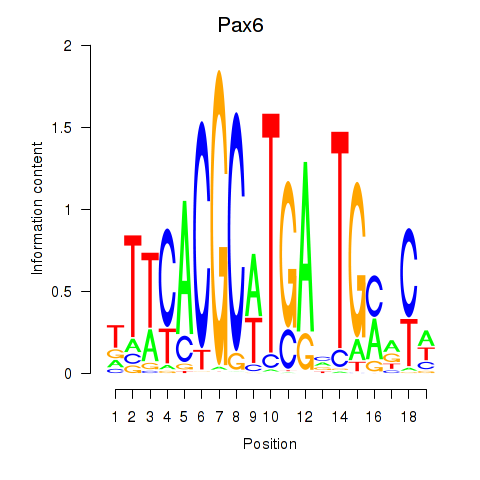
| Pax6 | -8.810 |
|
|
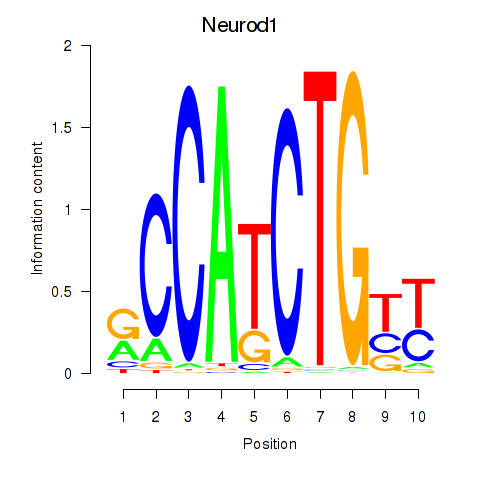
| Neurod1 | -9.450 |
|
|
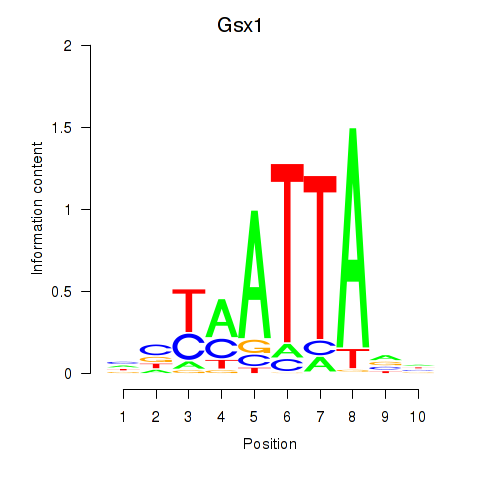
| Gsx1_Alx1_Mixl1_Lbx2 | -9.481 |
|
|
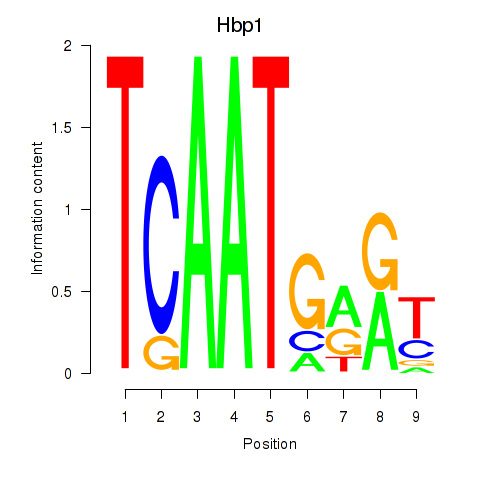
| Hbp1 | -9.637 |
|
|
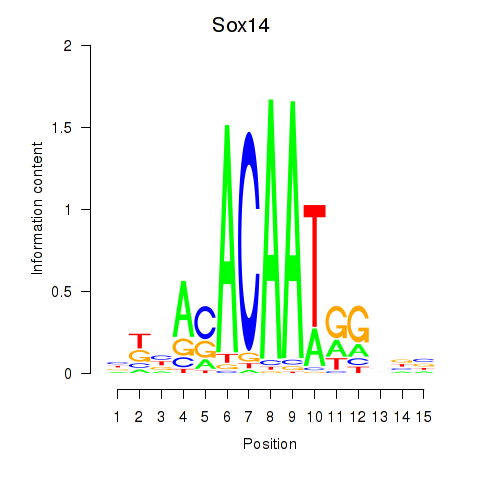
| Sox14 | -9.705 |
|
|
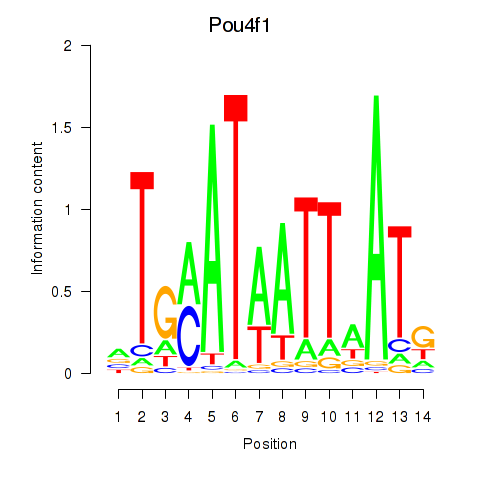
| Pou4f1_Pou6f1 | -9.828 |
|
|
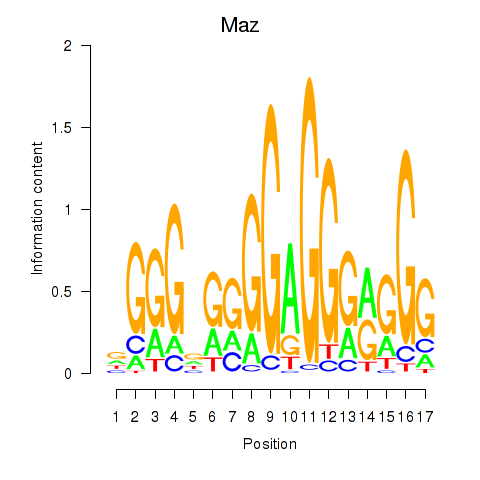
| Maz_Zfp281 | -9.844 |
|
|
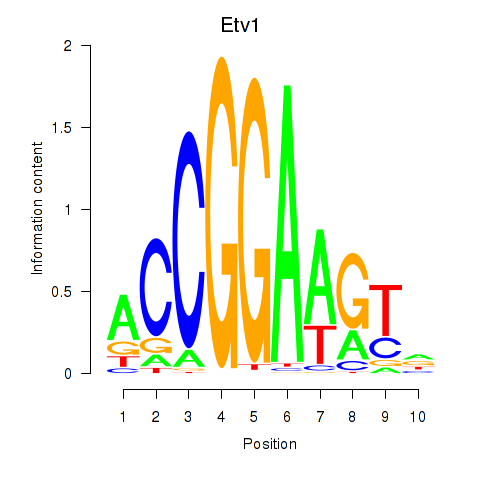
| Etv1_Etv5_Gabpa | -10.117 |
|
|
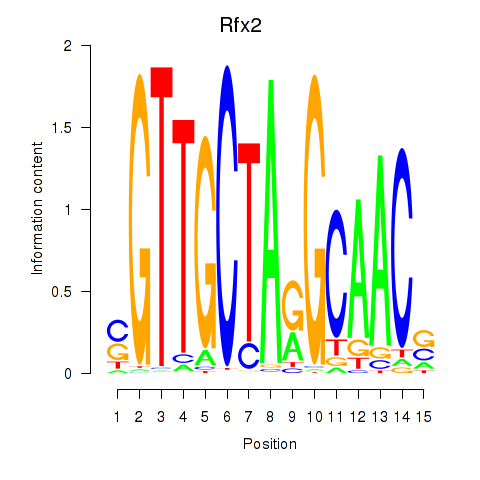
| Rfx2_Rfx7 | -10.237 |
|
|
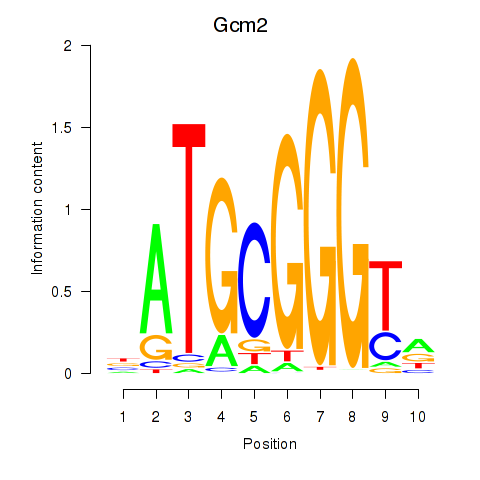
| Gcm2 | -10.551 |
|
|
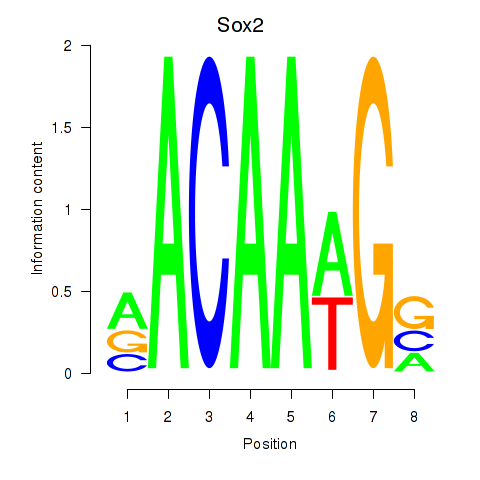
| Sox2 | -10.909 |
|
|
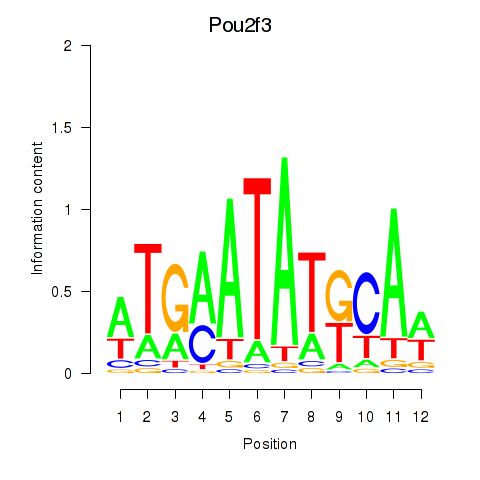
| Pou2f3 | -11.043 |
|
|
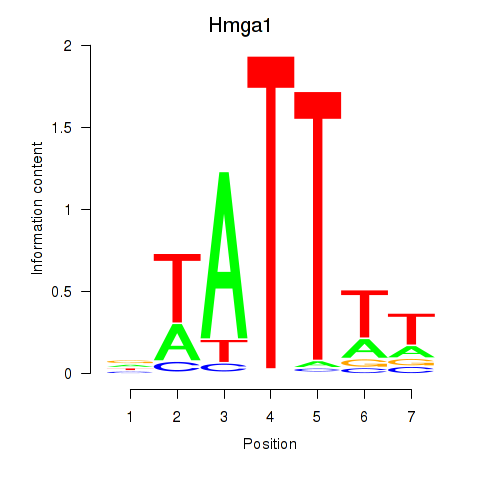
| Hmga1 | -13.927 |
|
|
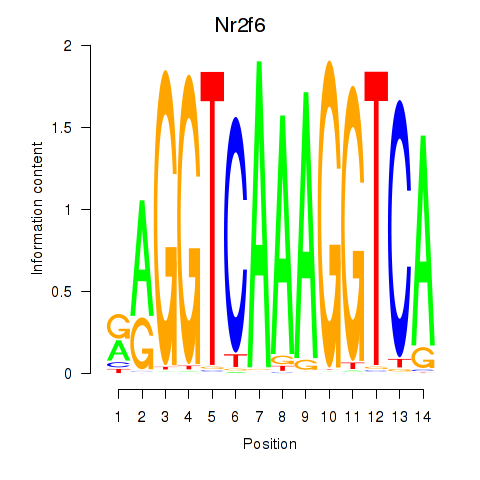
| Nr2f6 | -15.039 |
|
|
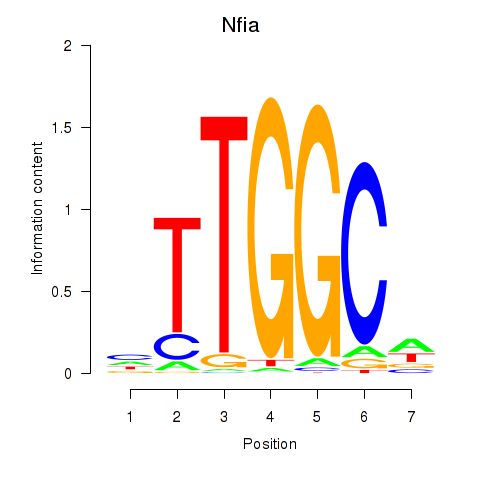
| Nfia | -15.603 |
|
|
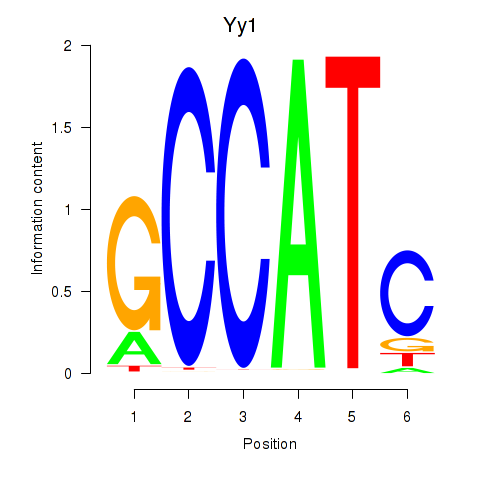
| Yy1_Yy2 | -15.913 |
|
|
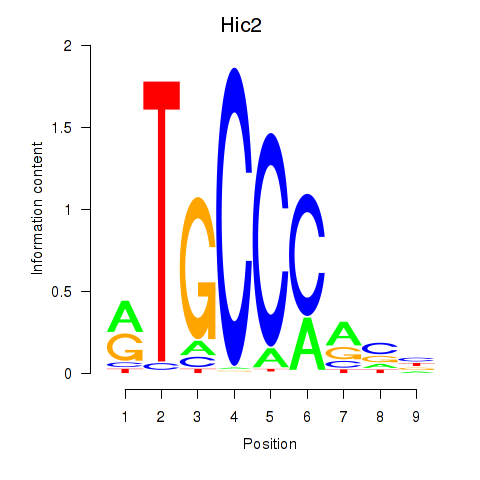
| Hic2 | -18.061 |
|
|
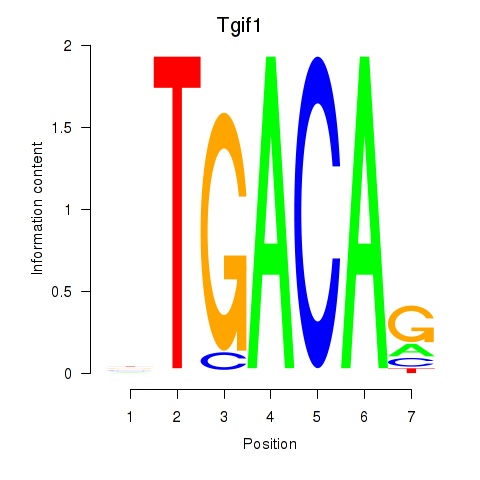
| Tgif1_Meis3 | -19.559 |
|
|
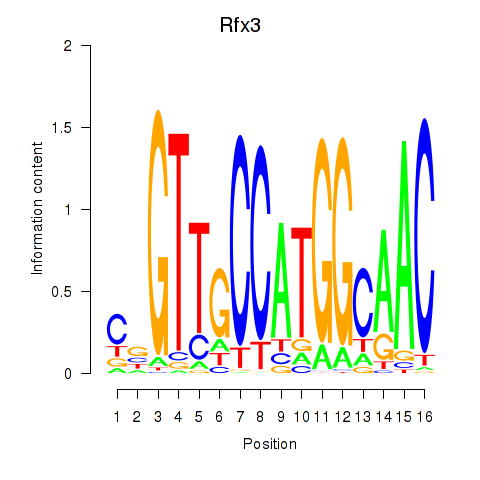
| Rfx3_Rfx1_Rfx4 | -28.494 |
|
|