Project
ENCODE: ATAC-seq of different tissues during embryonic development
Navigation
Downloads

Regulatory motifs sorted by significance (z-value)
| Motif name | Z-value | Associated genes | Profile | Logo |
|---|---|---|---|---|
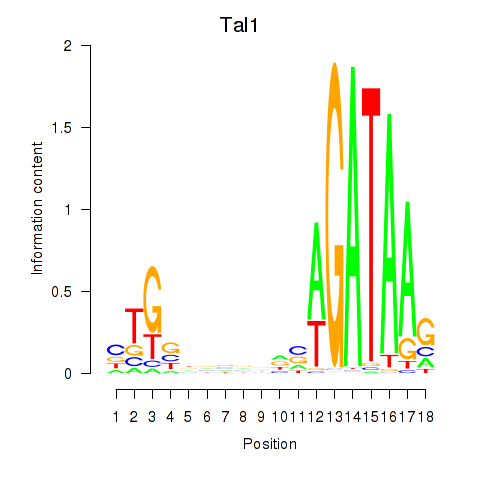
| Tal1 | 43.90 |
|
|
|
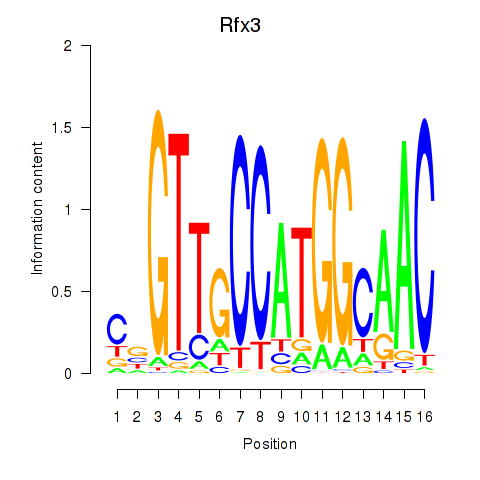
| Rfx3_Rfx1_Rfx4 | 31.11 |
|
|
|
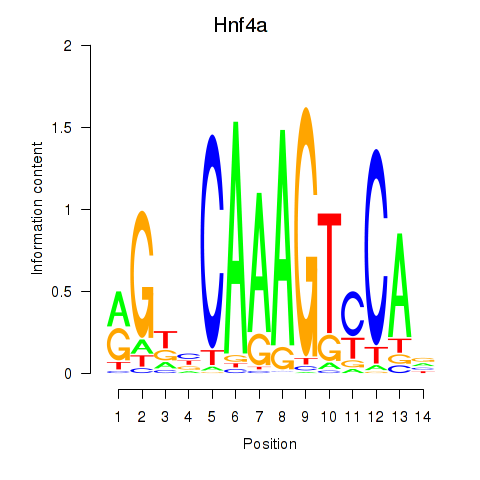
| Hnf4a | 24.18 |
|
|
|
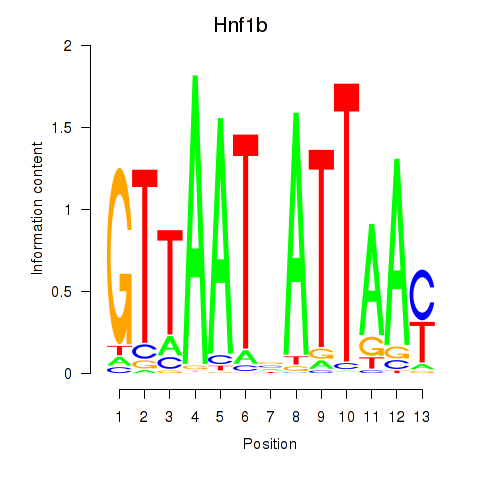
| Hnf1b | 23.65 |
|
|
|
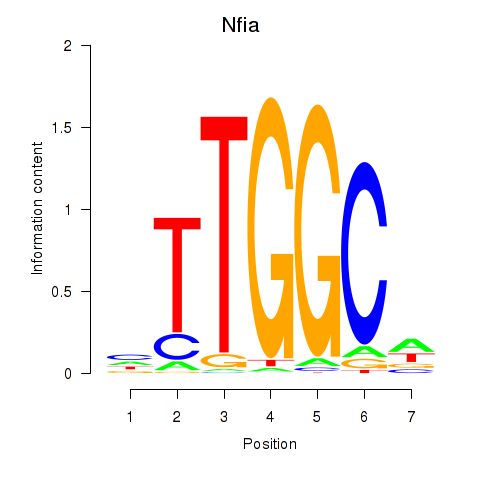
| Nfia | 19.84 |
|
|
|
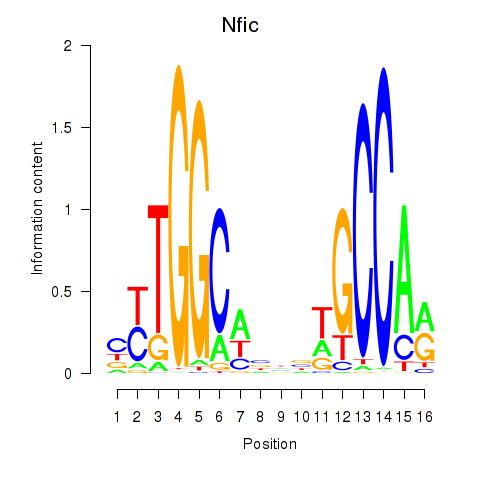
| Nfic_Nfib | 17.41 |
|
|
|
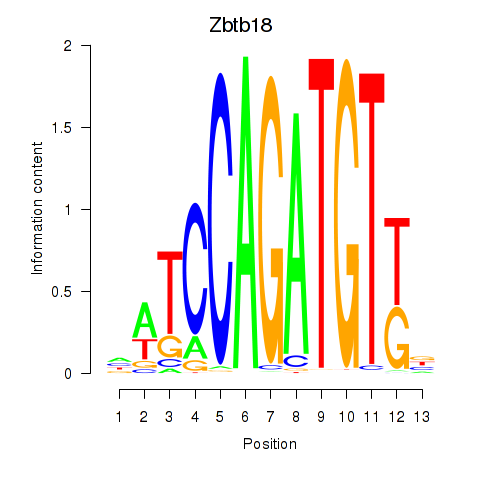
| Zbtb18 | 16.76 |
|
|
|
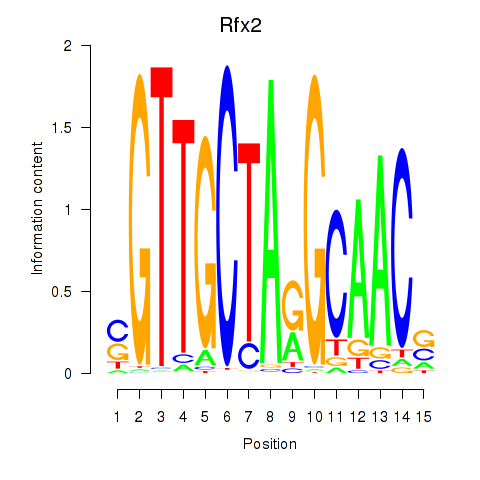
| Rfx2_Rfx7 | 15.46 |
|
|
|
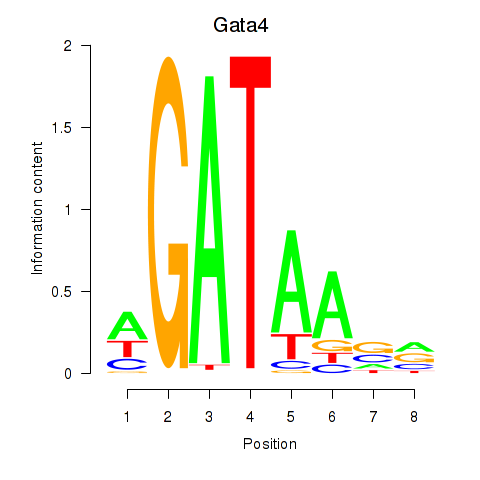
| Gata4 | 15.42 |
|
|
|
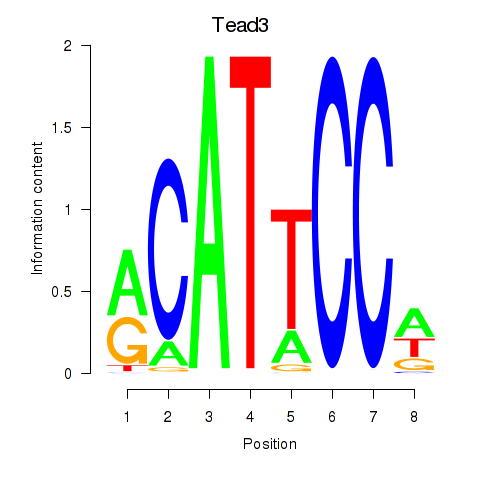
| Tead3_Tead4 | 15.15 |
|
|
|
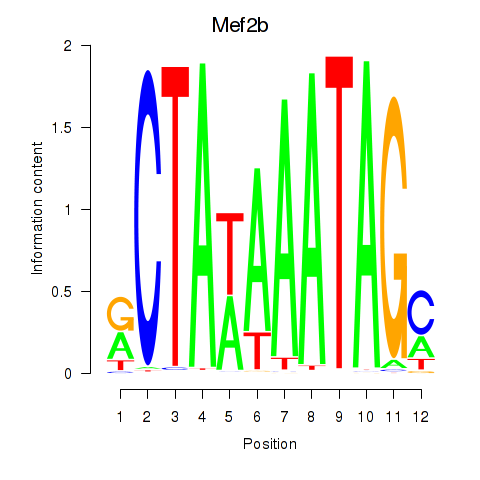
| Mef2b | 14.50 |
|
|
|
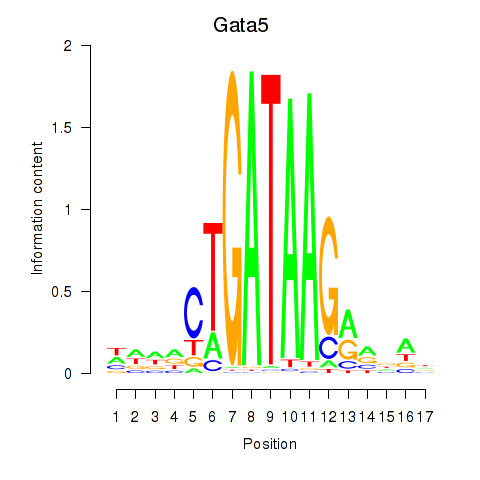
| Gata5 | 14.25 |
|
|
|
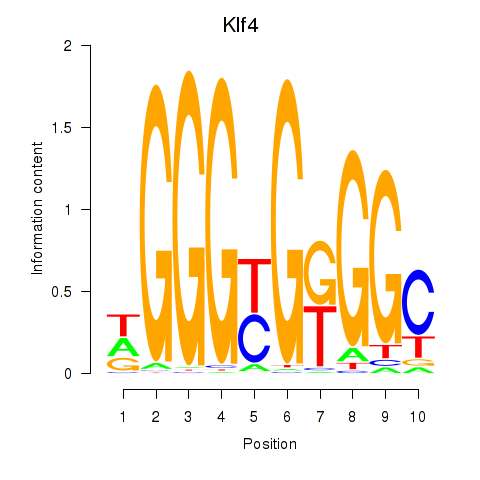
| Klf4_Sp3 | 13.37 |
|
|
|
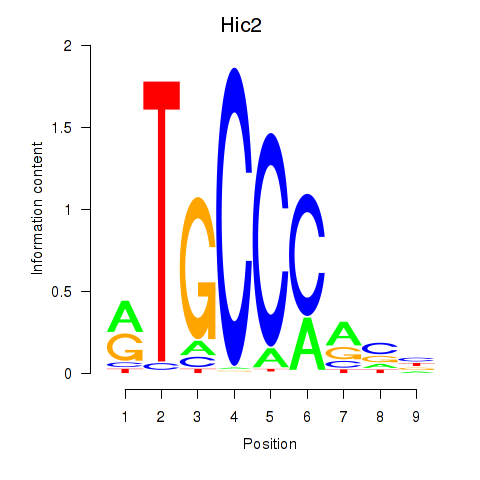
| Hic2 | 13.22 |
|
|
|
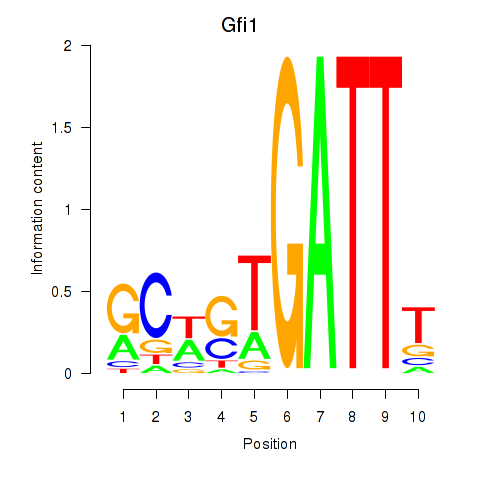
| Gfi1_Gfi1b | 12.92 |
|
|
|
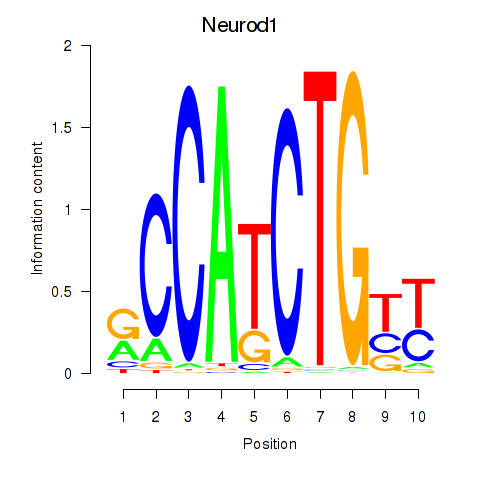
| Neurod1 | 12.62 |
|
|
|
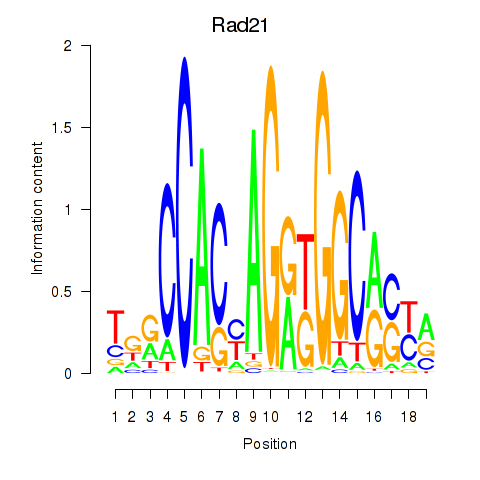
| Rad21_Smc3 | 12.22 |
|
|
|
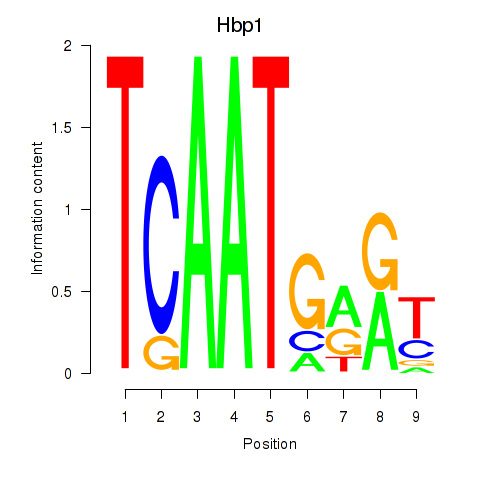
| Hbp1 | 12.19 |
|
|
|
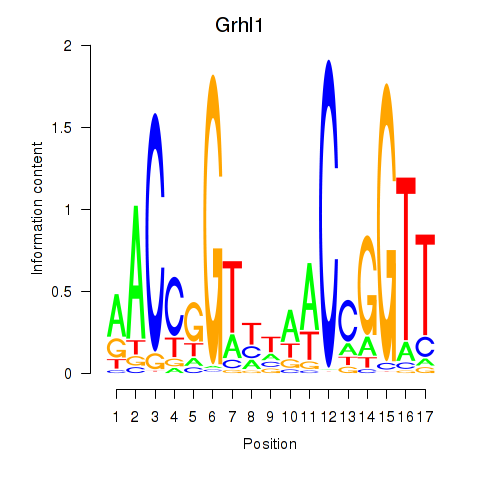
| Grhl1 | 12.08 |
|
|
|
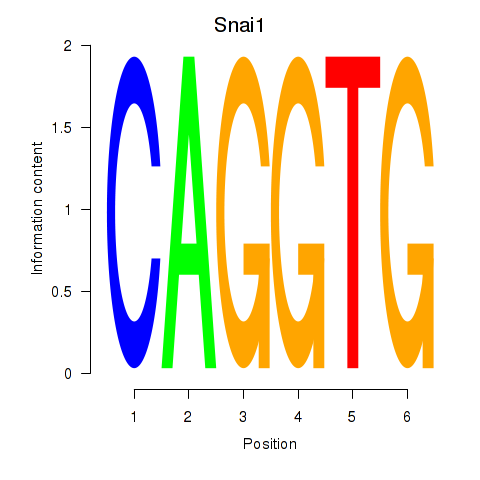
| Snai1_Zeb1_Snai2 | 11.94 |
|
|
|
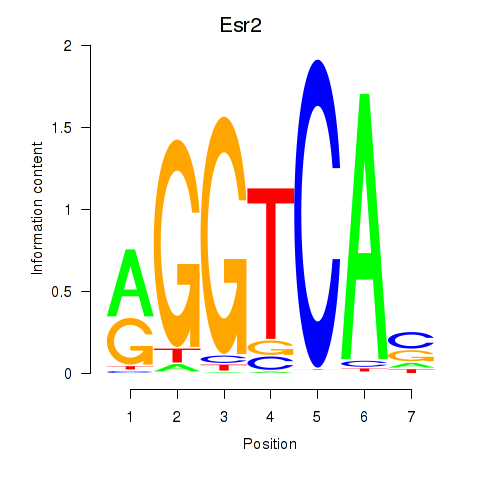
| Esr2 | 11.51 |
|
|
|
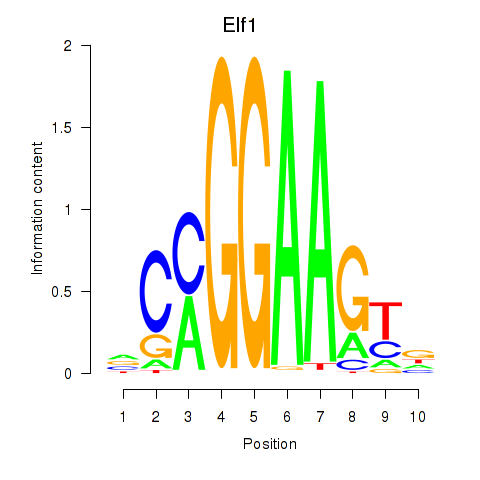
| Elf1_Elf2_Etv2_Elf4 | 11.43 |
|
|
|
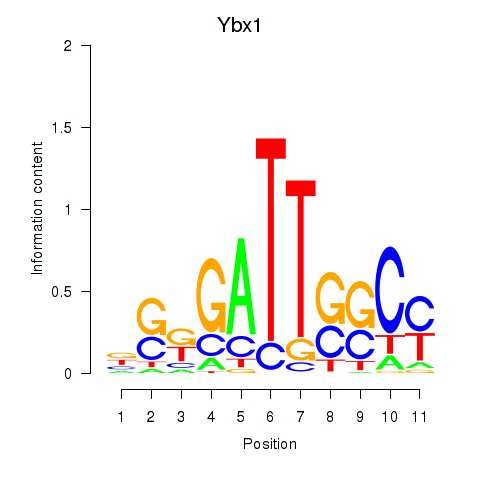
| Ybx1_Nfya_Nfyb_Nfyc_Cebpz | 11.07 |
|
|
|
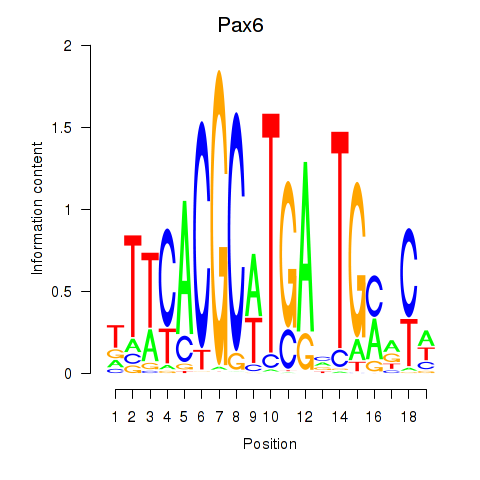
| Pax6 | 10.96 |
|
|
|
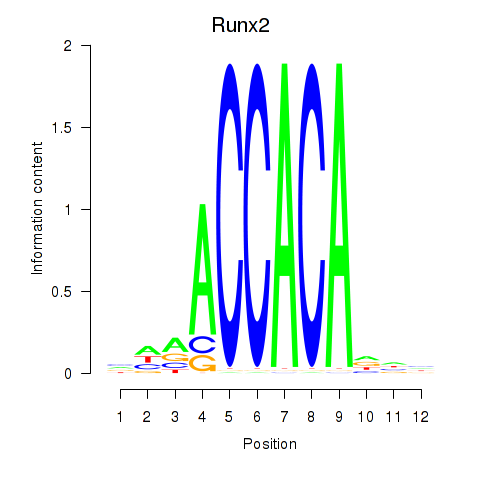
| Runx2_Bcl11a | 10.84 |
|
|
|
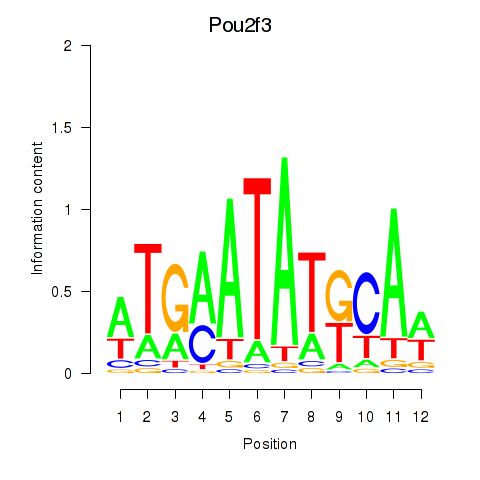
| Pou2f3 | 10.83 |
|
|
|
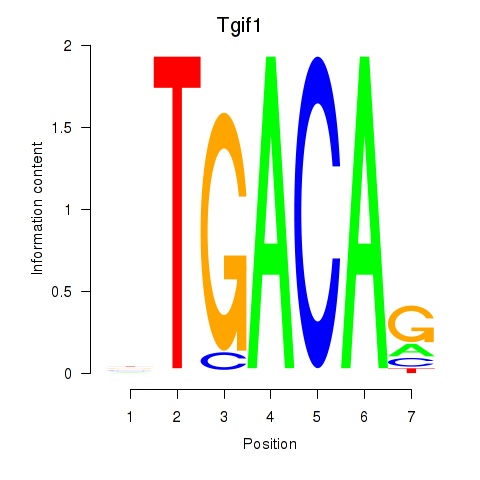
| Tgif1_Meis3 | 10.40 |
|
|
|
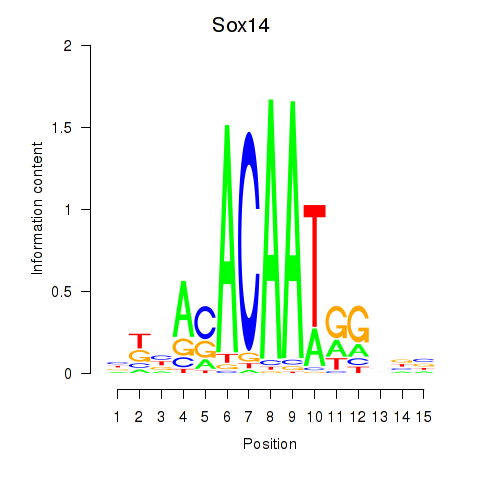
| Sox14 | 10.11 |
|
|
|
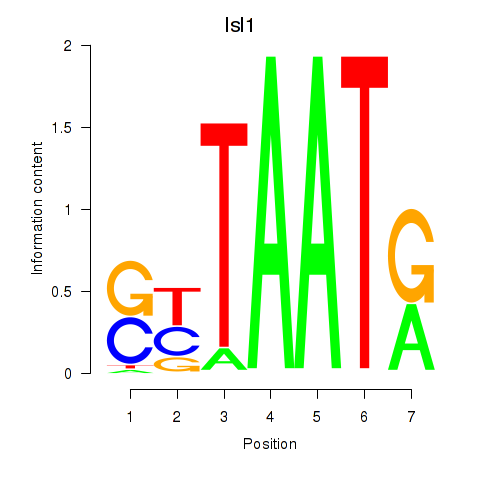
| Isl1 | 10.05 |
|
|
|
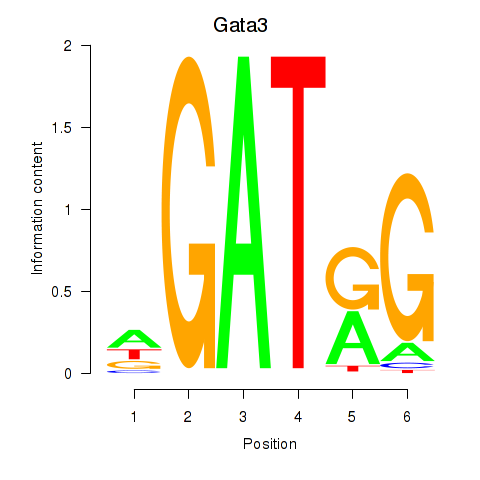
| Gata3 | 9.89 |
|
|
|
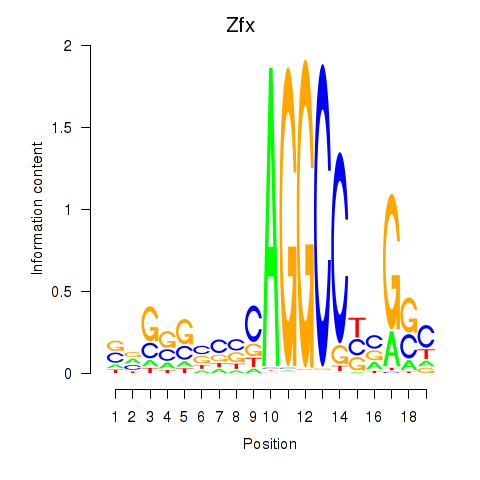
| Zfx_Zfp711 | 9.60 |
|
|
|
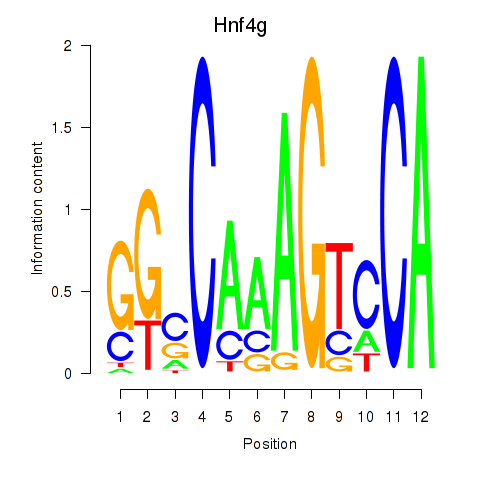
| Hnf4g | 9.33 |
|
|
|
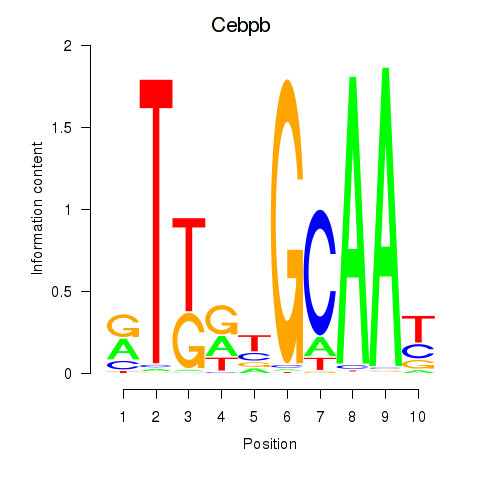
| Cebpb | 9.25 |
|
|
|
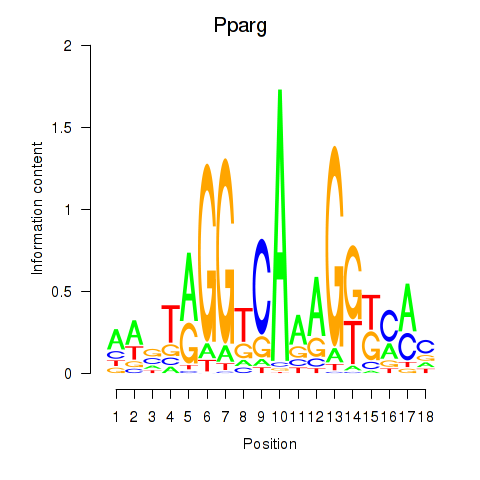
| Pparg_Rxrg | 9.16 |
|
|
|
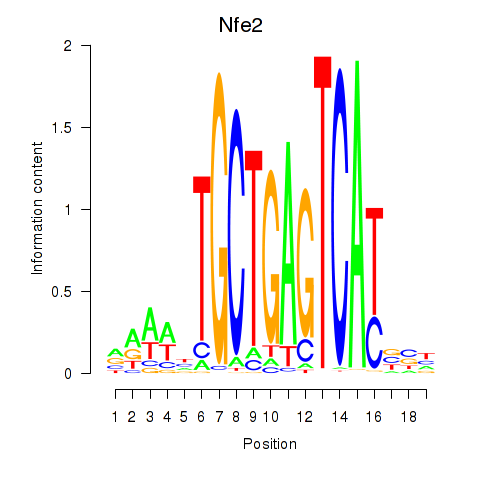
| Nfe2_Bach1_Mafk | 8.95 |
|
|
|
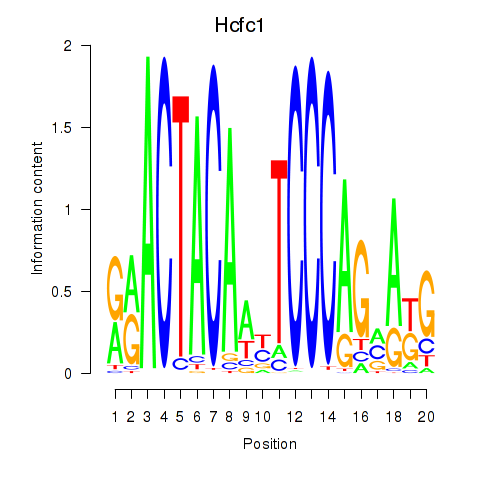
| Hcfc1_Six5_Smarcc2_Zfp143 | 8.95 |
|
|
|
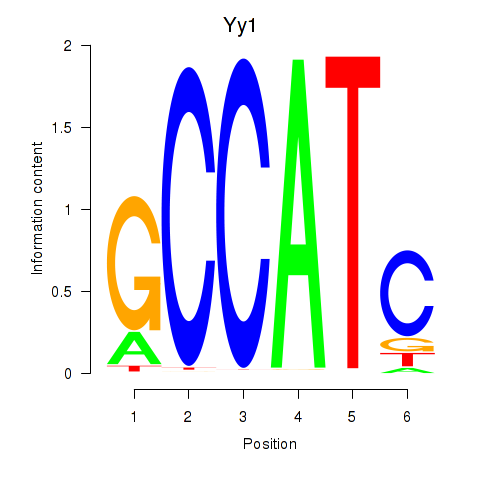
| Yy1_Yy2 | 8.93 |
|
|
|
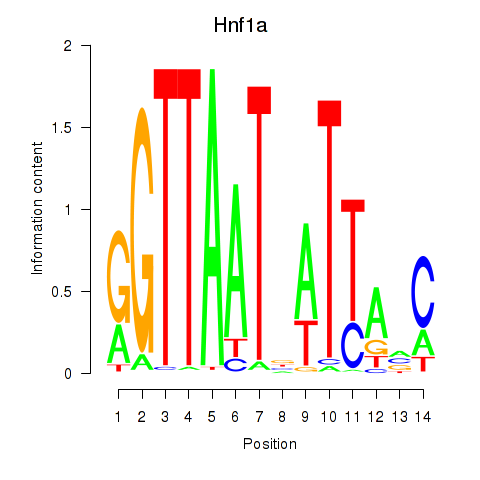
| Hnf1a | 8.89 |
|
|
|
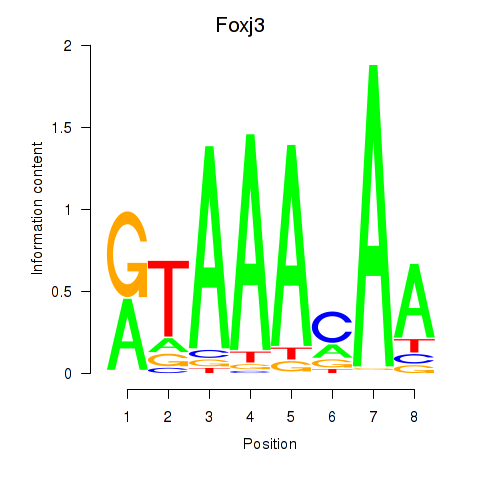
| Foxj3_Tbl1xr1 | 8.60 |
|
|
|
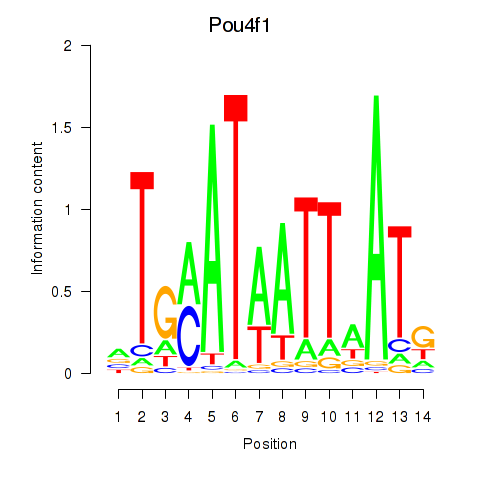
| Pou4f1_Pou6f1 | 8.56 |
|
|
|
| Wrnip1_Mta3_Rcor1 | 8.54 |
|
|
|
| Spi1 | 8.53 |
|
|
|
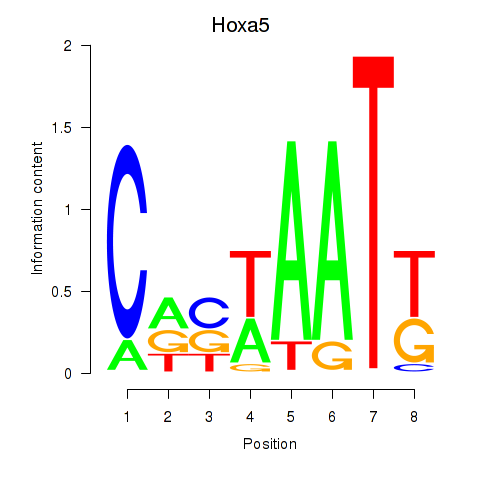
| Hoxa5 | 8.43 |
|
|
|
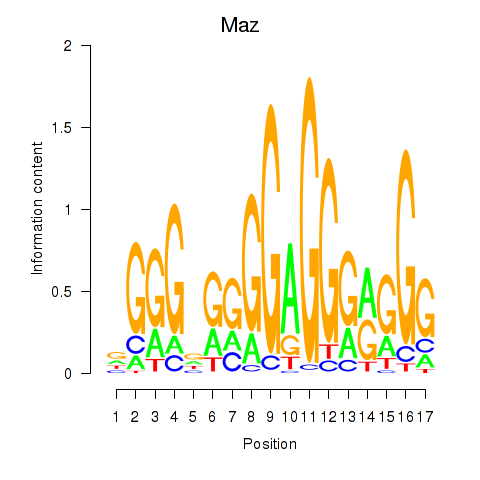
| Maz_Zfp281 | 8.34 |
|
|
|
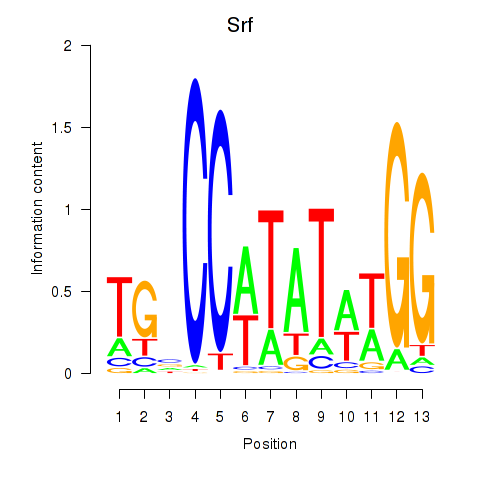
| Srf | 8.18 |
|
|
|
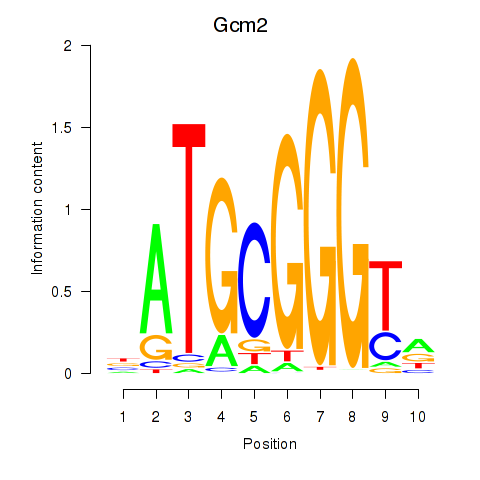
| Gcm2 | 7.97 |
|
|
|
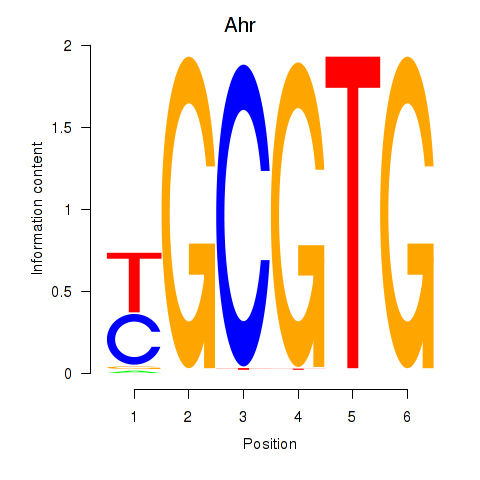
| Ahr | 7.86 |
|
|
|
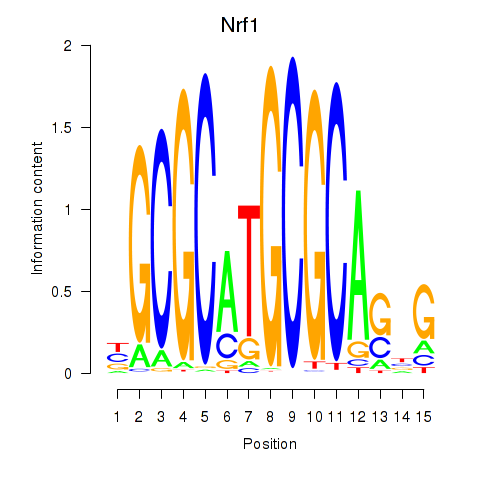
| Nrf1 | 7.85 |
|
|
|
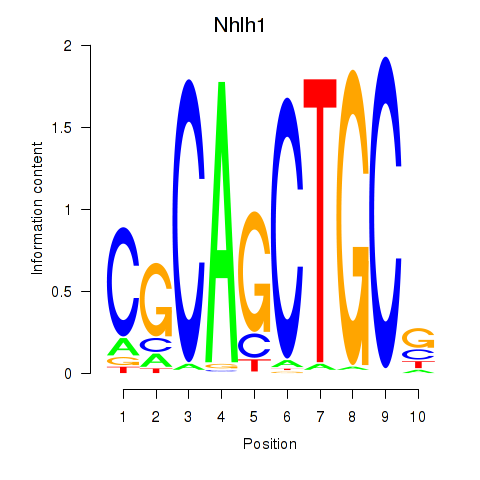
| Nhlh1 | 7.75 |
|
|
|
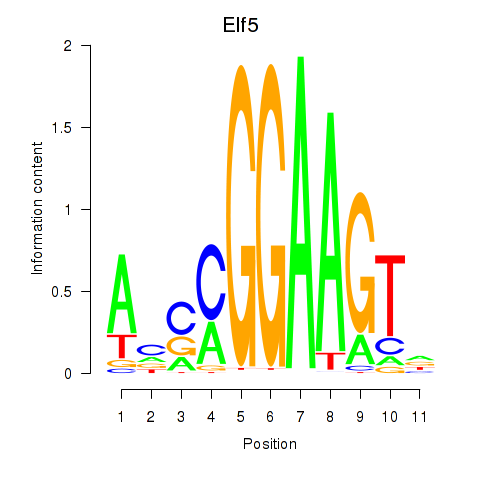
| Elf5 | 7.62 |
|
|
|
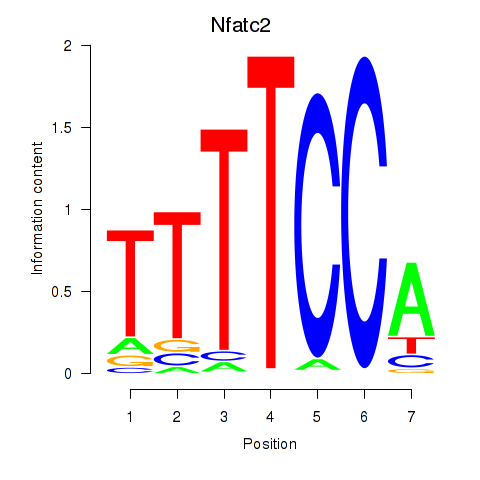
| Nfatc2 | 7.49 |
|
|
|
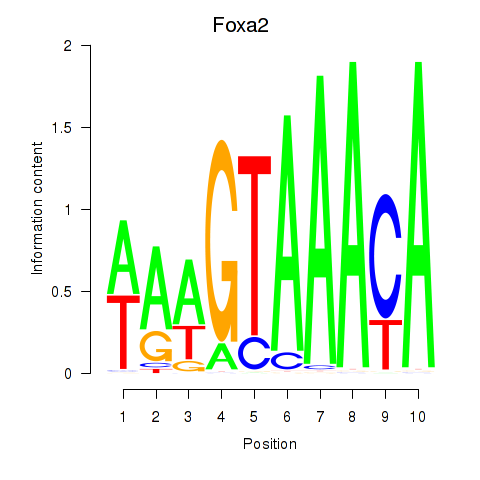
| Foxa2_Foxa1 | 7.48 |
|
|
|
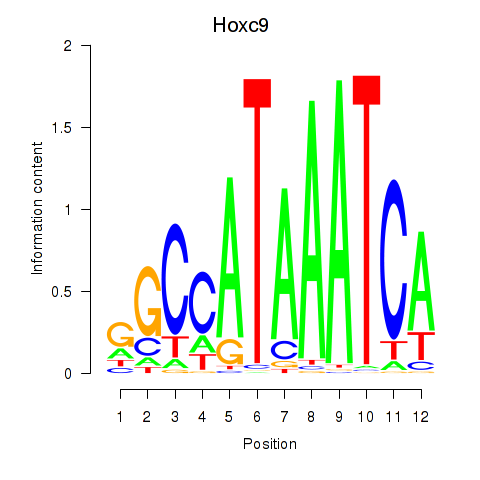
| Hoxc9 | 7.40 |
|
|
|
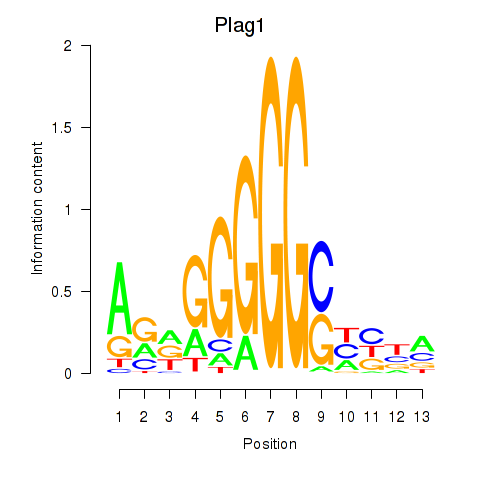
| Plag1 | 7.35 |
|
|
|
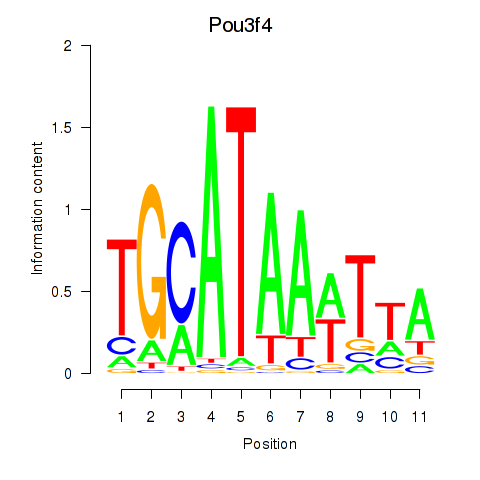
| Pou3f4 | 7.27 |
|
|
|
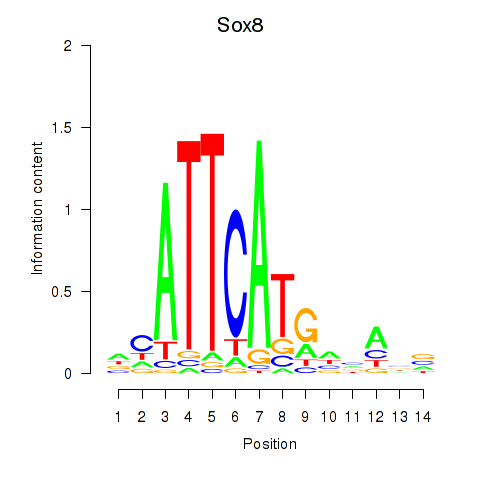
| Sox8 | 7.05 |
|
|
|
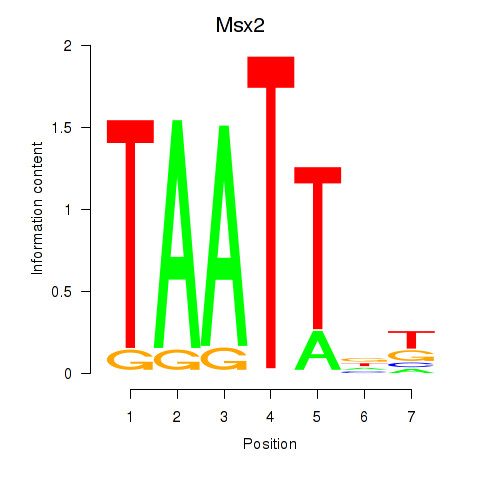
| Msx2_Hoxd4 | 7.04 |
|
|
|
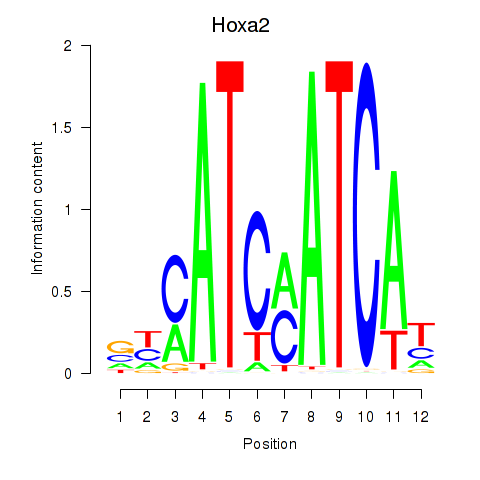
| Hoxa2 | 6.95 |
|
|
|
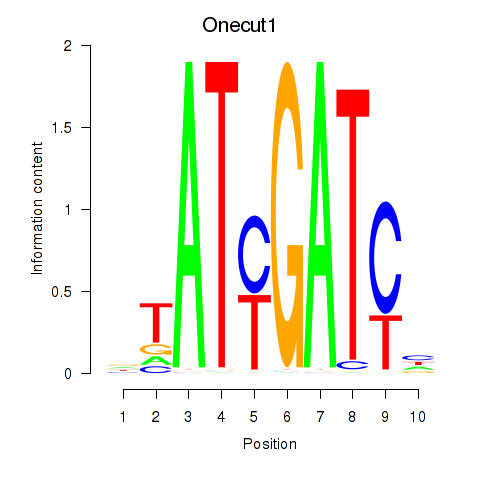
| Onecut1_Cux2 | 6.94 |
|
|
|
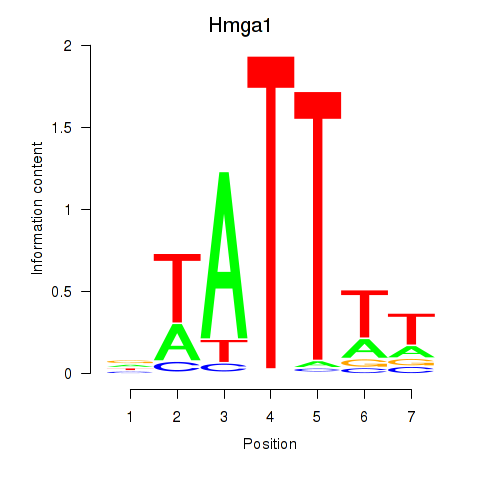
| Hmga1 | 6.83 |
|
|
|
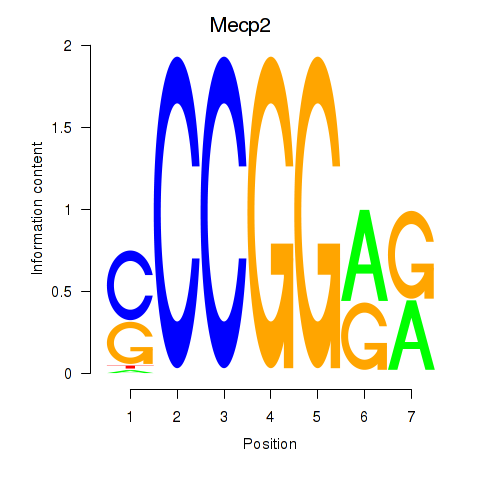
| Mecp2 | 6.75 |
|
|
|
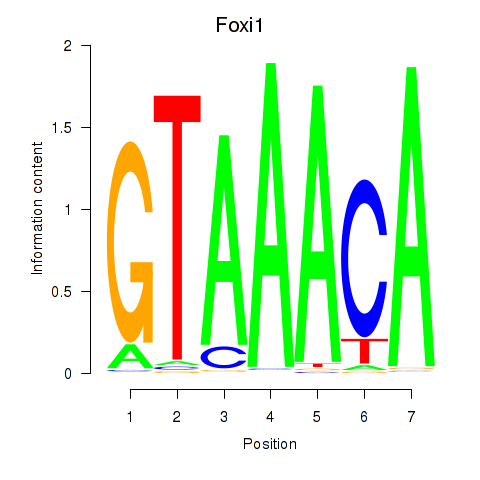
| Foxi1_Foxo1 | 6.71 |
|
|
|
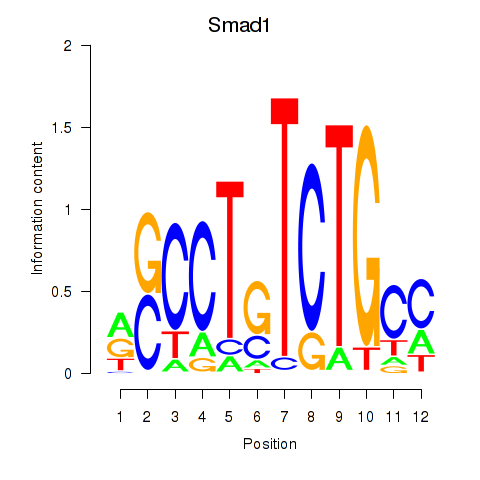
| Smad1 | 6.53 |
|
|
|
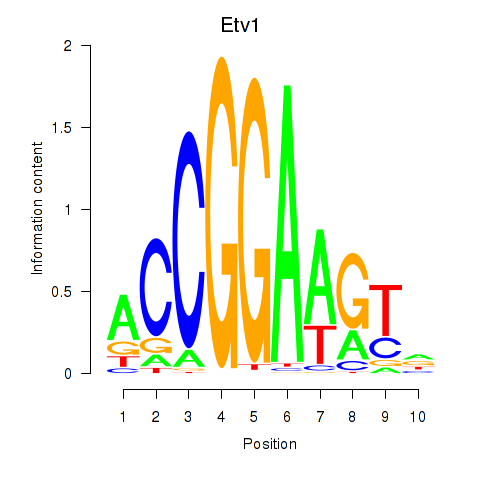
| Etv1_Etv5_Gabpa | 6.47 |
|
|
|
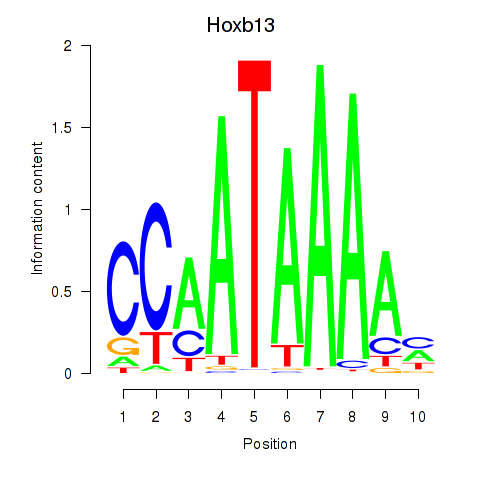
| Hoxb13 | 6.42 |
|
|
|
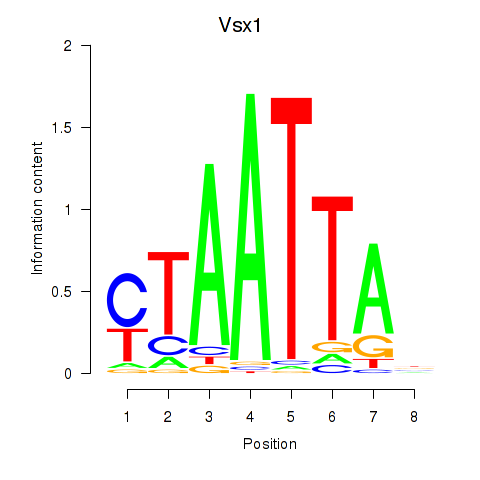
| Vsx1_Uncx_Prrx2_Shox2_Noto | 6.42 |
|
|
|
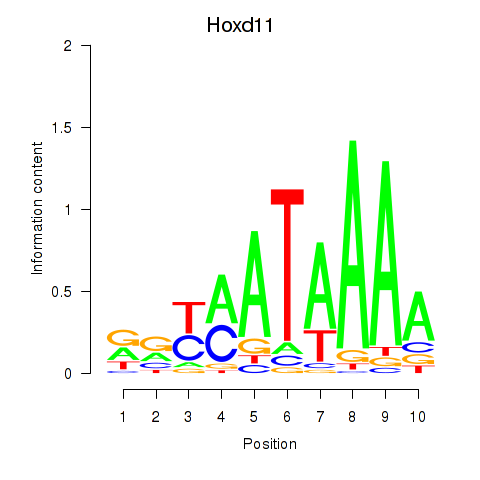
| Hoxd11_Cdx1_Hoxc11 | 6.40 |
|
|
|
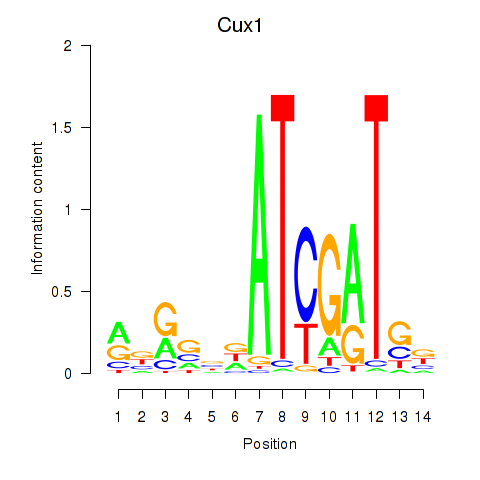
| Cux1 | 6.40 |
|
|
|
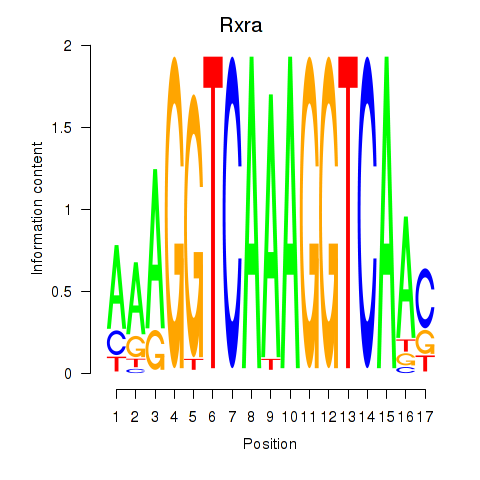
| Rxra | 6.35 |
|
|
|
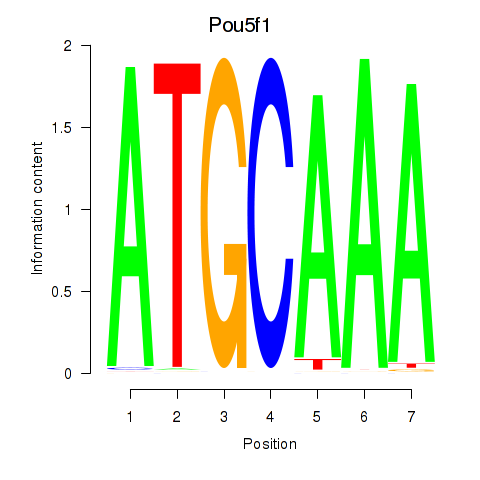
| Pou5f1 | 6.16 |
|
|
|
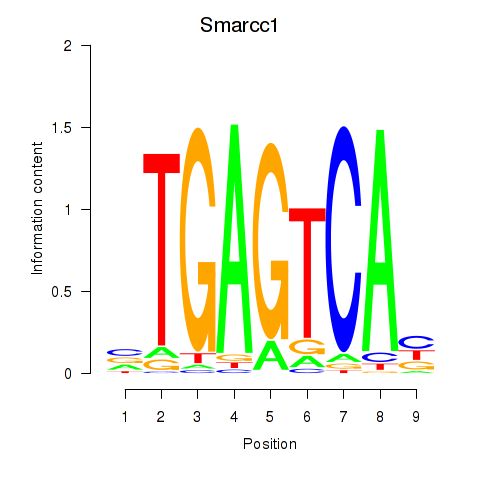
| Smarcc1_Fosl1 | 6.13 |
|
|
|
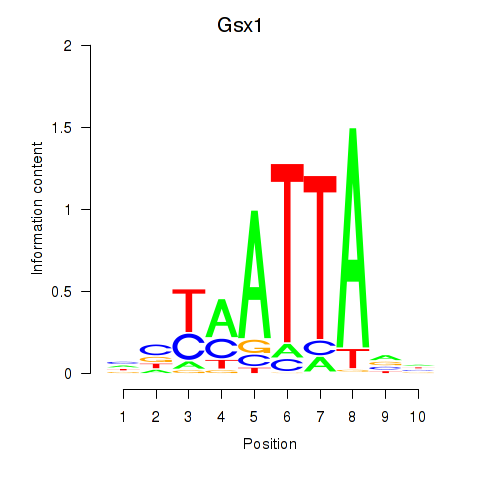
| Gsx1_Alx1_Mixl1_Lbx2 | 6.13 |
|
|
|
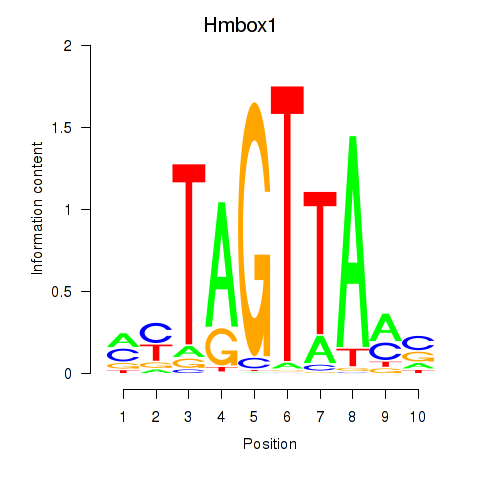
| Hmbox1 | 6.12 |
|
|
|
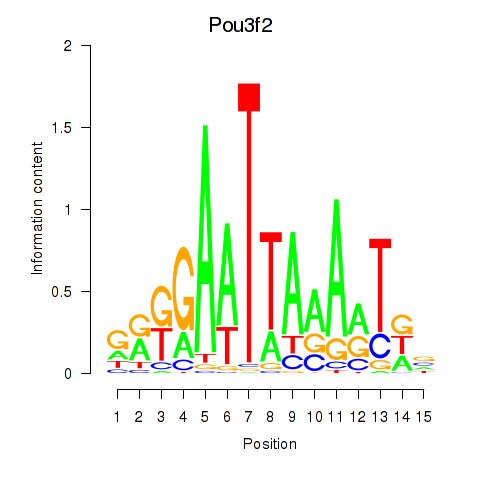
| Pou3f2 | 6.06 |
|
|
|
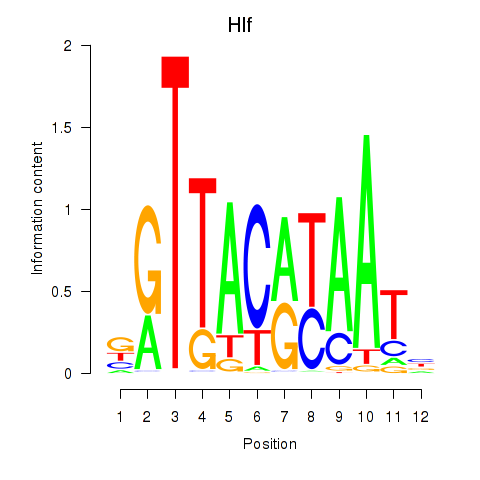
| Hlf | 6.02 |
|
|
|
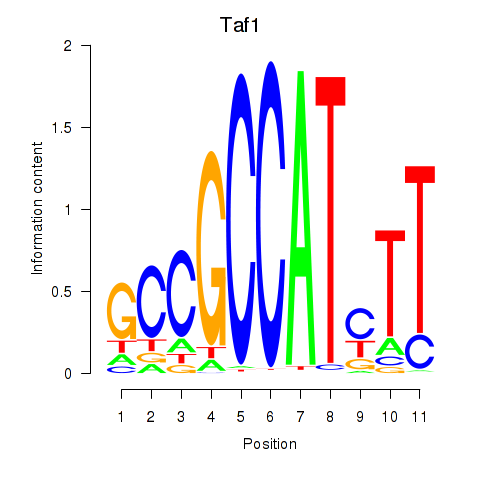
| Taf1 | 6.00 |
|
|
|
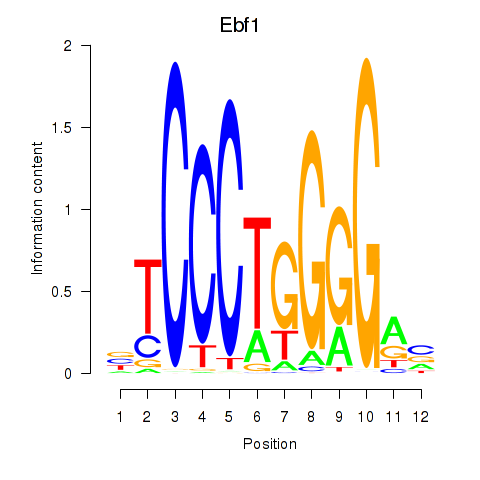
| Ebf1 | 5.97 |
|
|
|
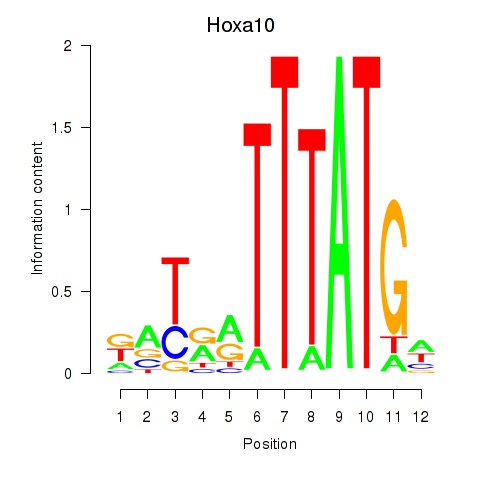
| Hoxa10 | 5.94 |
|
|
|
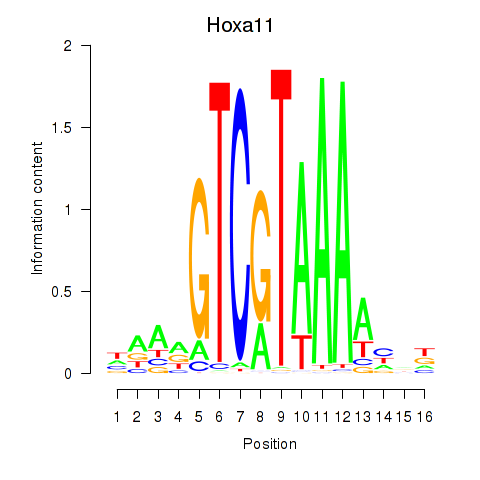
| Hoxa11_Hoxc12 | 5.86 |
|
|
|
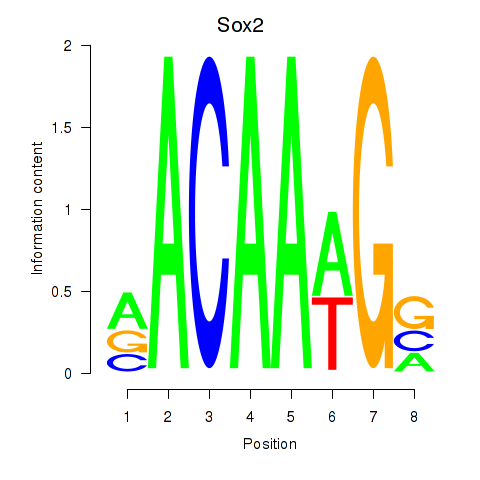
| Sox2 | 5.84 |
|
|
|
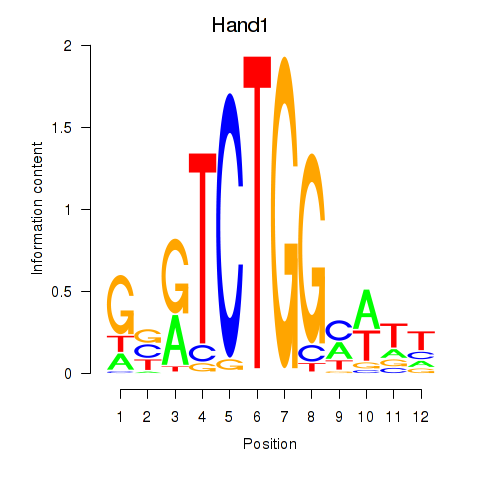
| Hand1 | 5.84 |
|
|
|
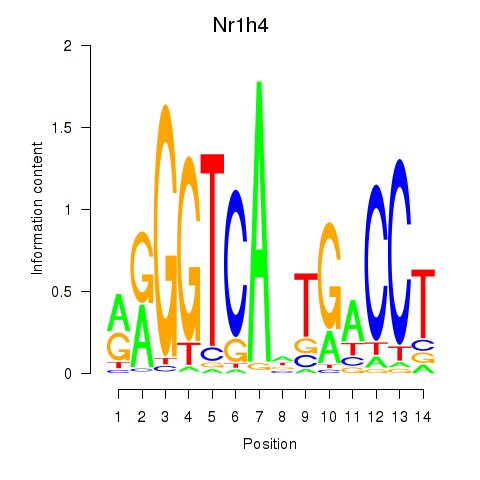
| Nr1h4 | 5.70 |
|
|
|
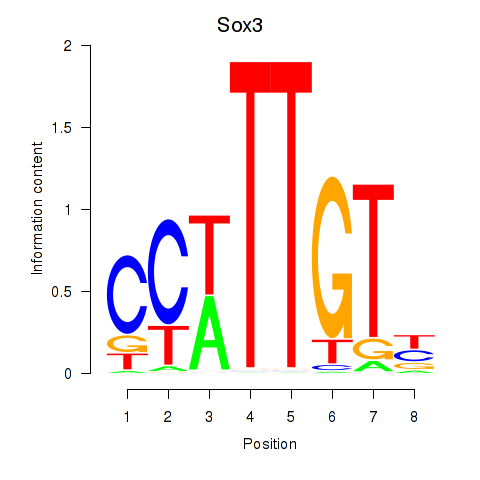
| Sox3_Sox10 | 5.68 |
|
|
|
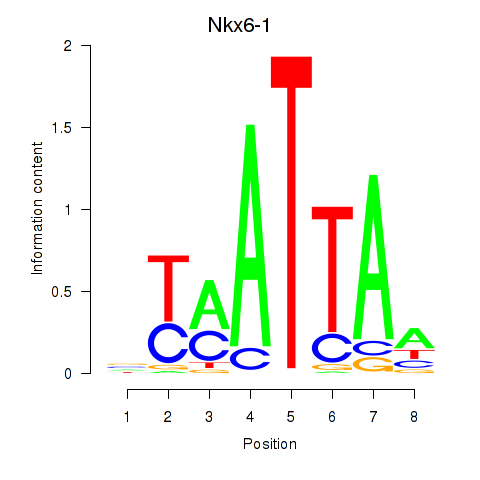
| Nkx6-1_Evx1_Hesx1 | 5.66 |
|
|
|
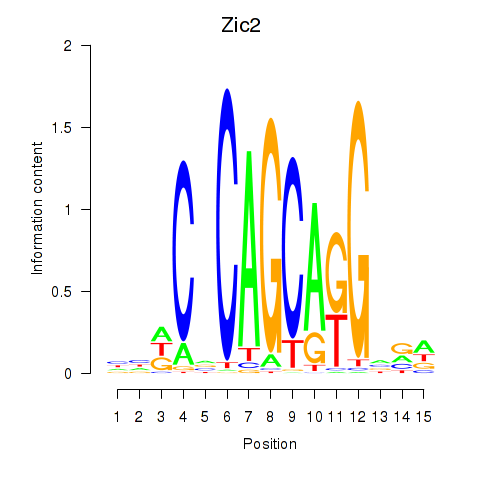
| Zic2 | 5.65 |
|
|
|
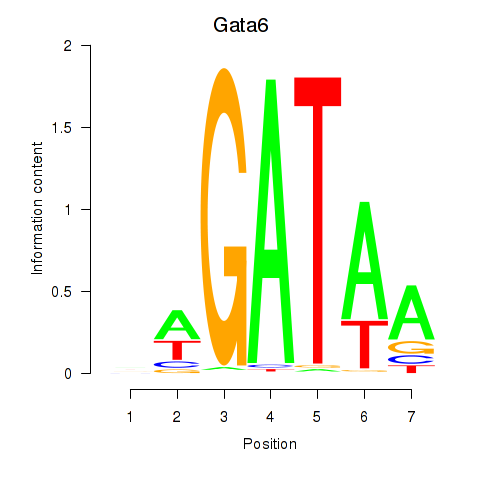
| Gata6 | 5.62 |
|
|
|
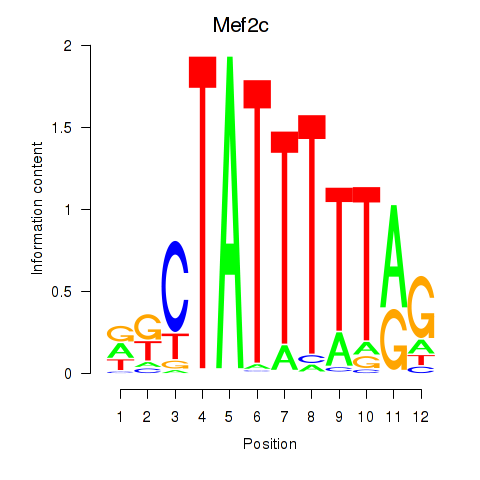
| Mef2c | 5.62 |
|
|
|
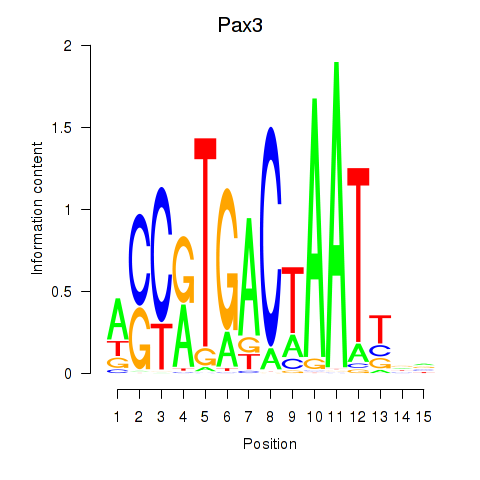
| Pax3 | 5.60 |
|
|
|
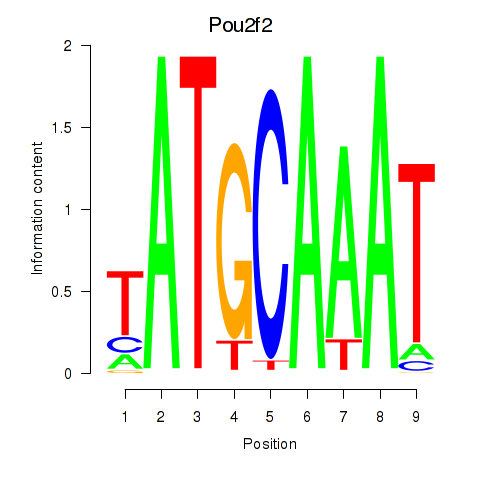
| Pou2f2_Pou3f1 | 5.58 |
|
|
|
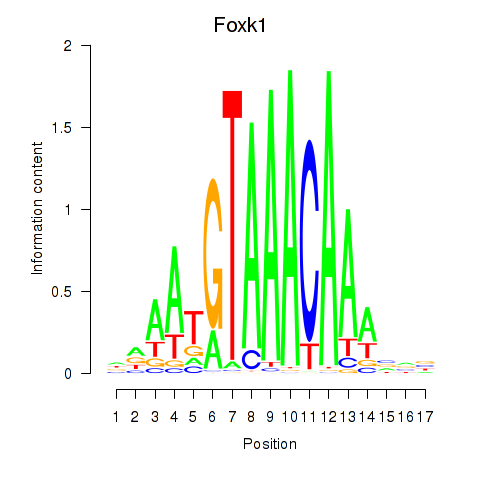
| Foxk1_Foxj1 | 5.56 |
|
|
|
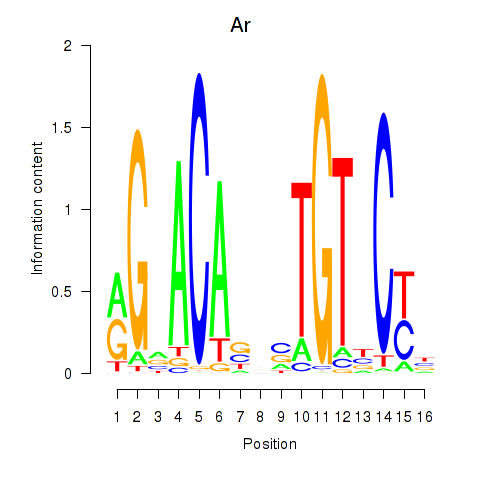
| Ar | 5.55 |
|
|
|
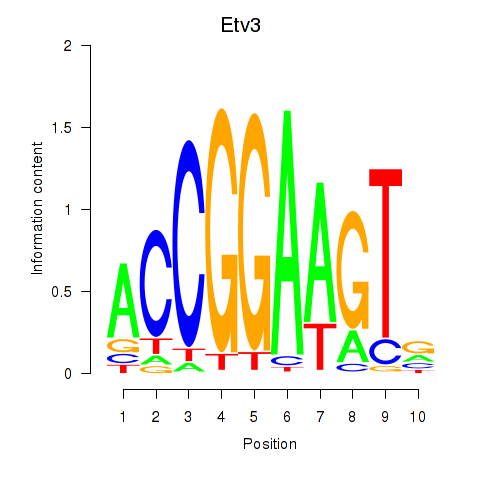
| Etv3_Erf_Fev_Elk4_Elk1_Elk3 | 5.55 |
|
|
|
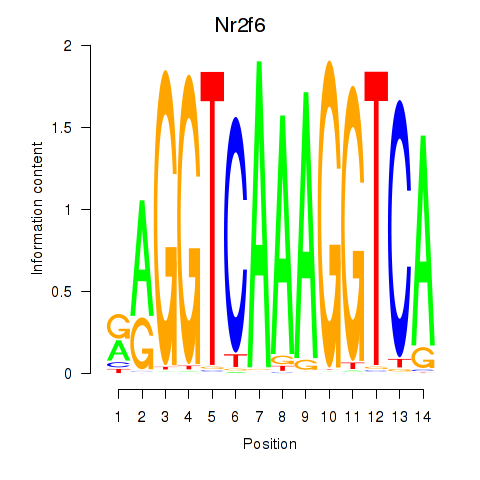
| Nr2f6 | 5.49 |
|
|
|
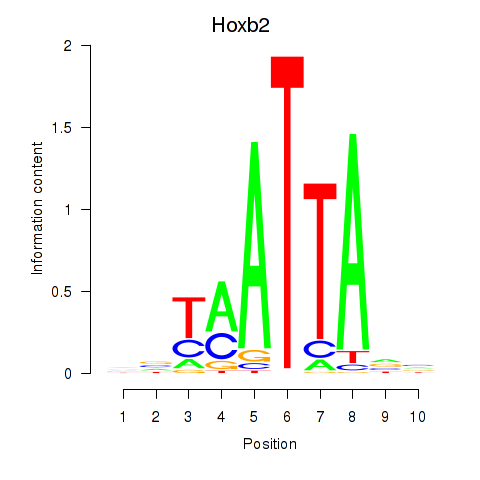
| Hoxb2_Dlx2 | 5.48 |
|
|
|
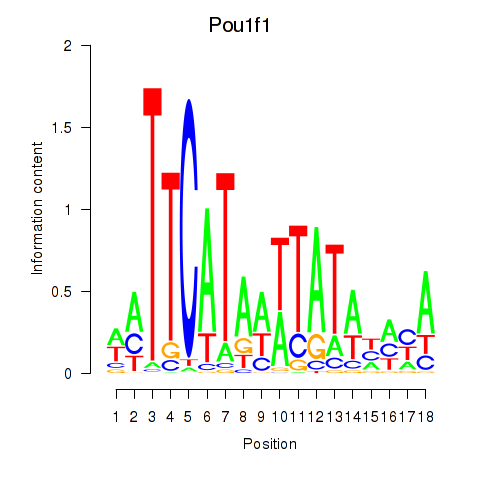
| Pou1f1 | 5.46 |
|
|
|
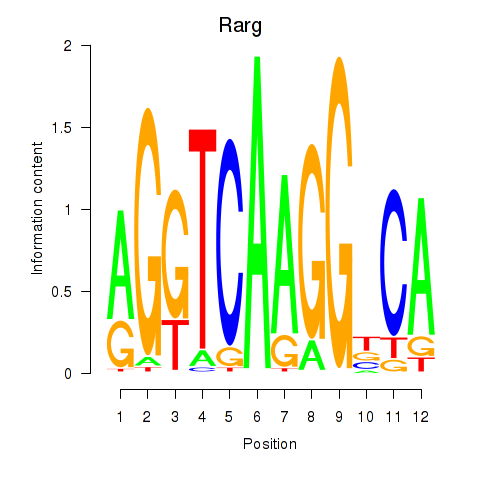
| Rarg | 5.45 |
|
|
|
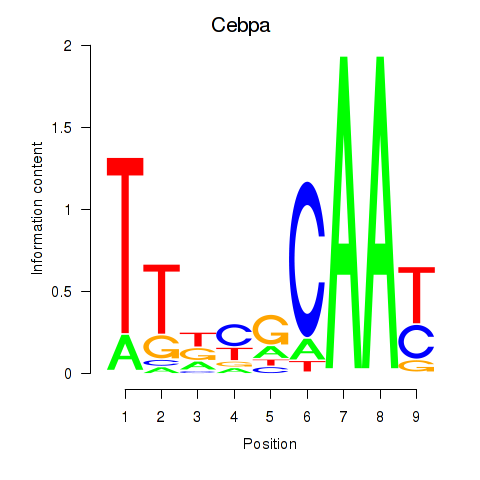
| Cebpa_Cebpg | 5.41 |
|
|
|
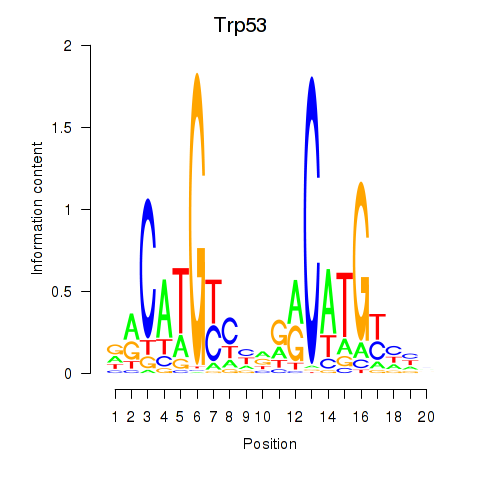
| Trp53 | 5.41 |
|
|
|
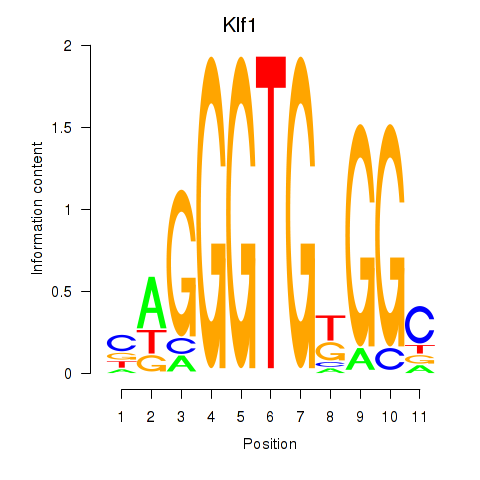
| Klf1 | 5.38 |
|
|
|
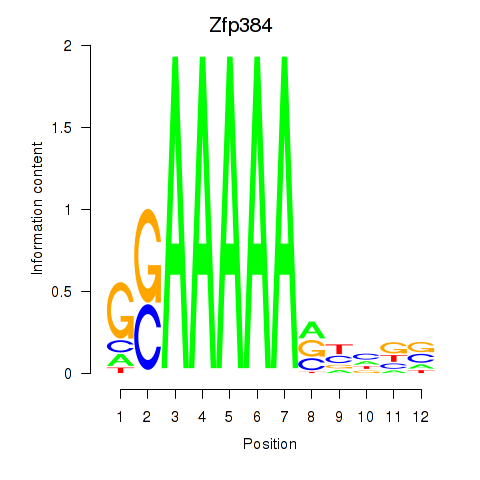
| Zfp384 | 5.32 |
|
|
|
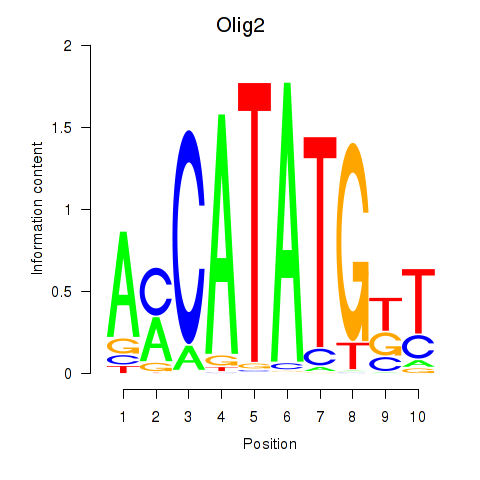
| Olig2_Olig3 | 5.29 |
|
|
|
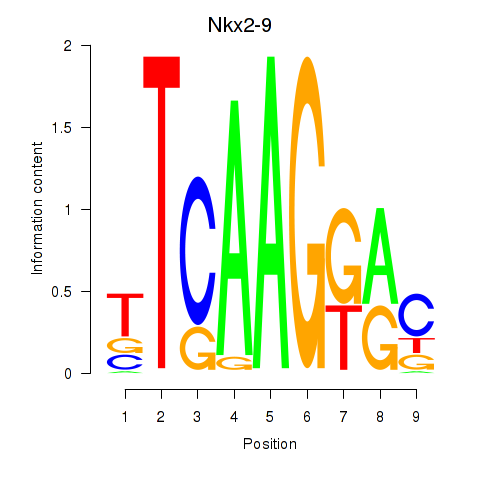
| Nkx2-9 | 5.25 |
|
|
|
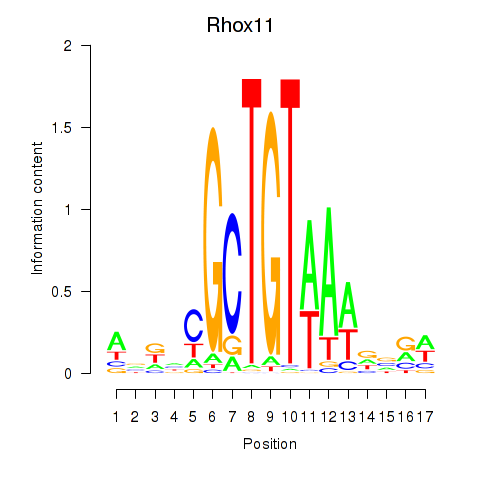
| Rhox11 | 5.21 |
|
|
|
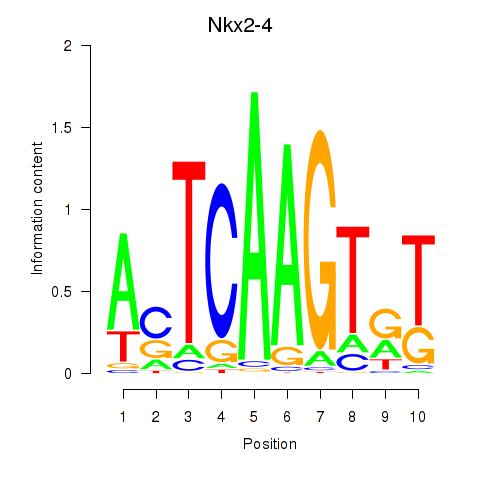
| Nkx2-4 | 5.11 |
|
|
|
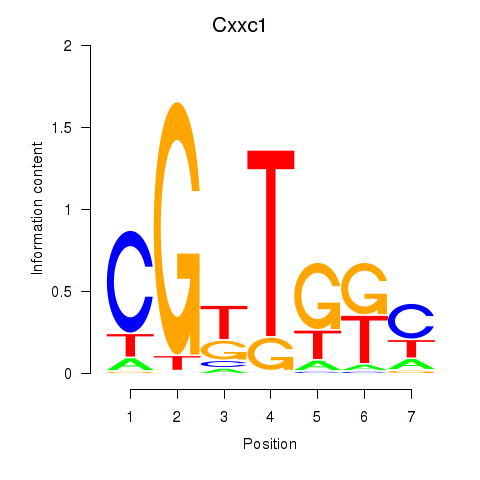
| Cxxc1 | 5.02 |
|
|
|
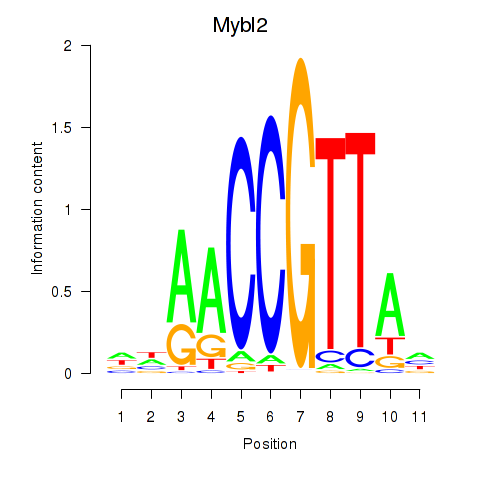
| Mybl2 | 5.00 |
|
|
|
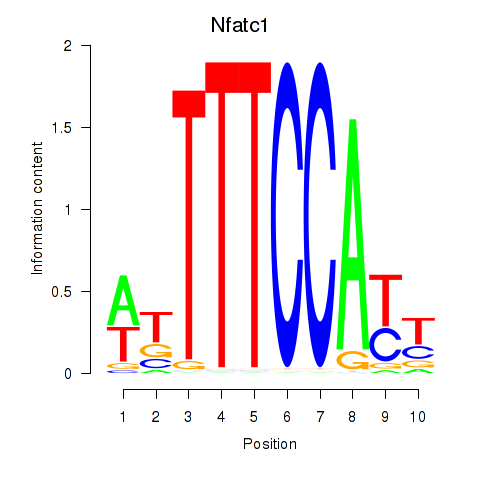
| Nfatc1 | 4.97 |
|
|
|
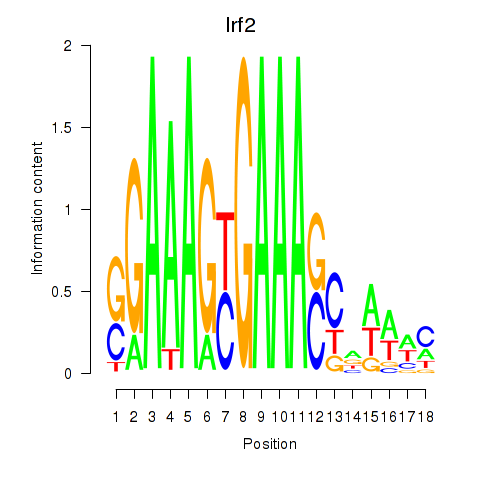
| Irf2_Irf1_Irf8_Irf9_Irf7 | 4.96 |
|
|
|
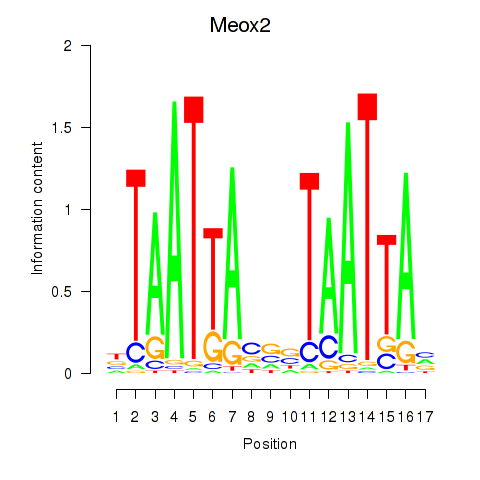
| Meox2 | 4.94 |
|
|
|
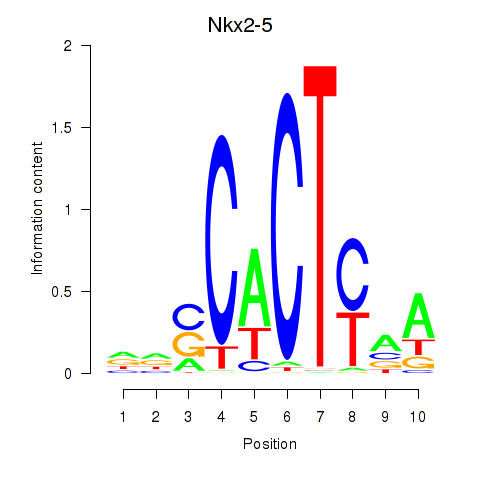
| Nkx2-5 | 4.90 |
|
|
|
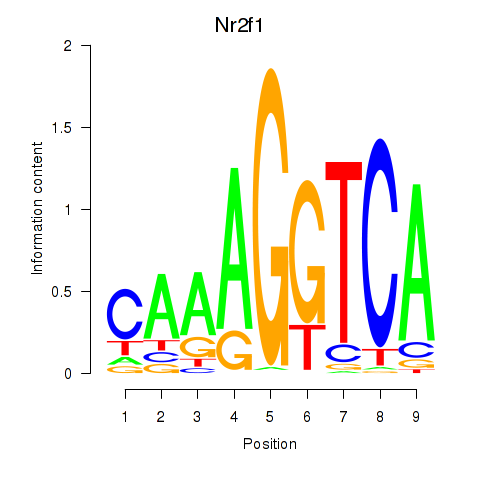
| Nr2f1_Nr4a1 | 4.87 |
|
|
|
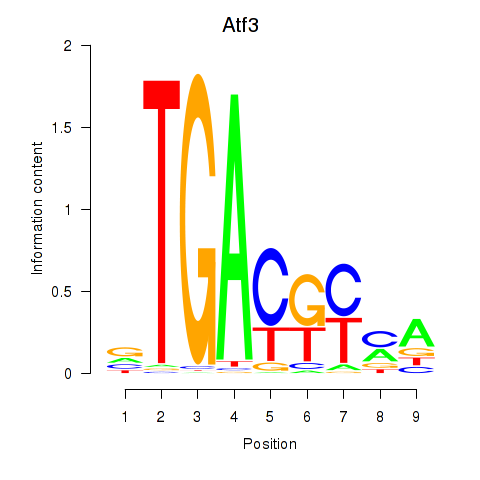
| Atf3 | 4.87 |
|

|
|
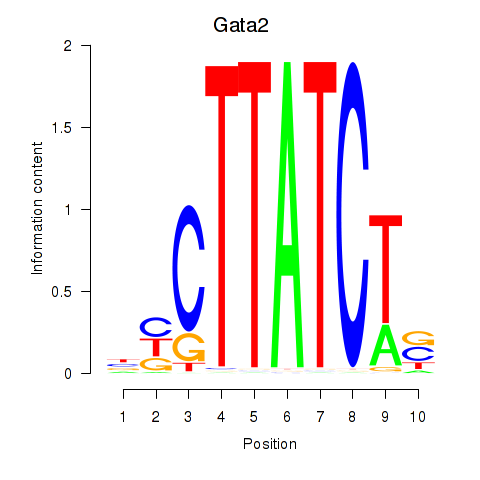
| Gata2_Gata1 | 4.86 |
|
|
|
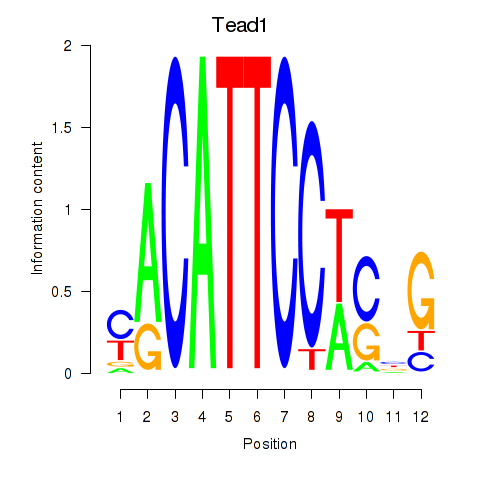
| Tead1 | 4.82 |
|
|
|
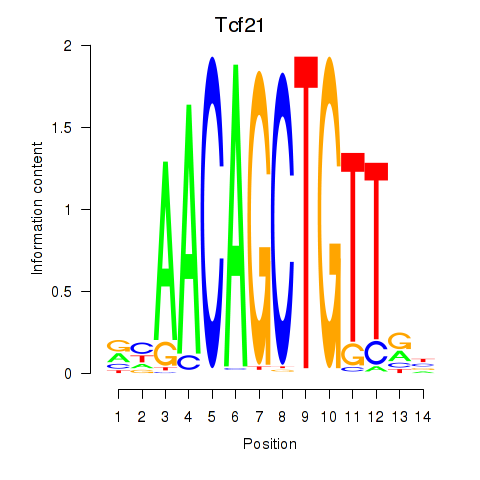
| Tcf21_Msc | 4.81 |
|
|
|
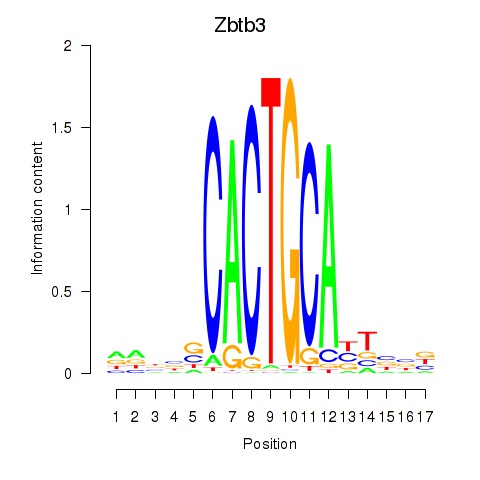
| Zbtb3 | 4.80 |
|
|
|
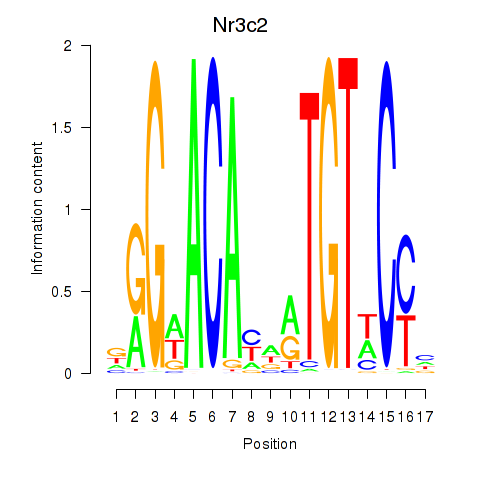
| Nr3c2 | 4.74 |
|
|
|
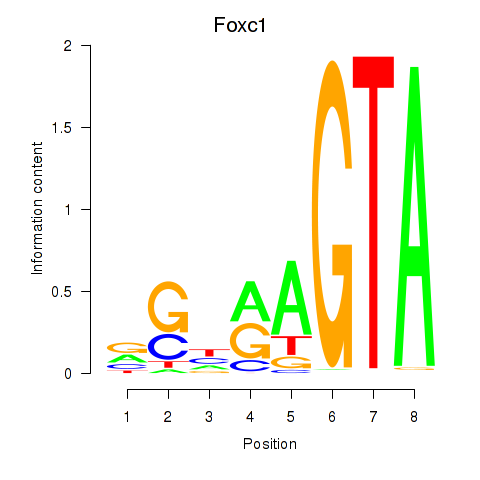
| Foxc1 | 4.73 |
|
|
|
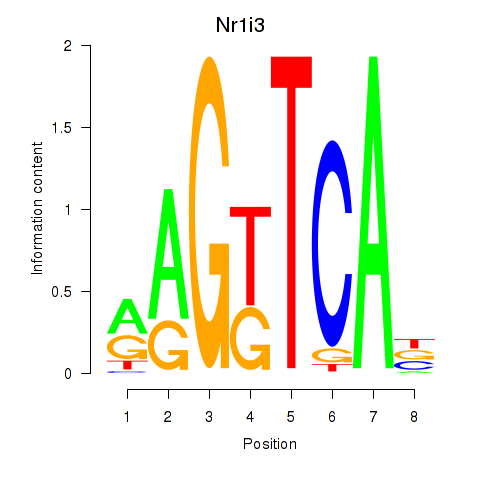
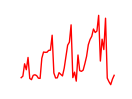
| Nr1i3 | 4.71 |
|
|
|
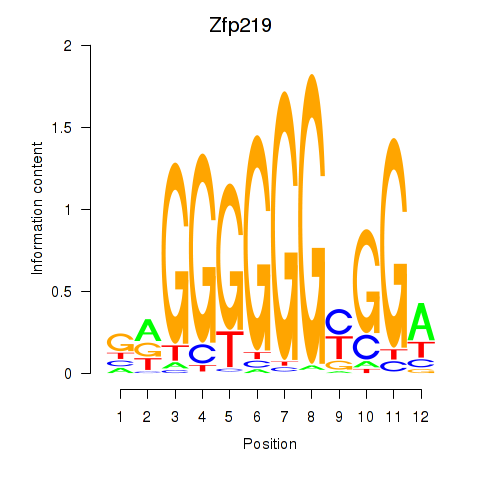
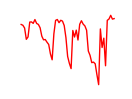
| Zfp219_Zfp740 | 4.70 |
|
|
|
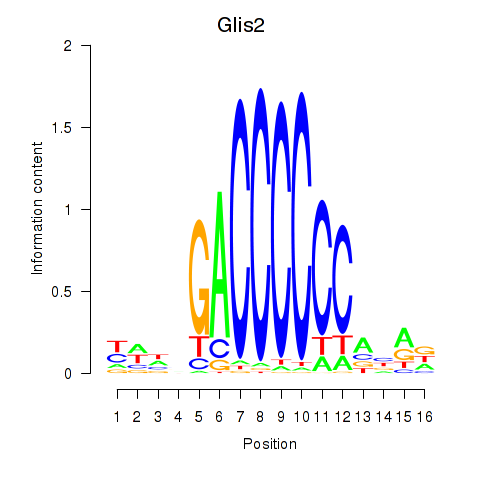
| Glis2 | 4.69 |
|
|
|
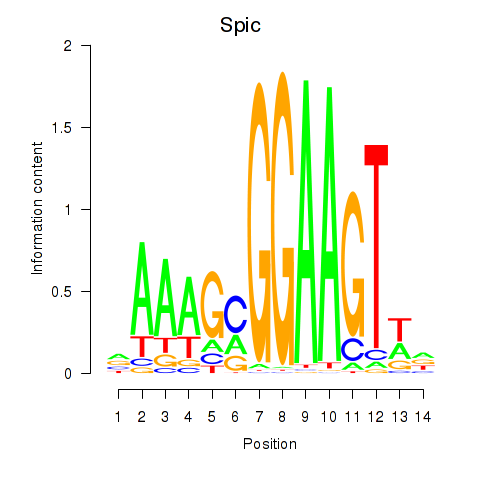
| Spic | 4.68 |
|
|
|
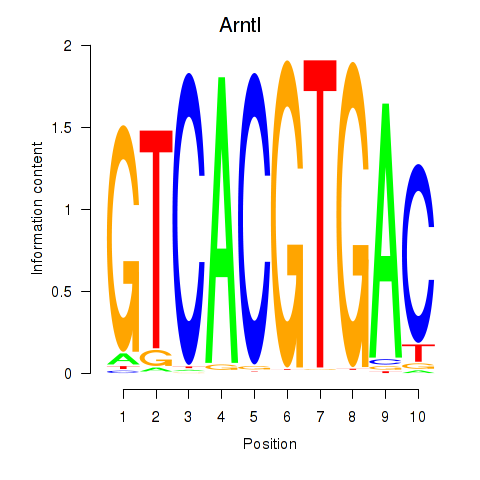
| Arntl_Tfe3_Mlx_Mitf_Mlxipl_Tfec | 4.62 |
|
|
|
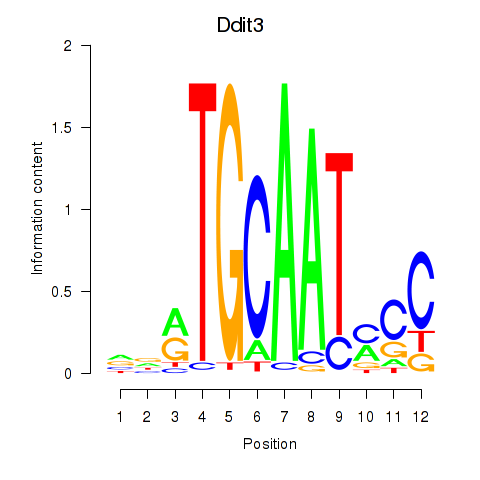
| Ddit3 | 4.60 |
|
|
|
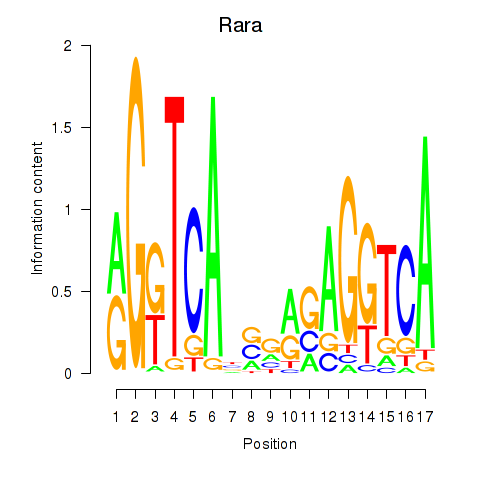
| Rara | 4.53 |
|
|
|
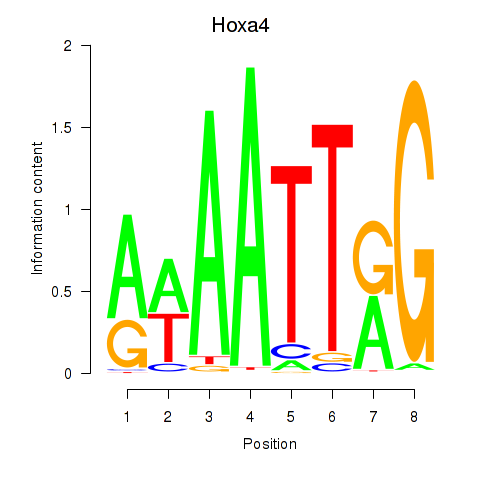
| Hoxa4 | 4.53 |
|
|
|
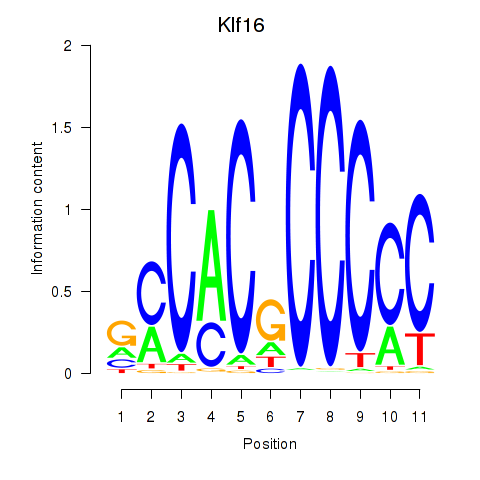
| Klf16_Sp8 | 4.51 |
|
|
|
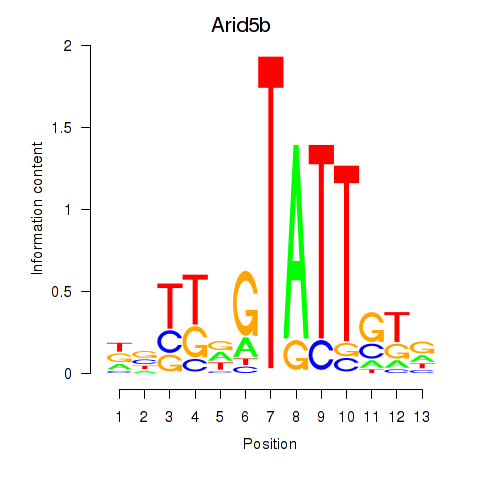
| Arid5b | 4.49 |
|
|
|
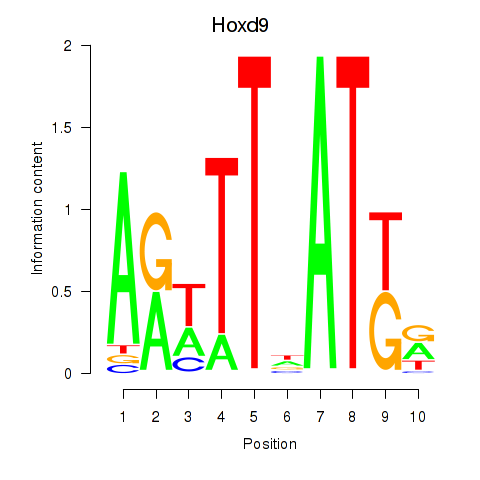
| Hoxd9 | 4.49 |
|
|
|
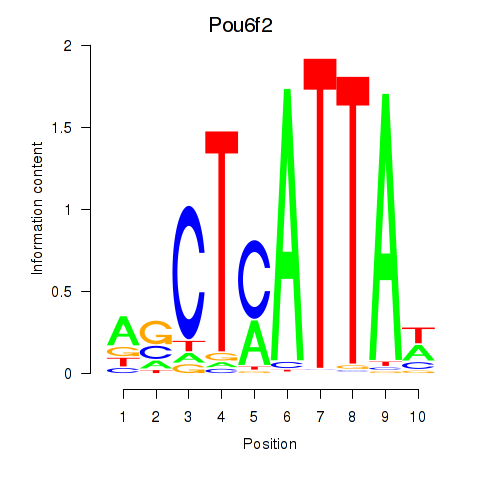
| Pou6f2_Pou4f2 | 4.48 |
|
|
|
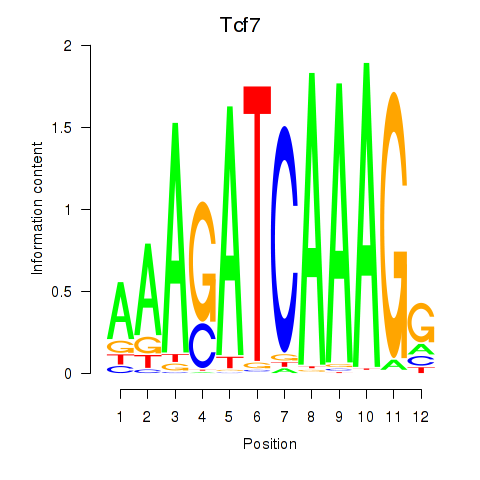
| Tcf7_Tcf7l2 | 4.48 |
|
|
|
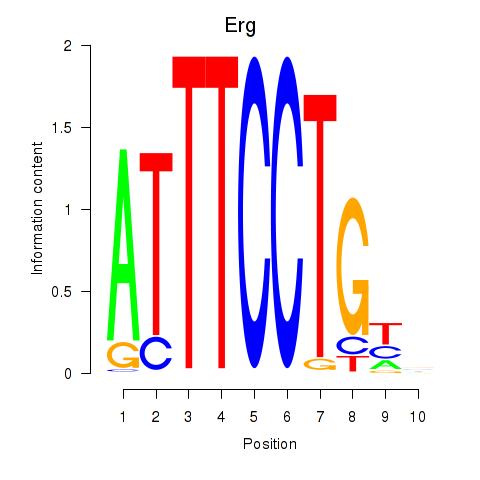
| Erg | 4.41 |
|
|
|
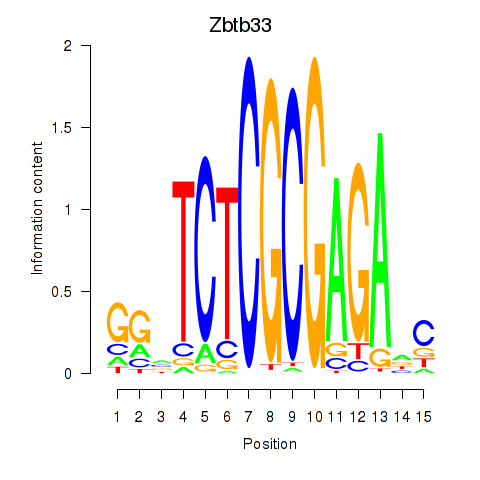
| Zbtb33_Chd2 | 4.41 |
|
|
|
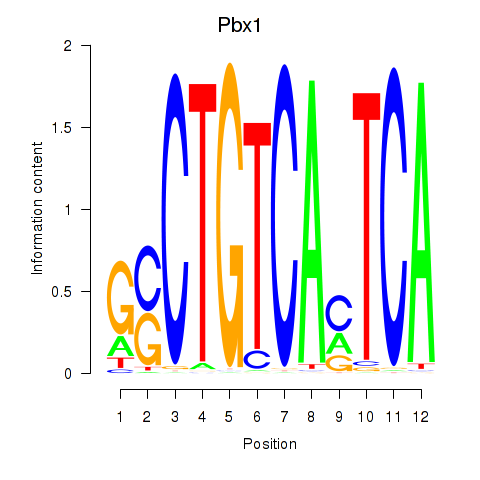
| Pbx1_Pbx3 | 4.32 |
|
|
|
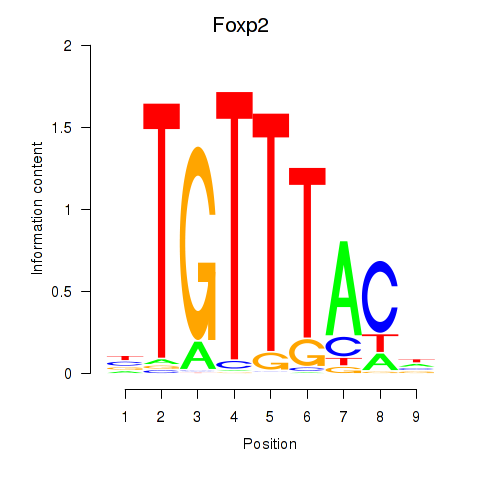
| Foxp2_Foxp3 | 4.32 |
|
|
|
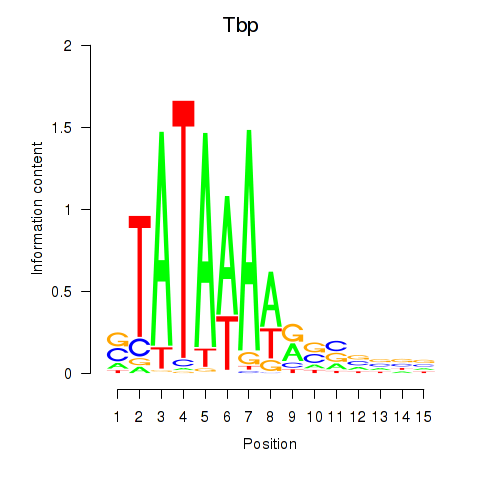
| Tbp | 4.28 |
|
|
|
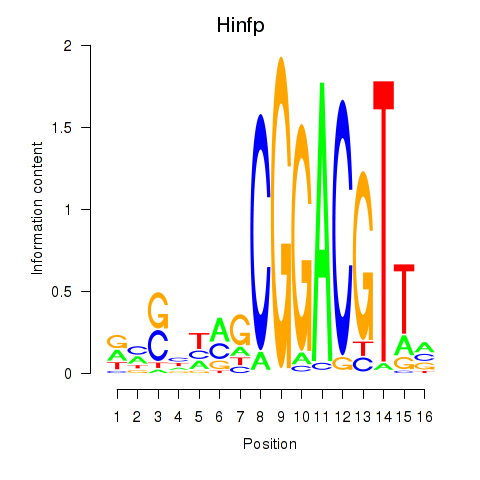
| Hinfp | 4.27 |
|
|
|
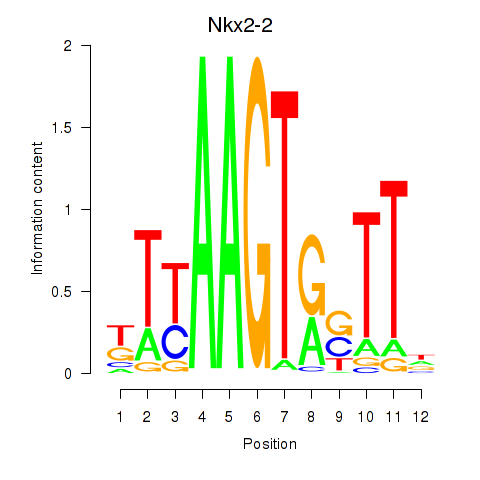
| Nkx2-2 | 4.25 |
|
|
|
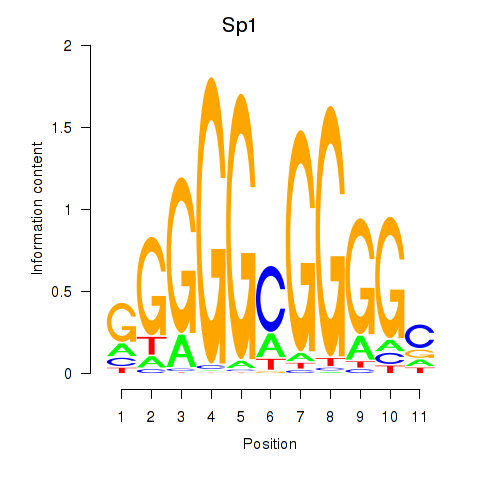
| Sp1 | 4.24 |
|
|
|
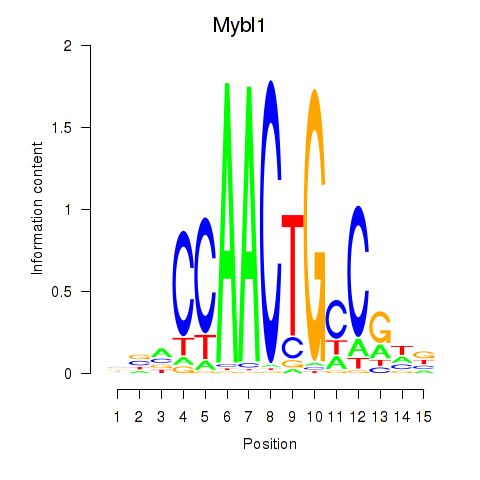
| Mybl1 | 4.22 |
|
|
|
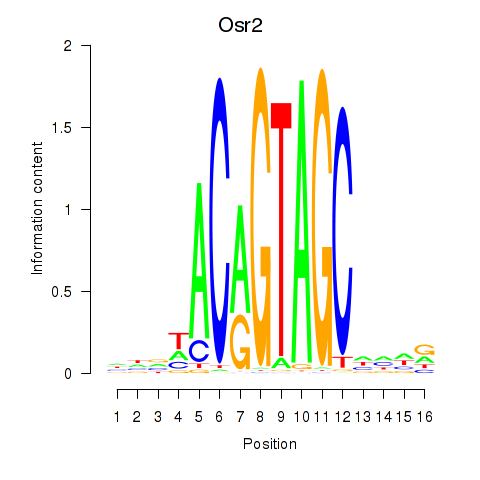
| Osr2_Osr1 | 4.21 |
|
|
|
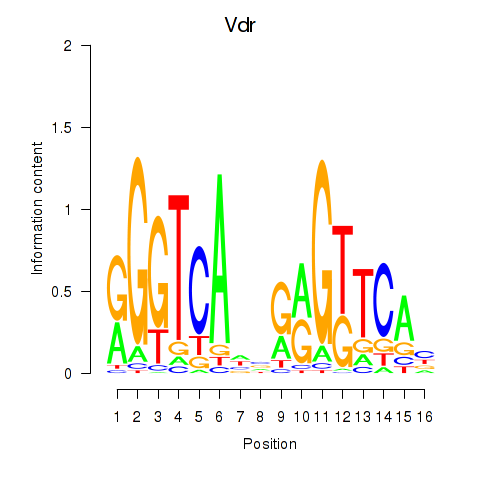
| Vdr | 4.19 |
|
|
|
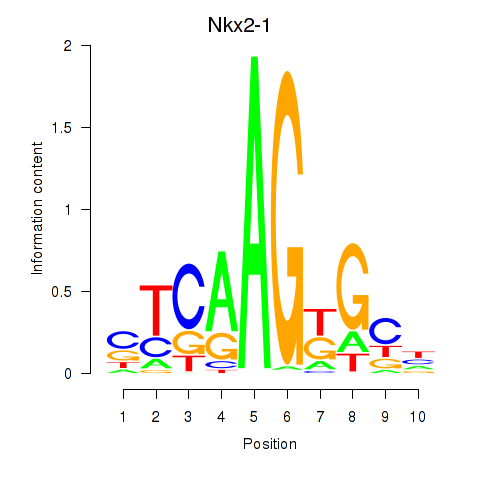
| Nkx2-1 | 4.15 |
|
|
|
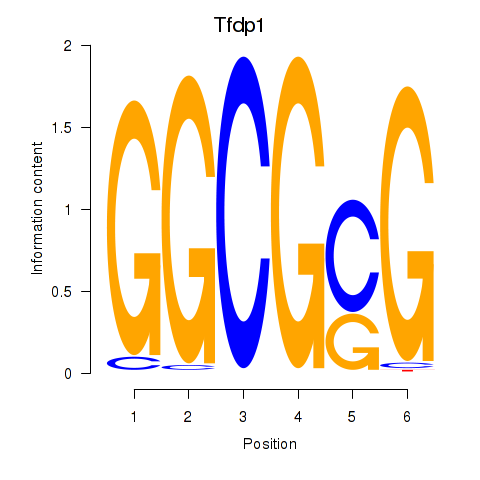
| Tfdp1_Wt1_Egr2 | 4.10 |
|
|
|
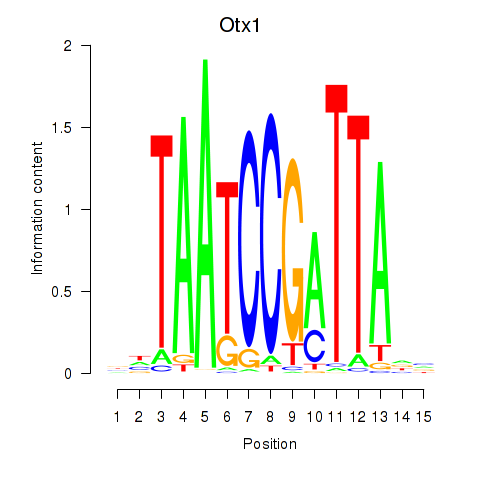
| Otx1 | 4.10 |
|
|
|
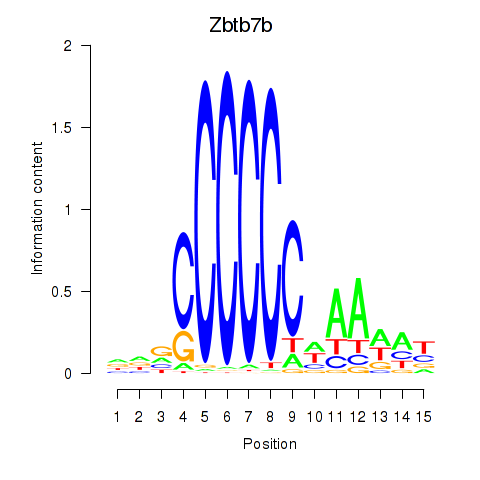
| Zbtb7b | 3.97 |
|
|
|
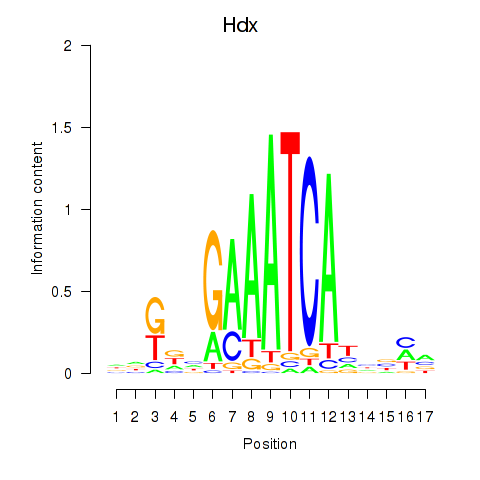
| Hdx | 3.94 |
|
|
|
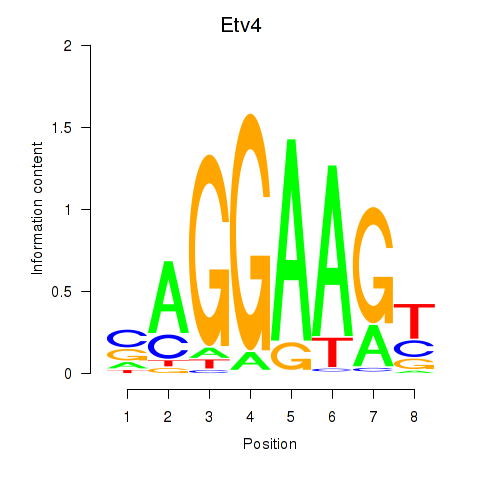
| Etv4 | 3.91 |
|
|
|
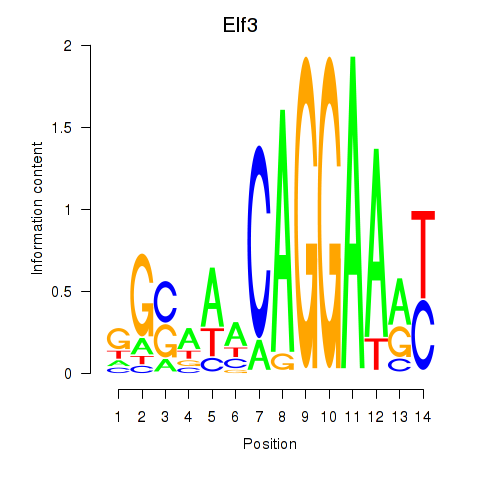
| Elf3 | 3.88 |
|
|
|
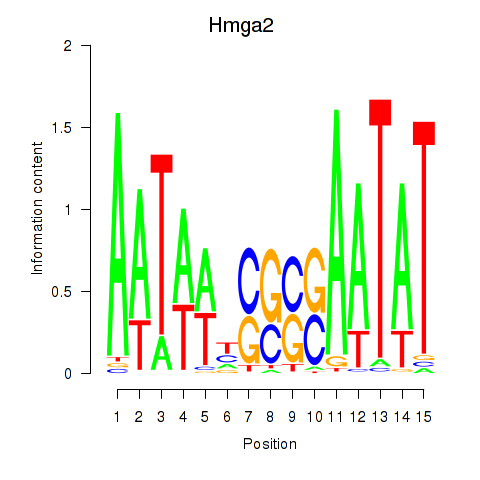
| Hmga2 | 3.85 |
|
|
|
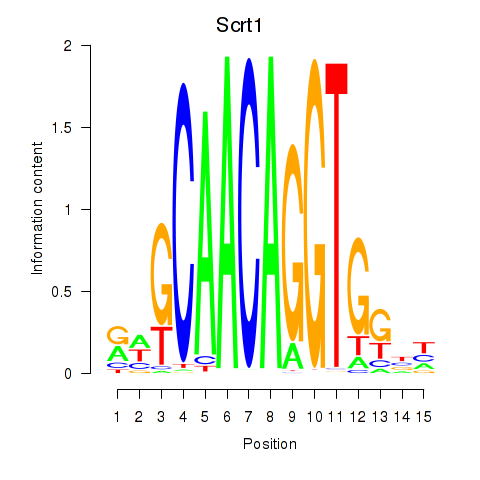
| Scrt1 | 3.81 |
|
|
|
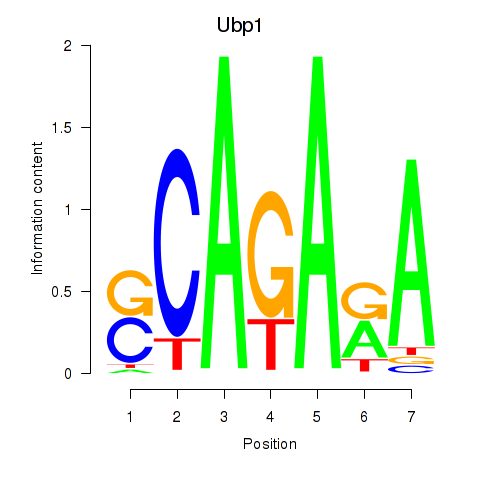
| Ubp1 | 3.79 |
|
|
|
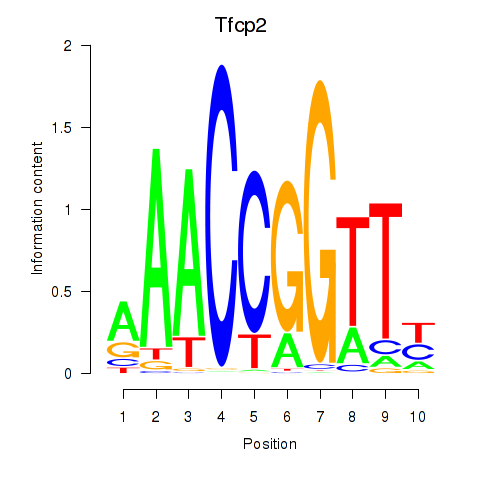
| Tfcp2 | 3.78 |
|
|
|
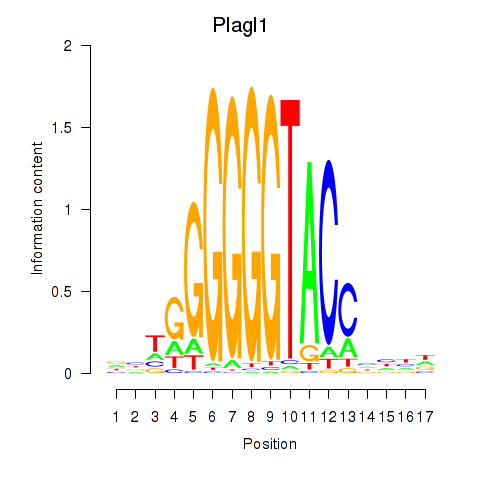
| Plagl1 | 3.75 |
|
|
|
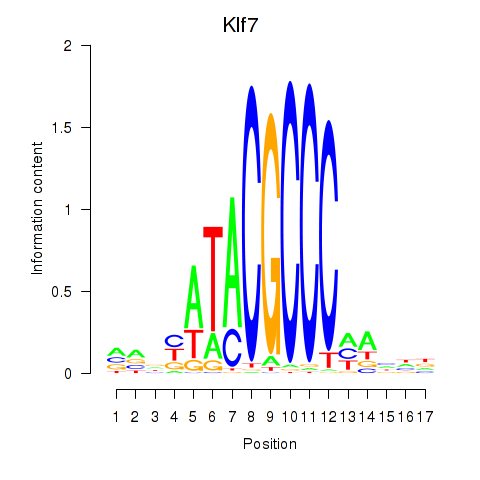
| Klf7 | 3.75 |
|
|
|
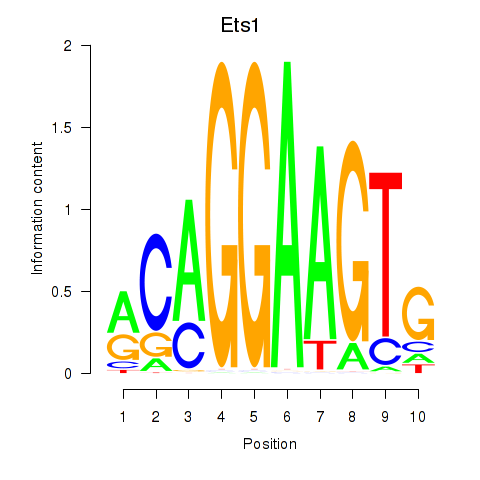
| Ets1 | 3.72 |
|
|
|
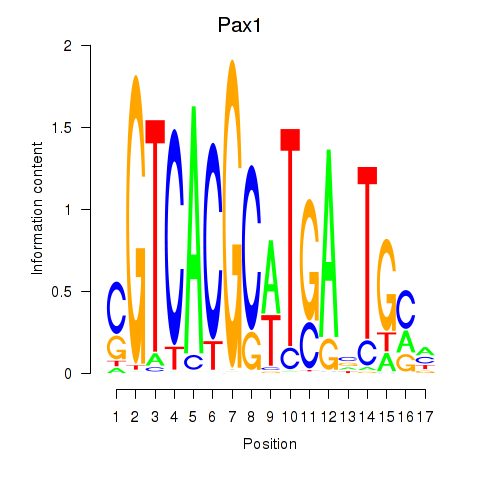
| Pax1_Pax9 | 3.71 |
|
|
|
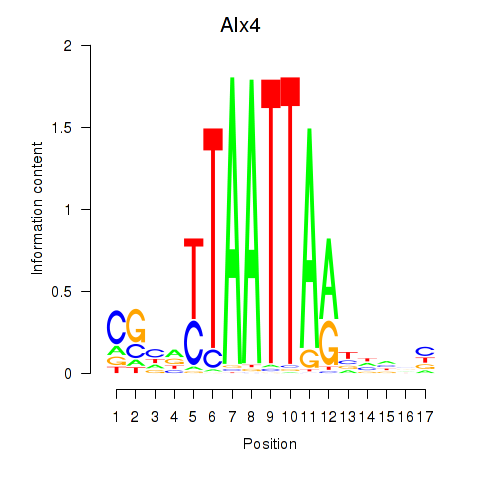
| Alx4 | 3.70 |
|
|
|
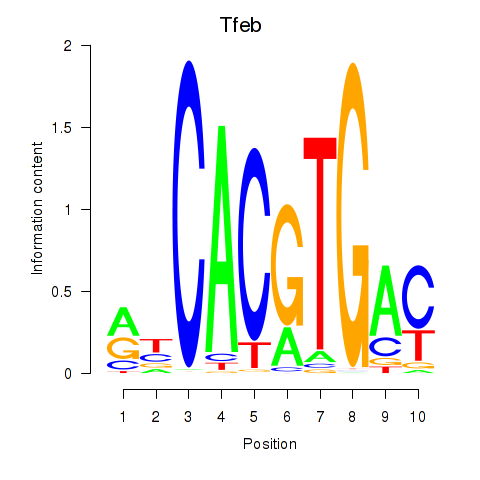
| Tfeb_Usf1_Srebf1_Usf2_Bhlhe41_Srebf2 | 3.69 |
|
|
|
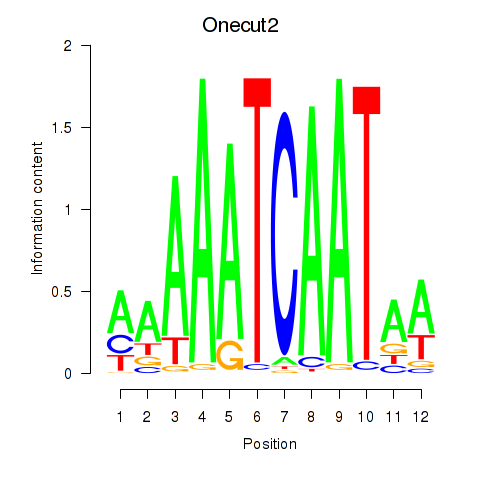
| Onecut2_Onecut3 | 3.69 |
|
|
|
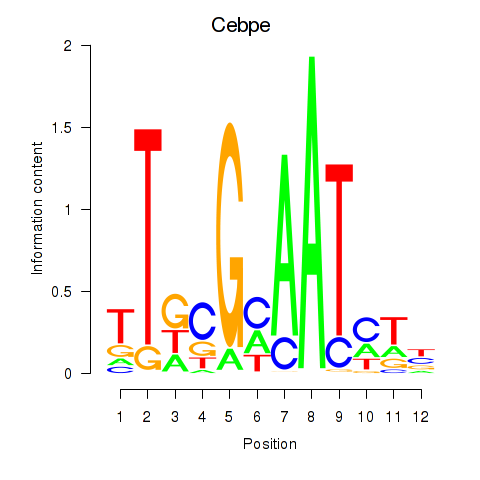
| Cebpe | 3.69 |
|
|
|
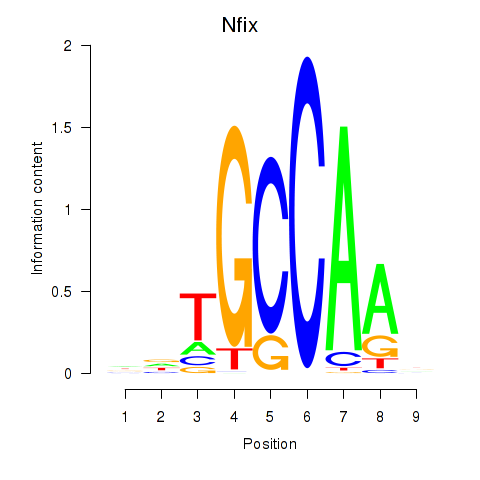
| Nfix | 3.68 |
|
|
|
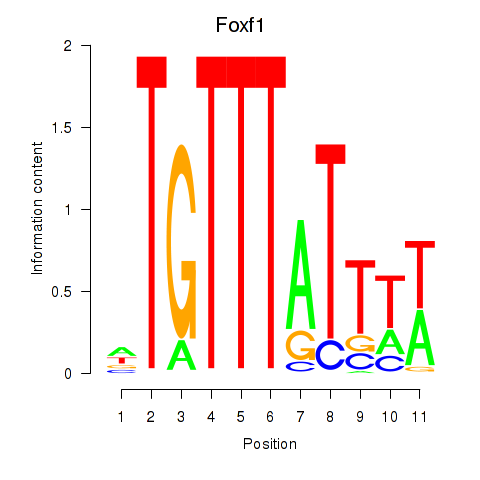
| Foxf1 | 3.68 |
|
|
|
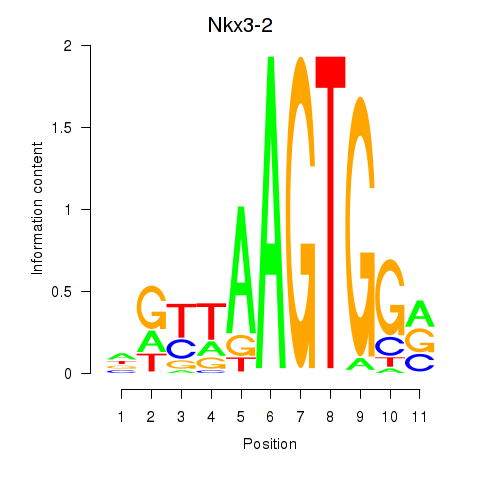
| Nkx3-2 | 3.63 |
|
|
|
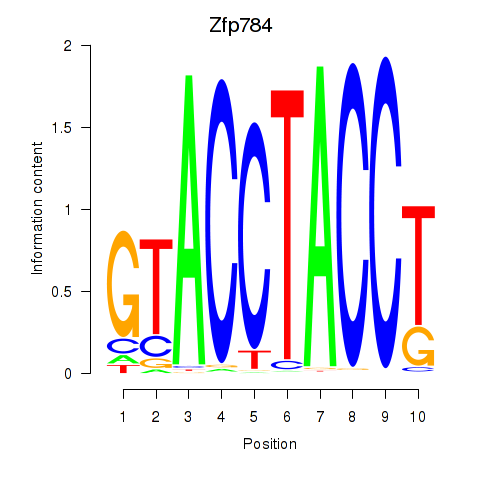
| Zfp784 | 3.63 |
|
|
|
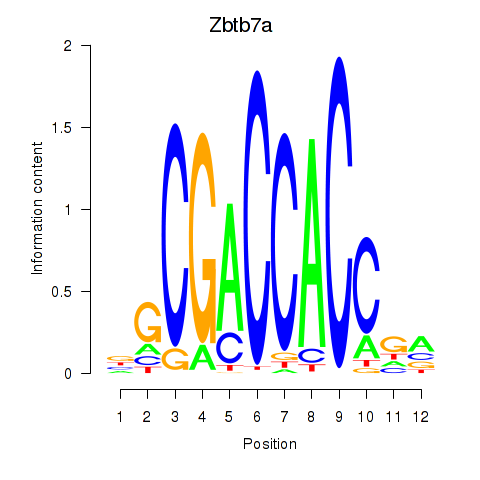
| Zbtb7a | 3.62 |
|
|
|
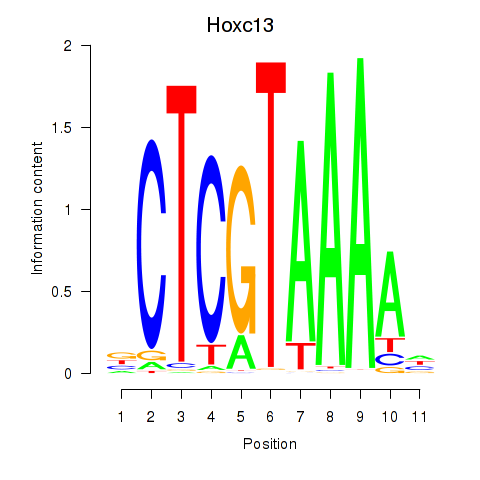
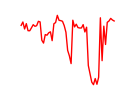
| Hoxc13_Hoxd13 | 3.61 |
|
|
|
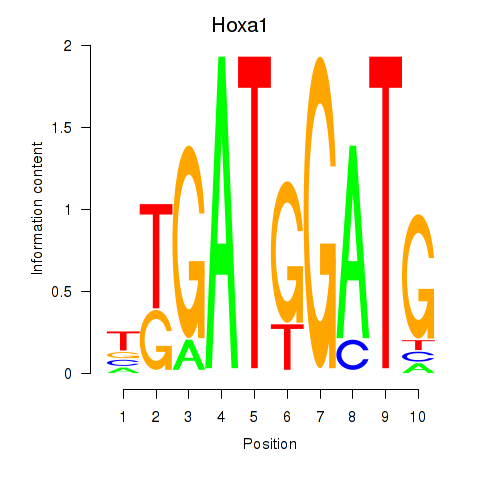
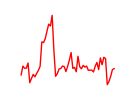
| Hoxa1 | 3.56 |
|
|
|
| Maf_Nrl | 3.56 |
|
|
|
| Zbtb12 | 3.50 |
|
|
|
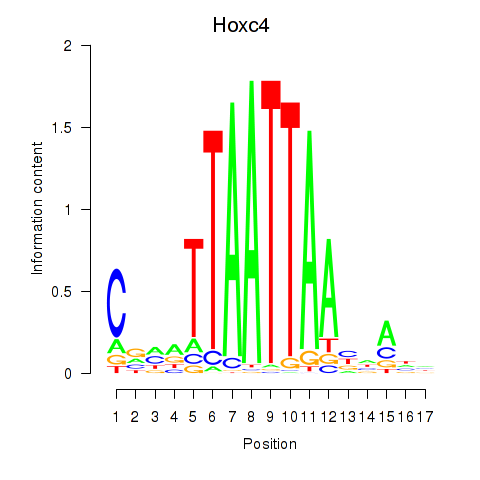
| Hoxc4_Arx_Otp_Esx1_Phox2b | 3.49 |
|
|
|
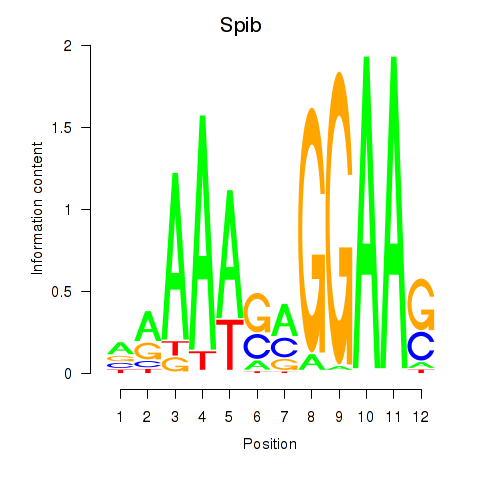
| Spib | 3.47 |
|
|
|
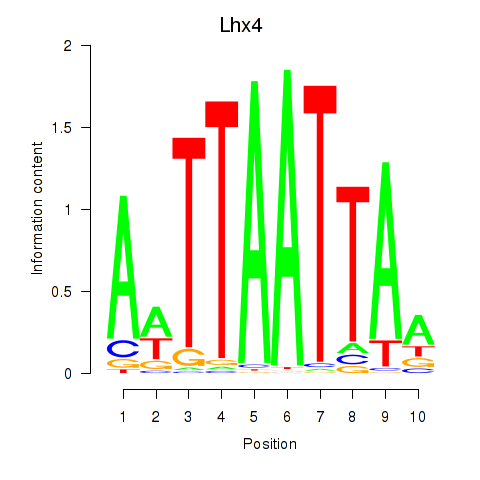
| Lhx4 | 3.46 |
|
|
|
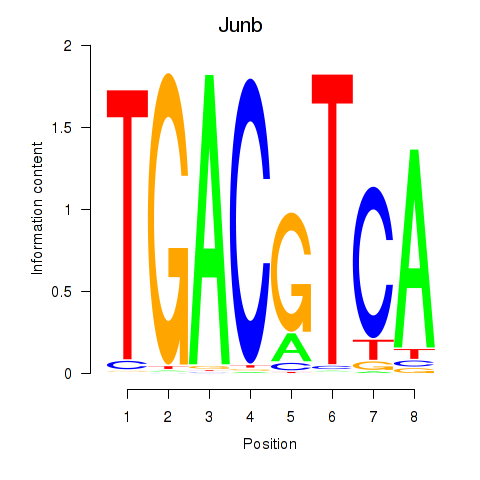
| Junb_Jund | 3.45 |
|
|
|
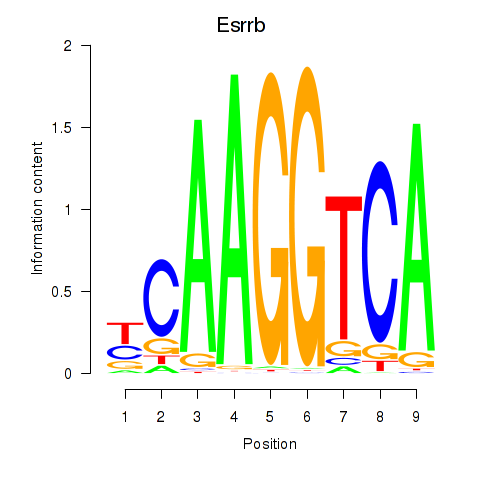
| Esrrb_Esrra | 3.44 |
|
|
|
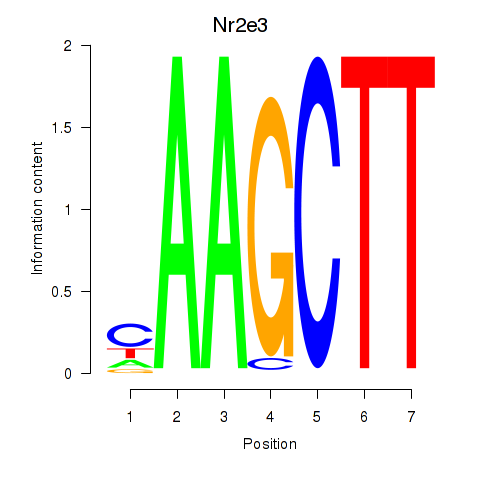
| Nr2e3 | 3.43 |
|
|
|
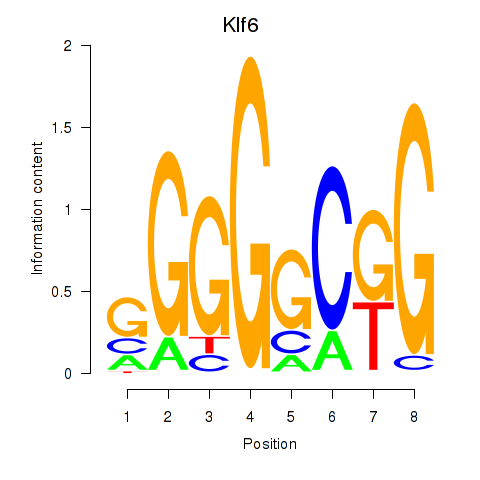
| Klf6_Patz1 | 3.42 |
|
|
|
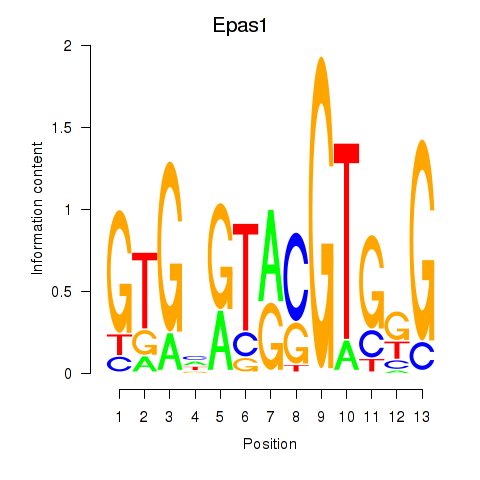
| Epas1_Bcl3 | 3.41 |
|
|
|
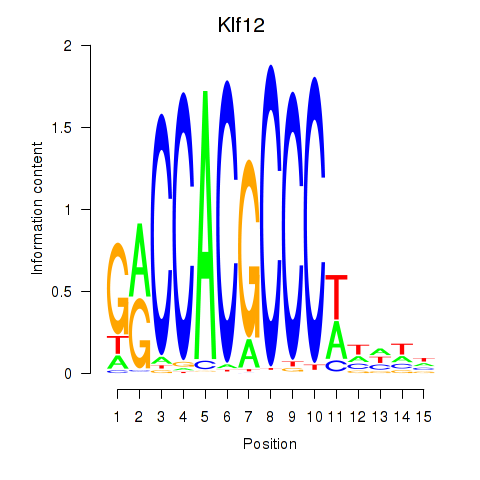
| Klf12_Klf14_Sp4 | 3.40 |
|
|
|
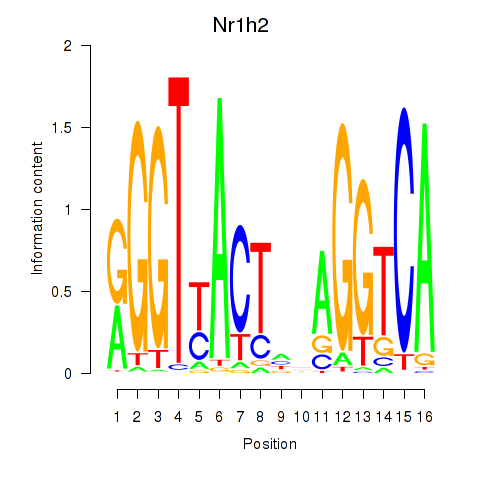
| Nr1h2 | 3.37 |
|
|
|
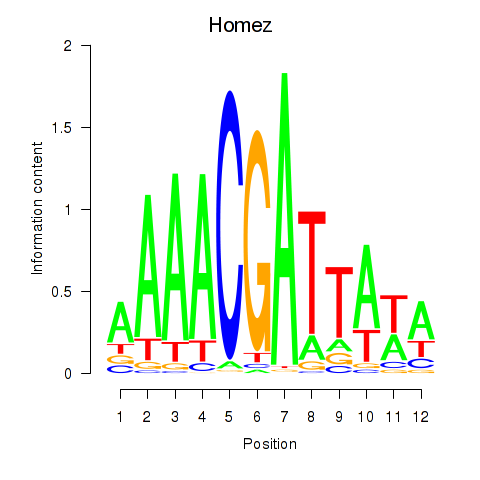
| Homez | 3.34 |
|
|
|
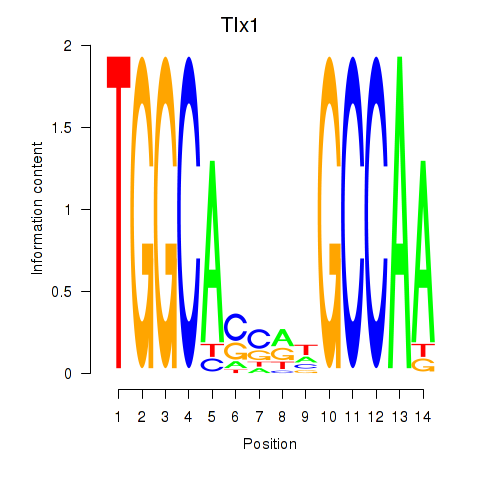
| Tlx1 | 3.34 |
|
|
|
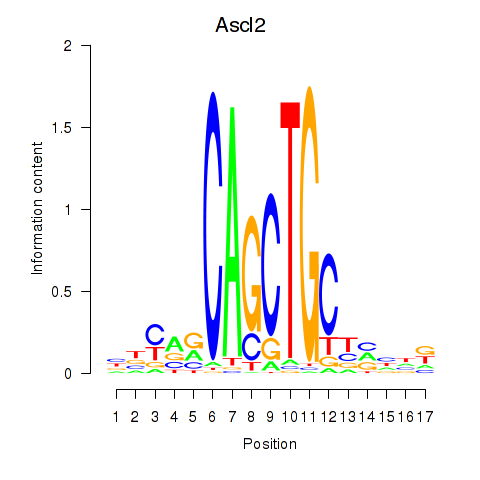
| Ascl2 | 3.31 |
|
|
|
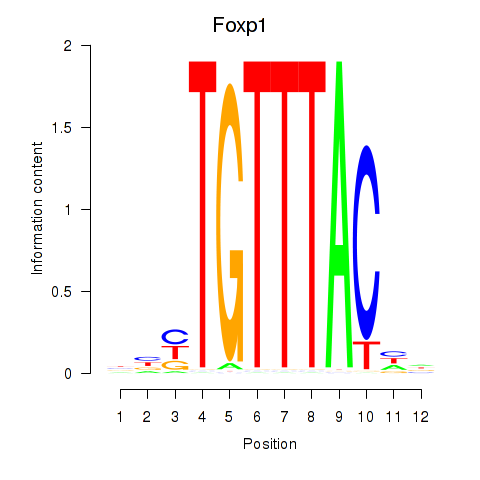
| Foxp1_Foxj2 | 3.29 |
|
|
|
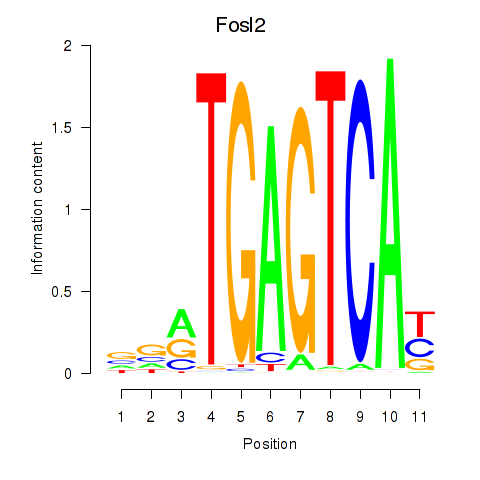
| Fosl2_Bach2 | 3.28 |
|
|
|
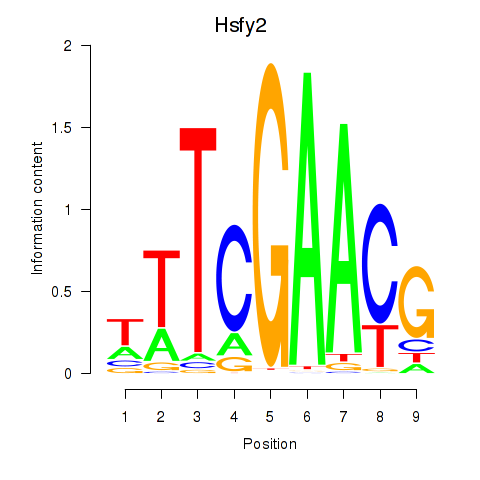
| Hsfy2 | 3.28 |
|
|
|
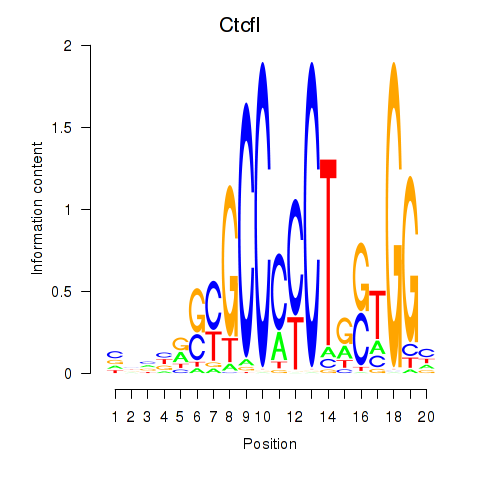
| Ctcfl_Ctcf | 3.27 |
|
|
|
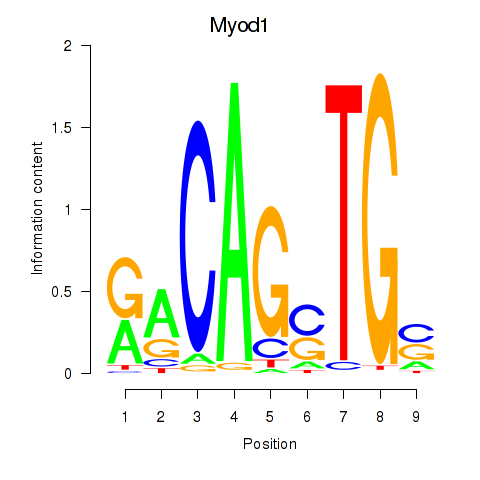
| Myod1 | 3.22 |
|
|
|
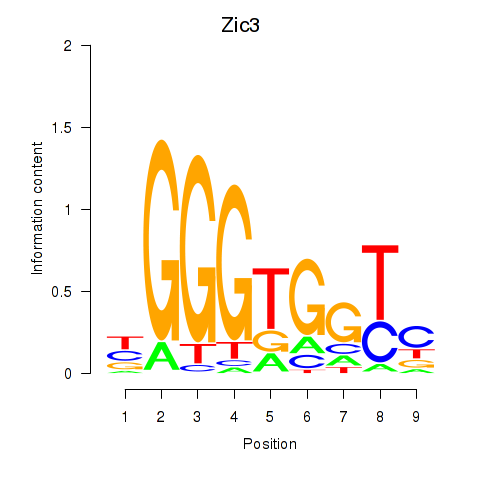
| Zic3 | 3.21 |
|
|
|
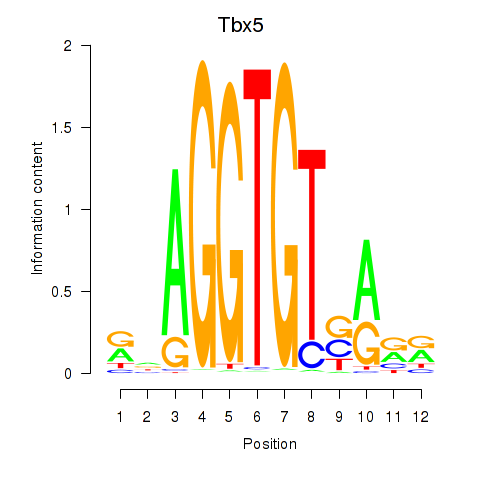
| Tbx5 | 3.17 |
|
|
|
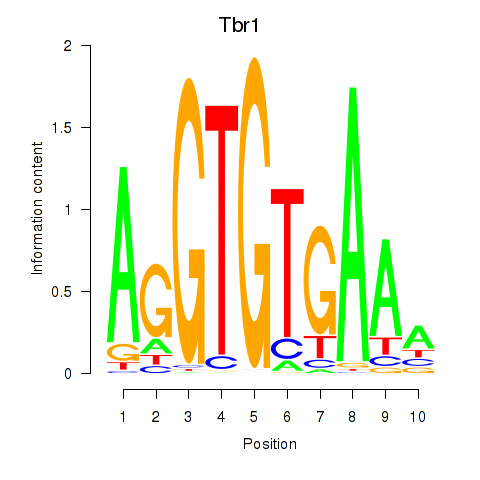
| Tbr1 | 3.17 |
|
|
|
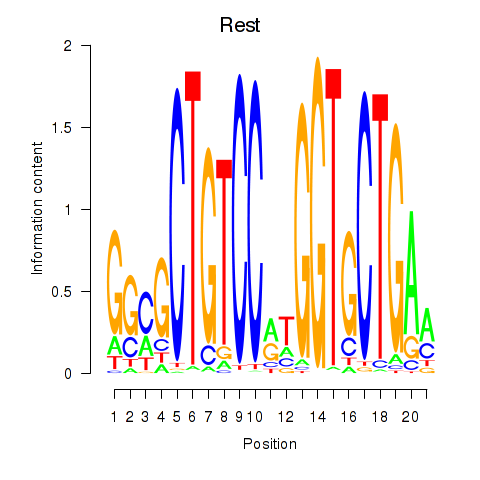
| Rest | 3.15 |
|
|
|
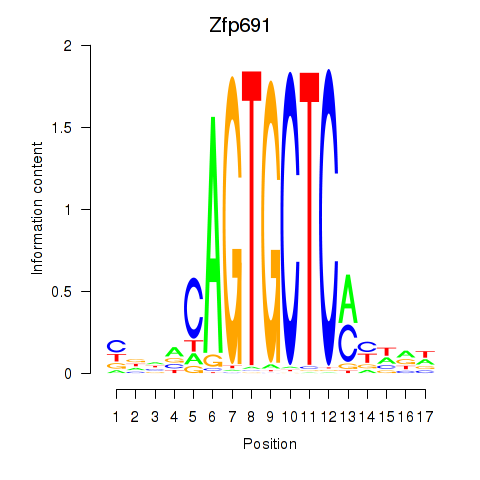
| Zfp691 | 3.14 |
|
|
|
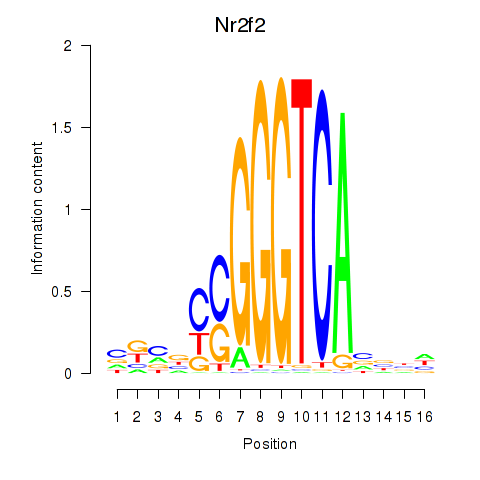
| Nr2f2 | 3.12 |
|
|
|
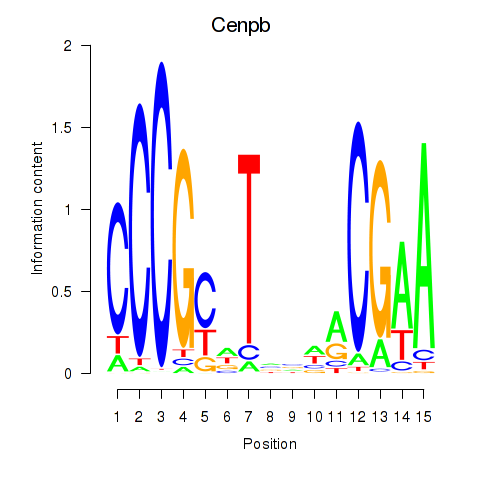
| Cenpb | 3.11 |
|
|
|
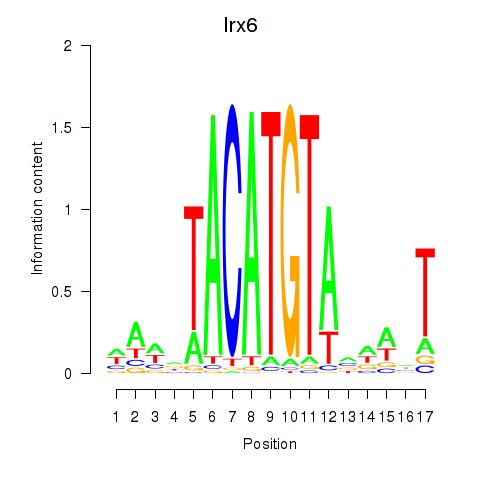
| Irx6_Irx2_Irx3 | 3.09 |
|
|
|
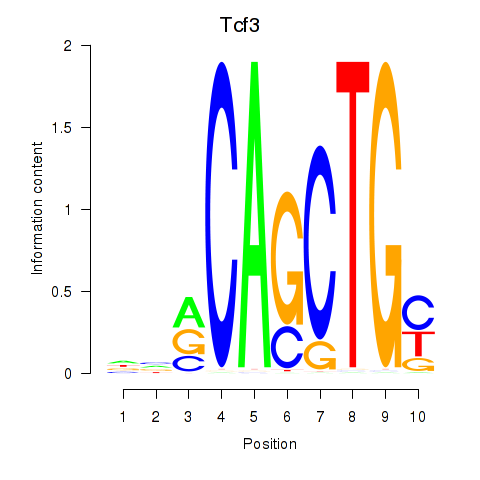
| Tcf3 | 3.08 |
|
|
|
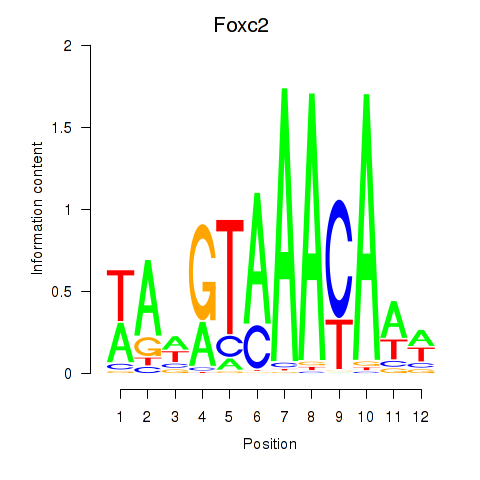
| Foxc2 | 3.08 |
|
|
|
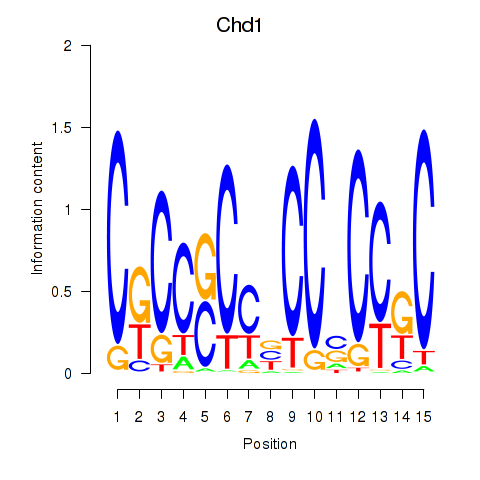
| Chd1_Pml | 3.06 |
|
|
|
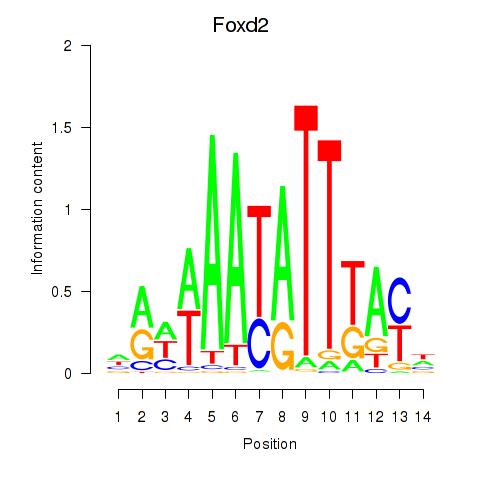
| Foxd2 | 3.05 |
|
|
|
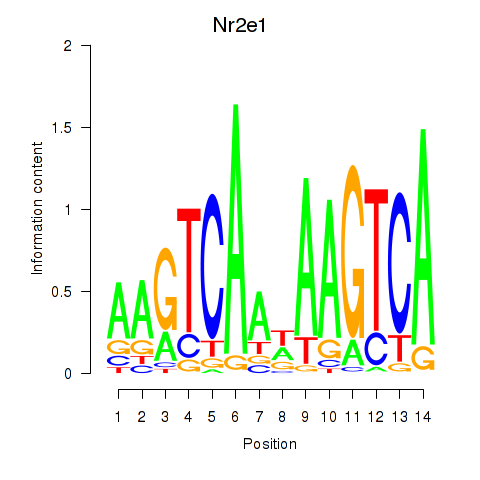
| Nr2e1 | 3.04 |
|
|
|
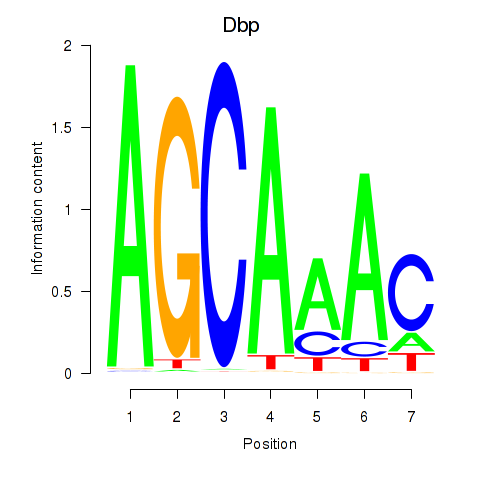
| Dbp | 3.03 |
|
|
|
| Pitx3 | 3.03 |
|
|

|
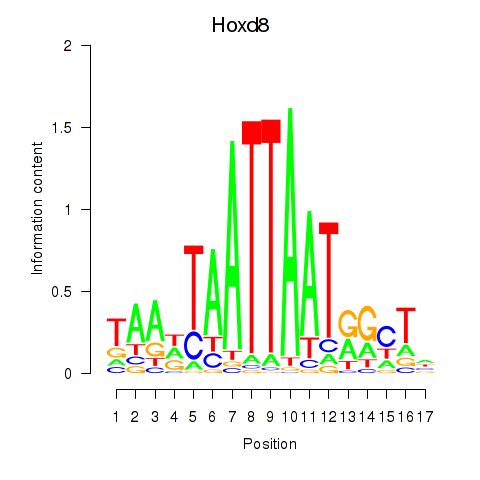
| Hoxd8 | 3.02 |
|
|
|
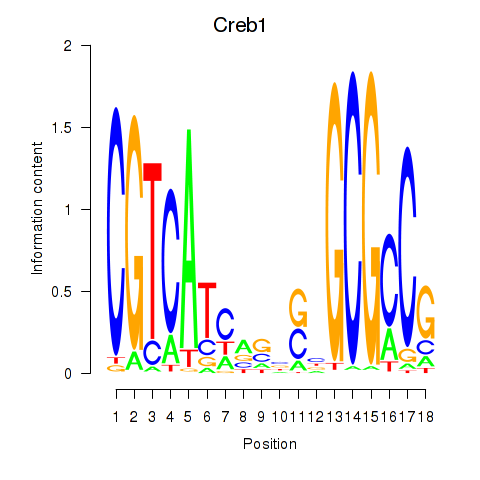
| Creb1 | 3.02 |
|
|
|
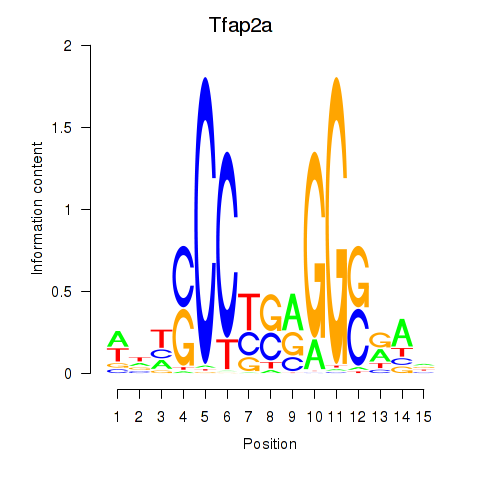
| Tfap2a | 3.01 |
|
|
|
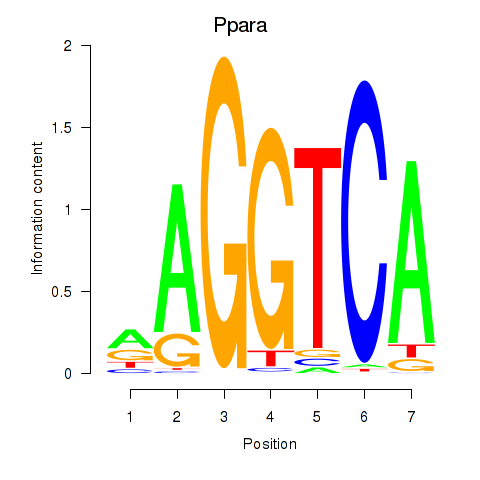
| Ppara | 3.00 |
|
|
|
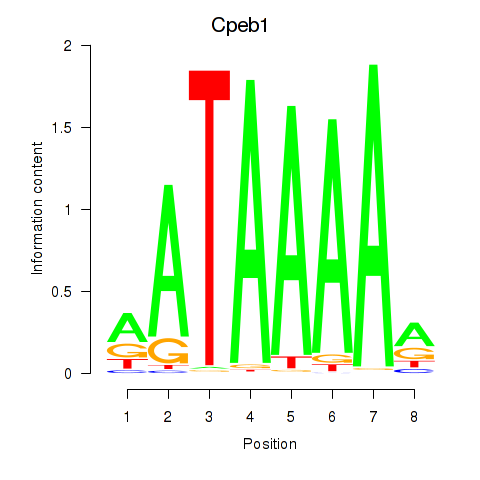
| Cpeb1 | 3.00 |
|
|
|
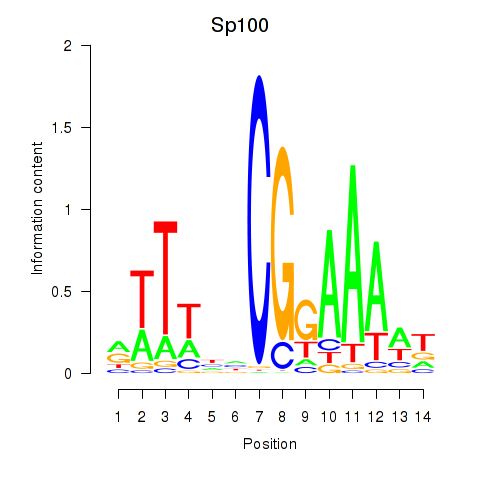
| Sp100 | 2.99 |
|
|
|
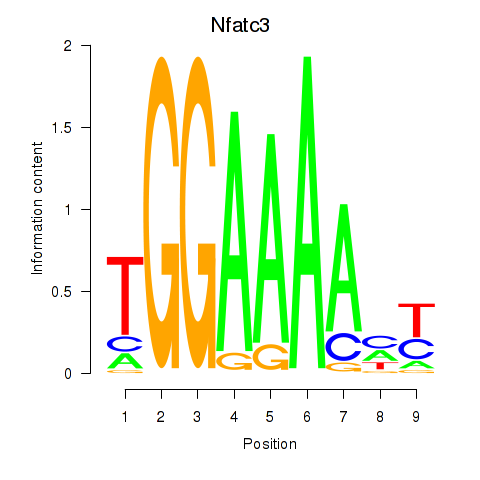
| Nfatc3 | 2.99 |
|
|
|
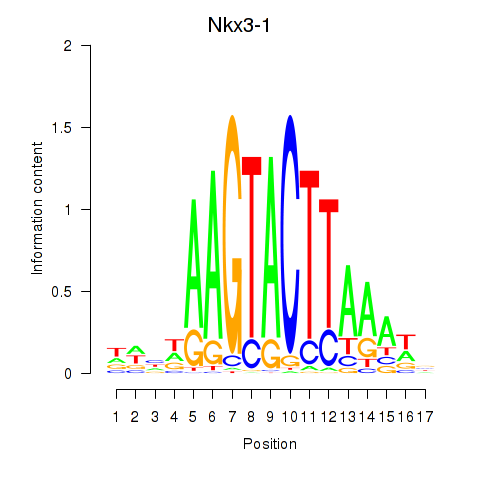
| Nkx3-1 | 2.97 |
|
|
|
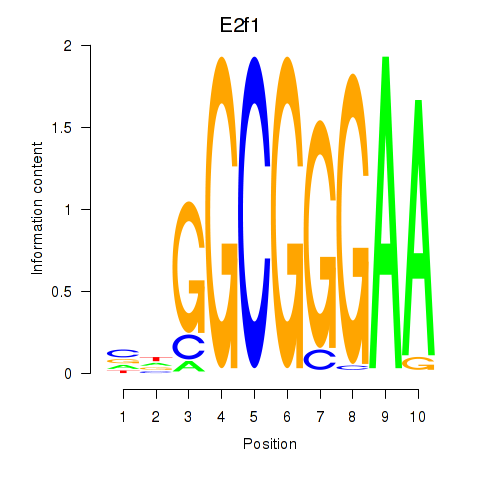
| E2f1 | 2.93 |
|
|
|
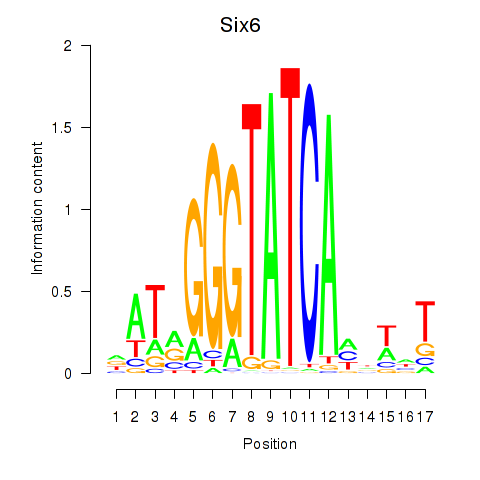
| Six6 | 2.93 |
|
|
|
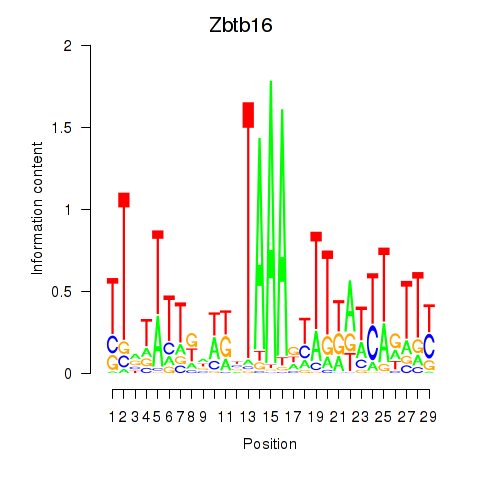
| Zbtb16 | 2.92 |
|
|
|
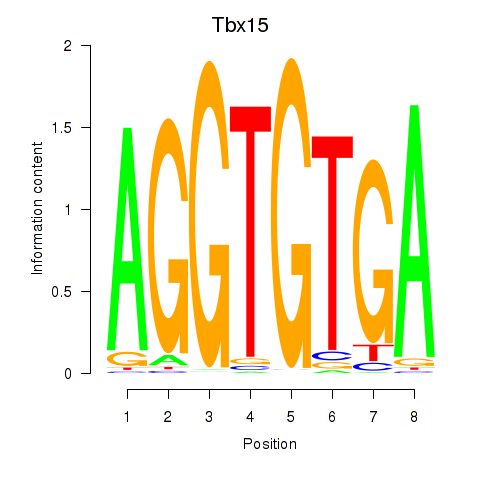
| Tbx15 | 2.89 |
|
|
|
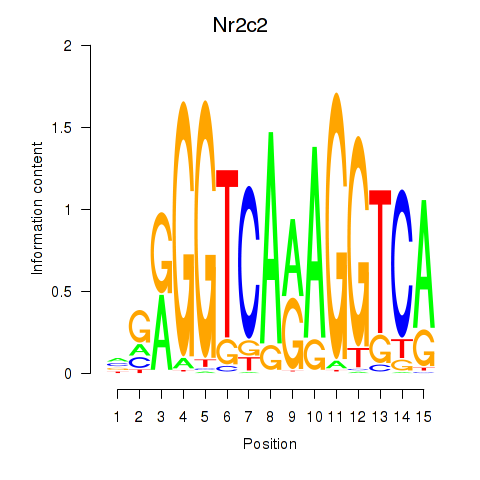
| Nr2c2 | 2.88 |
|
|
|
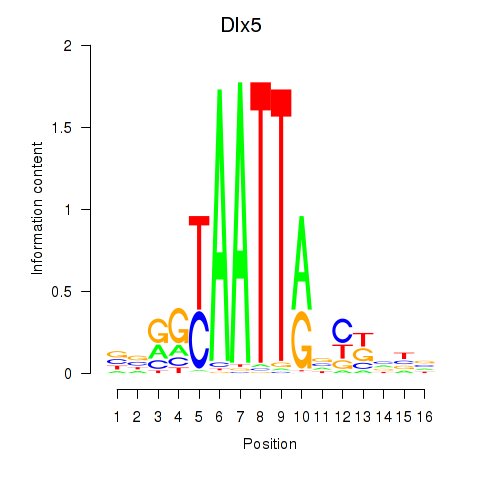
| Dlx5_Dlx4 | 2.88 |
|
|
|
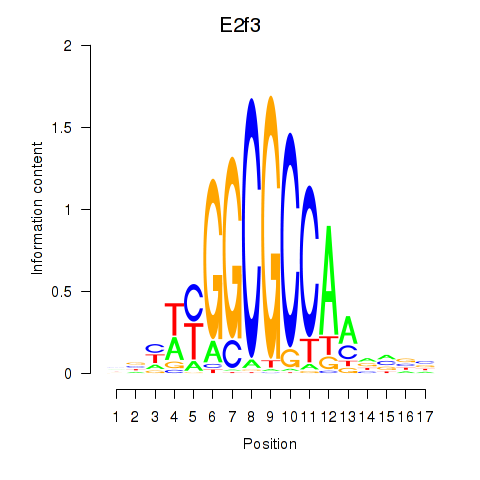
| E2f3 | 2.87 |
|
|
|
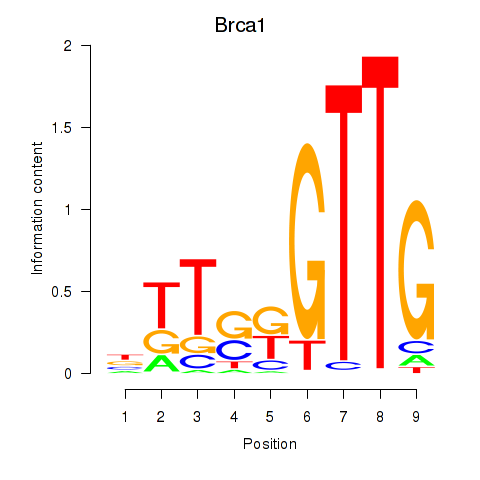
| Brca1 | 2.86 |
|
|
|
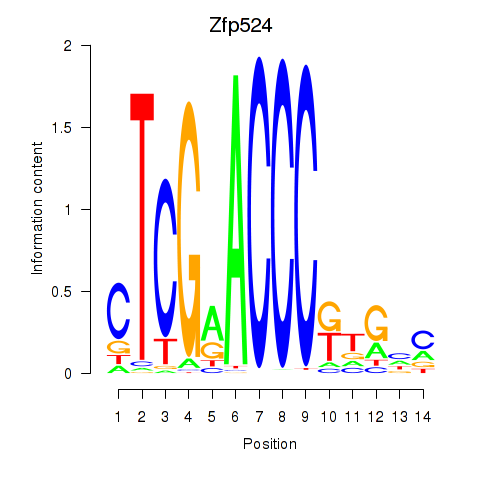
| Zfp524 | 2.85 |
|
|
|
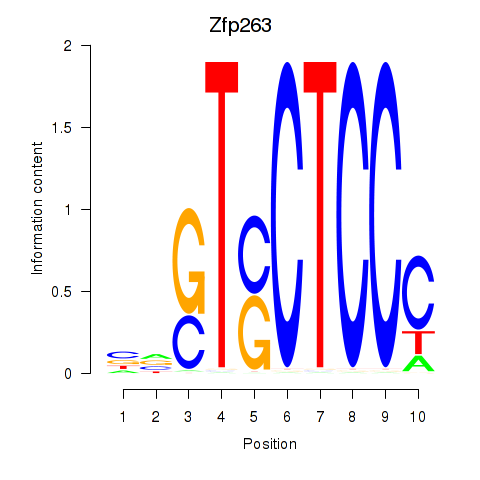
| Zfp263 | 2.84 |
|
|
|
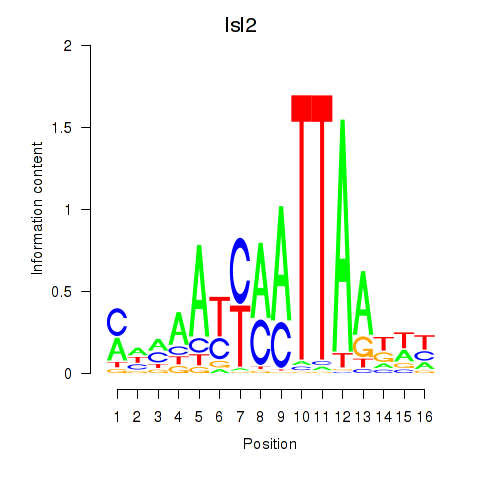
| Isl2 | 2.84 |
|
|
|
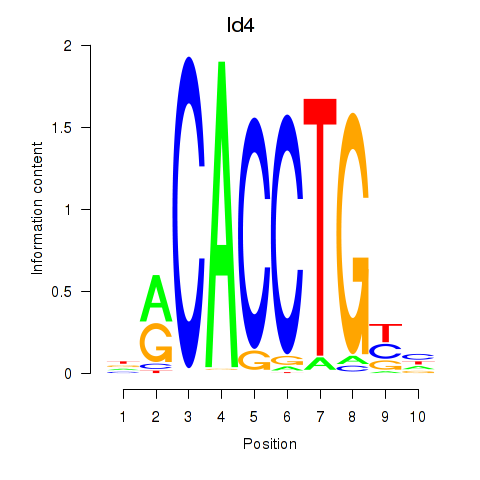
| Id4 | 2.83 |
|
|
|
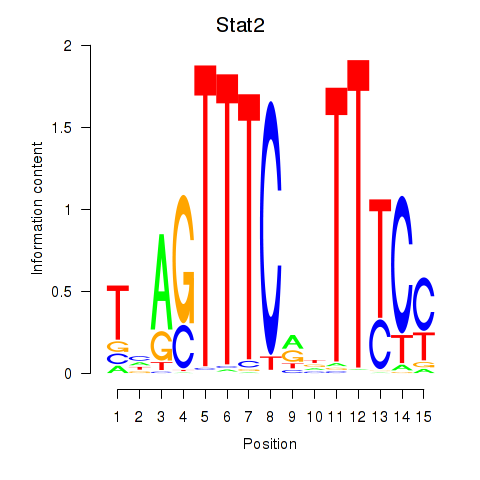
| Stat2 | 2.82 |
|
|
|
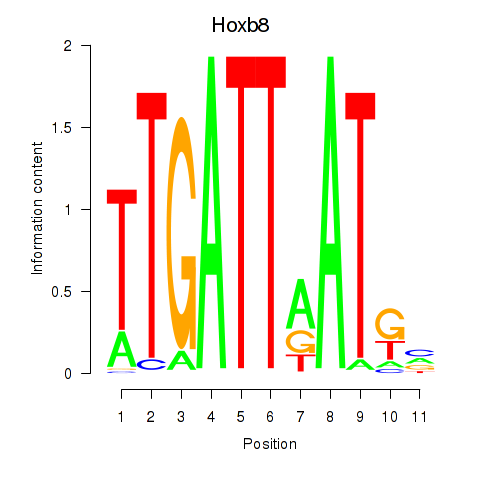
| Hoxb8_Pdx1 | 2.81 |
|
|
|
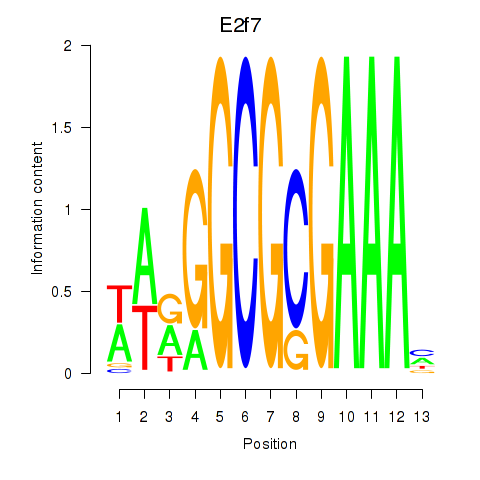
| E2f7 | 2.81 |
|
|
|
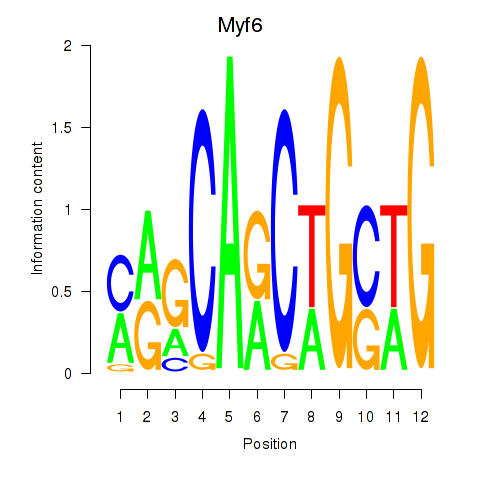
| Myf6 | 2.78 |
|
|
|
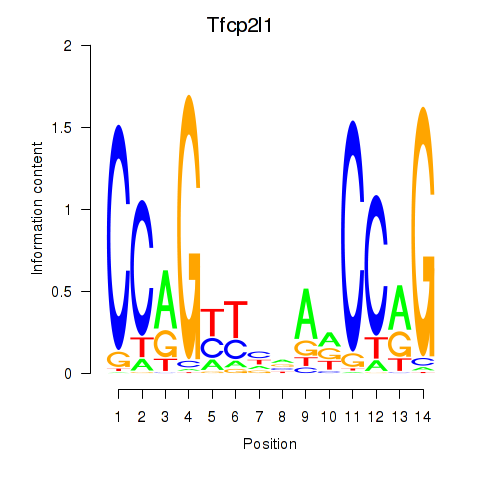
| Tfcp2l1 | 2.77 |
|
|
|
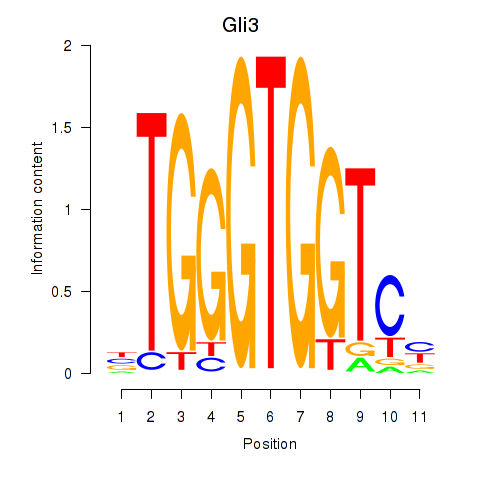
| Gli3_Zic1 | 2.74 |
|
|
|
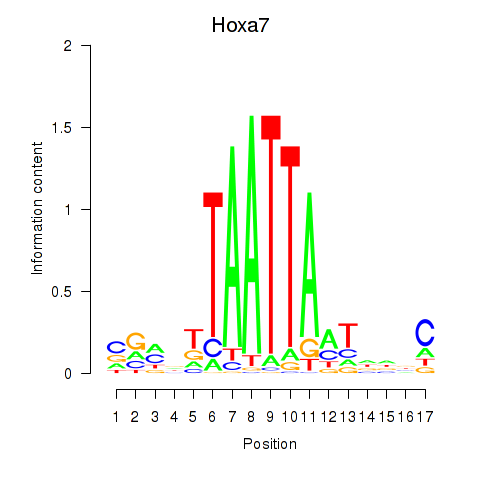
| Hoxa7_Hoxc8 | 2.73 |
|
|
|
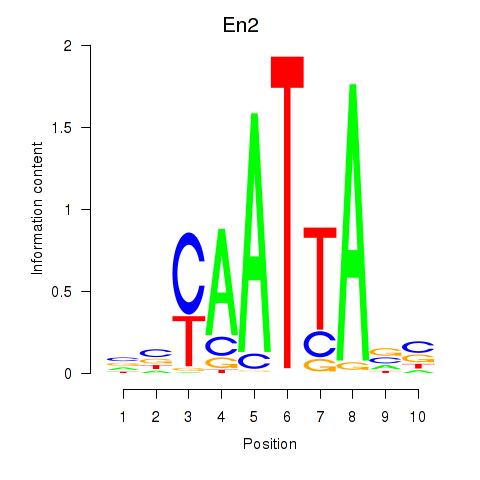
| En2 | 2.73 |
|
|
|
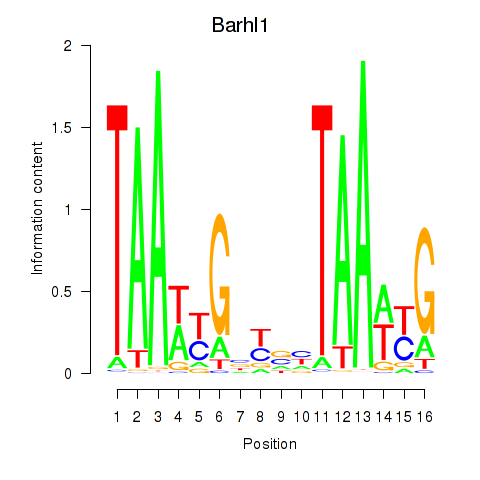
| Barhl1 | 2.72 |
|
|
|
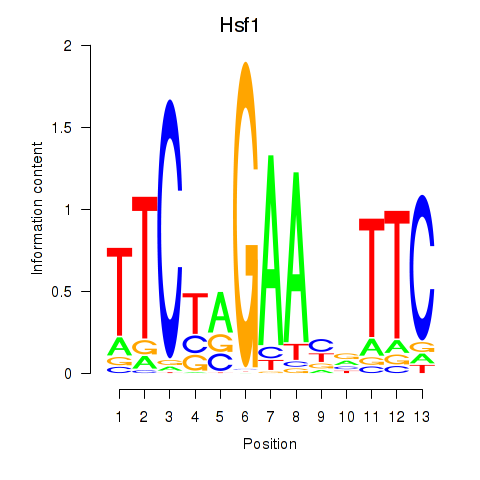
| Hsf1 | 2.72 |
|
|
|
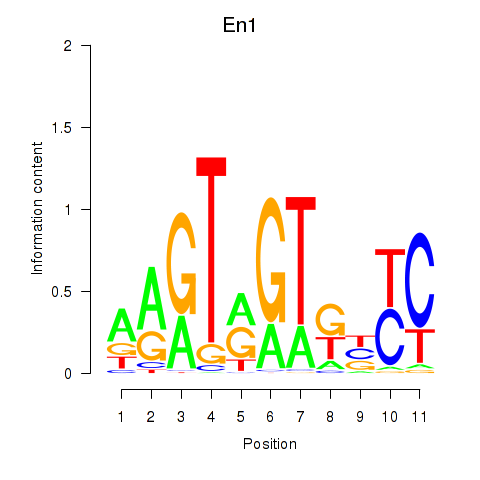
| En1 | 2.70 |
|
|
|
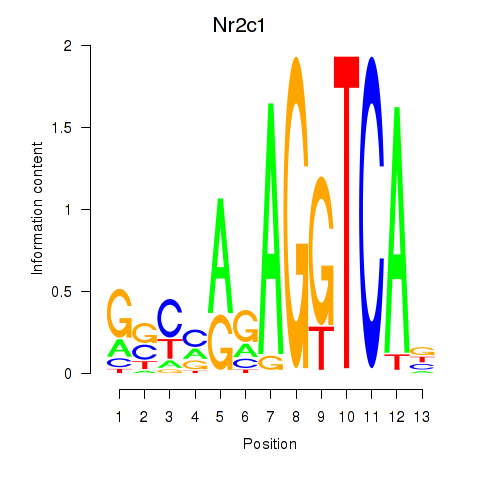
| Nr2c1 | 2.69 |
|
|
|
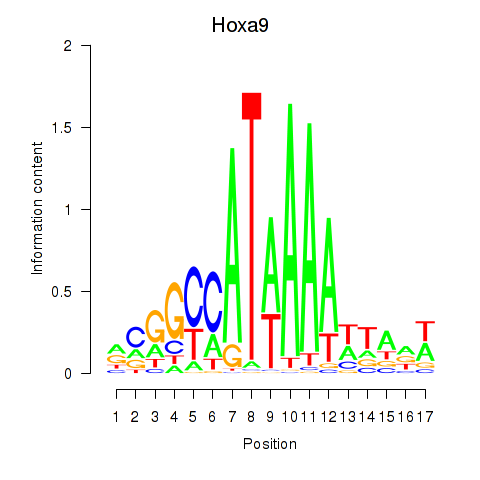
| Hoxa9_Hoxb9 | 2.68 |
|
|
|
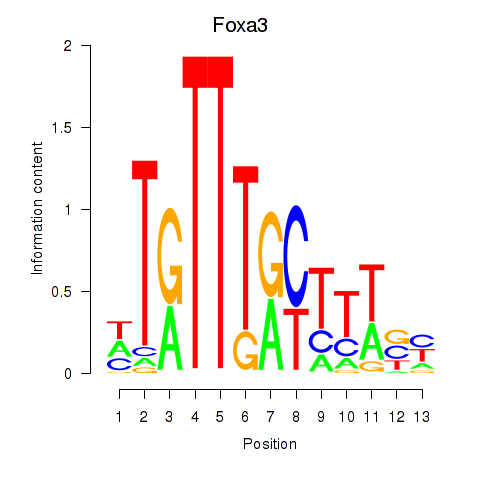
| Foxa3 | 2.68 |
|
|
|
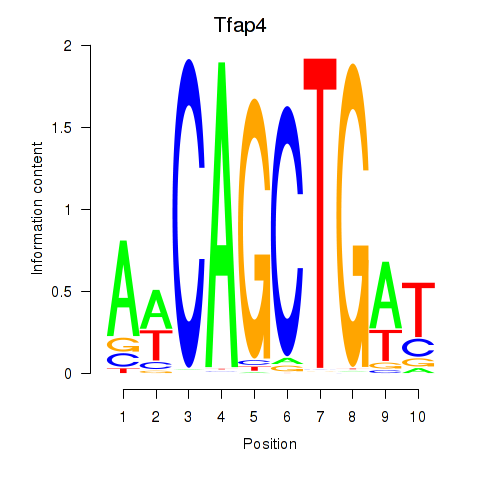
| Tfap4 | 2.67 |
|
|
|
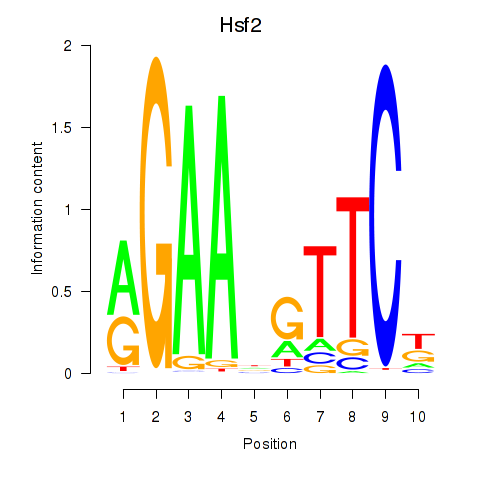
| Hsf2 | 2.66 |
|
|
|
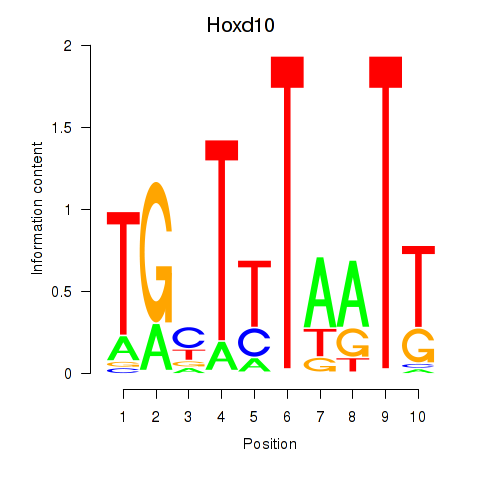
| Hoxd10 | 2.64 |
|
|
|
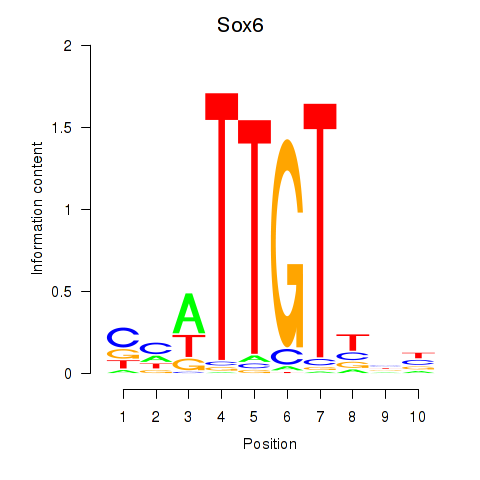
| Sox6_Sox9 | 2.64 |
|
|
|
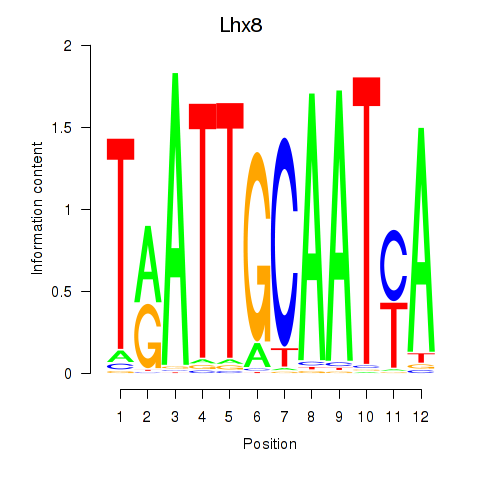
| Lhx8 | 2.64 |
|
|
|
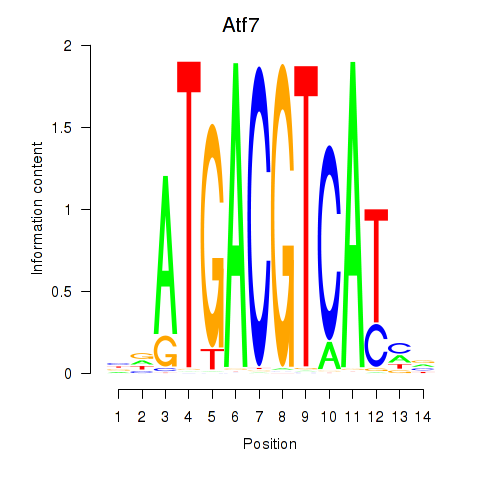
| Atf7_E4f1 | 2.63 |
|
|
|
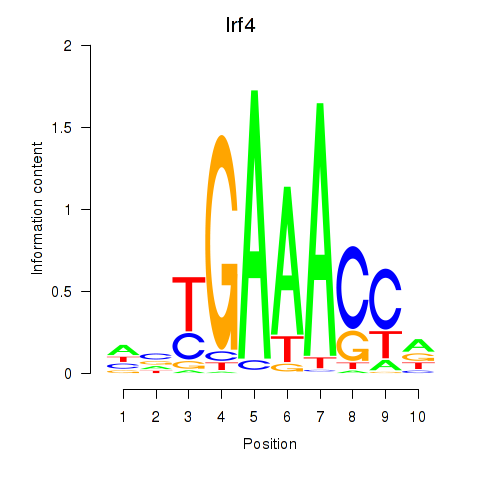
| Irf4 | 2.61 |
|
|
|
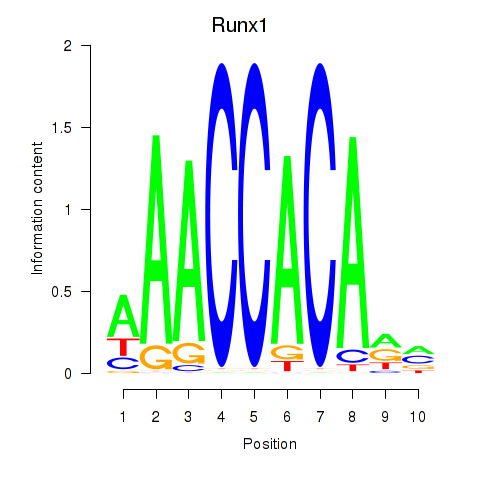
| Runx1 | 2.57 |
|
|
|
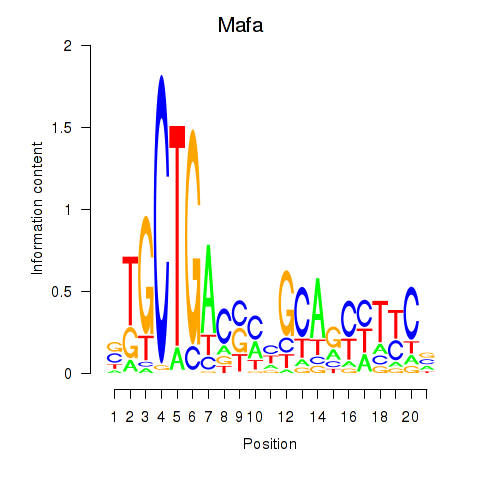
| Mafa | 2.55 |
|
|
|
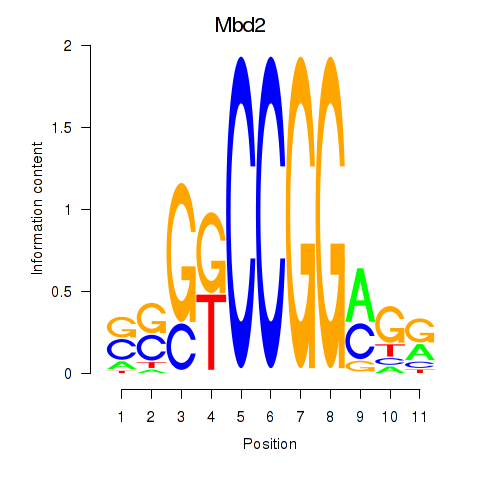
| Mbd2 | 2.55 |
|
|
|
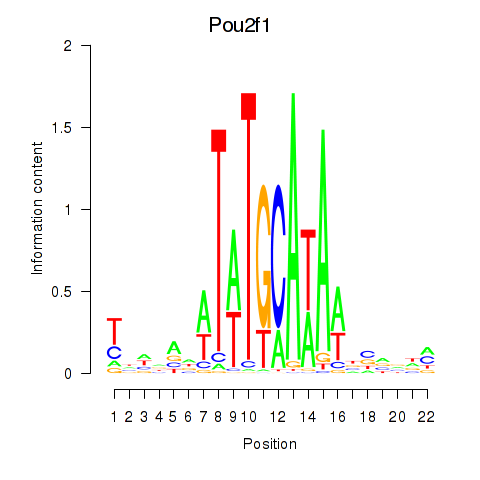
| Pou2f1 | 2.54 |
|
|
|
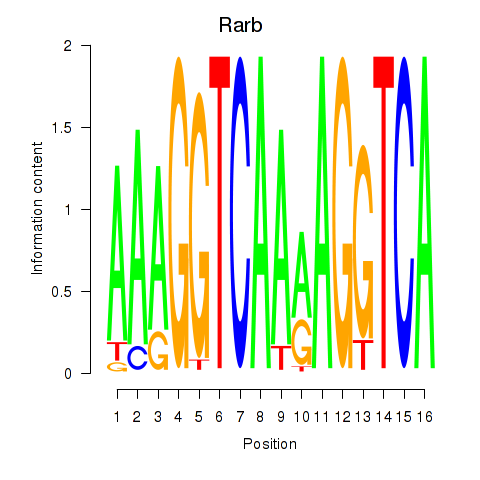
| Rarb | 2.53 |
|
|
|
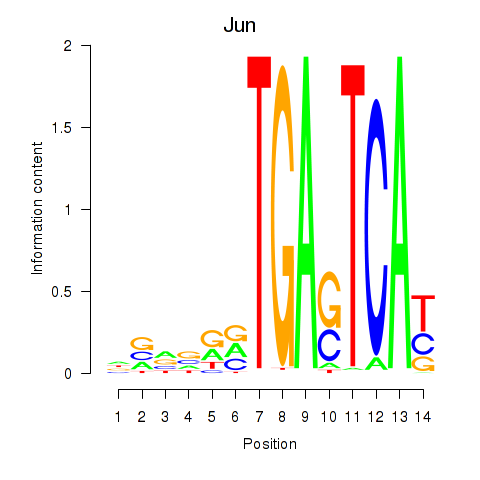
| Jun | 2.53 |
|
|
|
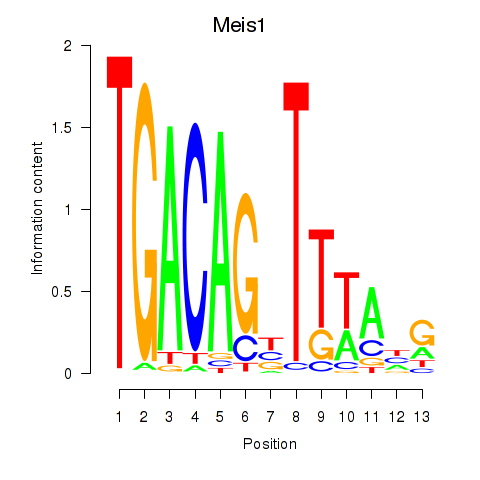
| Meis1 | 2.52 |
|
|
|
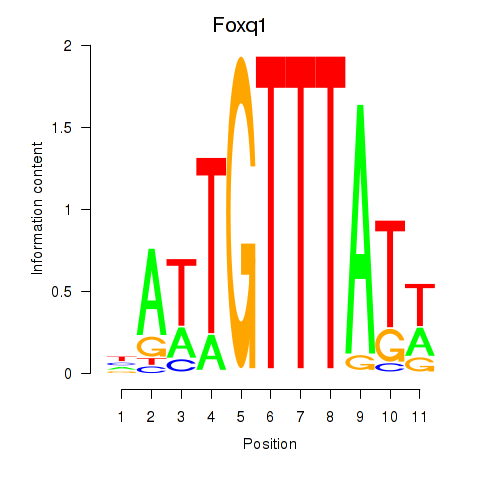
| Foxq1 | 2.48 |
|
|
|
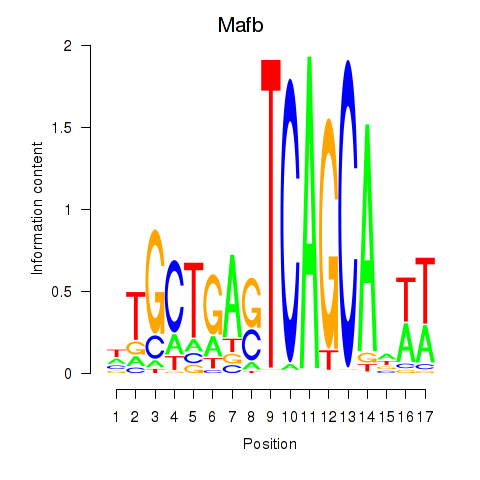
| Mafb | 2.48 |
|
|
|
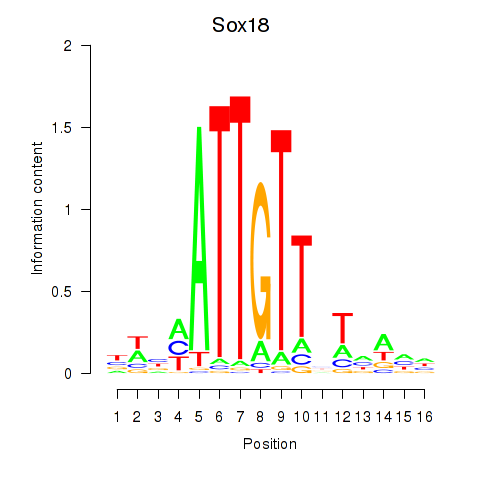
| Sox18_Sox12 | 2.46 |
|
|
|
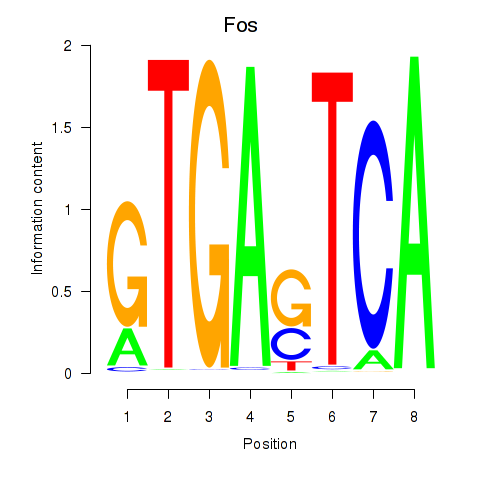
| Fos | 2.44 |
|
|
|
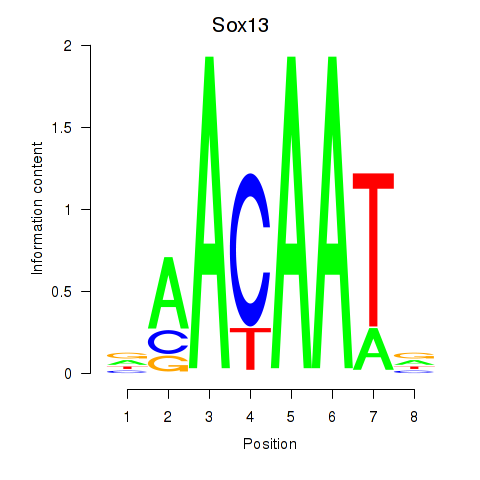
| Sox13 | 2.44 |
|
|
|
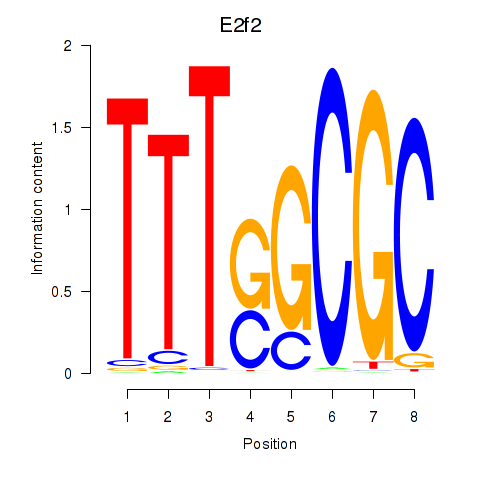
| E2f2_E2f5 | 2.44 |
|
|
|
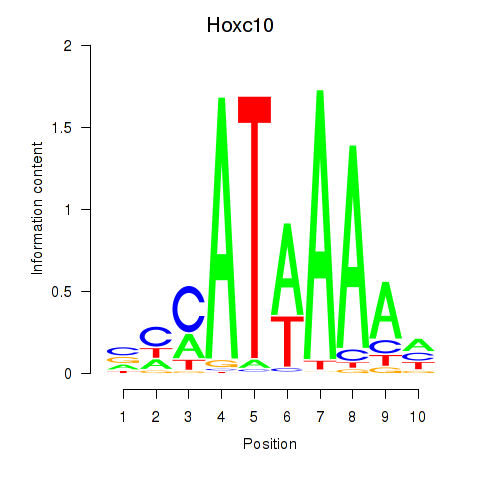
| Hoxc10 | 2.44 |
|
|
|
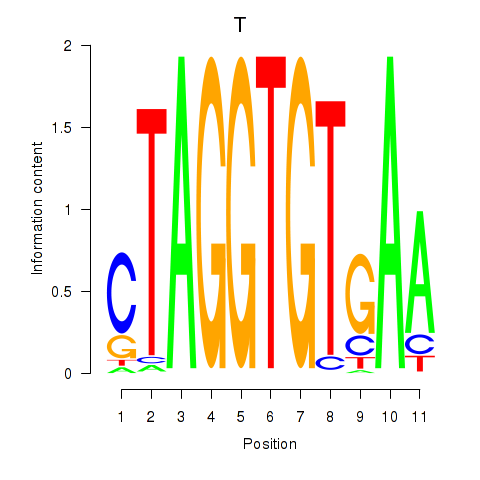
| T | 2.43 |
|
|
|
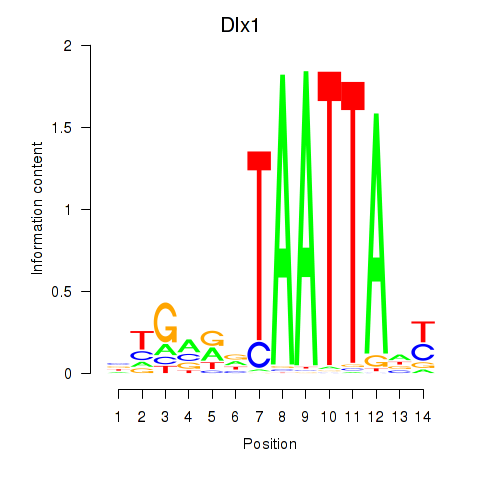
| Dlx1 | 2.42 |
|
|
|
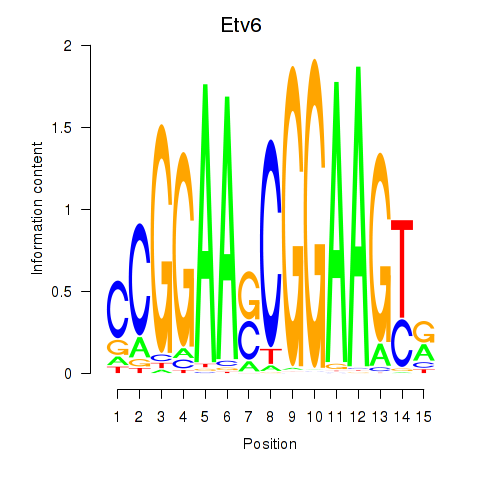
| Etv6 | 2.41 |
|
|
|
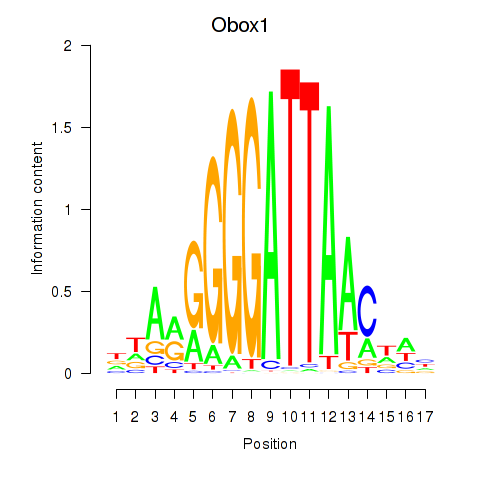
| Obox1 | 2.41 |
|
|
|
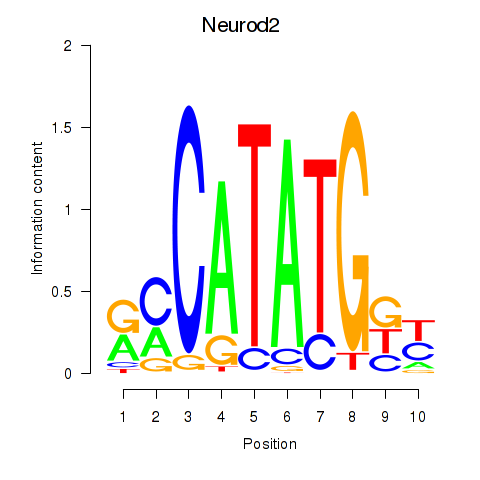
| Neurod2_Bhlha15_Bhlhe22_Olig1 | 2.39 |
|
|
|
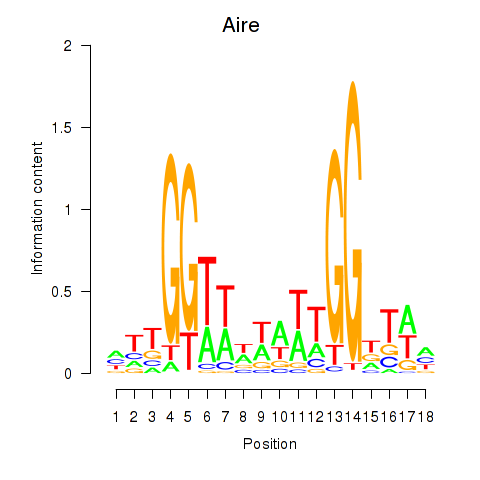
| Aire | 2.38 |
|
|
|
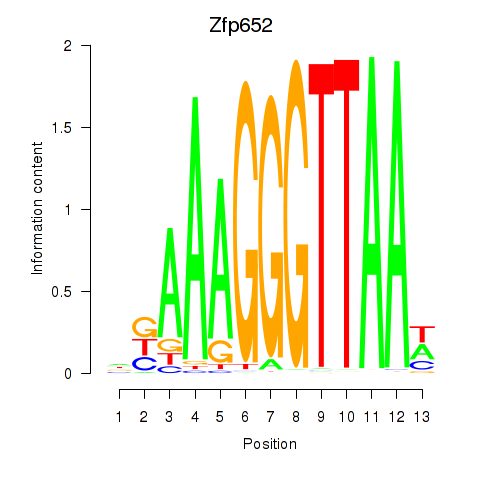
| Zfp652 | 2.37 |
|
|
|
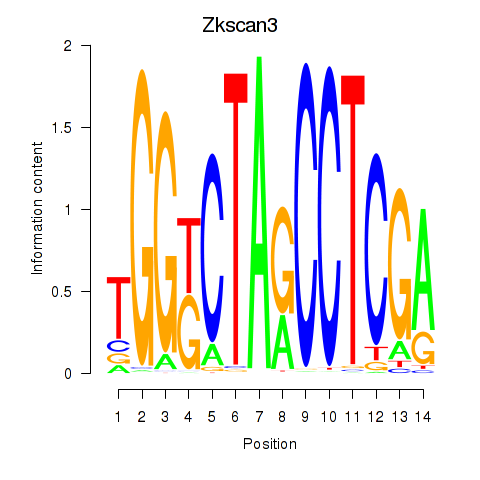
| Zkscan3 | 2.35 |
|
|
|
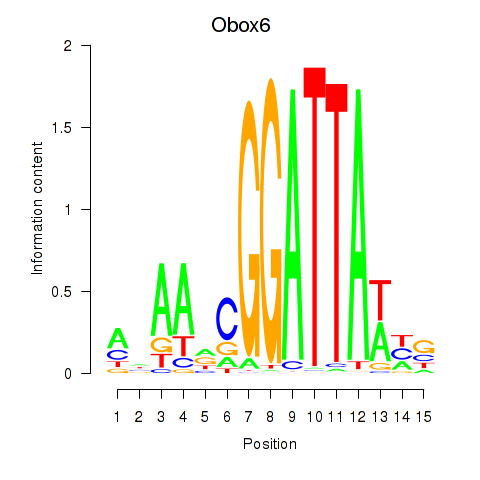
| Obox6_Obox5 | 2.34 |
|
|
|
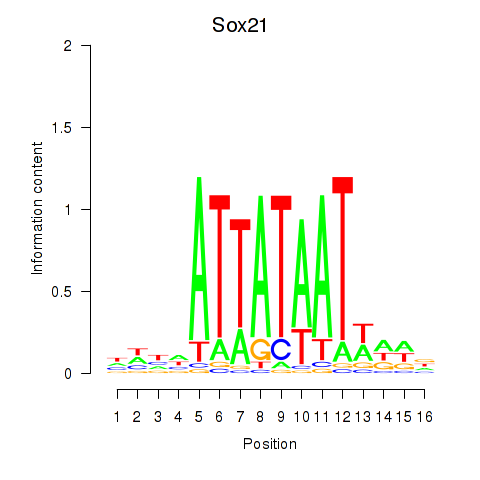
| Sox21 | 2.31 |
|
|
|
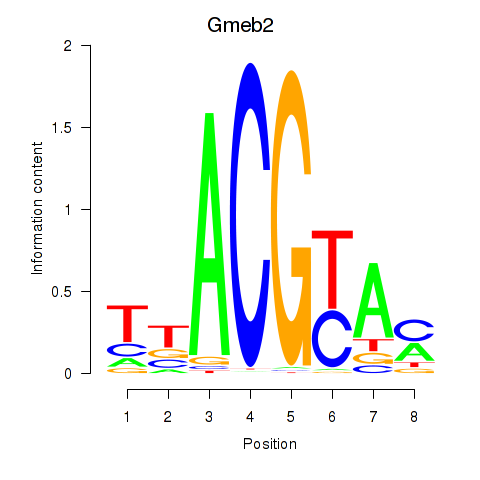
| Gmeb2 | 2.30 |
|
|
|
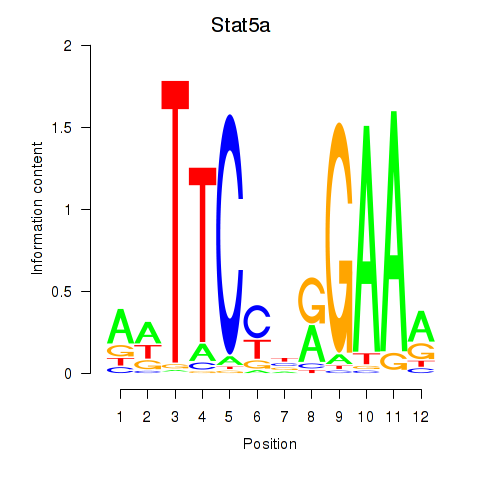
| Stat5a | 2.30 |
|
|
|
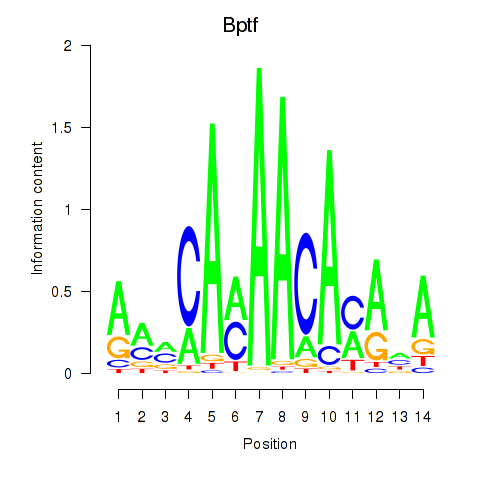
| Bptf | 2.29 |
|
|
|
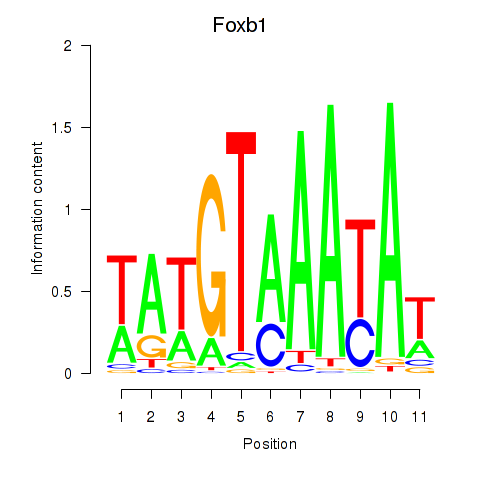
| Foxb1 | 2.28 |
|
|
|
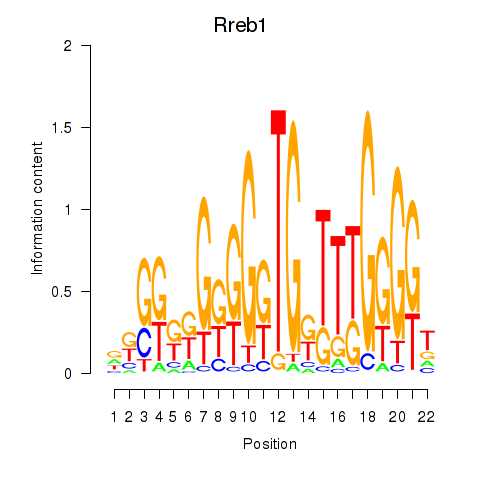
| Rreb1 | 2.28 |
|
|
|
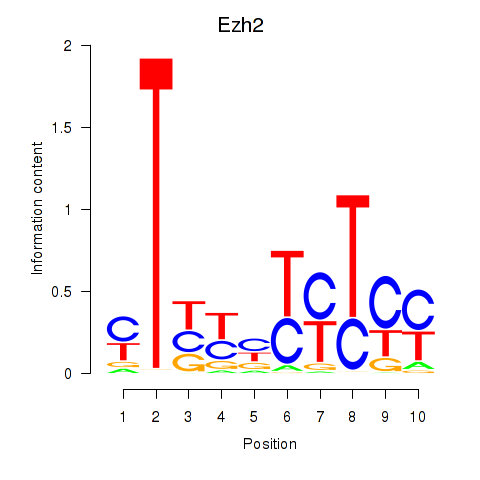
| Ezh2_Atf2_Ikzf1 | 2.28 |
|
|
|
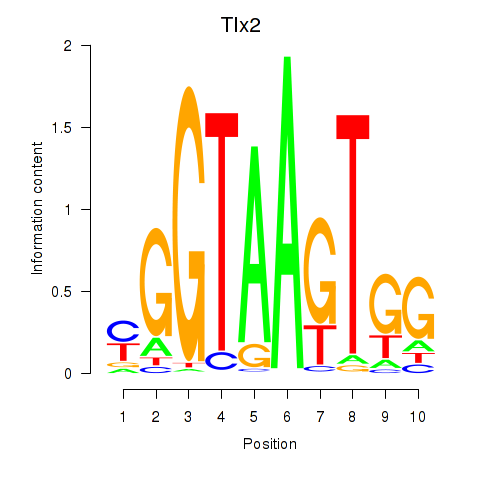
| Tlx2 | 2.27 |
|
|
|
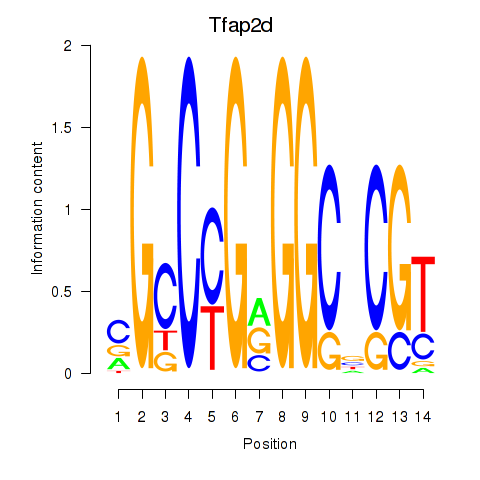
| Tfap2d | 2.26 |
|
|
|
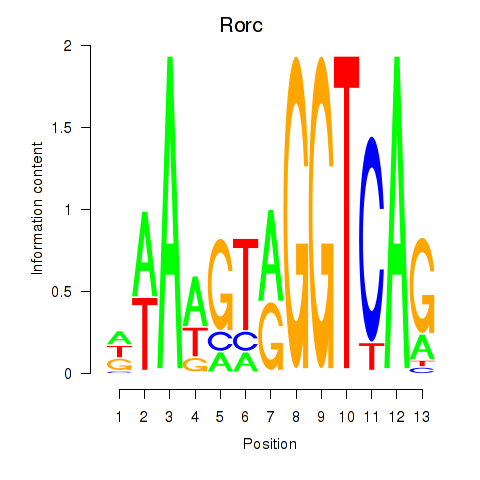
| Rorc_Nr1d1 | 2.25 |
|
|
|
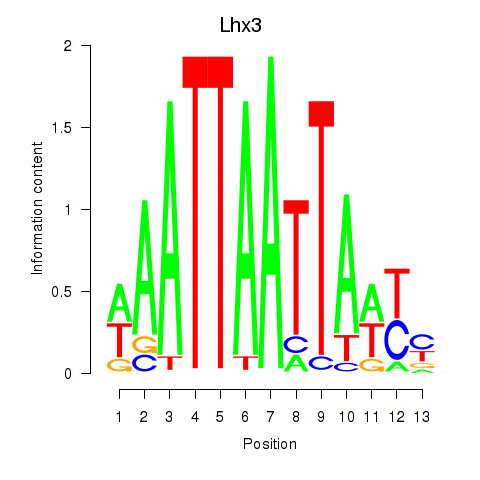
| Lhx3 | 2.25 |
|
|
|
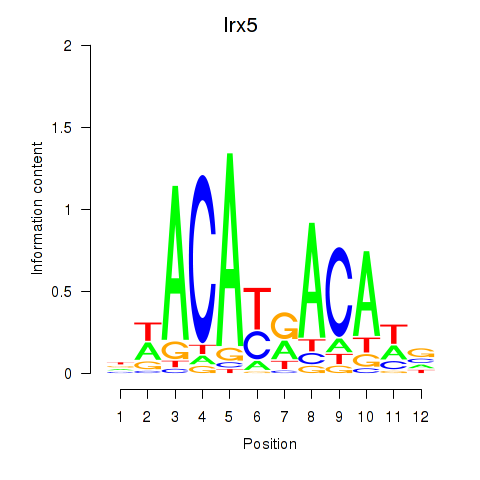
| Irx5 | 2.25 |
|
|
|
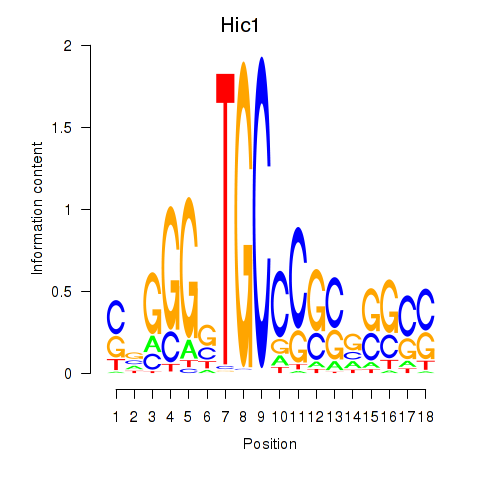
| Hic1 | 2.24 |
|
|
|
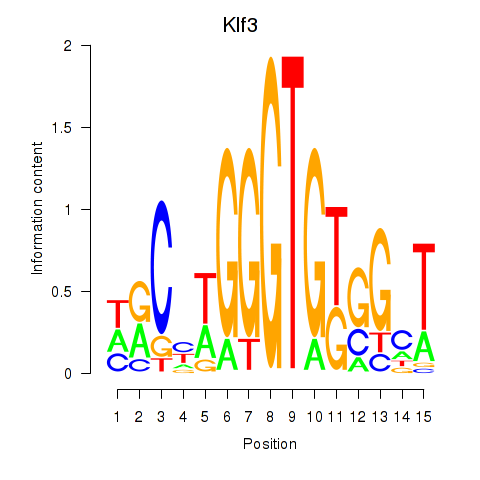
| Klf3 | 2.24 |
|
|
|
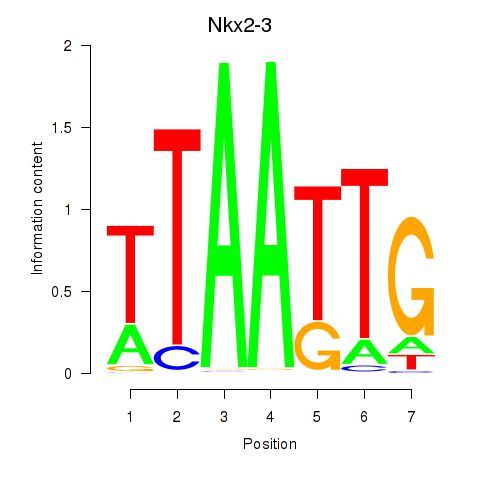
| Nkx2-3 | 2.23 |
|
|
|
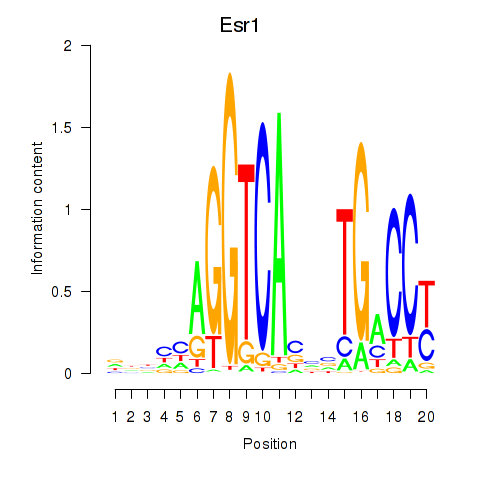
| Esr1 | 2.22 |
|
|
|
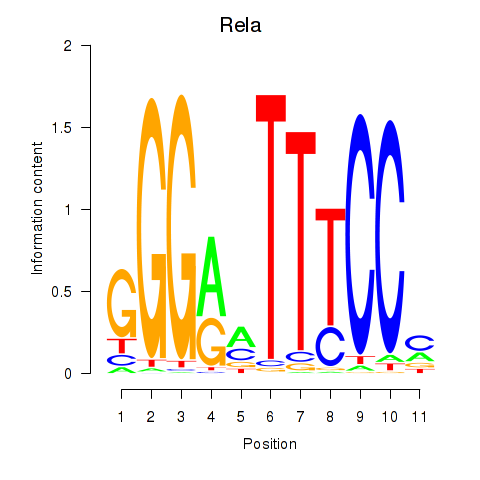
| Rela_Rel_Nfkb1 | 2.22 |
|
|
|
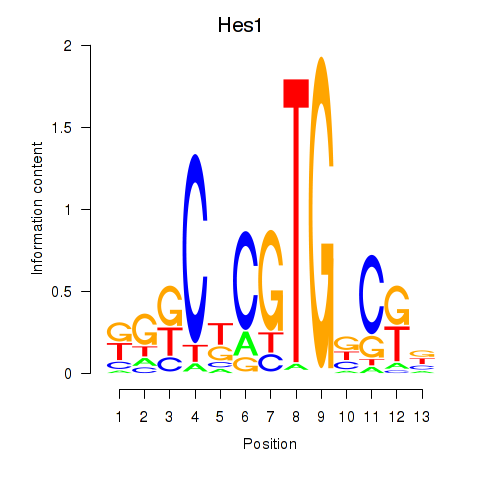
| Hes1 | 2.22 |
|
|
|
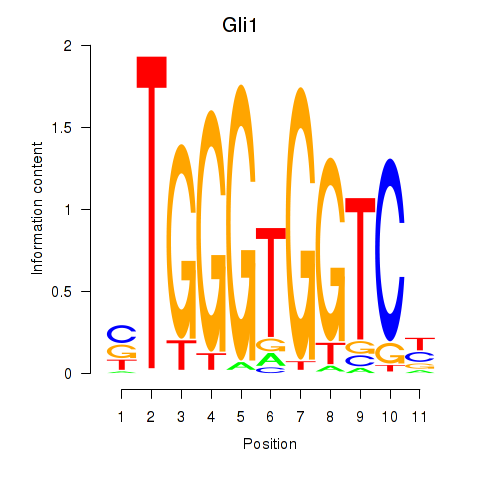
| Gli1 | 2.21 |
|
|
|
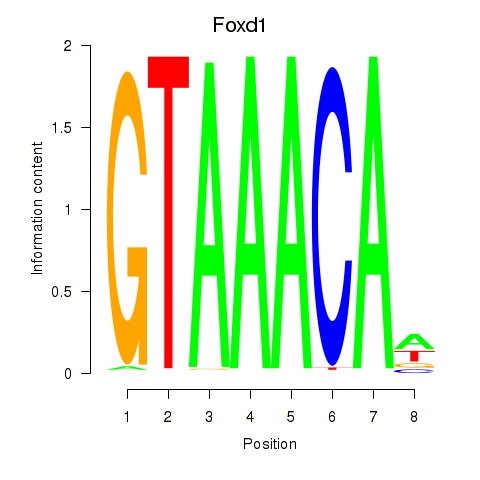
| Foxd1 | 2.20 |
|
|
|
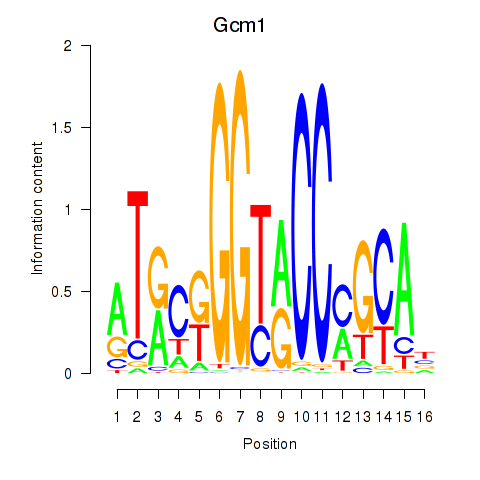
| Gcm1 | 2.19 |
|
|
|
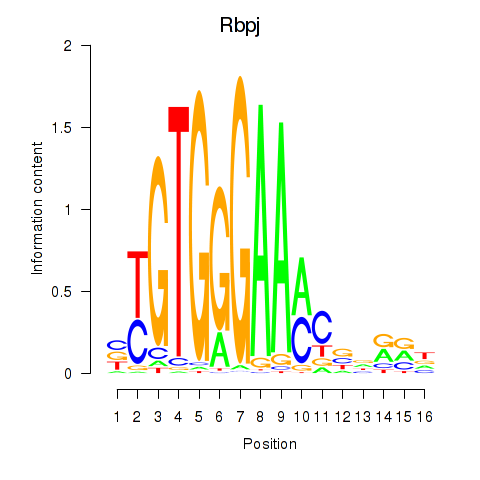
| Rbpj | 2.18 |
|
|
|
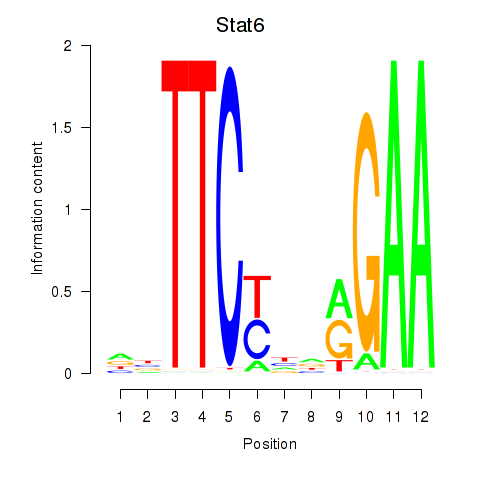
| Stat6 | 2.16 |
|
|
|
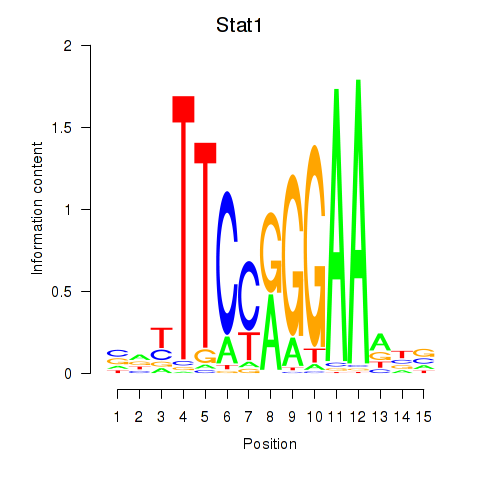
| Stat1 | 2.16 |
|
|
|
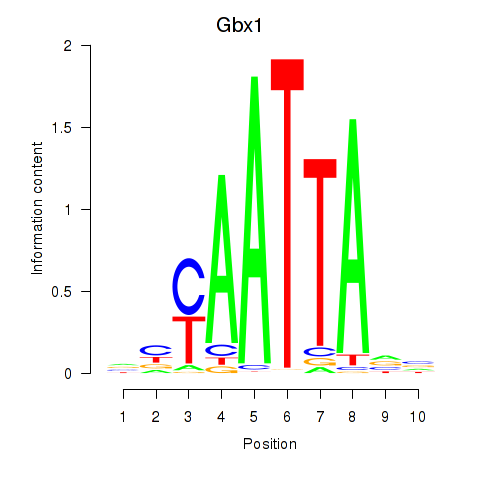
| Gbx1_Nobox_Alx3 | 2.16 |
|
|
|
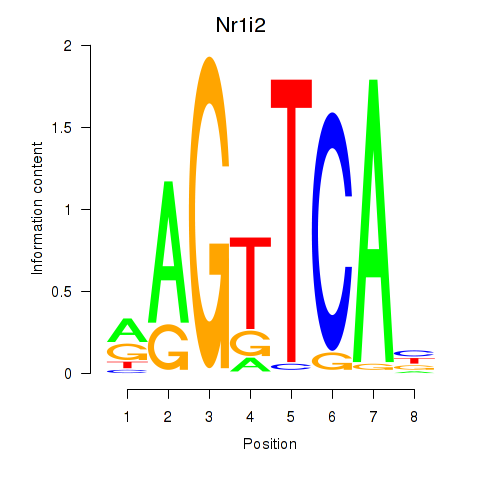
| Nr1i2 | 2.15 |
|
|
|
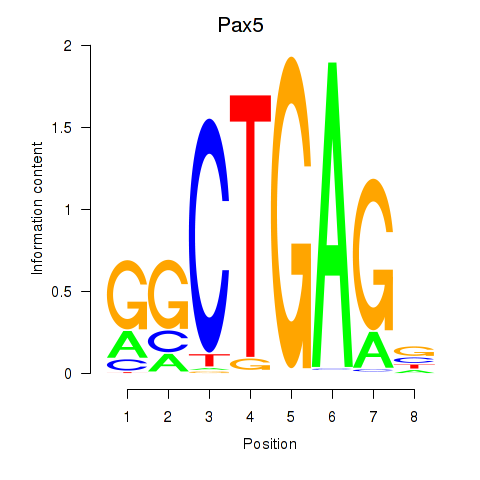
| Pax5 | 2.14 |
|
|
|
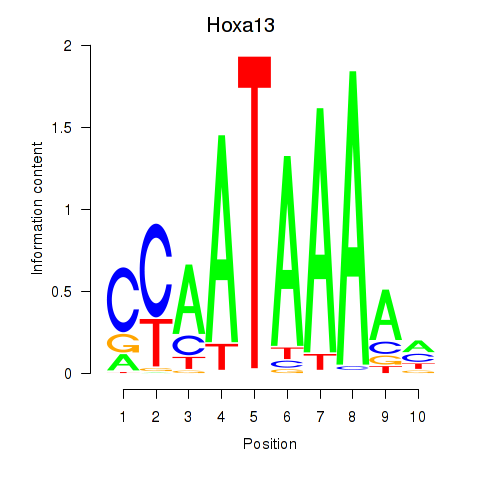
| Hoxa13 | 2.14 |
|
|
|
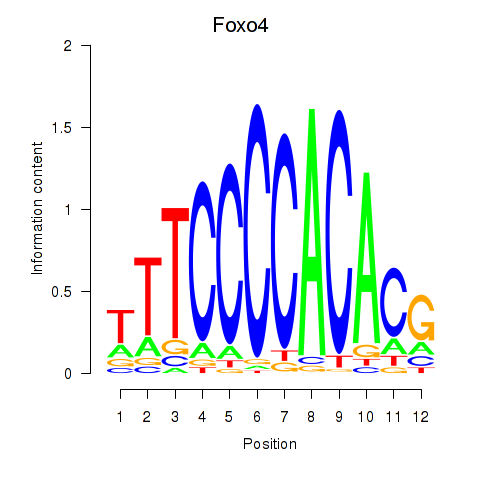
| Foxo4 | 2.14 |
|
|
|
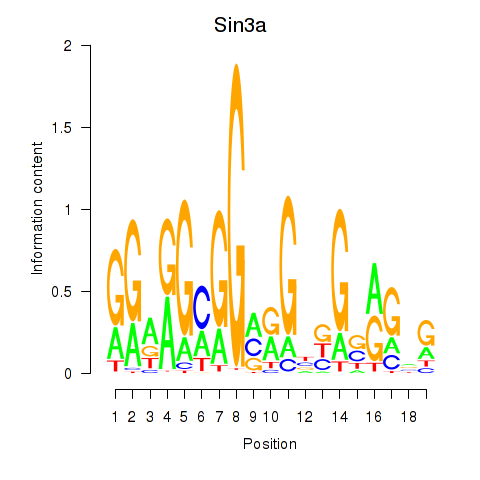
| Sin3a | 2.13 |
|
|
|
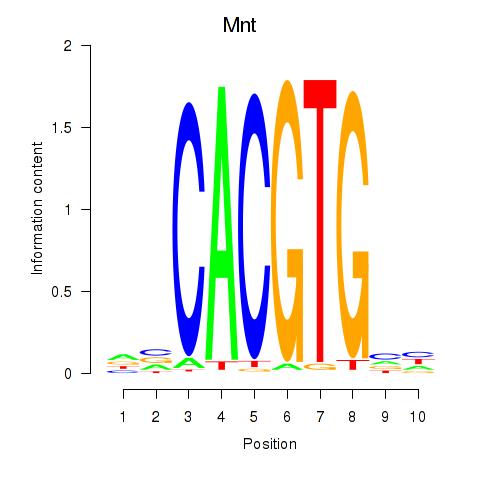
| Mnt | 2.13 |
|
|
|
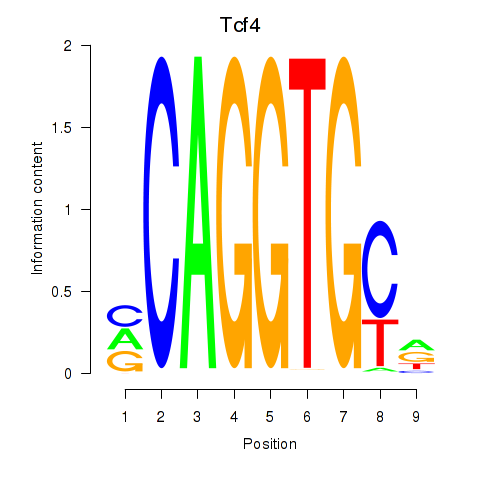
| Tcf4_Mesp1 | 2.13 |
|
|
|
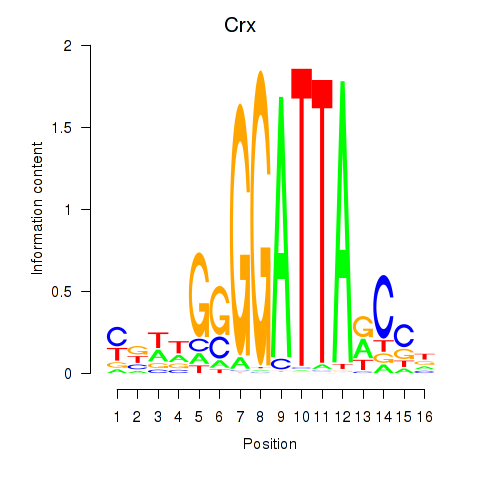
| Crx_Gsc | 2.10 |
|
|
|
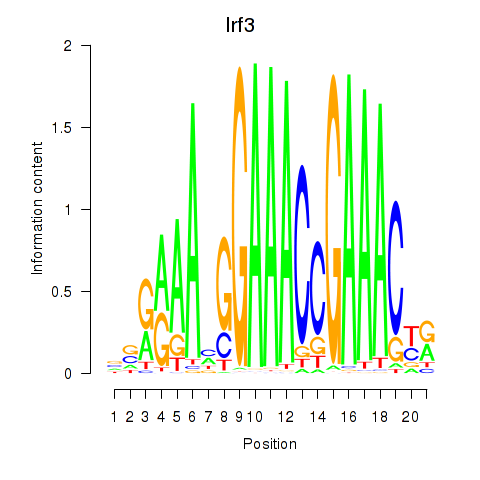
| Irf3 | 2.10 |
|
|
|
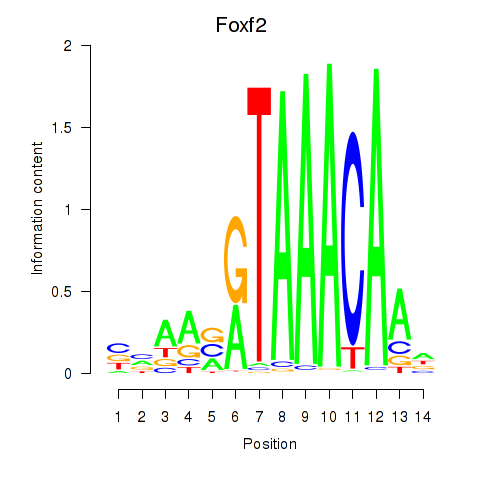
| Foxf2 | 2.09 |
|
|
|
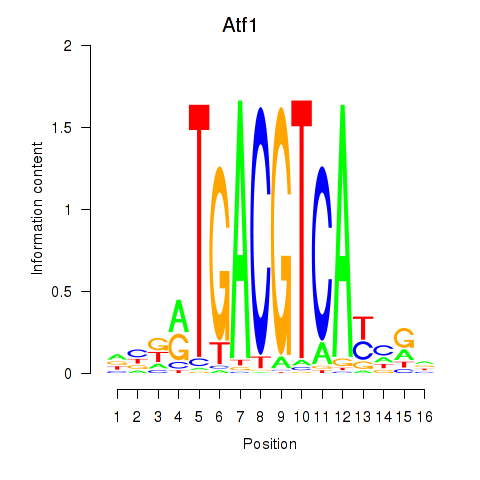
| Atf1_Creb5 | 2.08 |
|
|
|
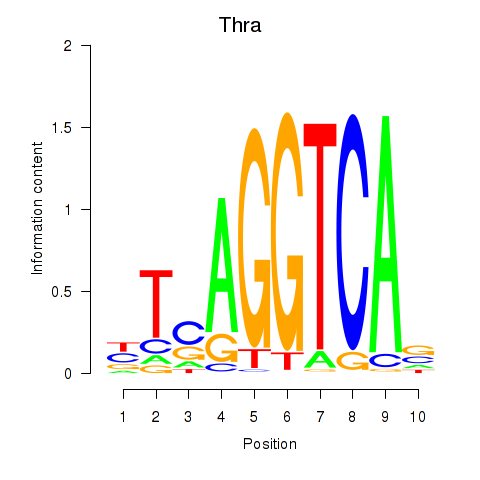
| Thra | 2.04 |
|
|
|
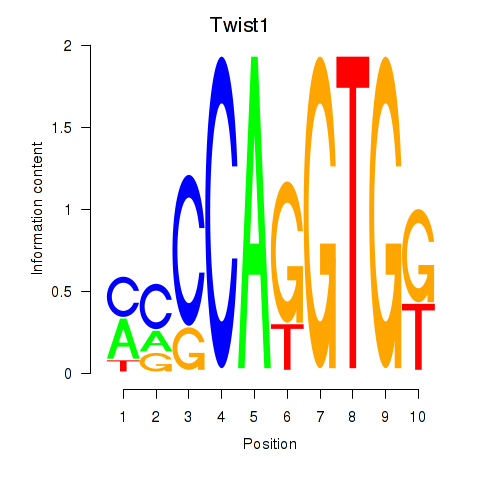
| Twist1 | 2.04 |
|
|
|
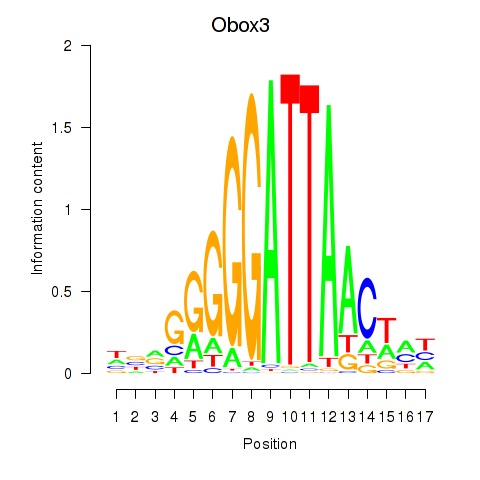
| Obox3 | 2.03 |
|
|
|
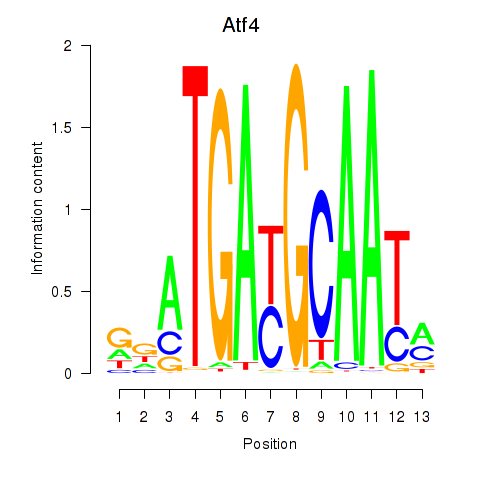
| Atf4 | 2.03 |
|
|
|
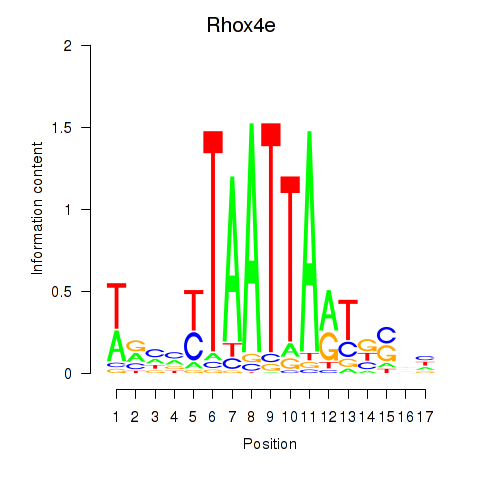
| Rhox4e_Rhox6_Vax2 | 2.02 |
|
|
|
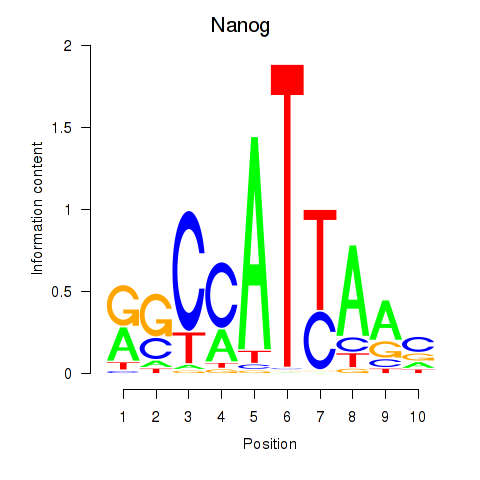
| Nanog | 2.02 |
|
|
|
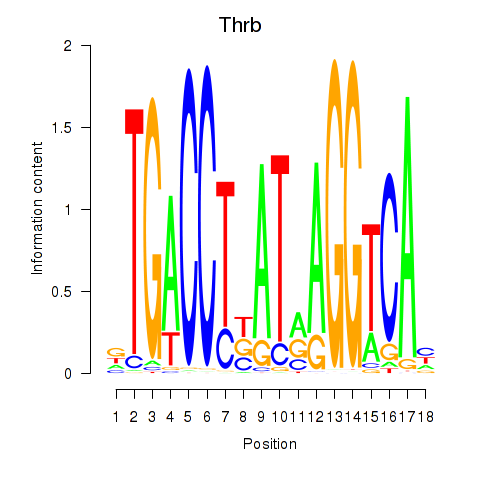
| Thrb | 2.01 |
|
|
|
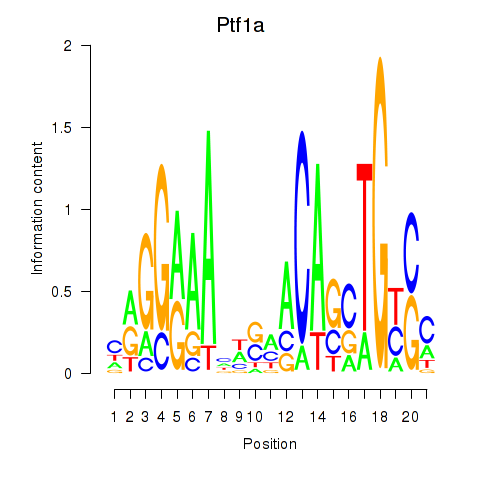
| Ptf1a | 2.00 |
|
|
|
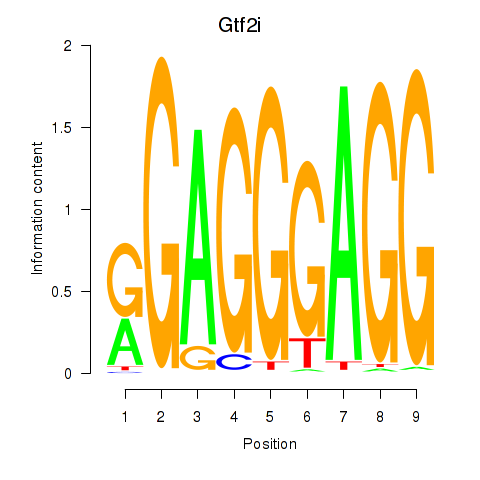
| Gtf2i_Gtf2f1 | 2.00 |
|
|
|
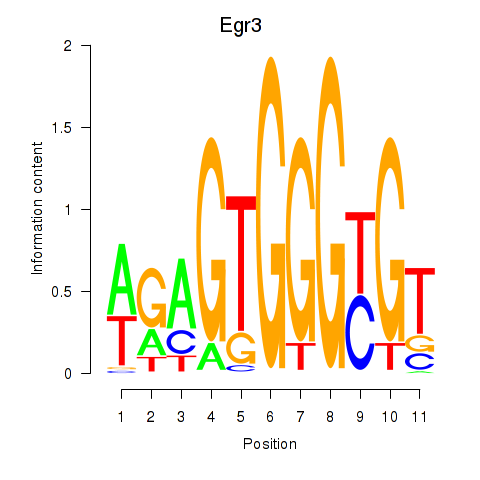
| Egr3 | 1.99 |
|
|
|
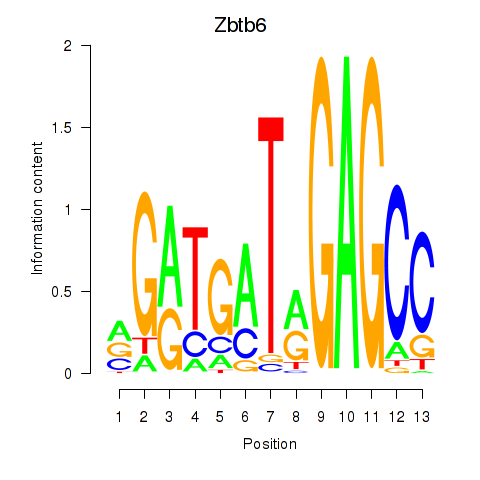
| Zbtb6 | 1.99 |
|
|
|
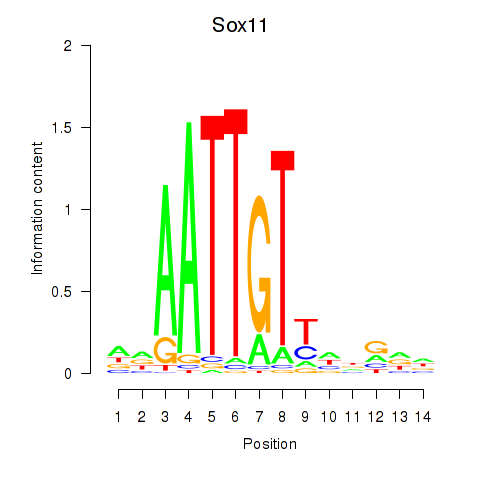
| Sox11 | 1.98 |
|
|
|
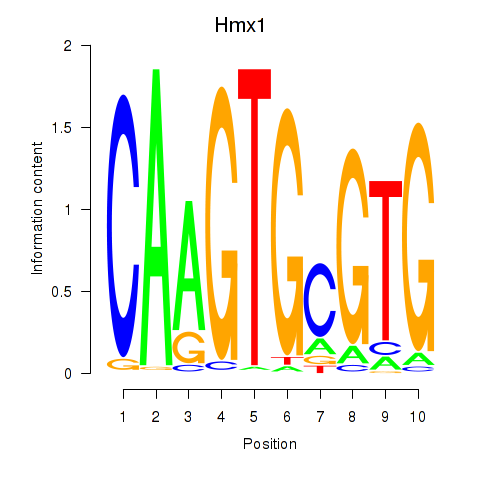
| Hmx1 | 1.98 |
|
|
|
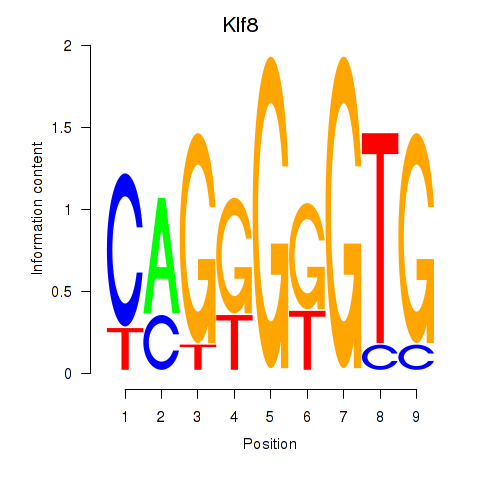
| Klf8 | 1.97 |
|
|
|
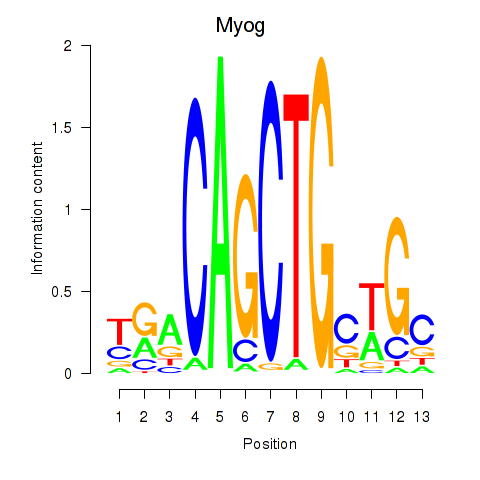
| Myog_Tcf12 | 1.96 |
|
|
|
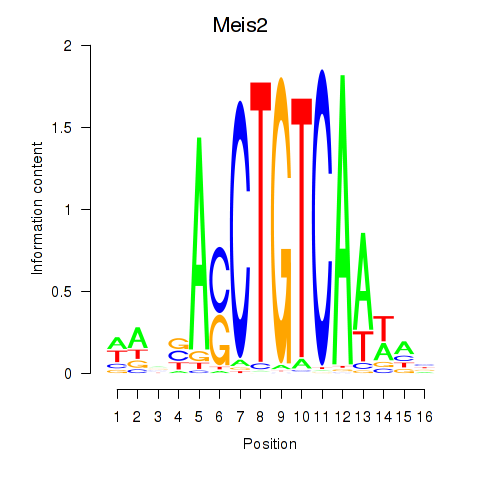
| Meis2 | 1.95 |
|
|
|
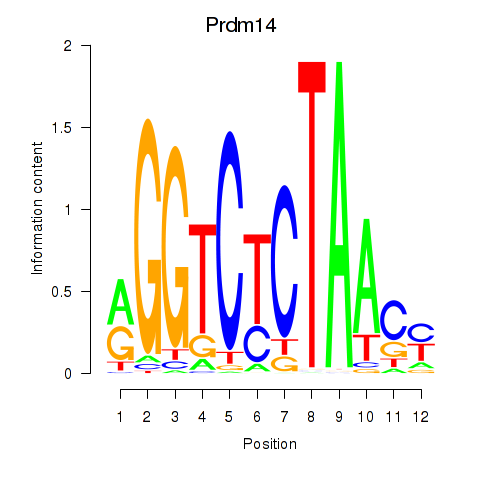
| Prdm14 | 1.93 |
|
|
|
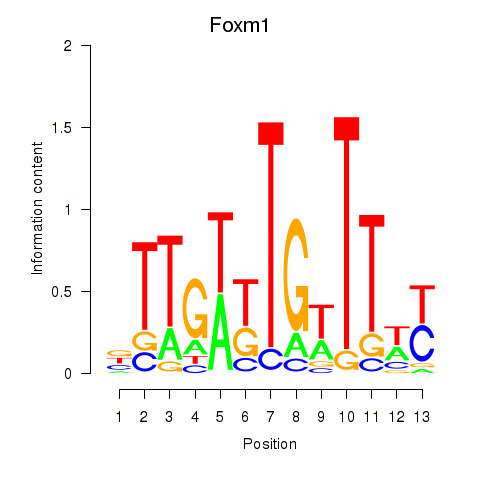
| Foxm1 | 1.93 |
|
|
|
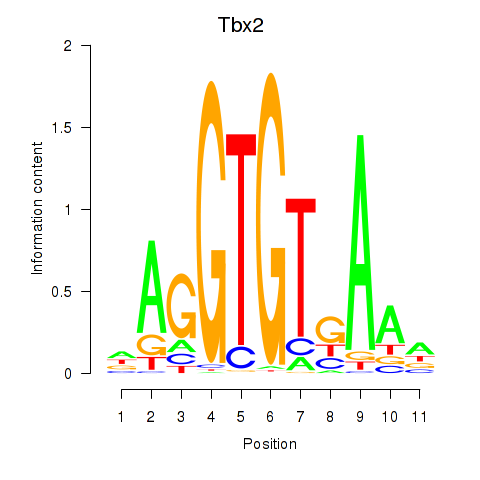
| Tbx2 | 1.93 |
|
|
|
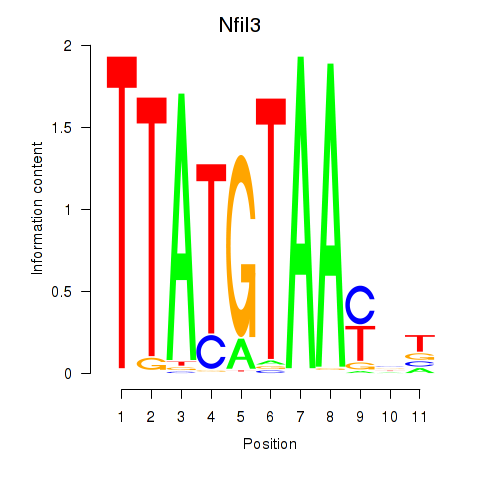
| Nfil3_Tef | 1.92 |
|
|
|
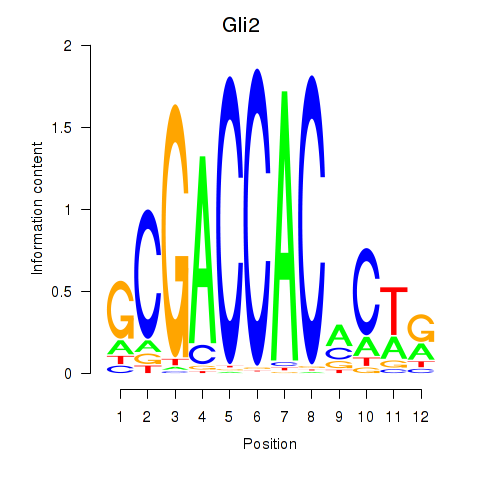
| Gli2 | 1.91 |
|
|
|
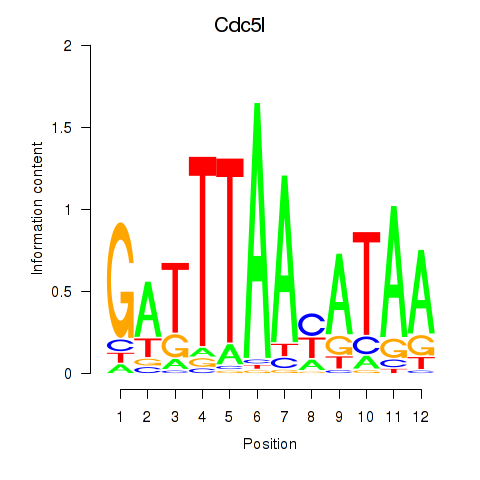
| Cdc5l | 1.91 |
|
|
|
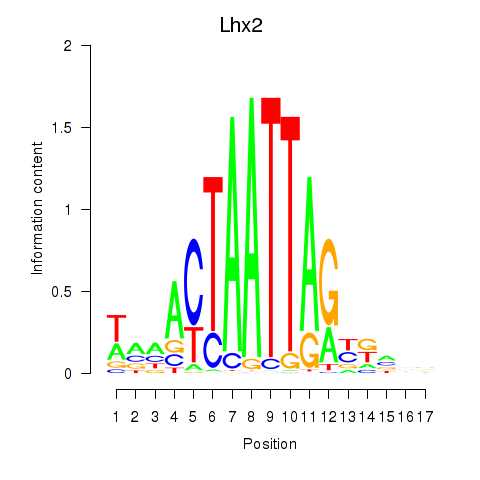
| Lhx2_Hoxc5 | 1.91 |
|
|
|
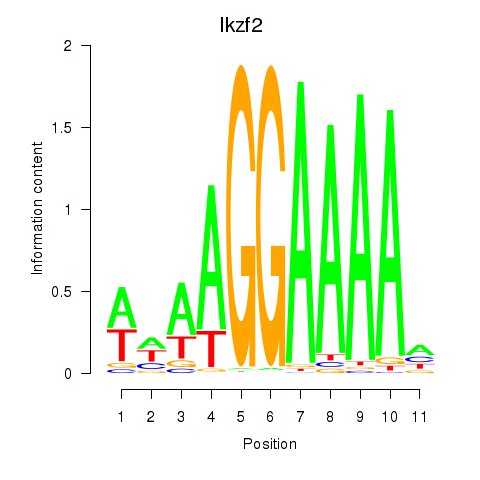
| Ikzf2 | 1.90 |
|
|
|
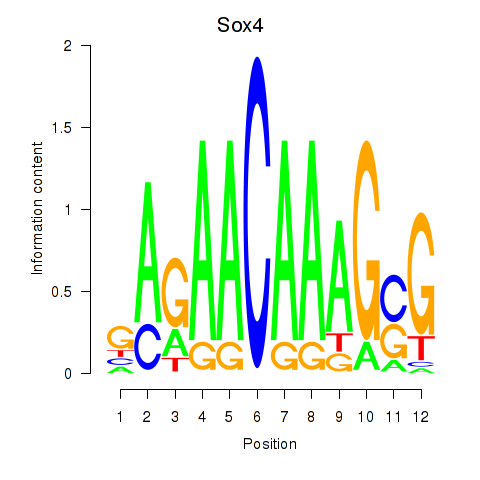
| Sox4 | 1.89 |
|
|
|
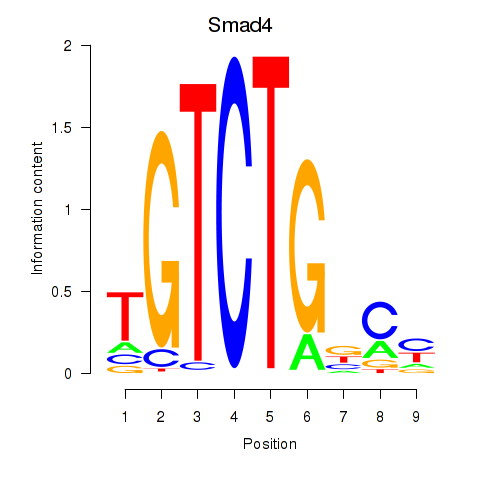
| Smad4 | 1.89 |
|
|
|
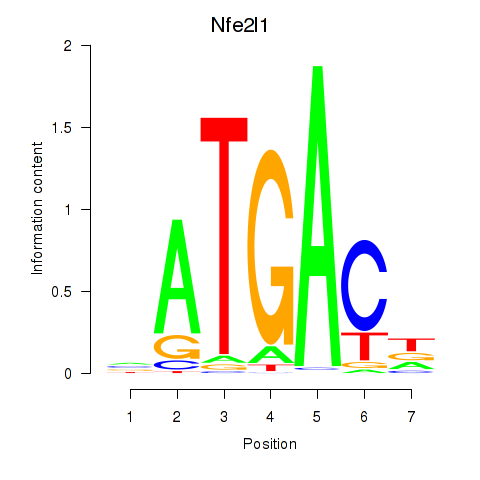
| Nfe2l1_Mafg | 1.89 |
|
|
|
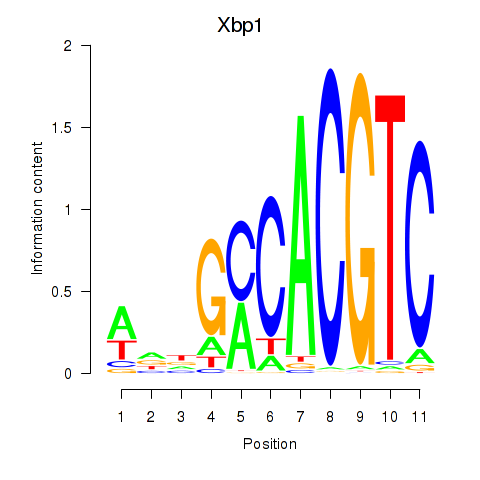
| Xbp1_Creb3l1 | 1.88 |
|
|
|
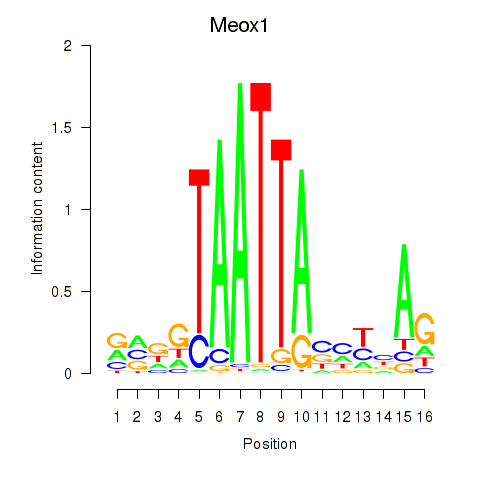
| Meox1 | 1.86 |
|
|
|
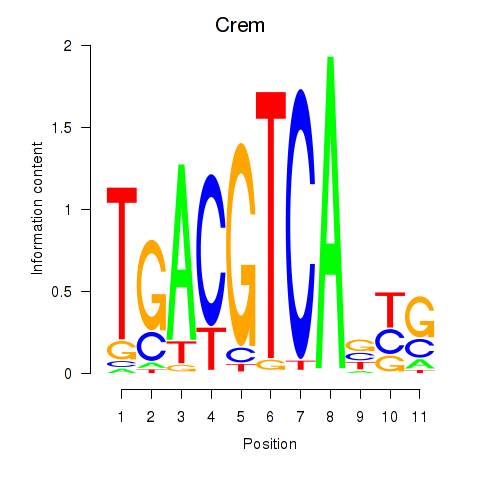
| Crem_Jdp2 | 1.86 |
|
|
|
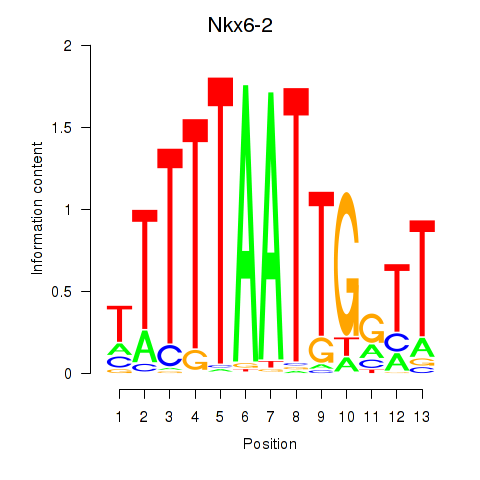
| Nkx6-2 | 1.86 |
|
|
|
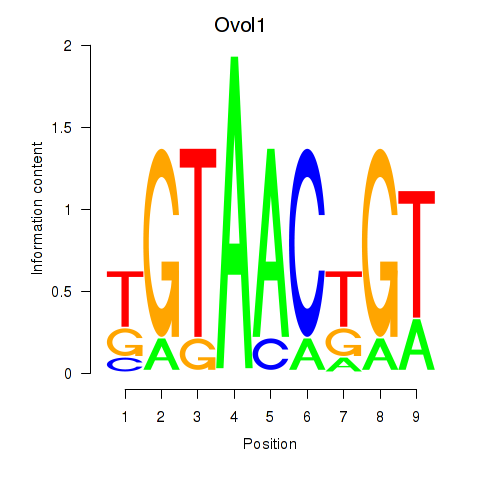
| Ovol1 | 1.85 |
|
|
|
| Mtf1 | 1.85 |
|
|

|
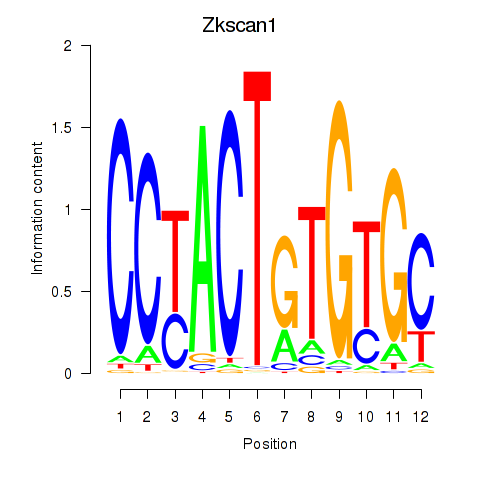
| Zkscan1 | 1.84 |
|
|
|
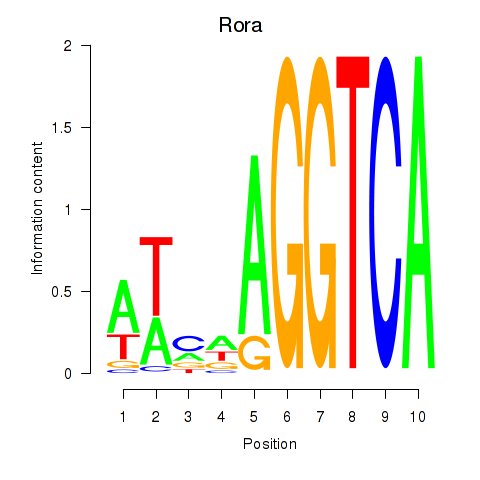
| Rora | 1.83 |
|
|
|
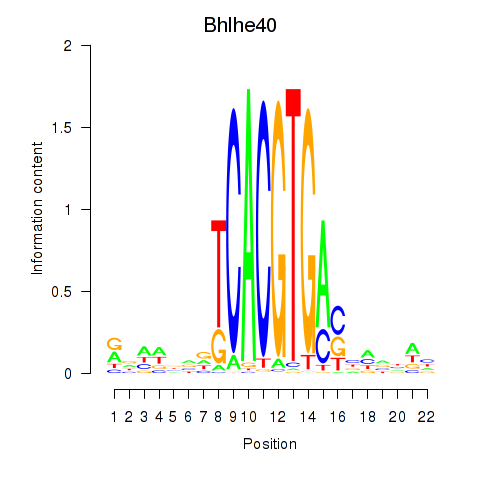
| Bhlhe40 | 1.82 |
|
|
|
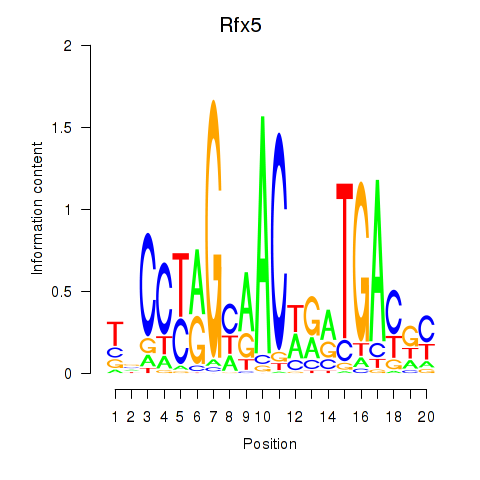
| Rfx5 | 1.82 |
|
|
|
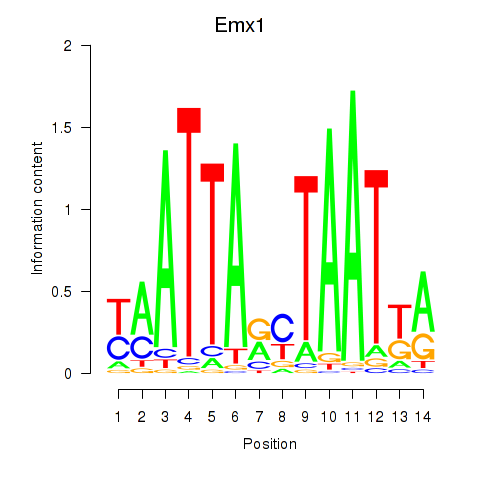
| Emx1_Emx2 | 1.80 |
|
|
|
| Sox7 | 1.80 |
|
|
|
| Hsf4 | 1.80 |
|
|
|
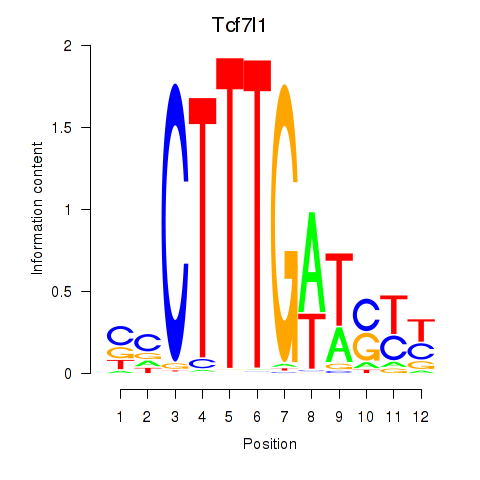
| Tcf7l1 | 1.79 |
|
|
|
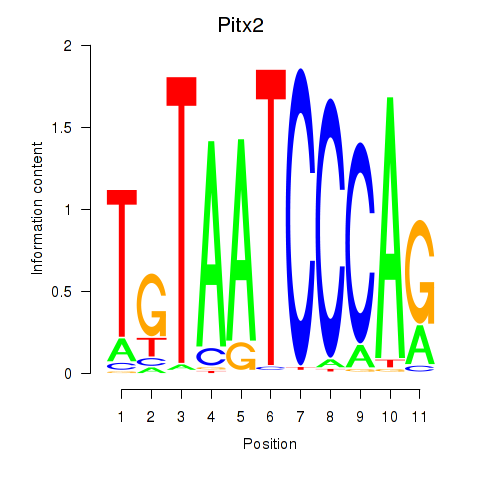
| Pitx2_Otx2 | 1.79 |
|
|
|
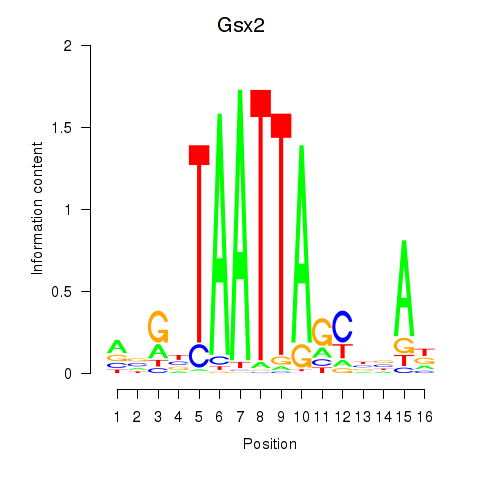
| Gsx2_Hoxd3_Vax1 | 1.78 |
|
|
|
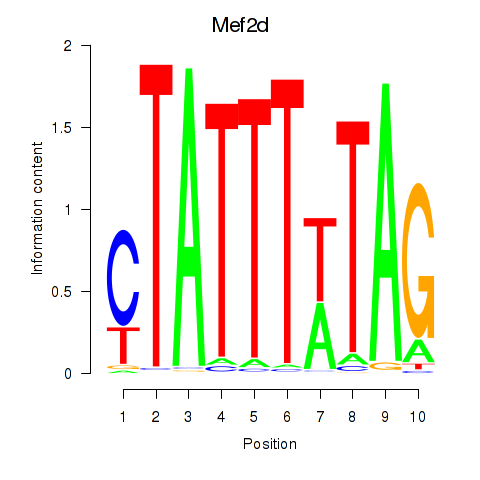
| Mef2d_Mef2a | 1.78 |
|
|
|
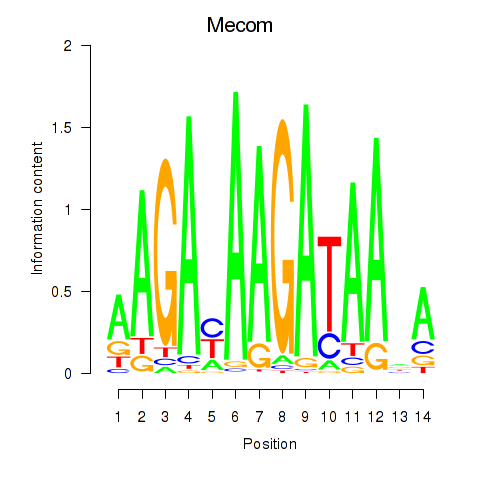
| Mecom | 1.77 |
|
|
|
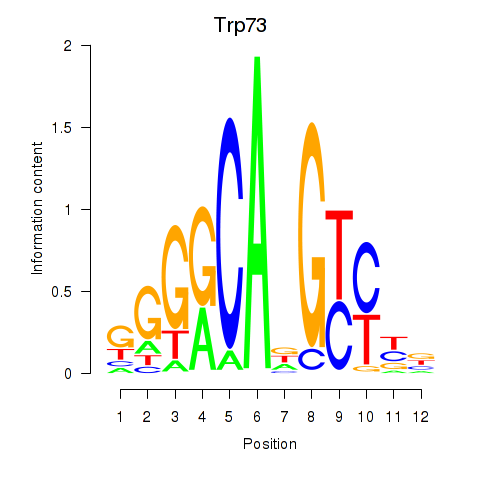
| Trp73 | 1.77 |
|
|
|
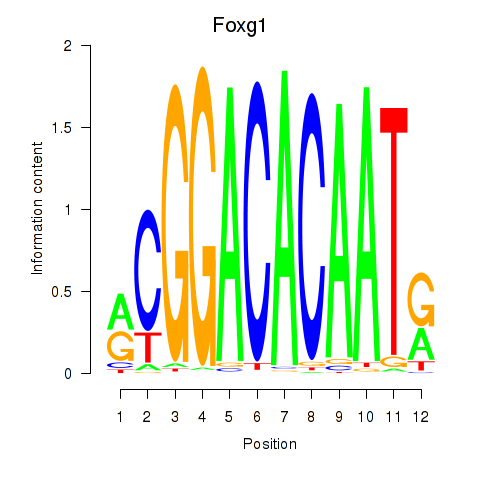
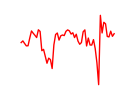
| Foxg1 | 1.76 |
|
|
|
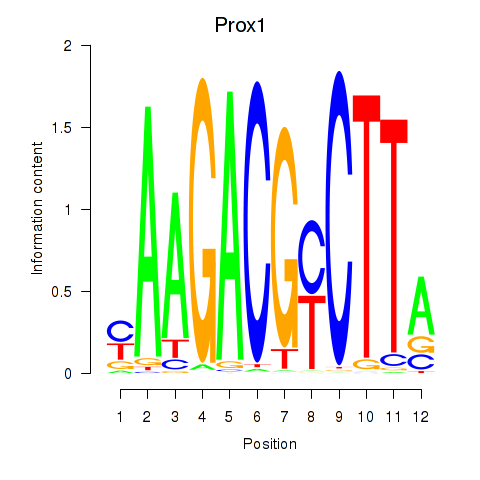
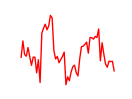
| Prox1 | 1.73 |
|
|
|
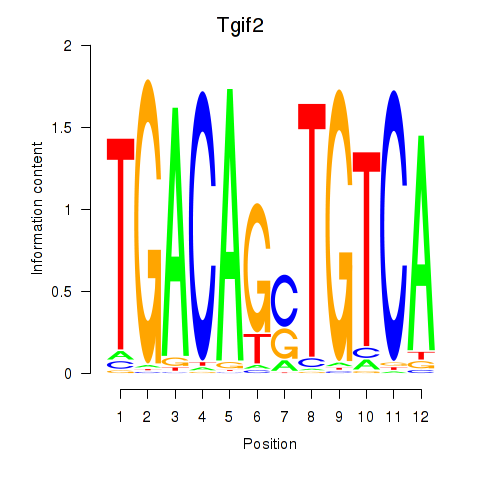
| Tgif2_Tgif2lx1_Tgif2lx2 | 1.73 |
|
|
|
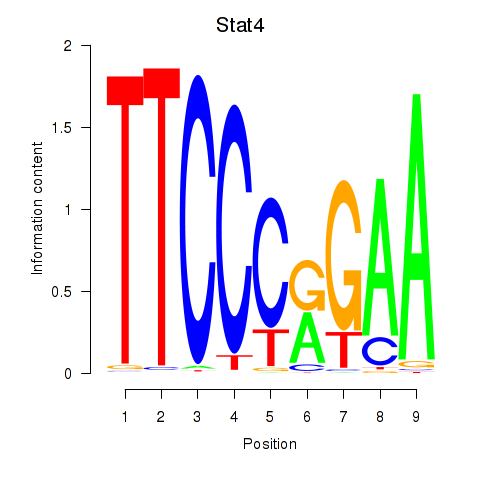
| Stat4_Stat3_Stat5b | 1.73 |
|
|
|
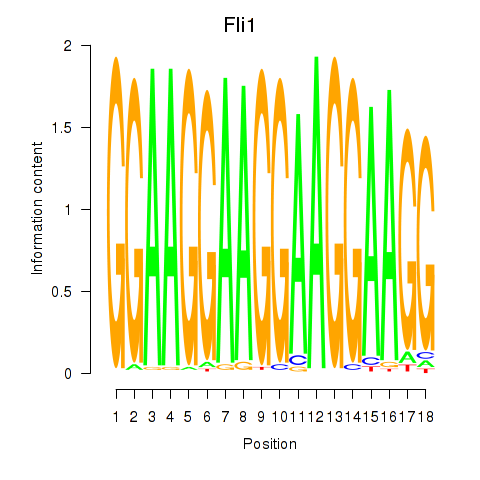
| Fli1 | 1.72 |
|
|
|
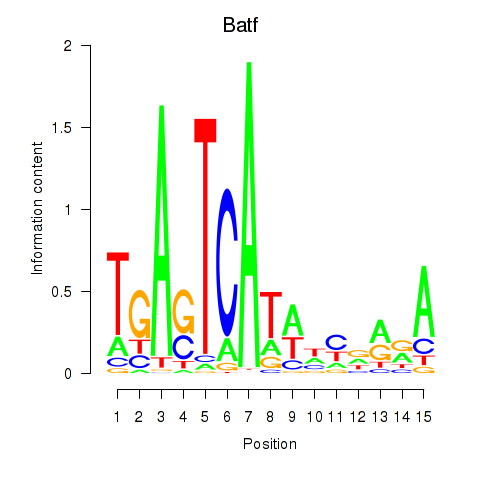
| Batf | 1.72 |
|
|
|
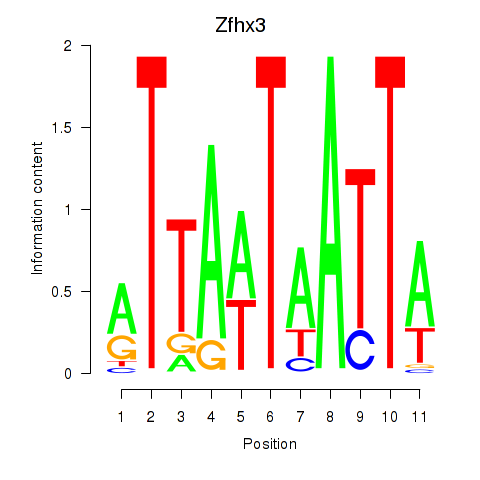
| Zfhx3 | 1.72 |
|
|
|
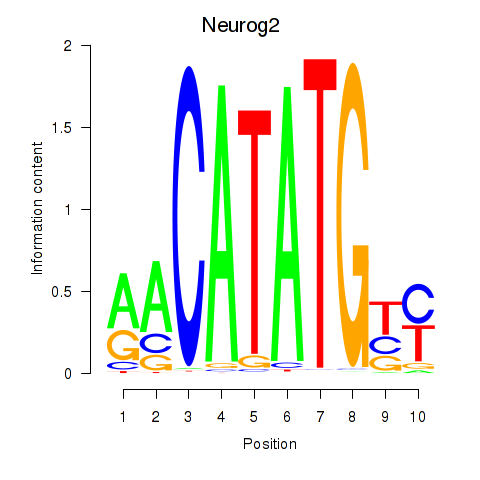
| Neurog2 | 1.71 |
|
|
|
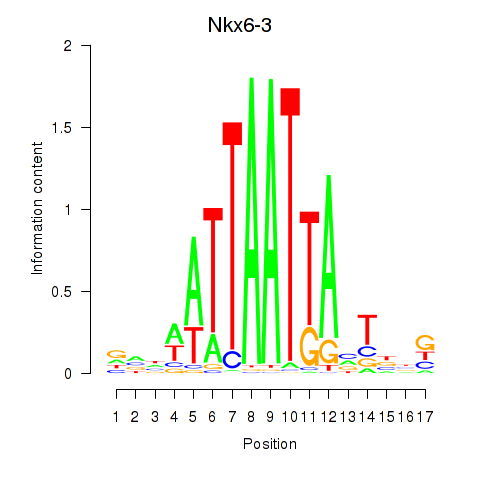
| Nkx6-3_Dbx2_Barx2 | 1.71 |
|
|
|
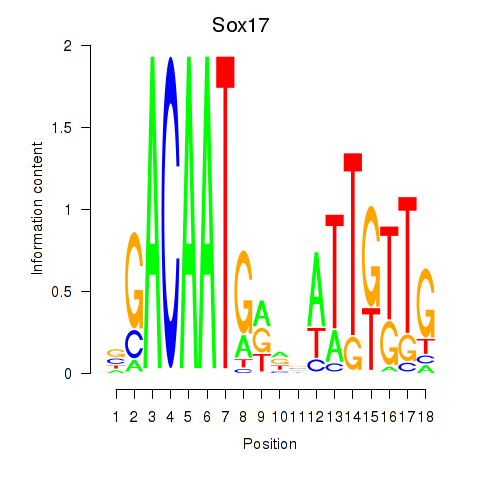
| Sox17 | 1.71 |
|
|
|
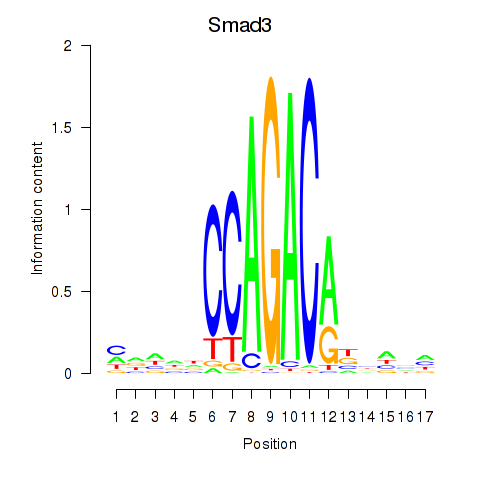
| Smad3 | 1.71 |
|
|
|
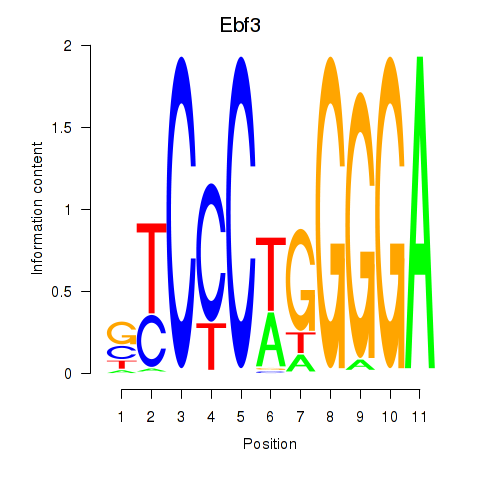
| Ebf3 | 1.67 |
|
|
|
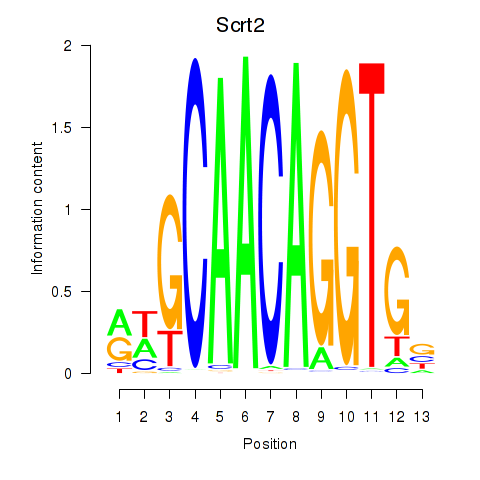
| Scrt2 | 1.67 |
|
|
|
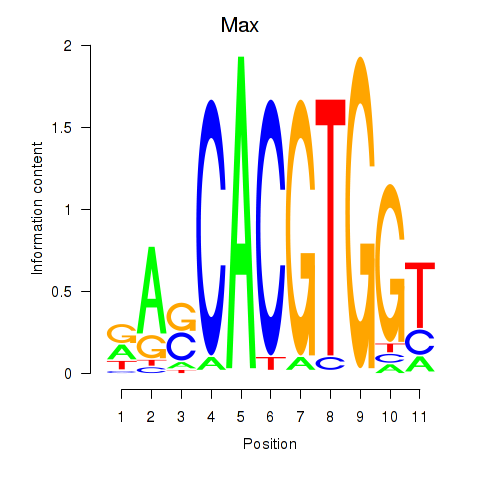
| Max_Mycn | 1.67 |
|
|
|
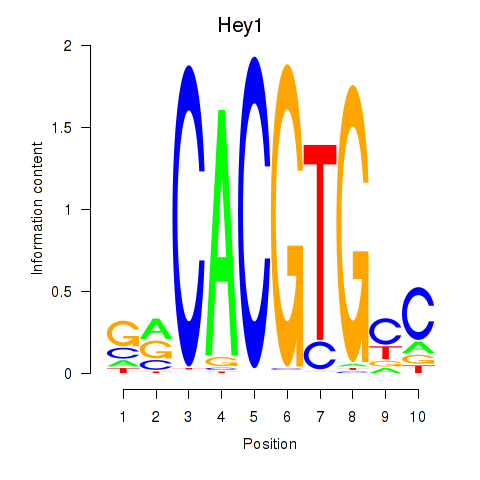
| Hey1_Myc_Mxi1 | 1.65 |
|
|
|
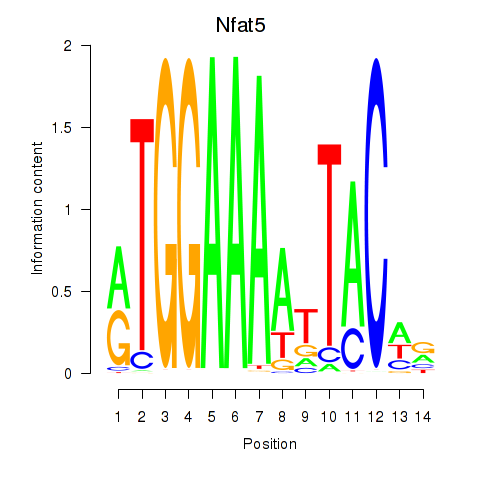
| Nfat5 | 1.65 |
|
|
|
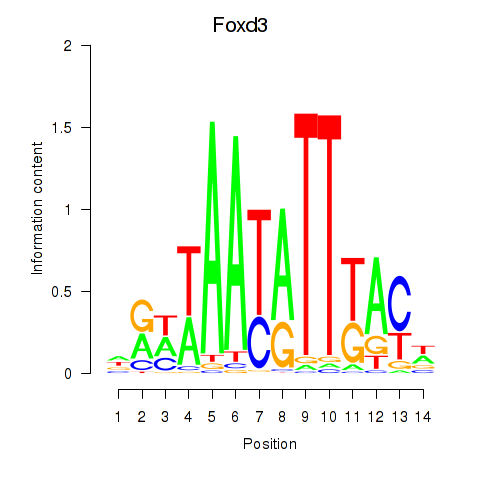
| Foxd3 | 1.64 |
|
|
|
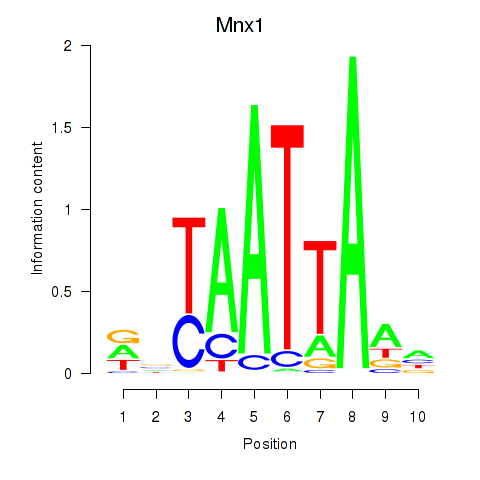
| Mnx1_Lhx6_Lmx1a | 1.64 |
|
|
|
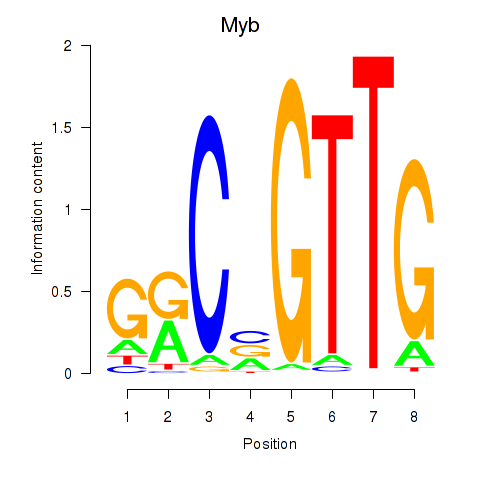
| Myb | 1.63 |
|
|
|
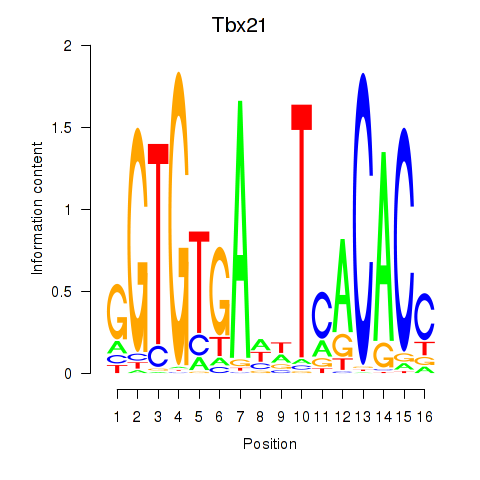
| Tbx21 | 1.63 |
|
|
|
| Zbtb4 | 1.62 |
|
|
|
| Zbtb14 | 1.61 |
|
|
|
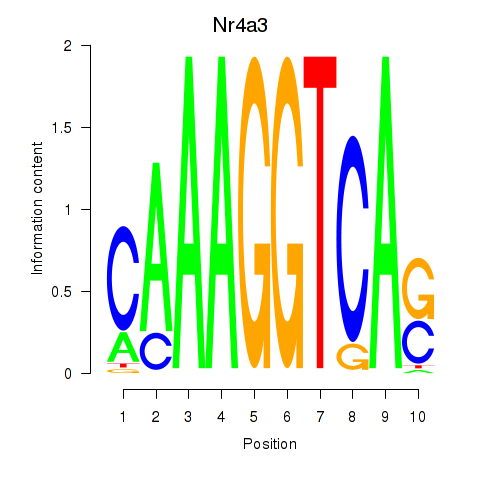
| Nr4a3 | 1.60 |
|
|
|
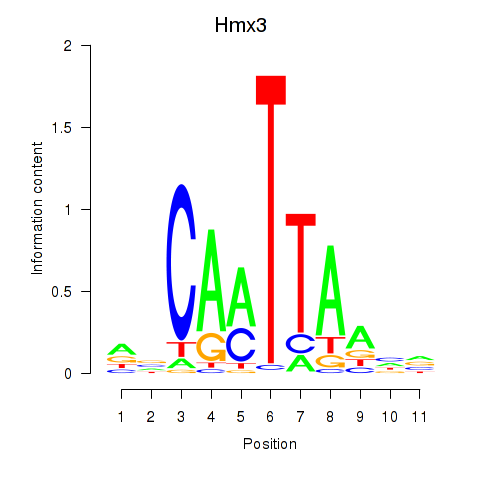
| Hmx3 | 1.59 |
|
|
|
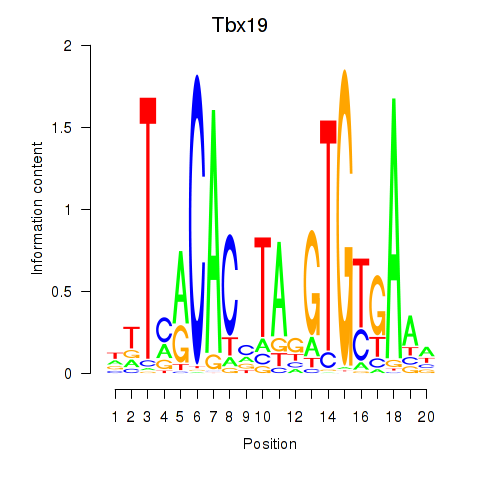
| Tbx19 | 1.59 |
|
|
|
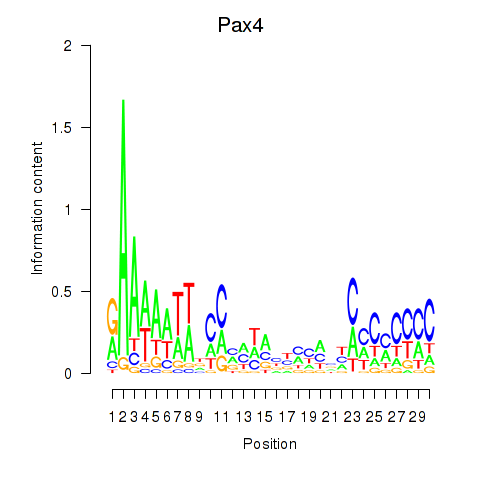
| Pax4 | 1.58 |
|
|
|
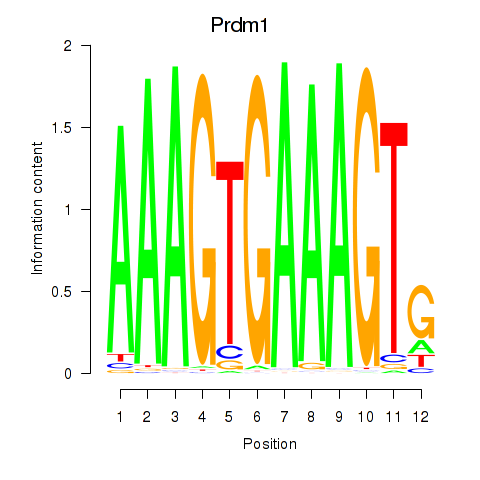
| Prdm1 | 1.58 |
|
|
|
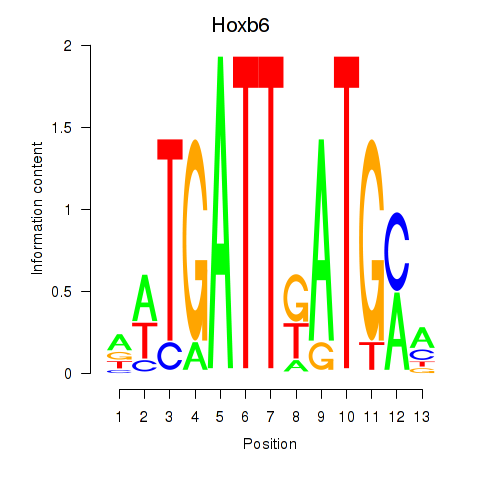
| Hoxb6 | 1.58 |
|
|
|
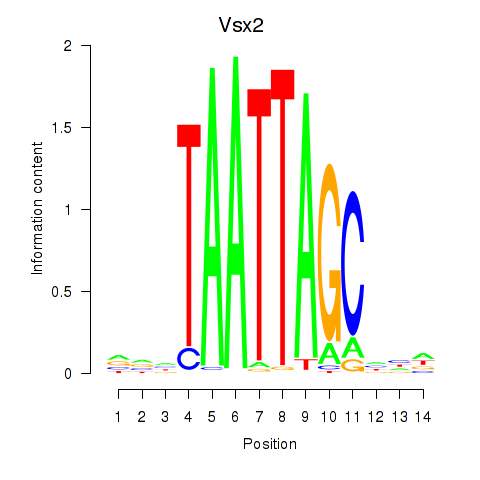
| Vsx2_Dlx3 | 1.58 |
|
|
|
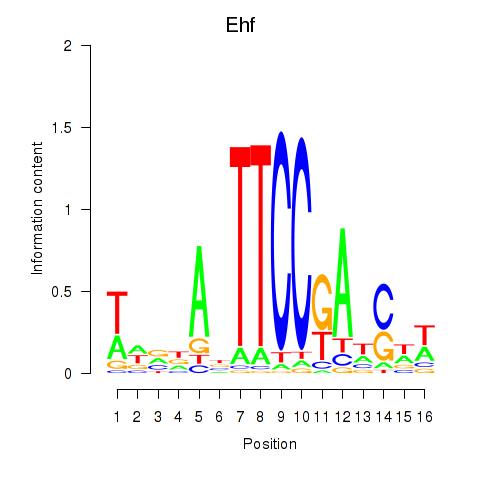
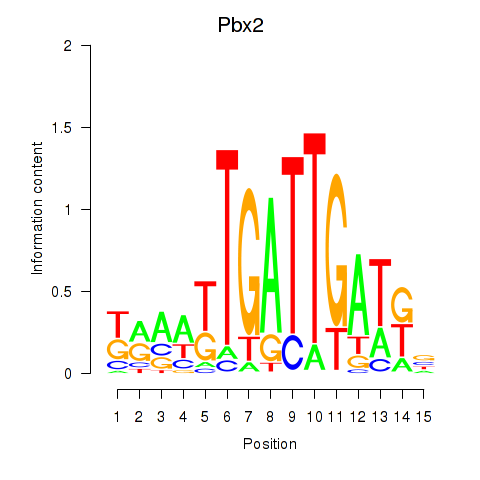
| Ehf | 1.57 |
|
|
|
| Pbx2 | 1.57 |
|
|
|
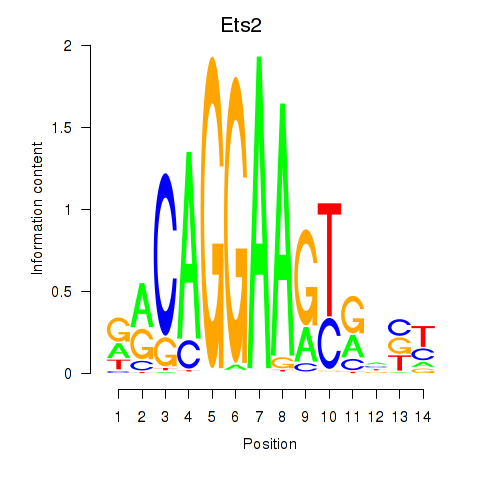
| Ets2 | 1.57 |
|
|
|
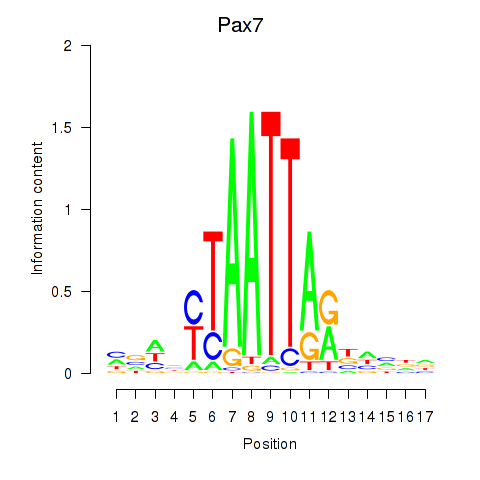
| Pax7 | 1.57 |
|
|
|
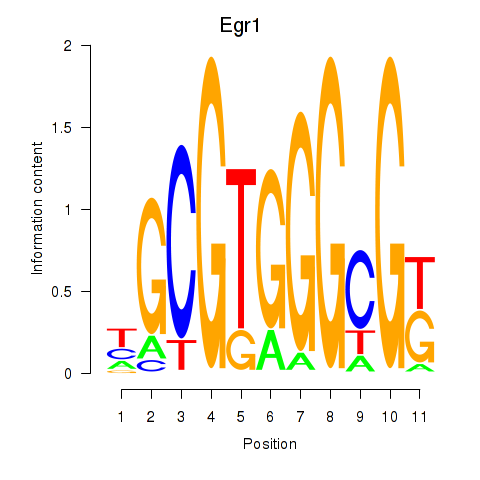
| Egr1 | 1.57 |
|
|
|
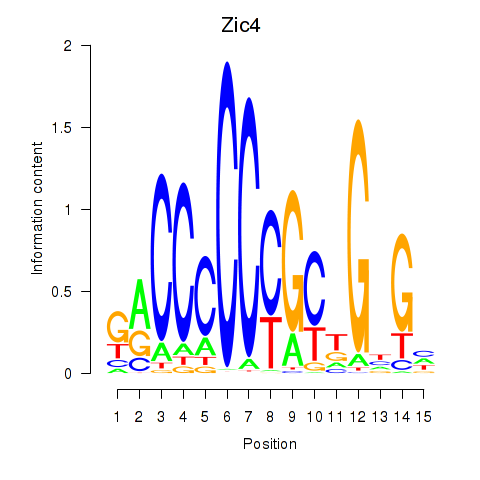
| Zic4 | 1.56 |
|
|
|
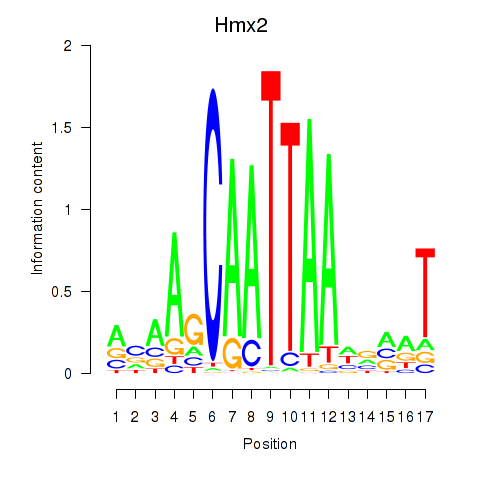
| Hmx2 | 1.55 |
|
|
|
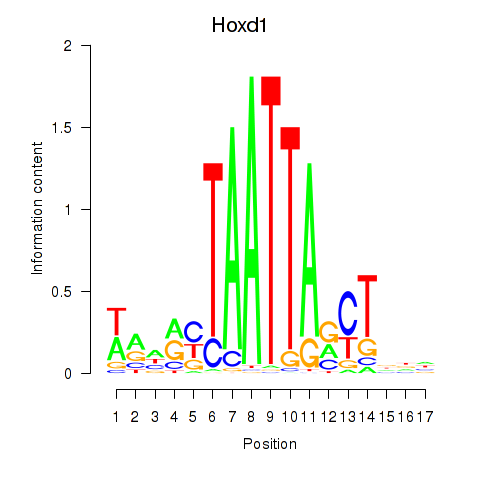
| Hoxd1 | 1.54 |
|
|
|
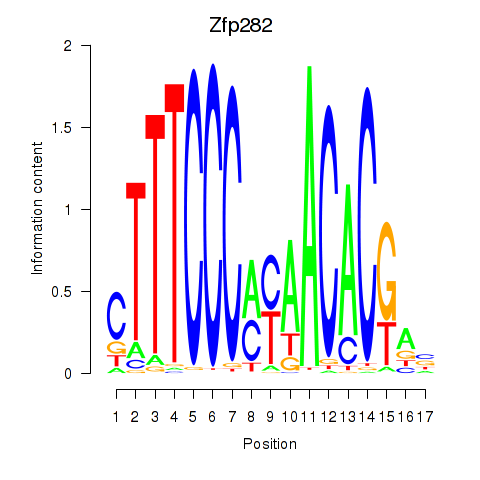
| Zfp282 | 1.53 |
|
|
|
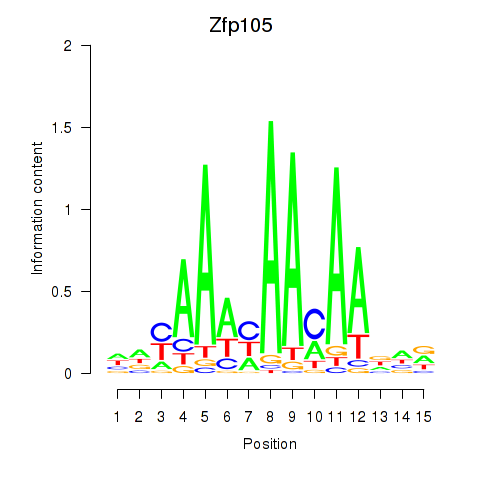
| Zfp105 | 1.53 |
|
|
|
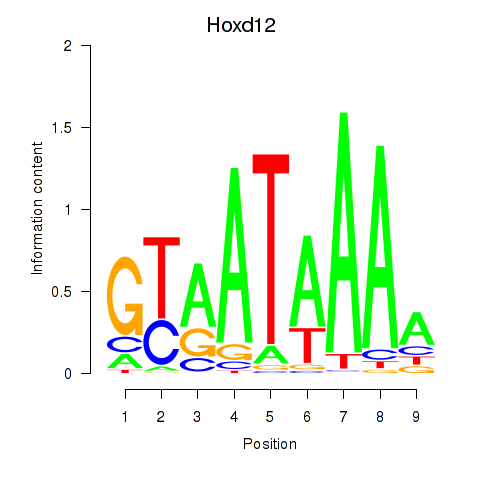
| Hoxd12 | 1.52 |
|
|
|
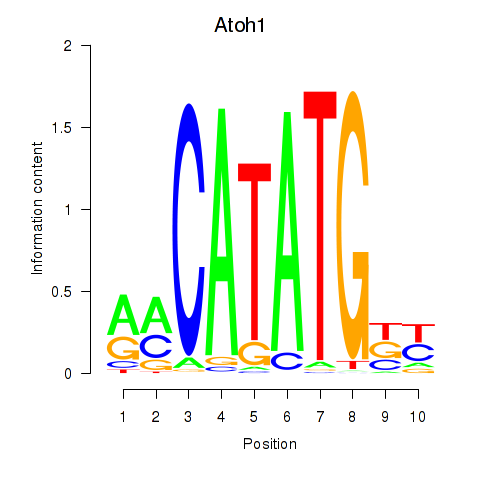
| Atoh1_Bhlhe23 | 1.52 |
|
|
|
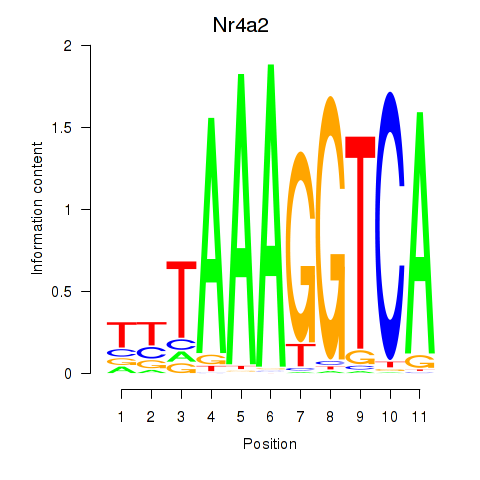
| Nr4a2 | 1.51 |
|
|
|
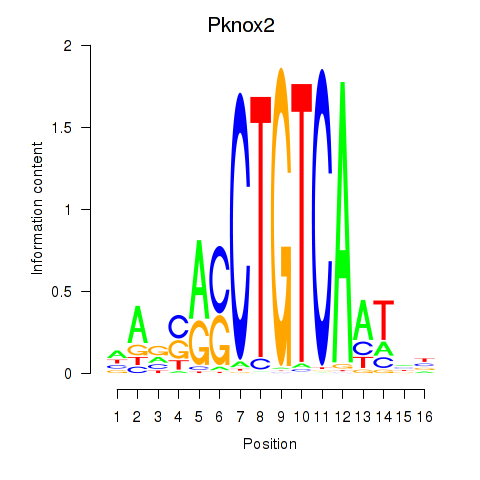
| Pknox2_Pknox1 | 1.50 |
|
|
|
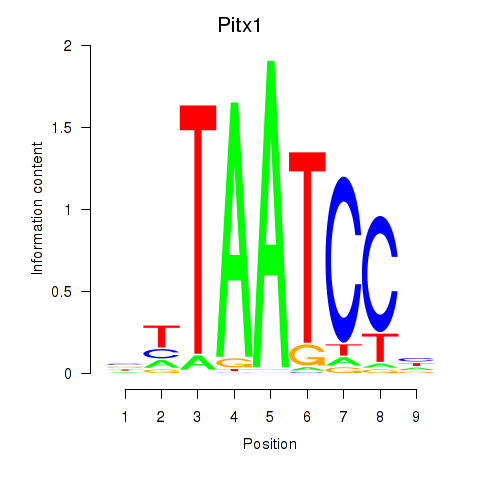
| Pitx1 | 1.50 |
|
|
|
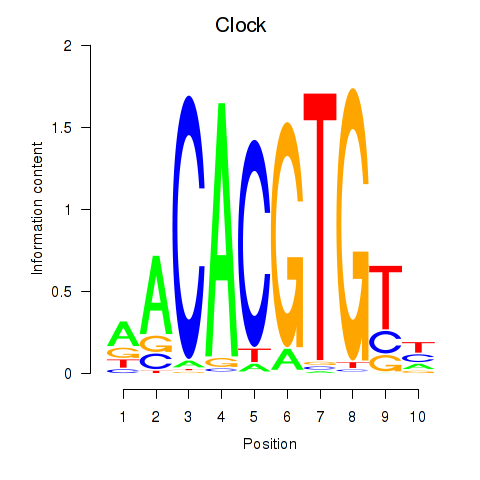
| Clock | 1.49 |
|
|
|
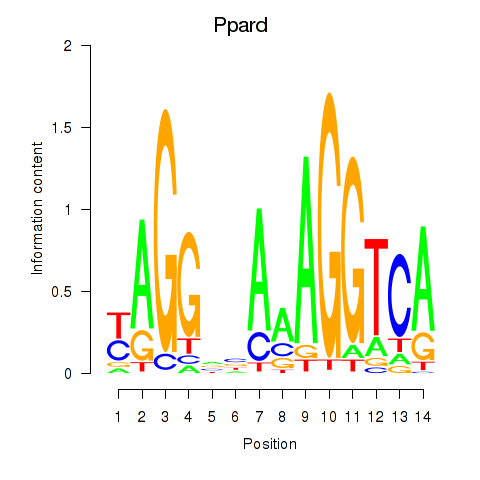
| Ppard | 1.49 |
|
|
|
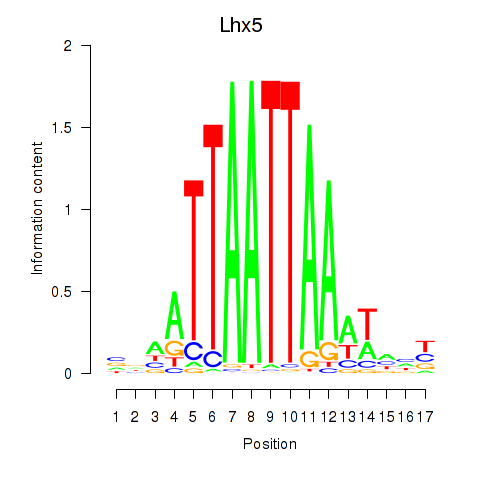
| Lhx5_Lmx1b_Lhx1 | 1.46 |
|
|
|
| Hoxb5 | 1.45 |
|
|

|
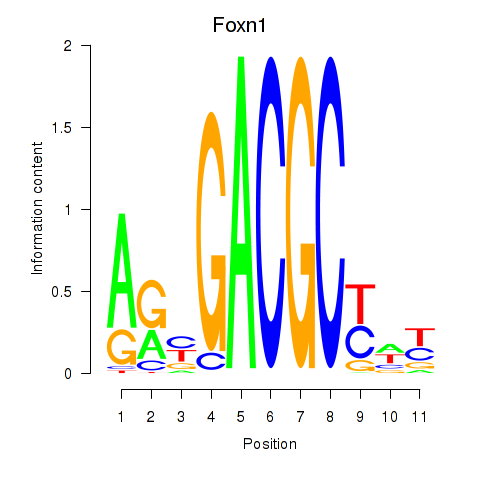
| Foxn1 | 1.44 |
|
|
|
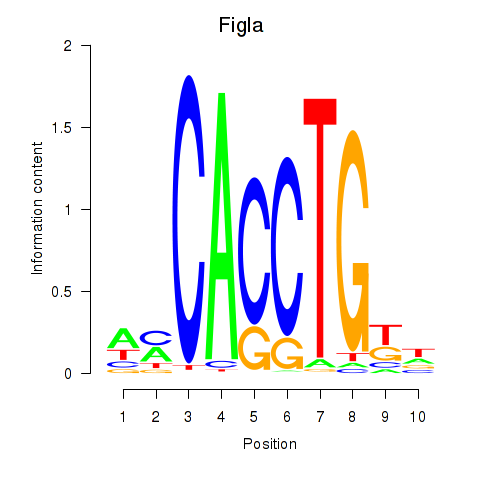
| Figla | 1.44 |
|
|
|
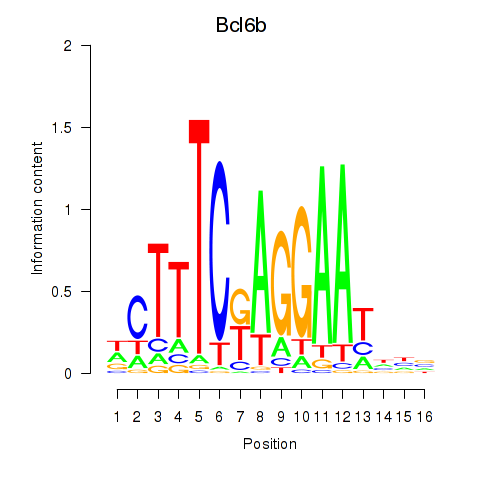
| Bcl6b | 1.44 |
|
|
|
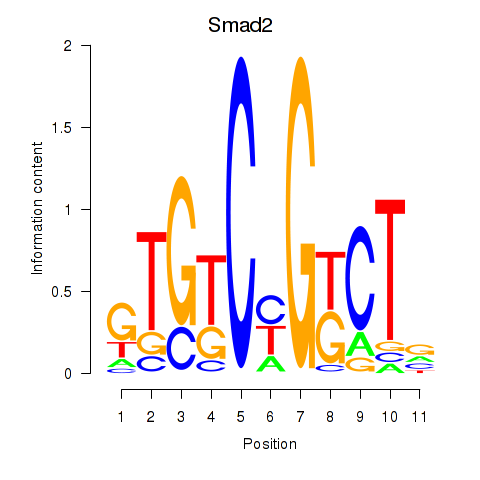
| Smad2 | 1.43 |
|
|
|
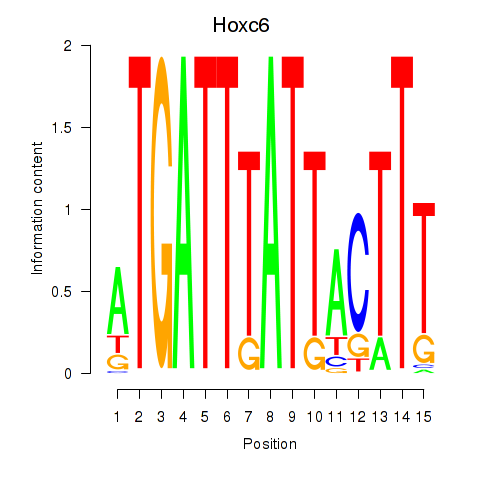
| Hoxc6 | 1.43 |
|
|
|
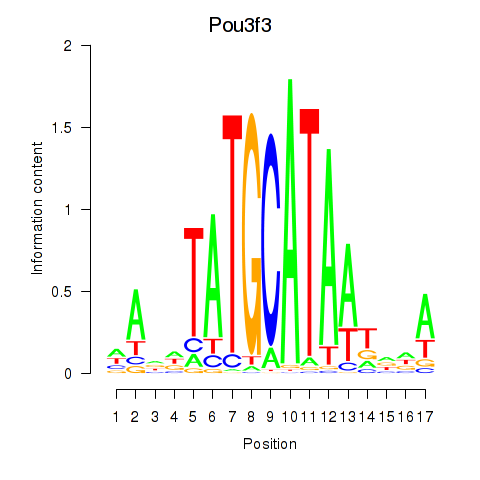
| Pou3f3 | 1.43 |
|
|
|
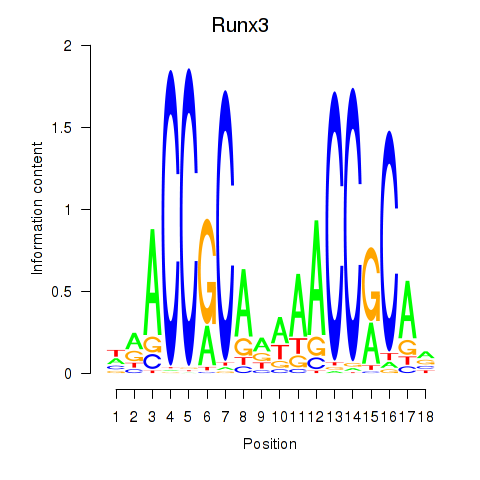
| Runx3 | 1.43 |
|
|
|
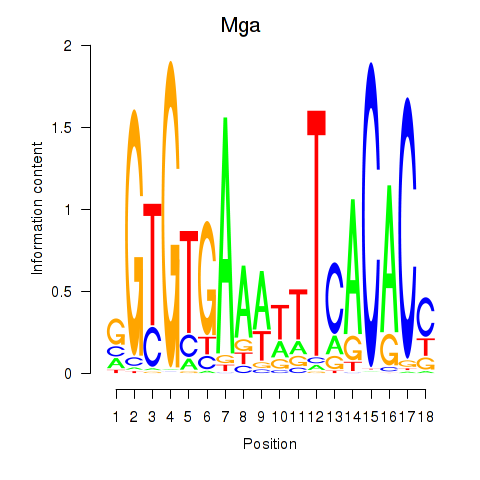
| Mga | 1.42 |
|
|
|
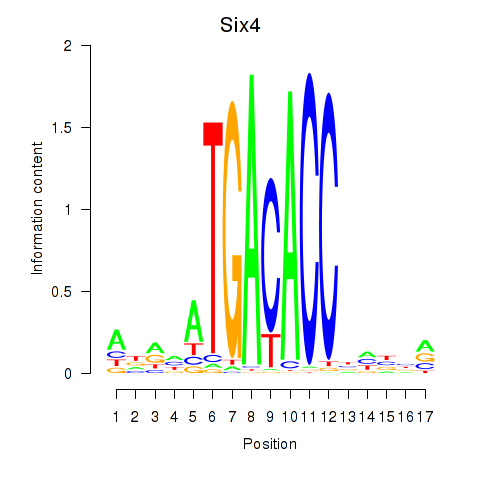
| Six4 | 1.42 |
|
|
|
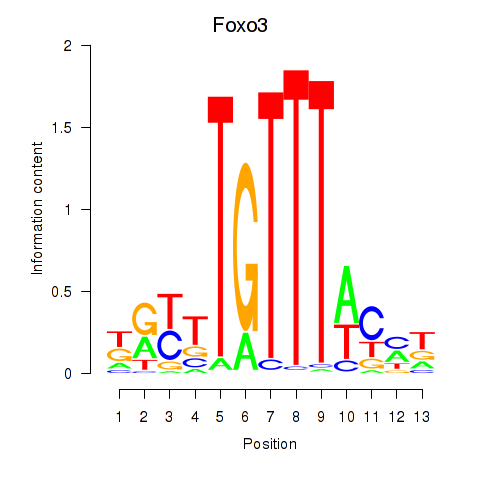
| Foxo3 | 1.42 |
|
|
|
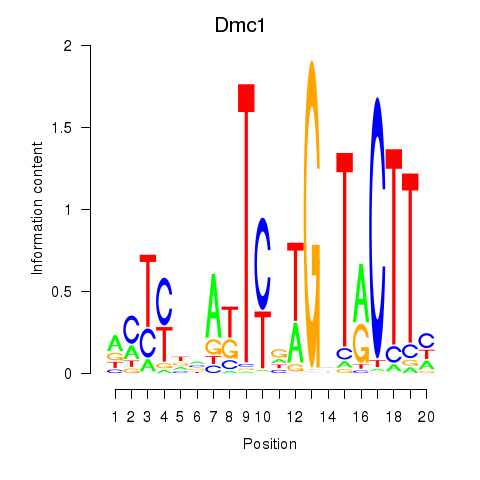
| Dmc1 | 1.42 |
|
|
|
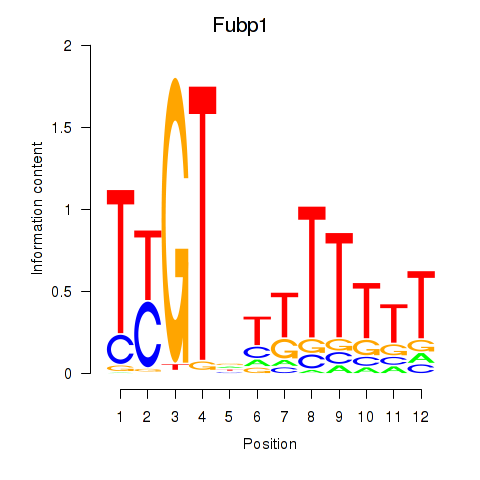
| Fubp1 | 1.41 |
|
|
|
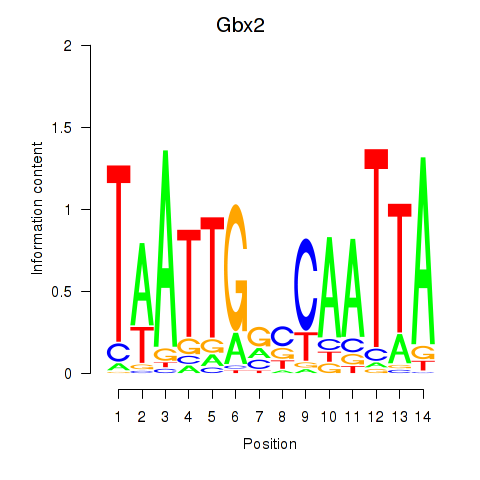
| Gbx2 | 1.41 |
|
|
|
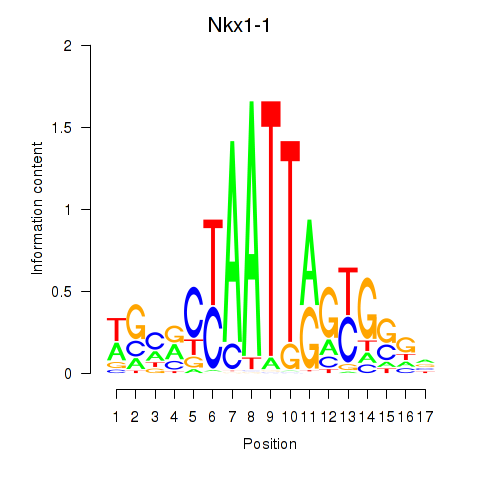
| Nkx1-1_Nkx1-2 | 1.41 |
|
|
|
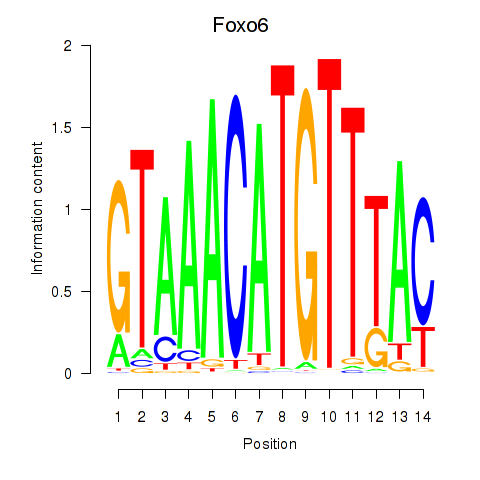
| Foxo6 | 1.38 |
|
|
|
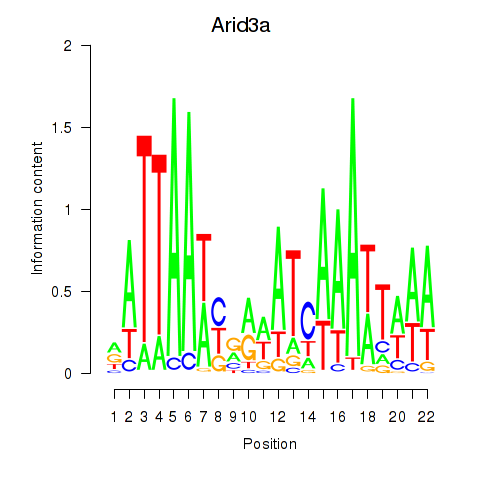
| Arid3a | 1.37 |
|
|
|
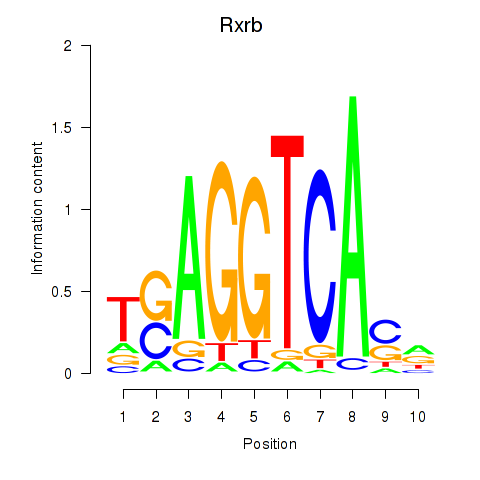
| Rxrb | 1.36 |
|
|
|
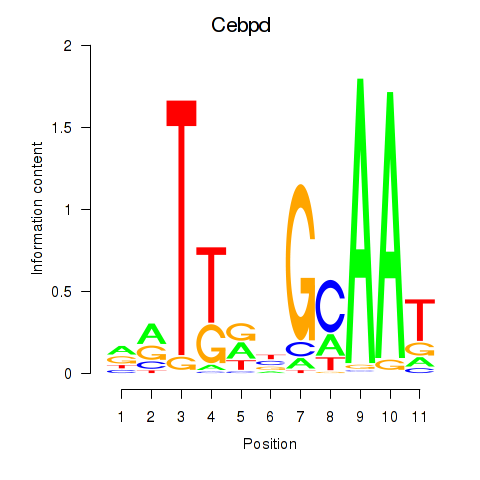
| Cebpd | 1.36 |
|
|
|
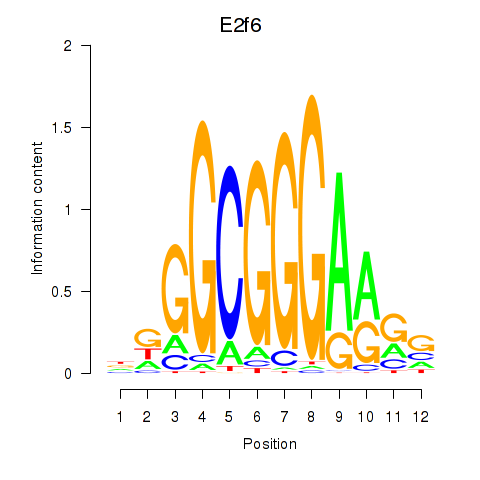
| E2f6 | 1.36 |
|
|
|
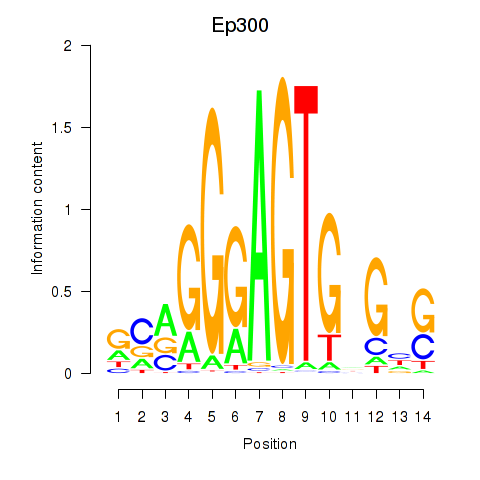
| Ep300 | 1.36 |
|
|
|
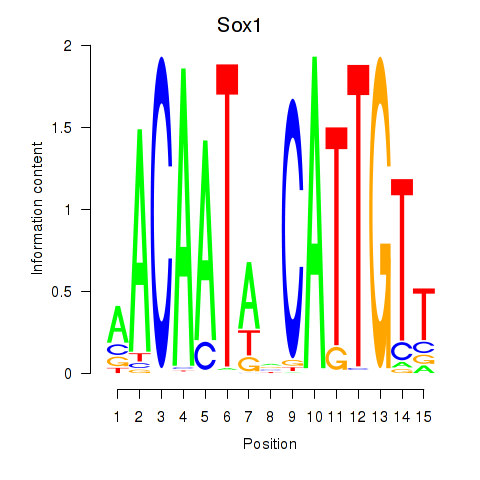
| Sox1 | 1.36 |
|
|
|
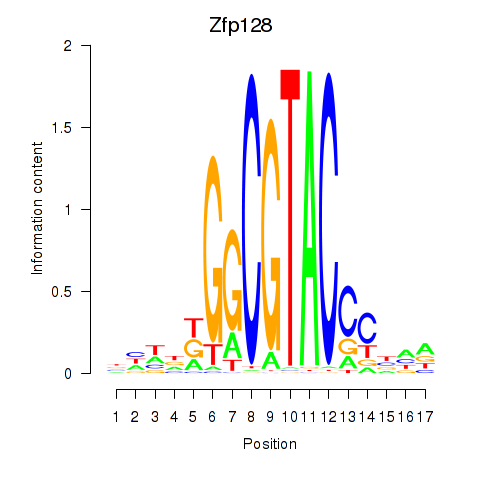
| Zfp128 | 1.35 |
|
|
|
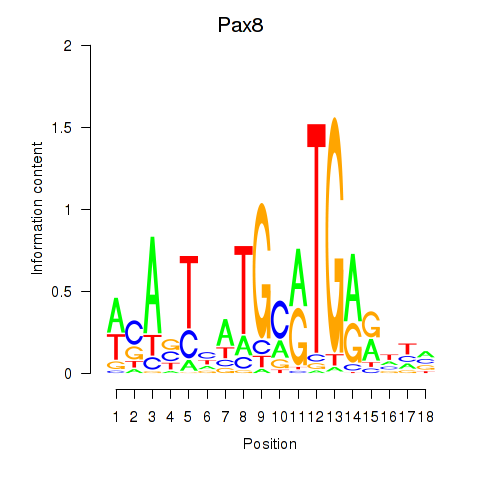
| Pax8 | 1.35 |
|
|
|
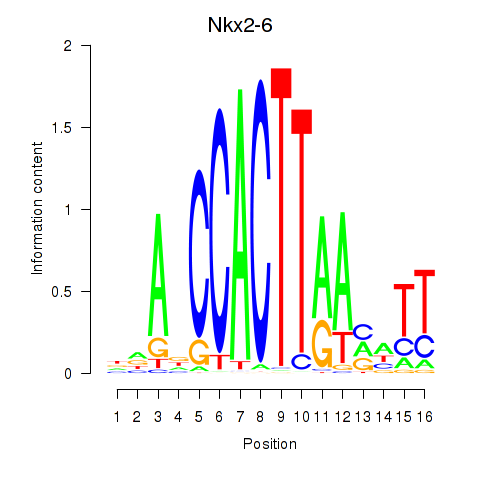
| Nkx2-6 | 1.33 |
|
|
|
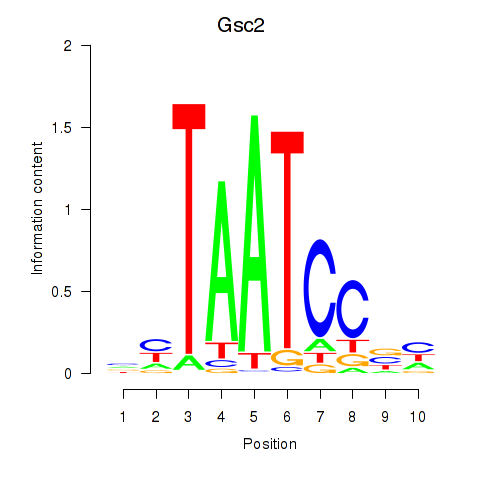
| Gsc2_Dmbx1 | 1.33 |
|
|
|
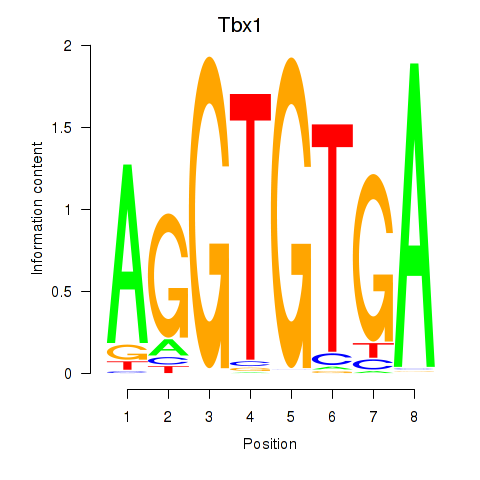
| Tbx1_Eomes | 1.33 |
|
|
|
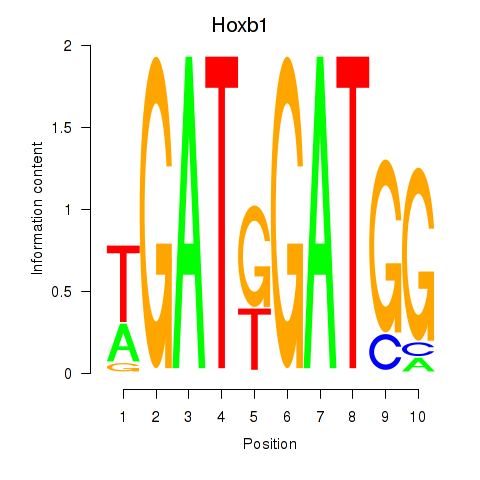
| Hoxb1 | 1.32 |
|
|
|
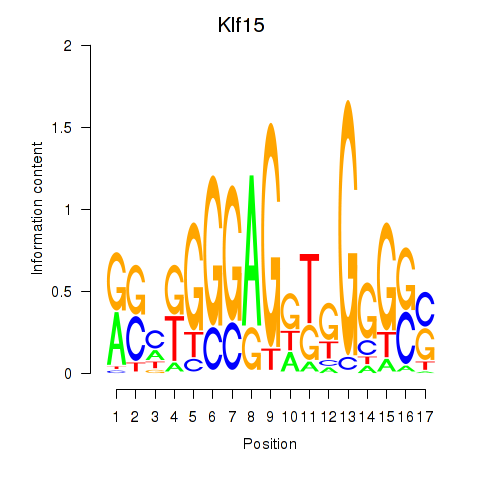
| Klf15 | 1.32 |
|
|
|
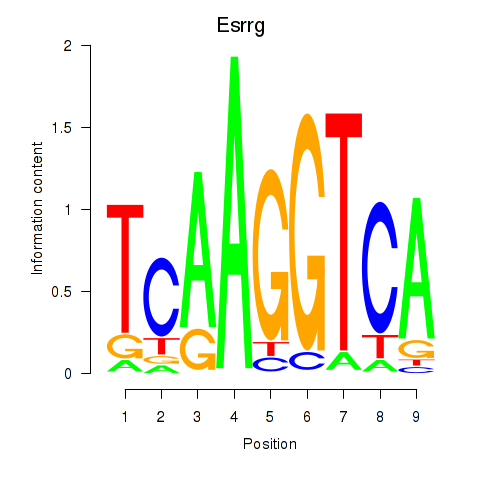
| Esrrg | 1.29 |
|
|
|
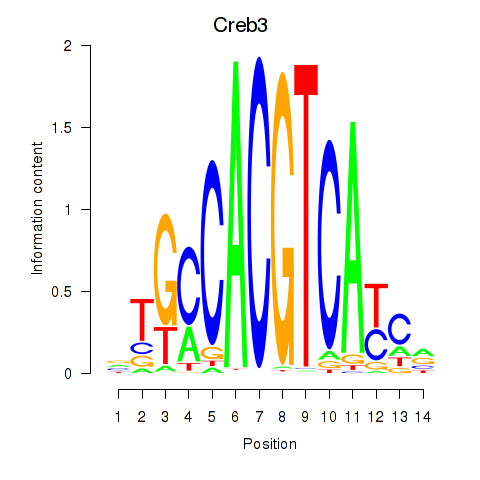
| Creb3 | 1.29 |
|
|
|
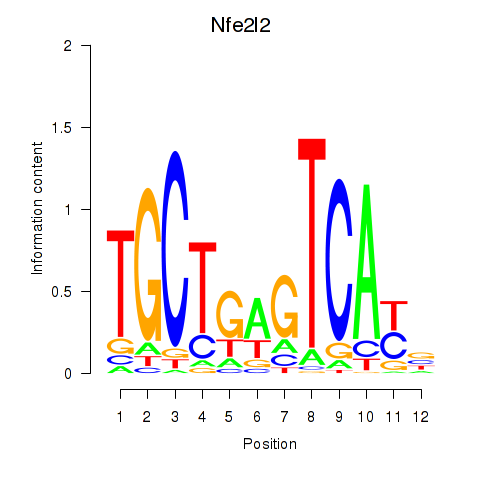
| Nfe2l2 | 1.29 |
|
|
|
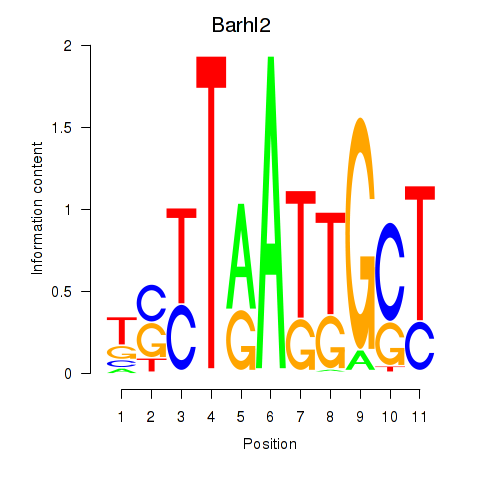
| Barhl2 | 1.29 |
|
|
|
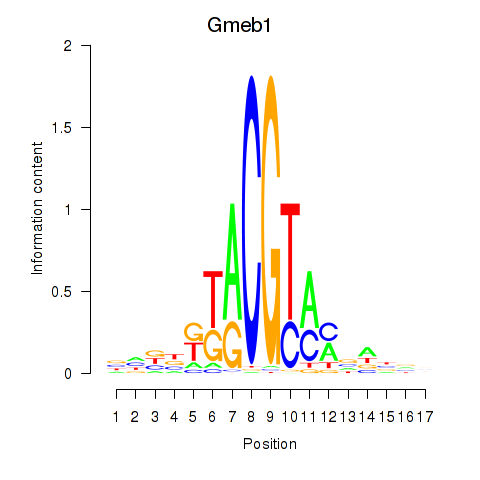
| Gmeb1 | 1.28 |
|
|
|
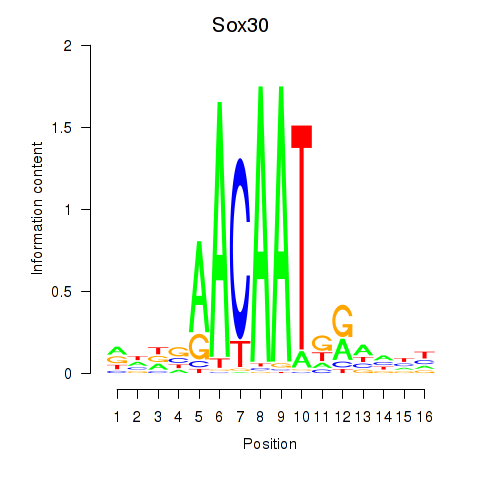
| Sox30 | 1.28 |
|
|
|
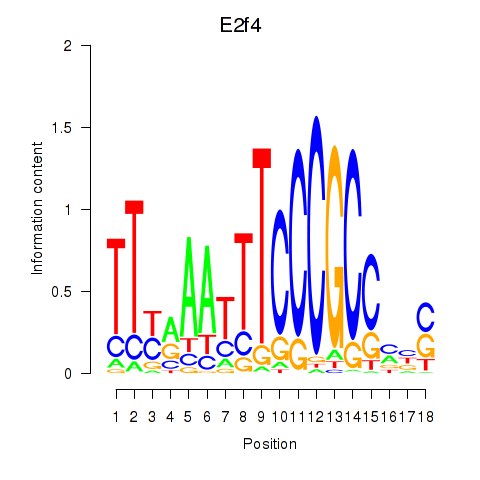
| E2f4 | 1.27 |
|
|
|
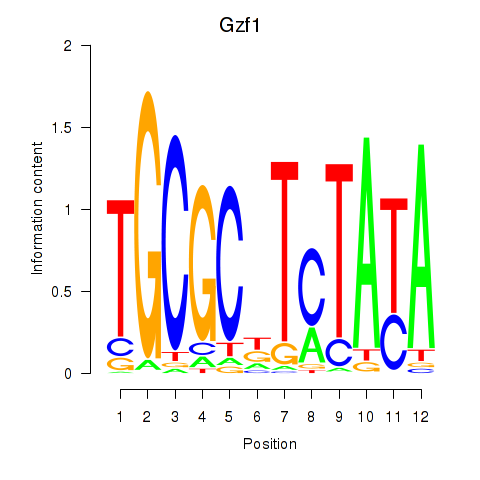
| Gzf1 | 1.27 |
|
|
|
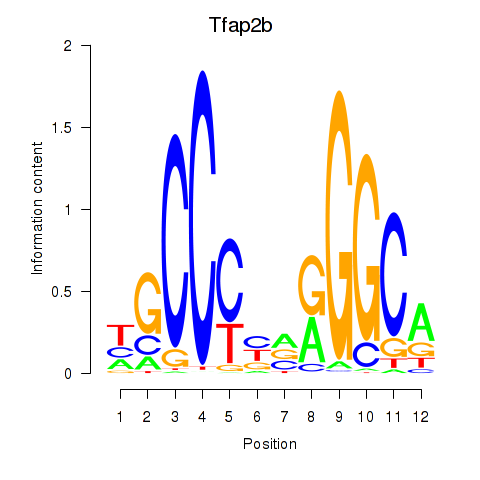
| Tfap2b | 1.26 |
|
|
|
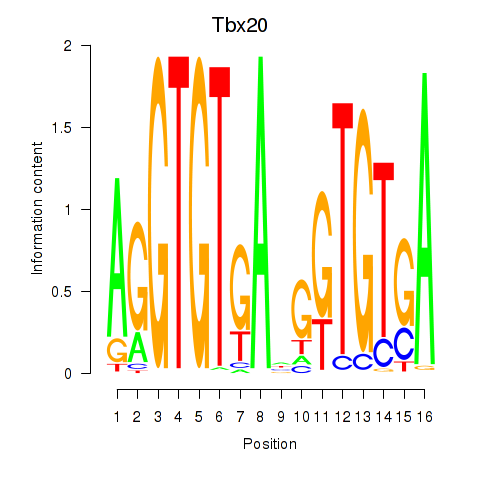
| Tbx20 | 1.26 |
|
|
|
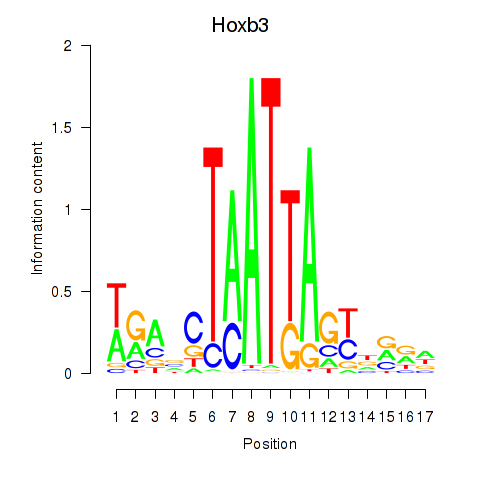
| Hoxb3 | 1.25 |
|
|
|
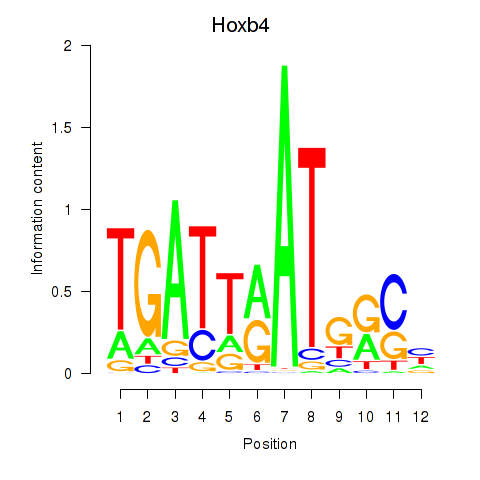
| Hoxb4 | 1.25 |
|
|
|
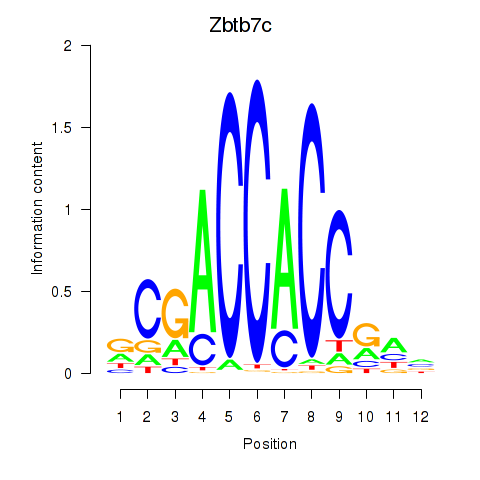
| Zbtb7c | 1.23 |
|
|
|
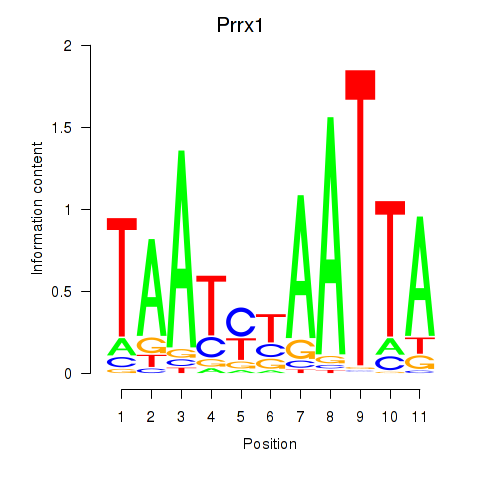
| Prrx1_Isx_Prrxl1 | 1.22 |
|
|
|
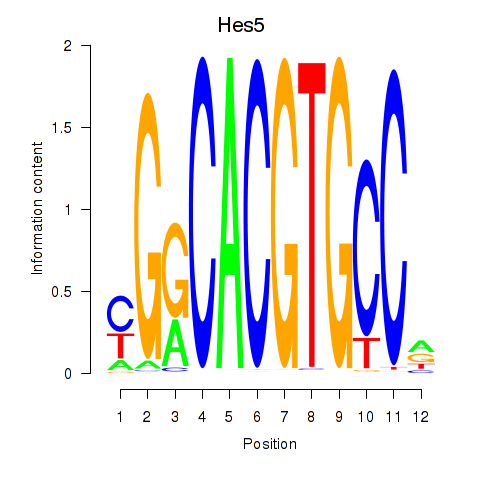
| Hes5_Hes7 | 1.22 |
|
|
|
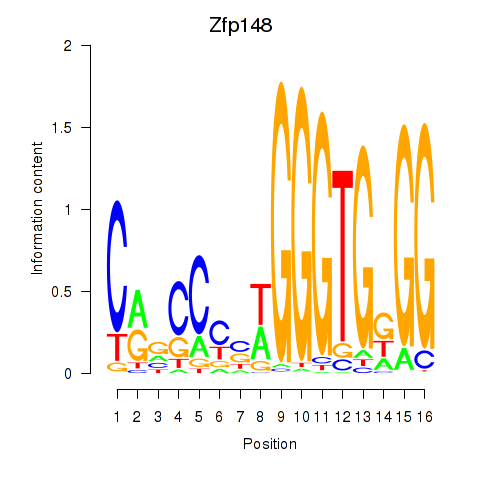
| Zfp148 | 1.20 |
|
|
|
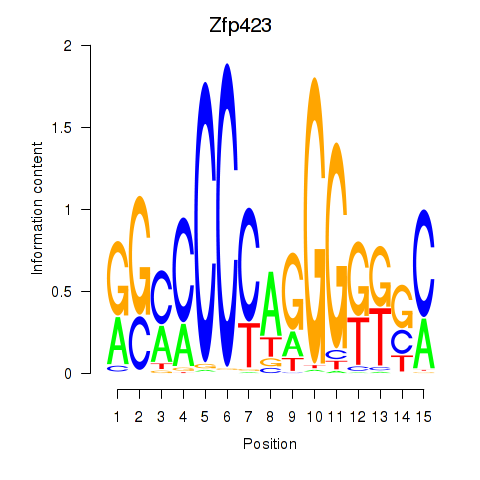
| Zfp423 | 1.19 |
|
|
|
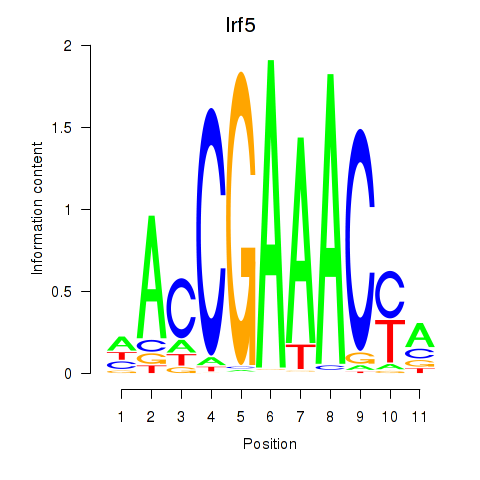
| Irf5_Irf6 | 1.19 |
|
|
|
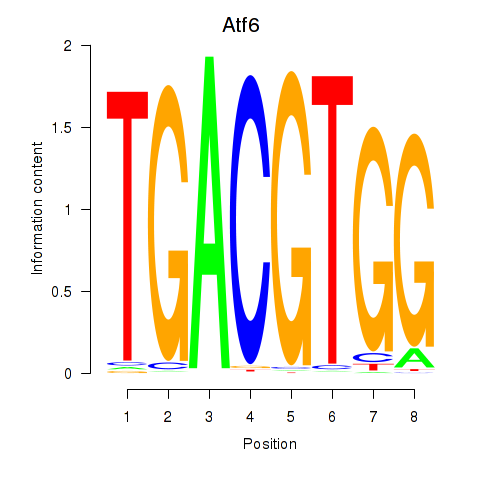
| Atf6 | 1.19 |
|
|
|
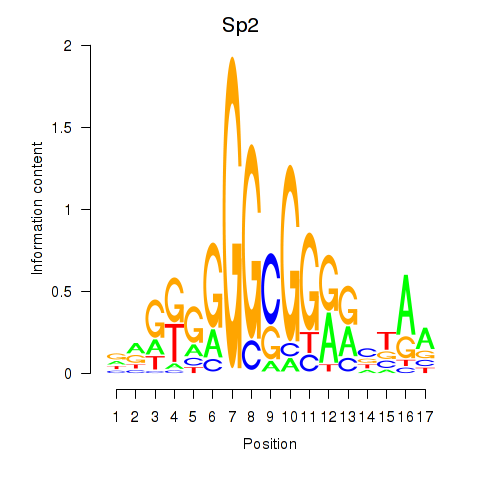
| Sp2 | 1.18 |
|
|
|
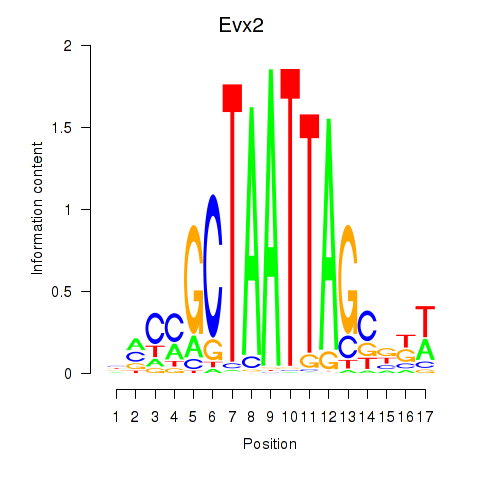
| Evx2 | 1.18 |
|
|
|
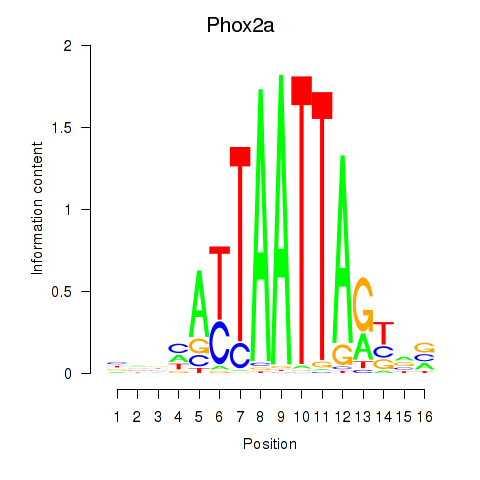
| Phox2a | 1.18 |
|
|
|
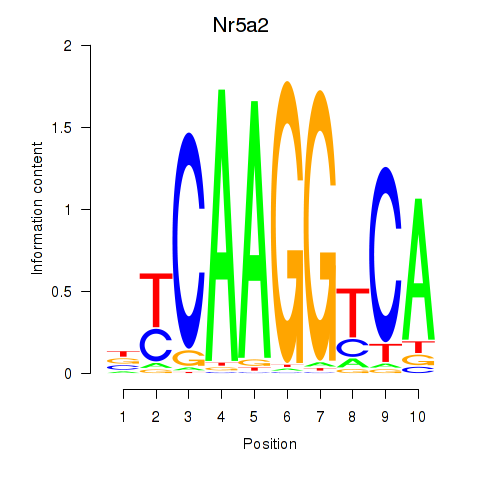
| Nr5a2 | 1.17 |
|
|
|
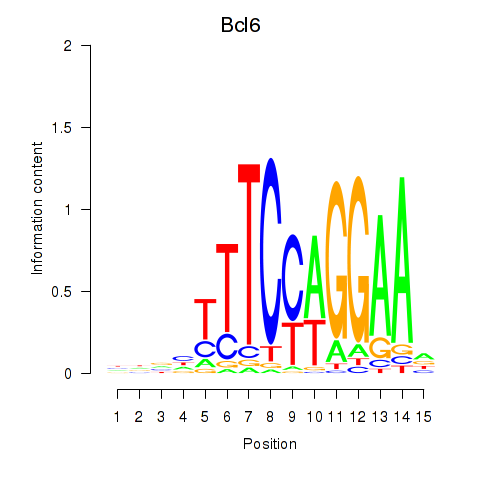
| Bcl6 | 1.16 |
|
|
|
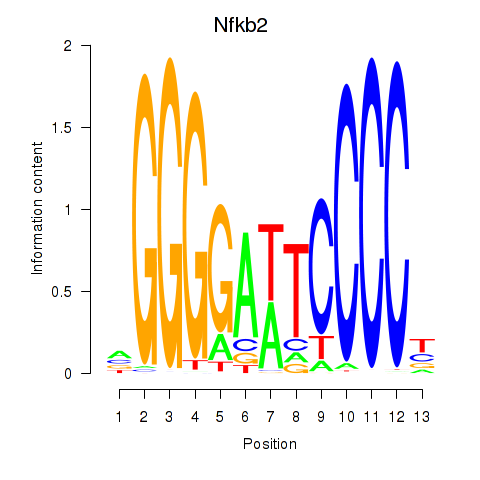
| Nfkb2 | 1.14 |
|
|
|
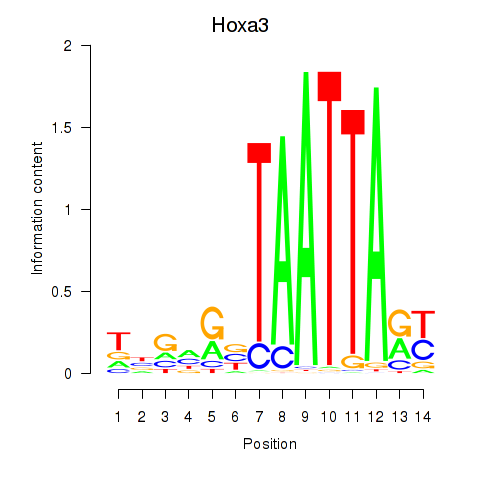
| Hoxa3 | 1.12 |
|
|
|
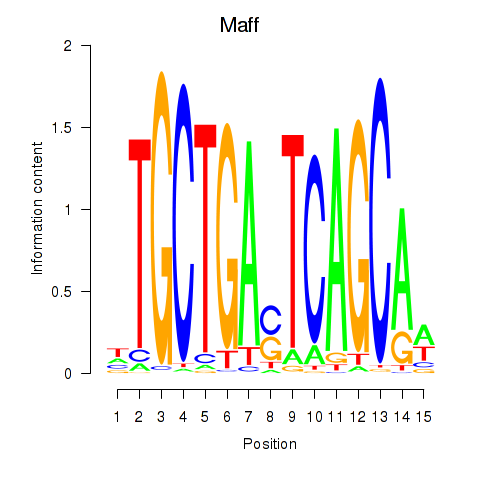
| Maff | 1.11 |
|
|
|
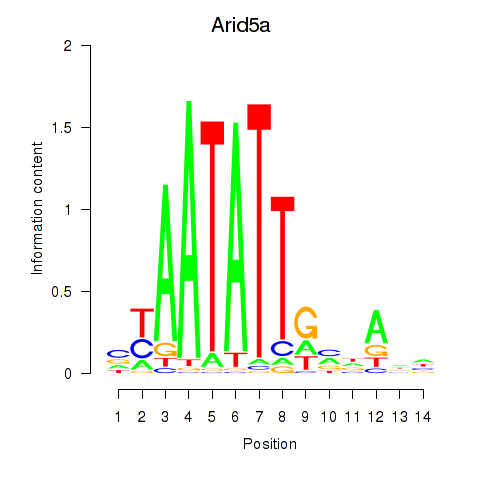
| Arid5a | 1.11 |
|
|
|
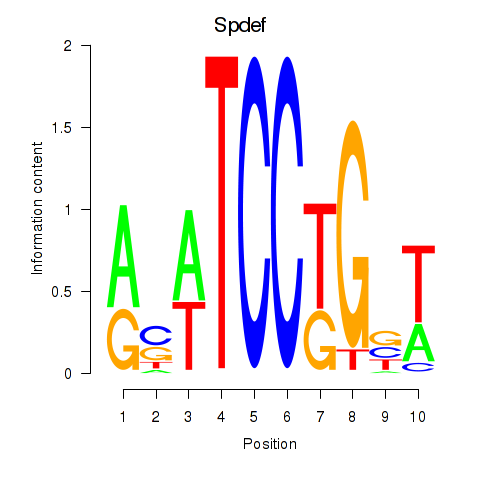
| Spdef | 1.07 |
|
|
|
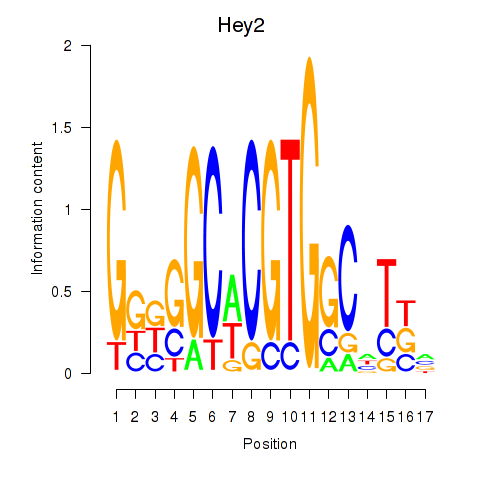
| Hey2 | 1.07 |
|
|
|
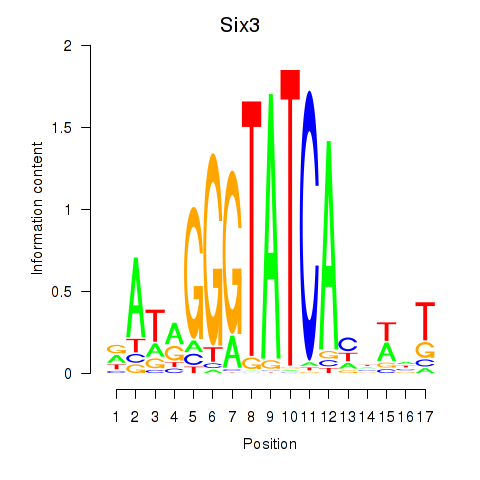
| Six3_Six1_Six2 | 1.05 |
|
|
|
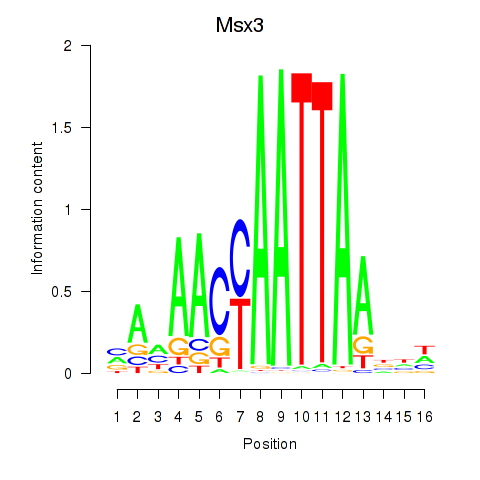
| Msx3 | 1.04 |
|
|
|
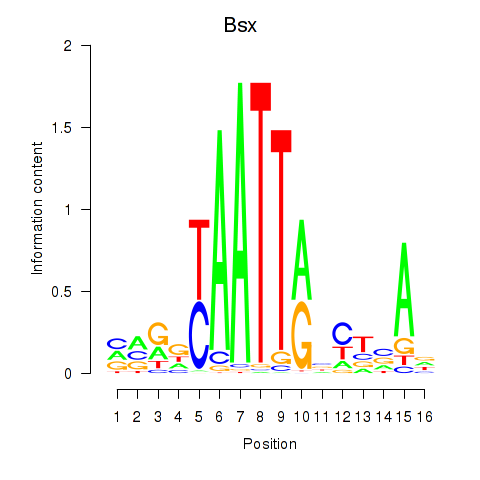
| Bsx | 1.03 |
|
|
|
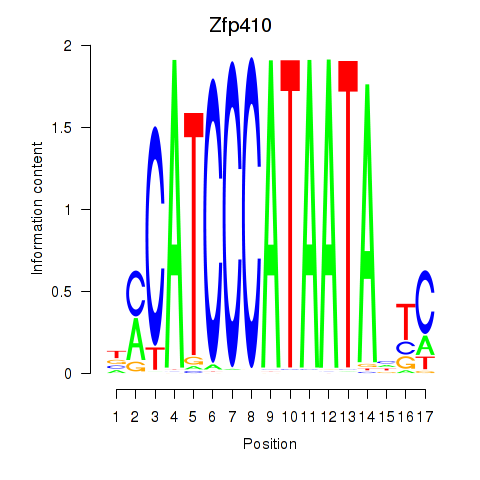
| Zfp410 | 1.03 |
|
|
|
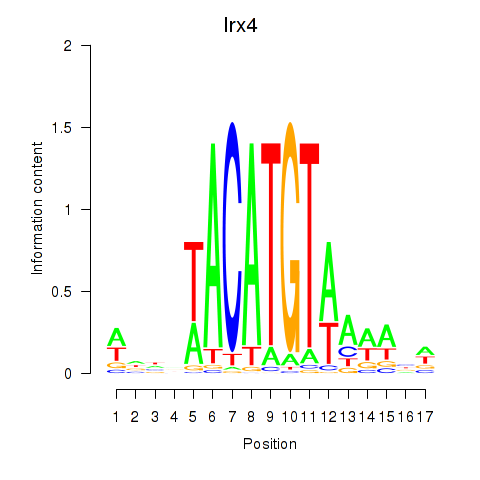
| Irx4 | 1.01 |
|
|
|
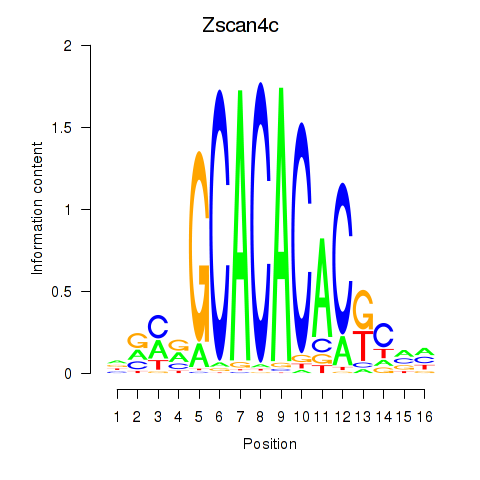
| Zscan4c | 0.99 |
|
|
|
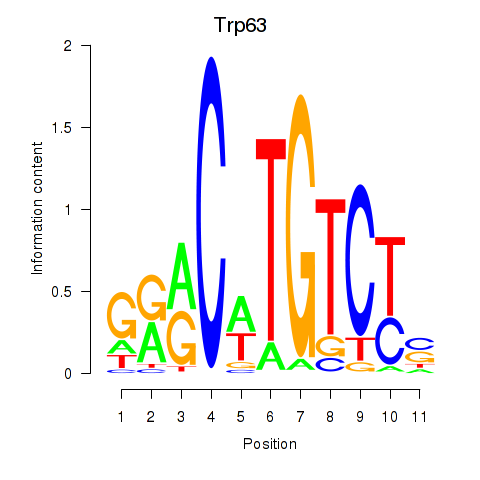
| Trp63 | 0.99 |
|
|
|
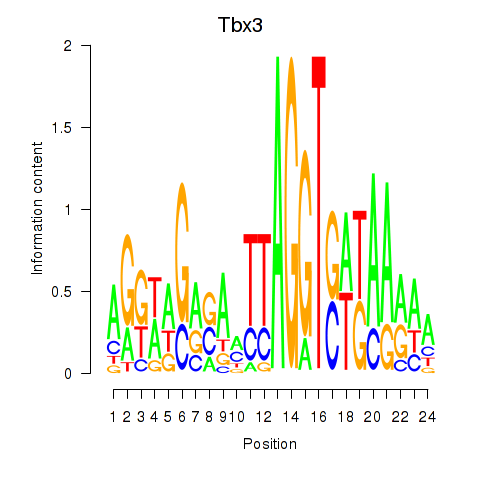
| Tbx3 | 0.98 |
|
|
|
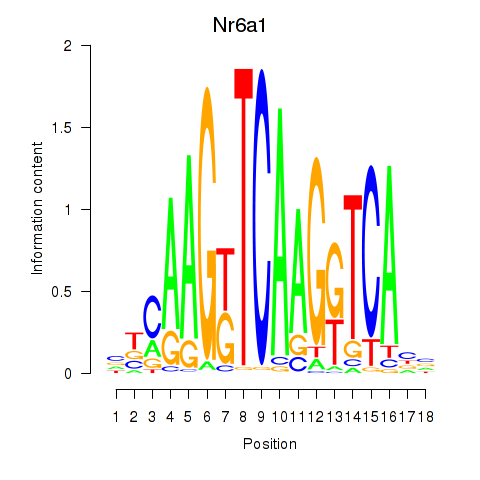
| Nr6a1 | 0.98 |
|
|
|
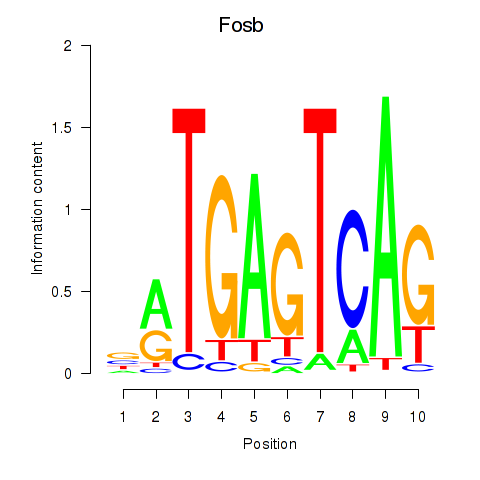
| Fosb | 0.98 |
|
|
|
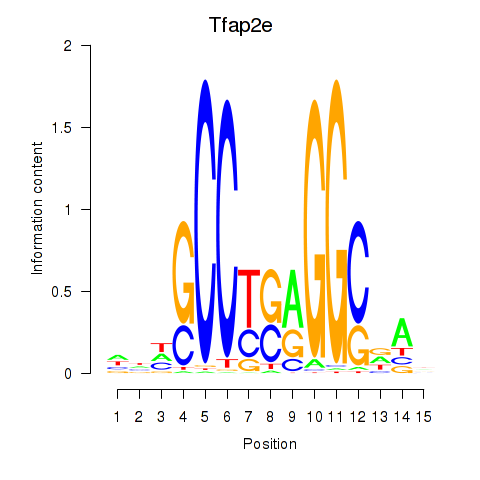
| Tfap2e | 0.97 |
|
|
|
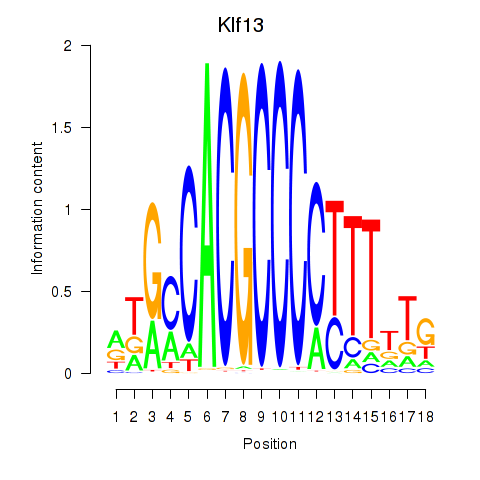
| Klf13 | 0.96 |
|
|
|
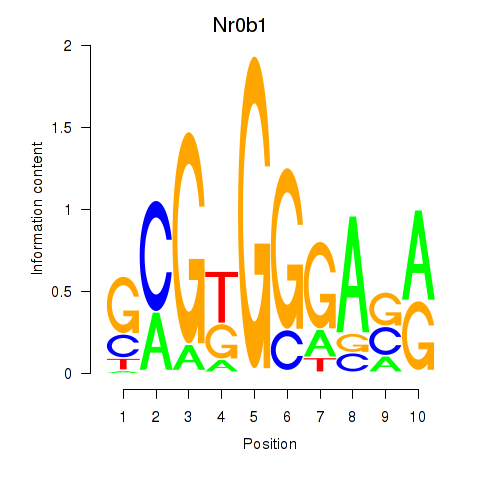
| Nr0b1 | 0.96 |
|
|
|
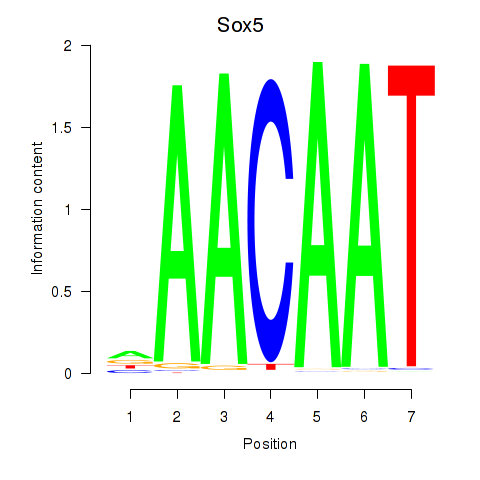
| Sox5_Sry | 0.95 |
|
|
|
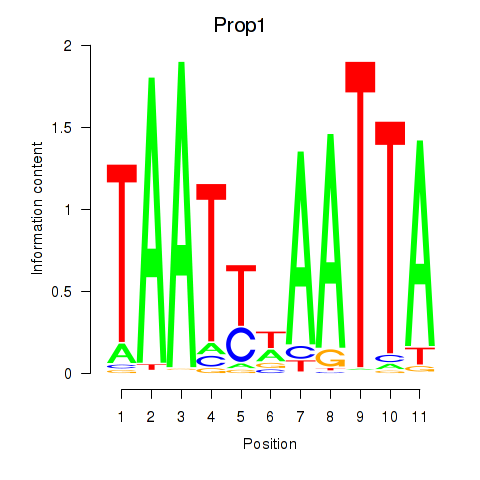
| Prop1 | 0.94 |
|
|
|
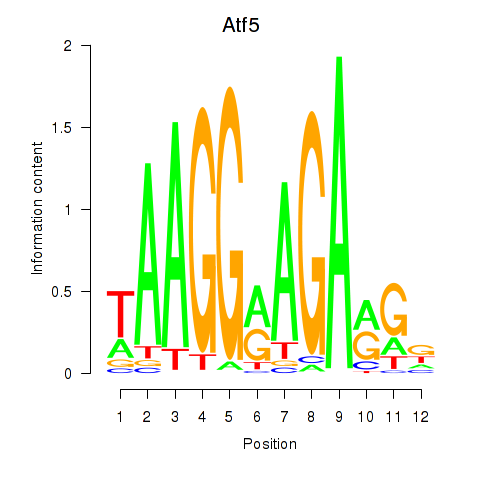
| Atf5 | 0.92 |
|
|
|
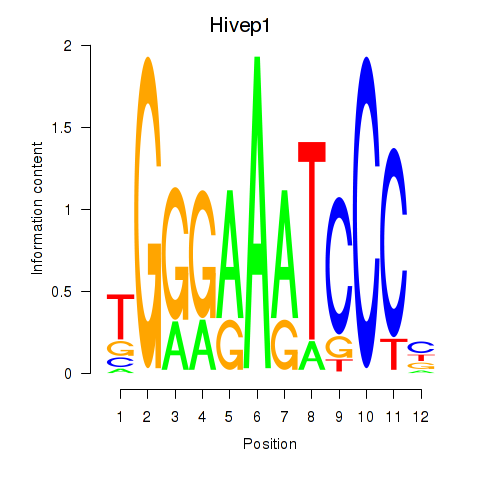
| Hivep1 | 0.90 |
|
|
|
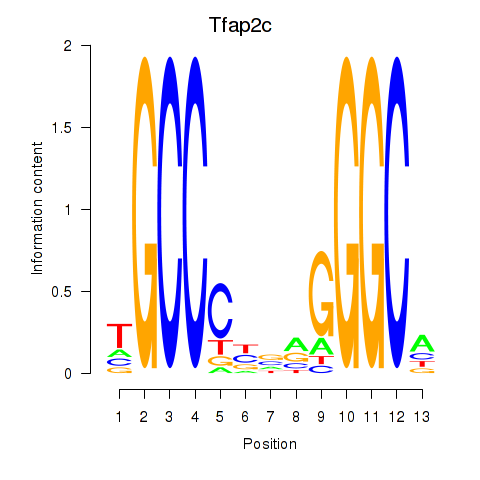
| Tfap2c | 0.88 |
|
|
|
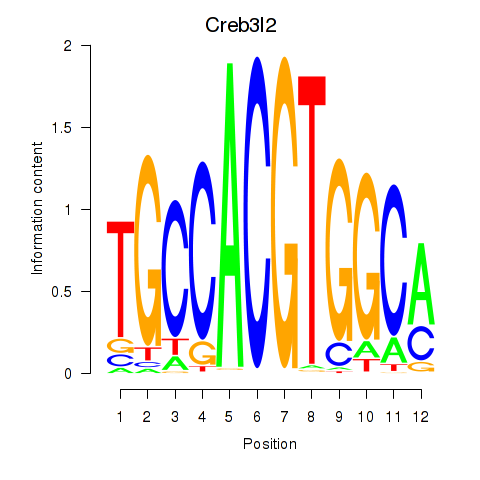
| Creb3l2 | 0.88 |
|
|
|
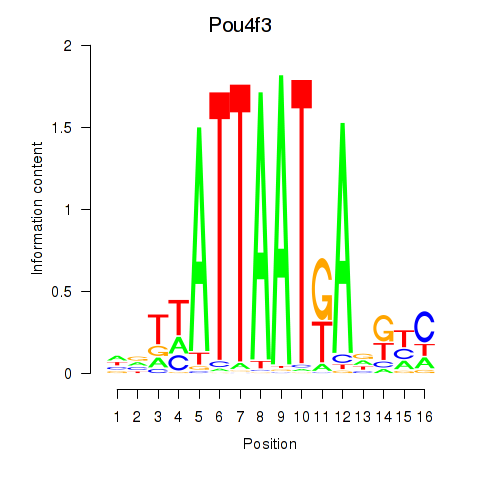
| Pou4f3 | 0.88 |
|
|
|
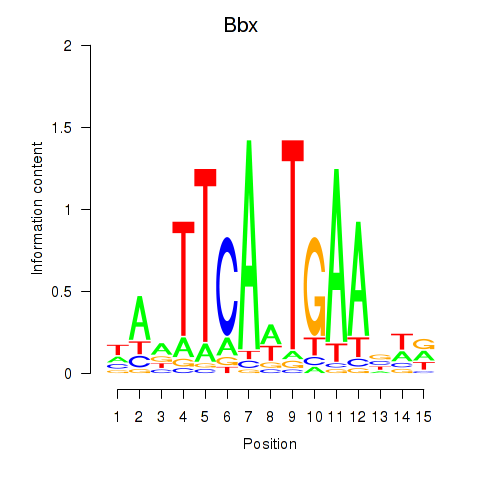
| Bbx | 0.86 |
|
|
|
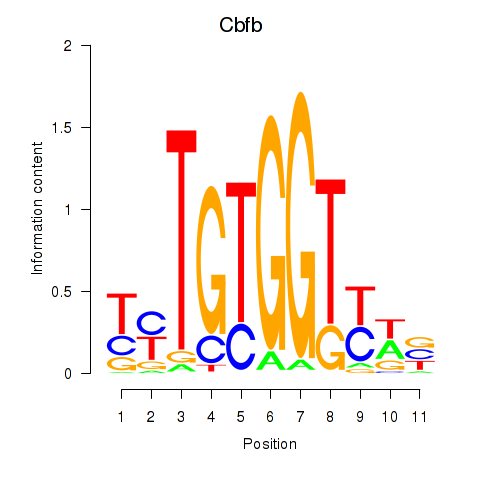
| Cbfb | 0.83 |
|
|
|
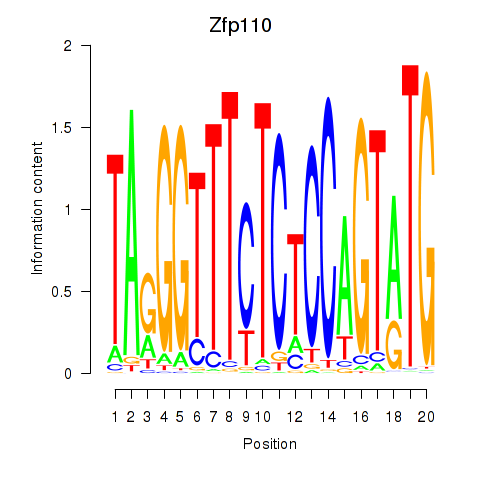
| Zfp110 | 0.83 |
|
|
|
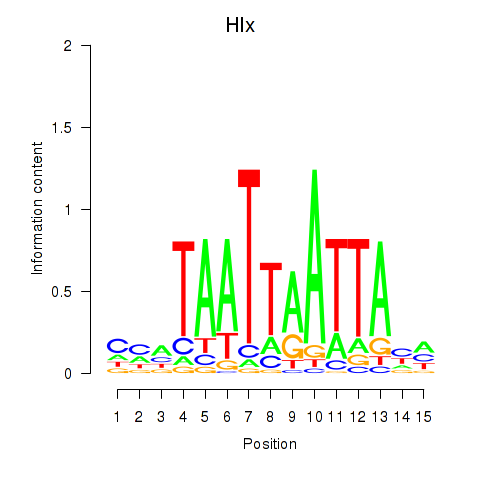
| Hlx | 0.82 |
|
|
|
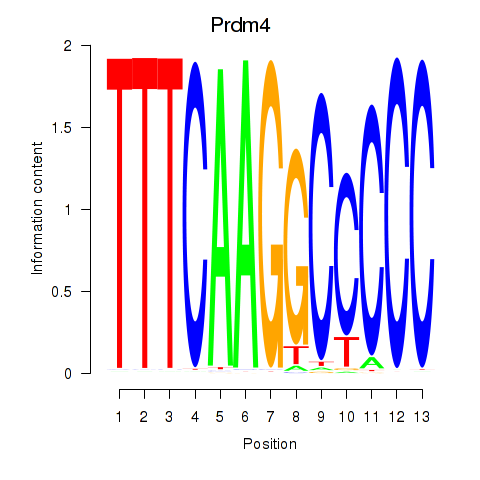
| Prdm4 | 0.81 |
|
|
|
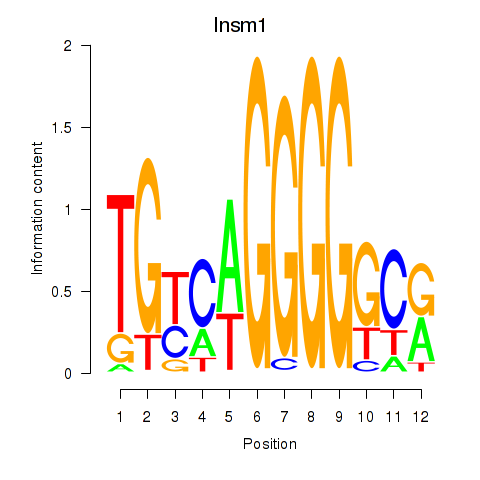
| Insm1 | 0.81 |
|
|
|
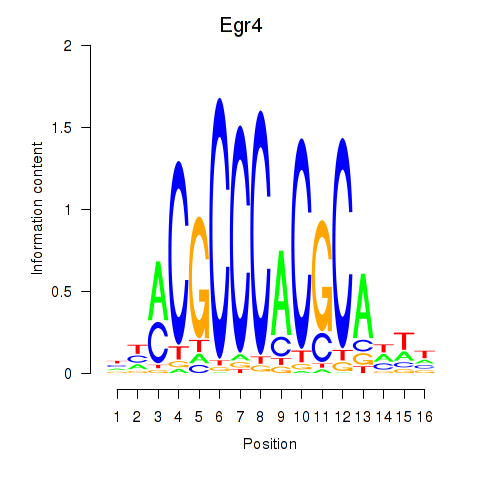
| Egr4 | 0.79 |
|
|
|
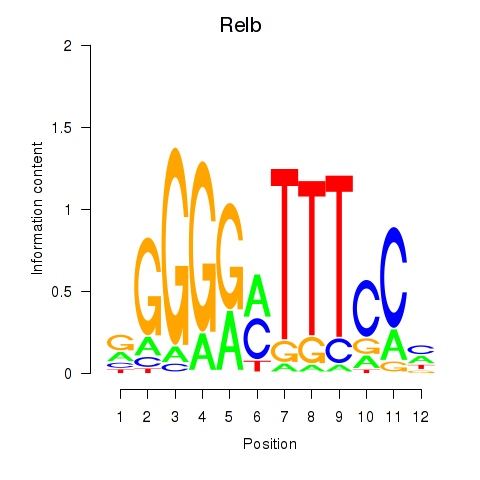
| Relb | 0.76 |
|
|
|
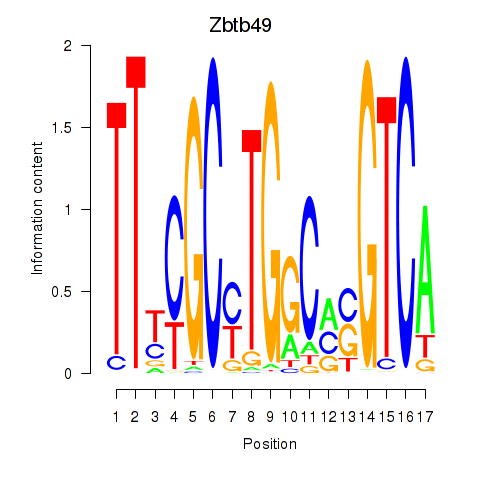
| Zbtb49 | 0.75 |
|
|
|
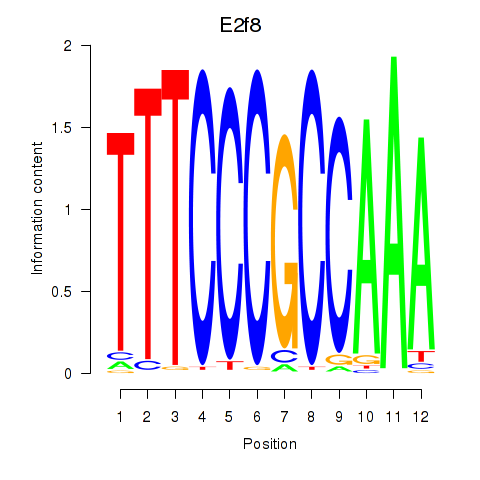
| E2f8 | 0.73 |
|
|
|
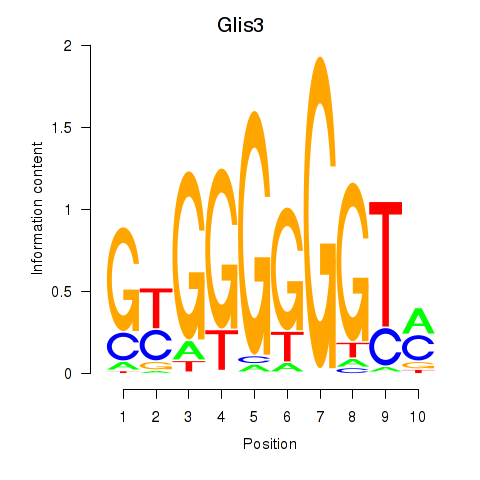
| Glis3 | 0.69 |
|
|
|
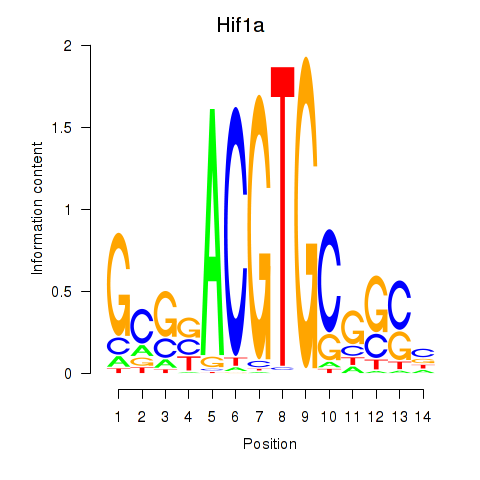
| Hif1a | 0.64 |
|
|
|
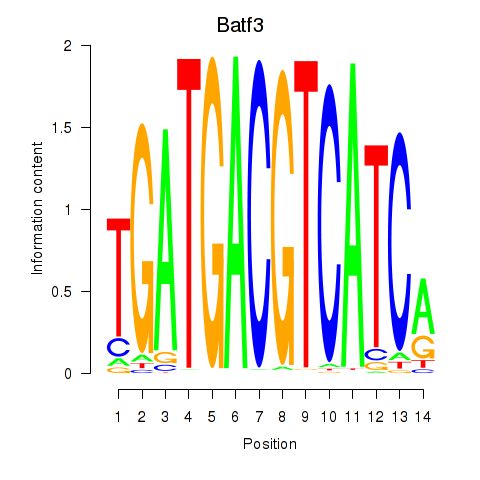
| Batf3 | 0.62 |
|
|
|
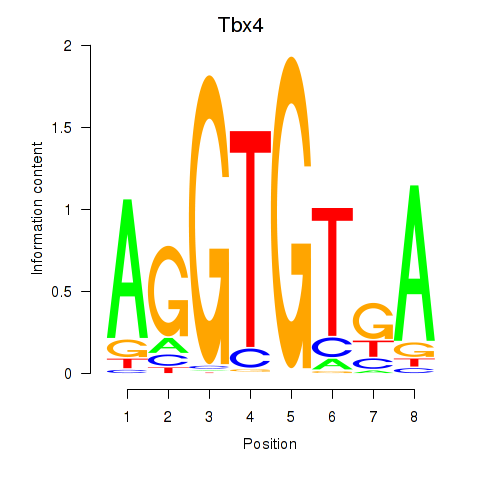
| Tbx4 | 0.51 |
|
|
|
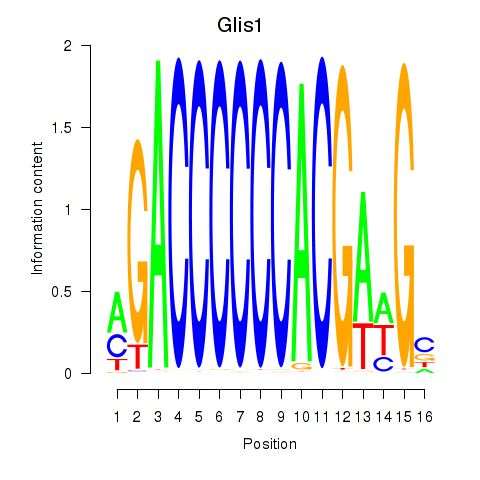
| Glis1 | 0.48 |
|
|
|
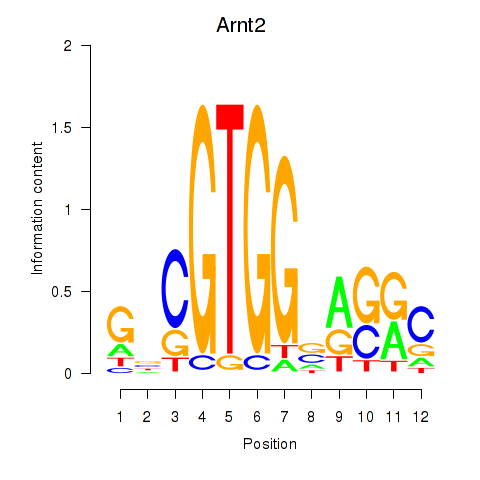
| Arnt2 | 0.41 |
|
|
|
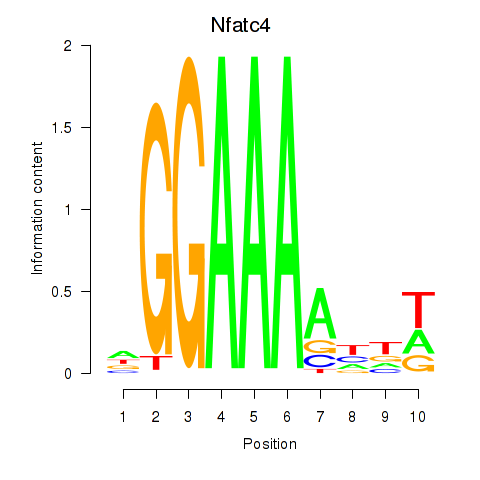
| Nfatc4 | 0.35 |
|
|
|
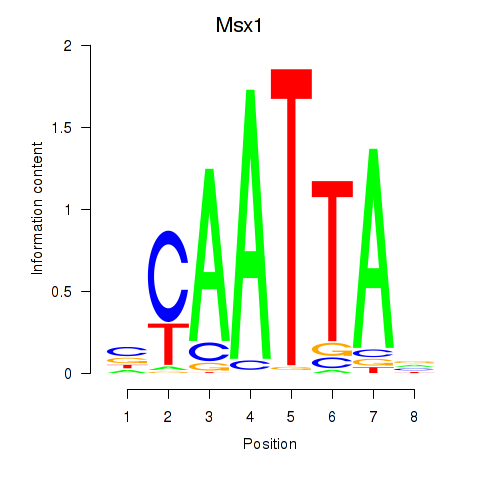
| Msx1_Lhx9_Barx1_Rax_Dlx6 | 0.16 |
|
|
|
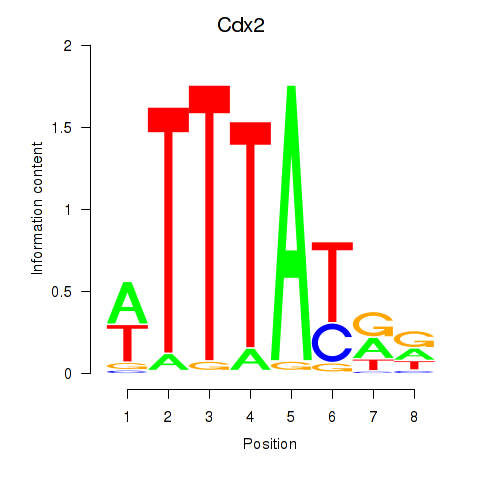
| Cdx2 | 0.00 |
|

|
|
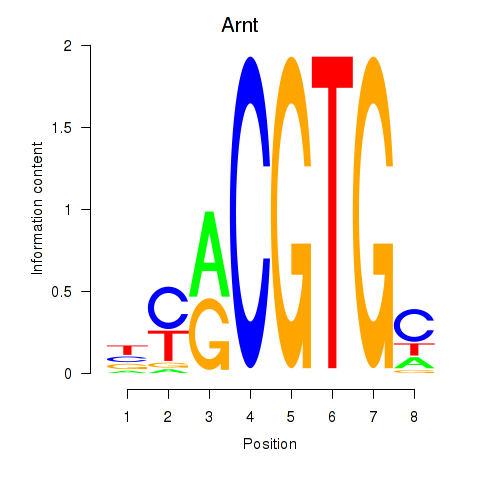
| Arnt | 0.00 |
|

|
|
| Lef1 | 0.00 |
|

|
|
| Hoxb7 | 0.00 |
|

|
|
| Foxl1 | 0.00 |
|

|
|
| Mzf1 | 0.00 |
|

|
|
| Hoxa6 | 0.00 |
|

|

|
| Pgr_Nr3c1 | 0.00 |
|

|
|
| Pax2 | 0.00 |
|

|
|
| Sox15 | 0.00 |
|

|
|
List of samples with summary statistics on CRE signal intensities
| Sample name | Condition | Replicate/Batch | CRE number | Mean CRE signal intensity | Std. Dev. of signal intensity across CREs | Fraction of CRE signal intensity variance explained by motif activities |
|---|---|---|---|---|---|---|
| embryonicfacialprominence_E11.5 | 29890 | 3.295 | 1.1646 | 0.086 | ||
| embryonicfacialprominence_E12.5 | 21300 | 3.252 | 1.1245 | 0.079 | ||
| embryonicfacialprominence_E13.5 | 16267 | 3.156 | 1.0439 | 0.102 | ||
| embryonicfacialprominence_E14.5 | 54652 | 3.545 | 1.3021 | 0.117 | ||
| embryonicfacialprominence_E15.5 | 23321 | 3.289 | 1.0929 | 0.098 | ||
| forebrain_E11.5 | 68171 | 3.264 | 1.2877 | 0.187 | ||
| forebrain_E12.5 | 75944 | 3.340 | 1.2975 | 0.219 | ||
| forebrain_E13.5 | 69462 | 3.498 | 1.3999 | 0.252 | ||
| forebrain_E14.5 | 86946 | 3.580 | 1.4850 | 0.258 | ||
| forebrain_E15.5 | 57761 | 3.509 | 1.3661 | 0.232 | ||
| forebrain_E16.5 | 69444 | 3.582 | 1.5304 | 0.253 | ||
| forebrain_PN0 | 86359 | 3.607 | 1.5592 | 0.240 | ||
| heart_E11.5 | 31149 | 3.142 | 1.0729 | 0.149 | ||
| heart_E12.5 | 48649 | 3.289 | 1.1301 | 0.161 | ||
| heart_E13.5 | 25132 | 3.116 | 1.2222 | 0.081 | ||
| heart_E14.5 | 24382 | 3.215 | 1.1537 | 0.136 | ||
| heart_E15.5 | 36460 | 3.361 | 1.2454 | 0.132 | ||
| heart_E16.5 | 56159 | 3.398 | 1.3787 | 0.134 | ||
| heart_PN0 | 64251 | 3.241 | 1.4403 | 0.155 | ||
| hindbrain_E11.5 | 67174 | 3.567 | 1.3774 | 0.224 | ||
| hindbrain_E12.5 | 76225 | 3.325 | 1.2223 | 0.187 | ||
| hindbrain_E13.5 | 49938 | 3.422 | 1.2944 | 0.168 | ||
| hindbrain_E14.5 | 54075 | 3.297 | 1.2199 | 0.171 | ||
| hindbrain_E15.5 | 38283 | 3.478 | 1.2472 | 0.154 | ||
| hindbrain_E16.5 | 43307 | 3.582 | 1.3332 | 0.178 | ||
| hindbrain_PN0 | 54223 | 3.456 | 1.2662 | 0.160 | ||
| intestine_E14.5 | 48585 | 3.414 | 1.2041 | 0.127 | ||
| intestine_E15.5 | 68995 | 3.711 | 1.3100 | 0.209 | ||
| intestine_E16.5 | 73980 | 3.698 | 1.3496 | 0.218 | ||
| intestine_PN0 | 64326 | 3.408 | 1.3408 | 0.222 | ||
| kidney_E14.5 | 37965 | 3.504 | 1.2555 | 0.086 | ||
| kidney_E15.5 | 46953 | 3.445 | 1.2236 | 0.089 | ||
| kidney_E16.5 | 51557 | 3.529 | 1.2296 | 0.163 | ||
| kidney_PN0 | 42205 | 3.271 | 1.2291 | 0.134 | ||
| limb_E11.5 | 37284 | 3.159 | 1.0833 | 0.102 | ||
| limb_E12.5 | 24824 | 3.261 | 1.1431 | 0.081 | ||
| limb_E13.5 | 42976 | 3.340 | 1.2192 | 0.091 | ||
| limb_E14.5 | 51515 | 3.331 | 1.2729 | 0.106 | ||
| limb_E15.5 | 16239 | 3.187 | 1.0455 | 0.124 | ||
| liver_E11.5 | 55761 | 3.260 | 1.2828 | 0.229 | ||
| liver_E12.5 | 54157 | 3.241 | 1.4497 | 0.230 | ||
| liver_E13.5 | 59430 | 3.244 | 1.5786 | 0.226 | ||
| liver_E14.5 | 62775 | 3.132 | 1.5929 | 0.211 | ||
| liver_E15.5 | 60864 | 3.247 | 1.5796 | 0.204 | ||
| liver_E16.5 | 69217 | 3.387 | 1.6163 | 0.221 | ||
| liver_PN0 | 101836 | 3.377 | 1.6759 | 0.217 | ||
| lung_E14.5 | 60477 | 3.655 | 1.3376 | 0.096 | ||
| lung_E15.5 | 39182 | 3.351 | 1.3456 | 0.169 | ||
| lung_E16.5 | 63372 | 3.756 | 1.3682 | 0.132 | ||
| lung_PN0 | 105606 | 3.715 | 1.4823 | 0.178 | ||
| neuraltube_E11.5 | 41467 | 3.112 | 1.2977 | 0.140 | ||
| neuraltube_E12.5 | 58351 | 3.347 | 1.3591 | 0.152 | ||
| neuraltube_E13.5 | 51713 | 3.549 | 1.3851 | 0.160 | ||
| neuraltube_E14.5 | 54934 | 3.444 | 1.3355 | 0.168 | ||
| neuraltube_E15.5 | 49481 | 3.454 | 1.3104 | 0.140 |