Project
ENCODE: H3K4me3 ChIP-Seq of different mouse tissues during embryonic development
Navigation
Downloads
Sample name: kidney155
QC summary table
QC statistics for this sample |
Comparison with ChIP-Seq ENCODE datasets |
||
Mapping |
|||
Fraction of mapped reads for the IP replicates: |
0.919 | 88th percentile | |
Fraction of mapped reads for the background replicates: |
0.883 | 77th percentile | |
ChIP enrichment signal intensity |
|||
Noise level ChIP signal intensity: |
0.234 | 64th percentile | |
Error in fit of enrichment distribution: |
0.518 | 45th percentile | |
Peak statistics |
|||
Number of peaks: |
89611 | 98th percentile | |
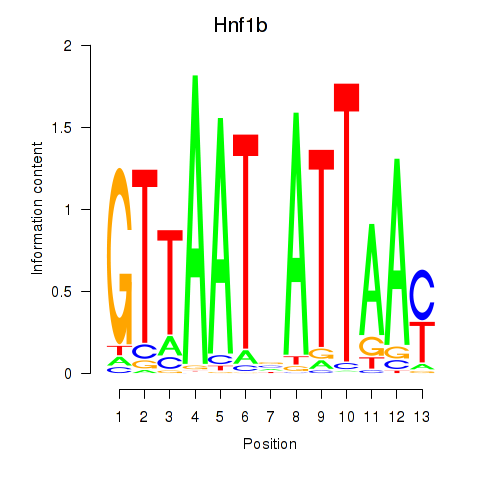
Regulatory motifs sorted by significance (z-value) for sample kidney155.
Regulatory motifs sorted by significance (z-value).
| WM name | Z-value | Associated genes | Logo |
|---|---|---|---|
| Hnf1b | 9.683 |
|
|
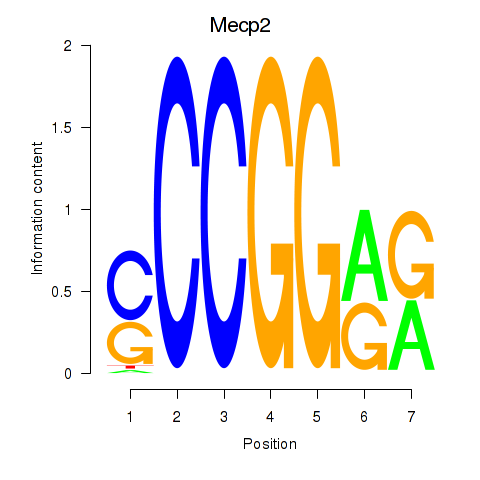
| Mecp2 | 6.795 |
|
|
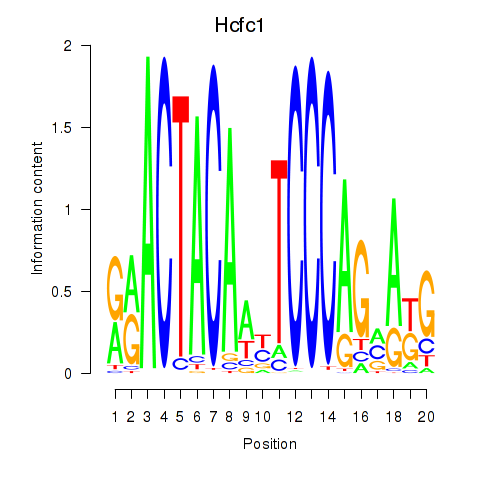
| Hcfc1_Six5_Smarcc2_Zfp143 | 6.751 |
|
|
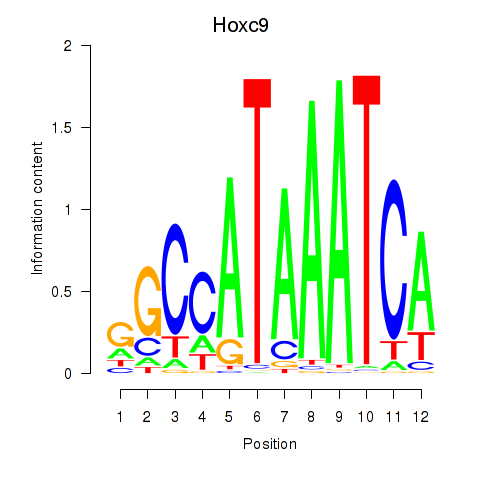
| Hoxc9 | 6.423 |
|
|
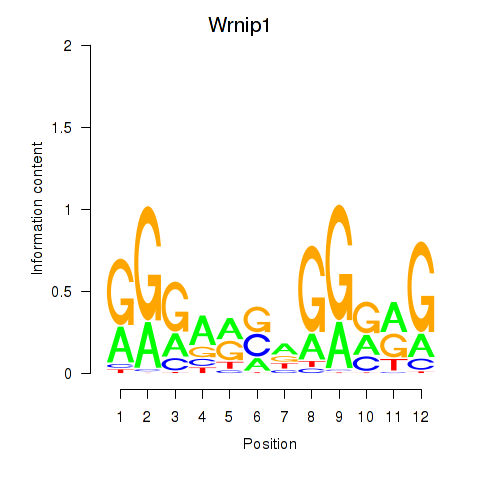
| Wrnip1_Mta3_Rcor1 | 6.367 |
|
|
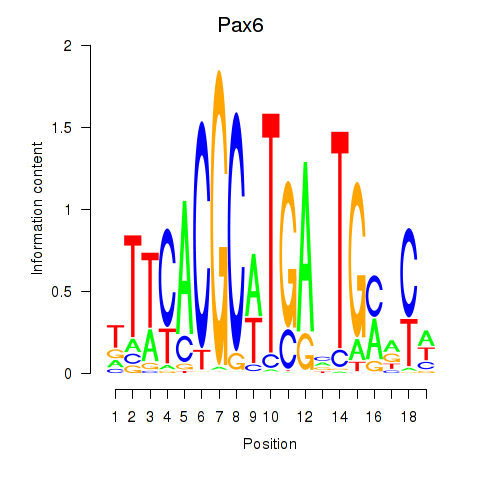
| Pax6 | 6.224 |
|
|
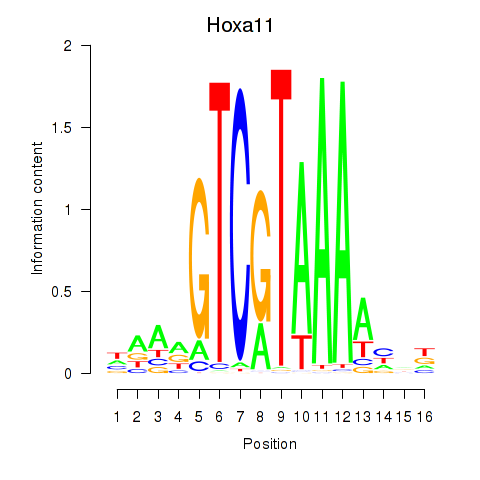
| Hoxa11_Hoxc12 | 5.709 |
|
|
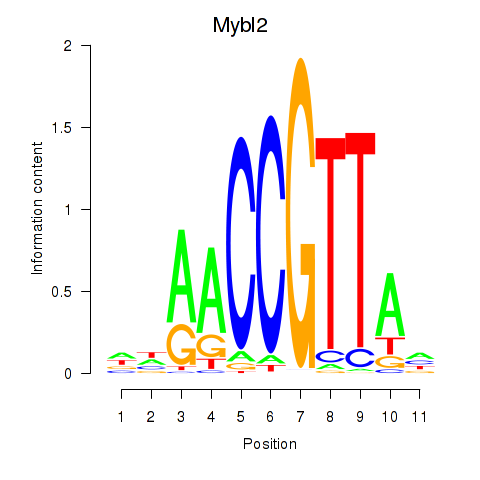
| Mybl2 | 5.575 |
|
|
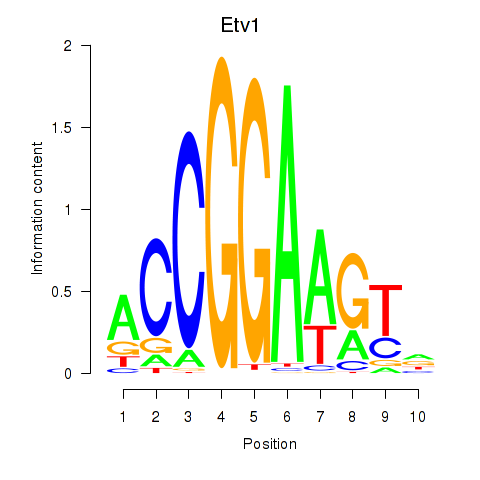
| Etv1_Etv5_Gabpa | 4.881 |
|
|
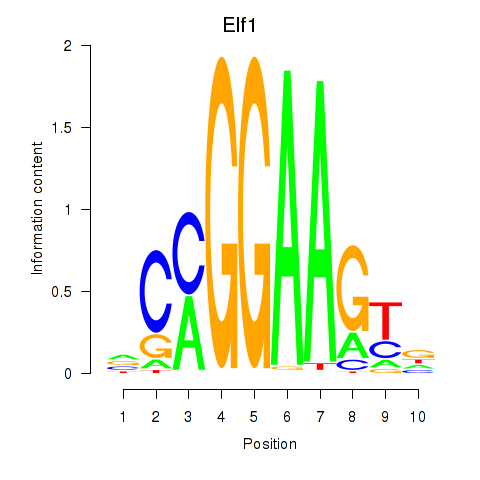
| Elf1_Elf2_Etv2_Elf4 | 4.745 |
|
|
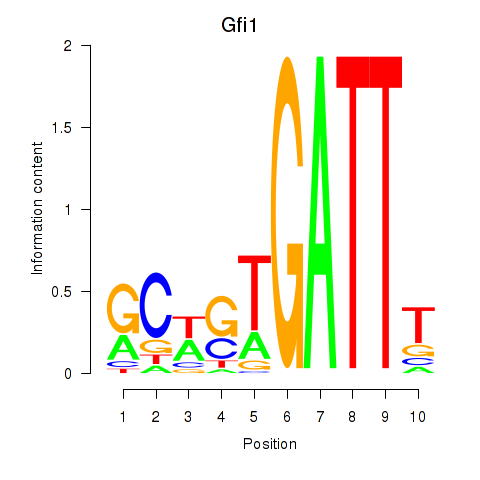
| Gfi1_Gfi1b | 4.642 |
|
|
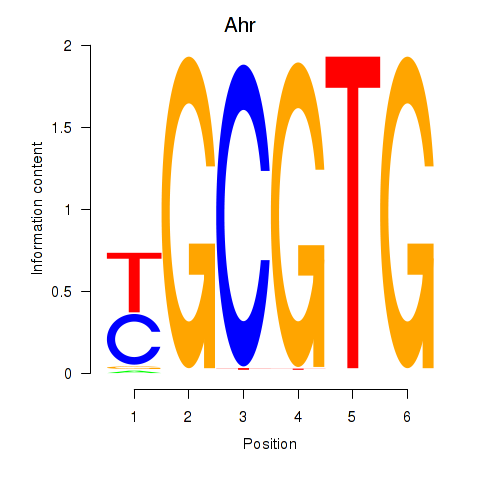
| Ahr | 4.583 |
|
|
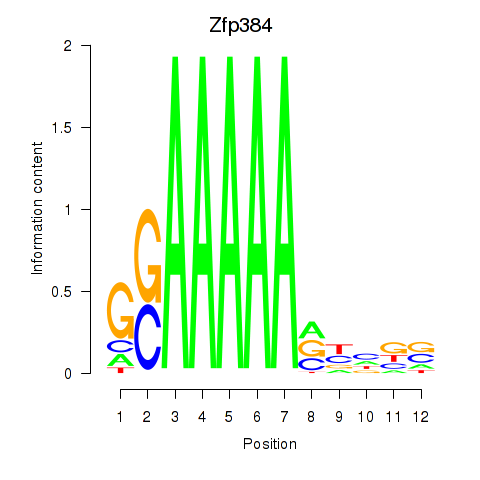
| Zfp384 | 4.285 |
|
|
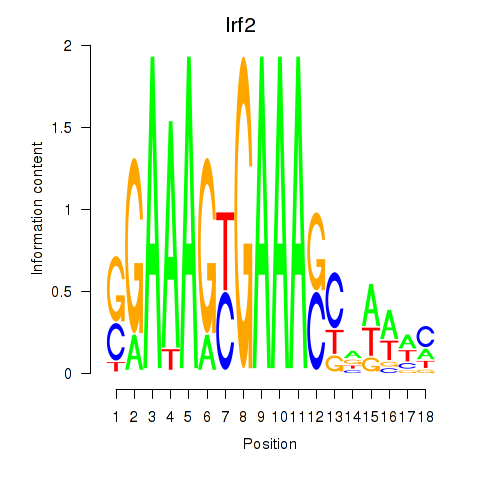
| Irf2_Irf1_Irf8_Irf9_Irf7 | 4.255 |
|
|
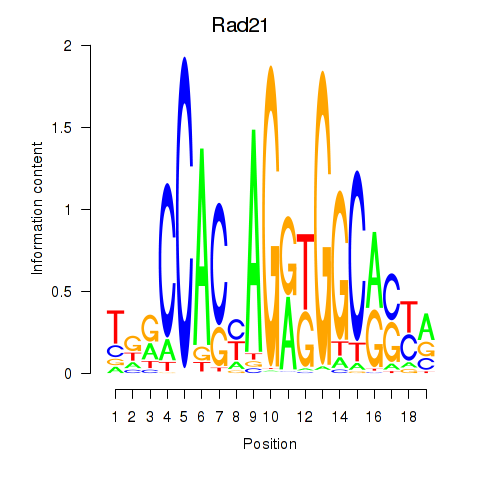
| Rad21_Smc3 | 4.231 |
|
|
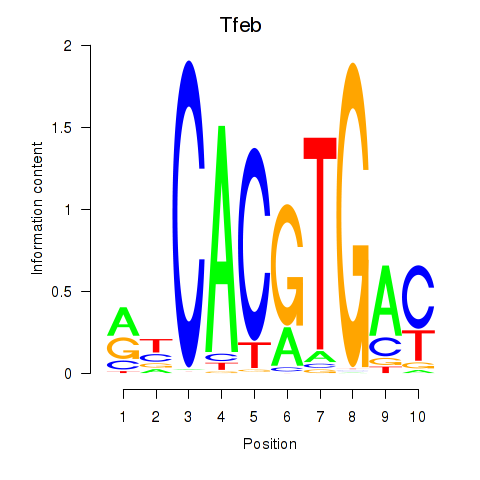
| Tfeb_Usf1_Srebf1_Usf2_Bhlhe41_Srebf2 | 4.113 |
|
|
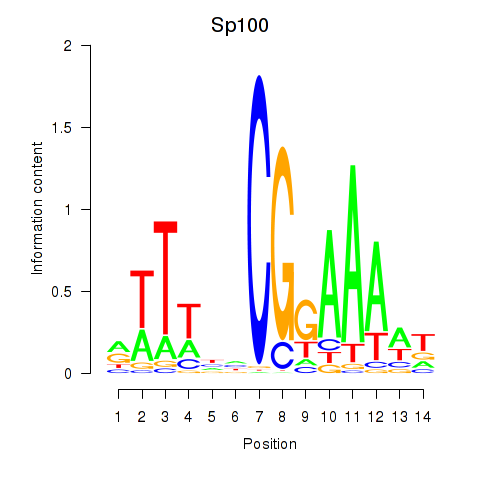
| Sp100 | 3.915 |
|
|
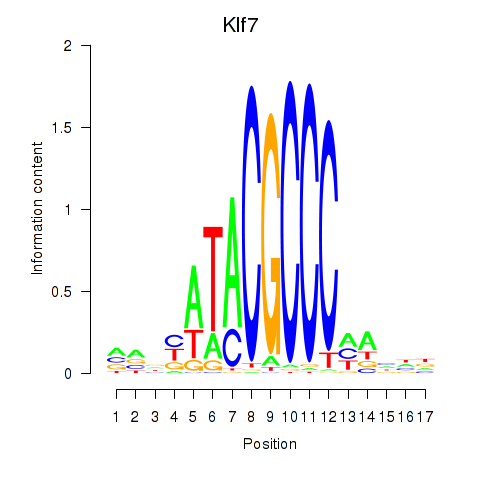
| Klf7 | 3.768 |
|
|
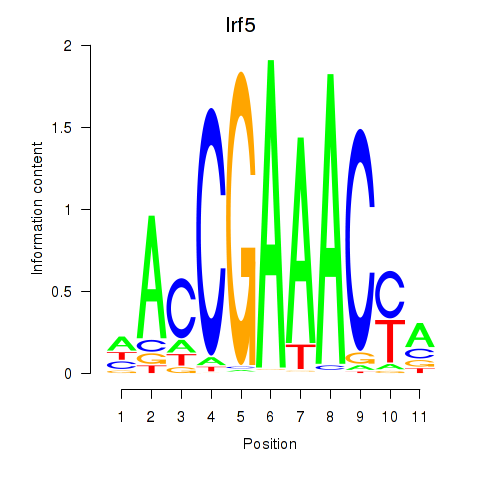
| Irf5_Irf6 | 3.692 |
|
|
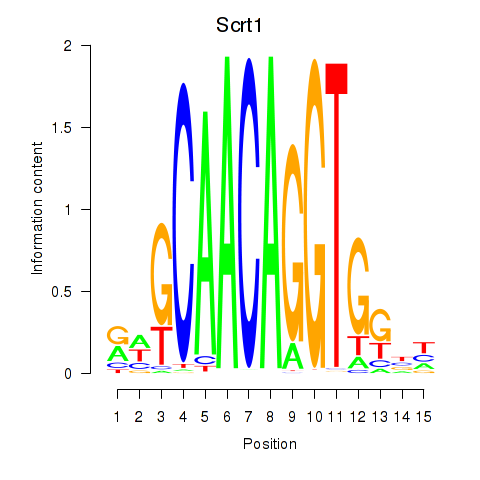
| Scrt1 | 3.684 |
|
|
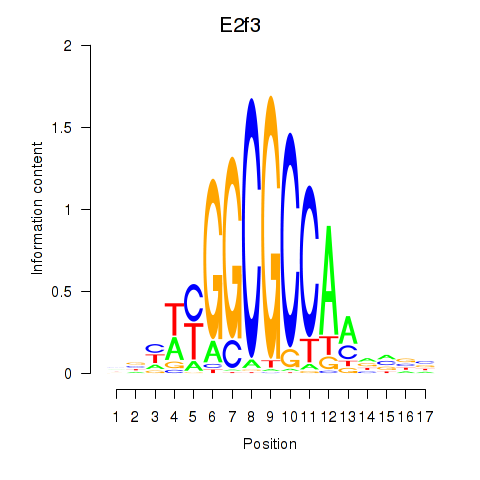
| E2f3 | 3.600 |
|
|
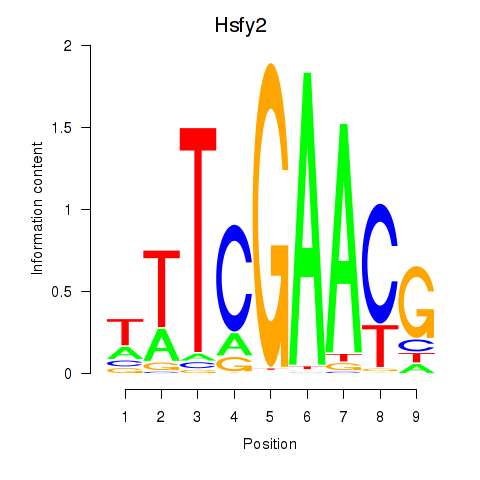
| Hsfy2 | 3.546 |
|
|
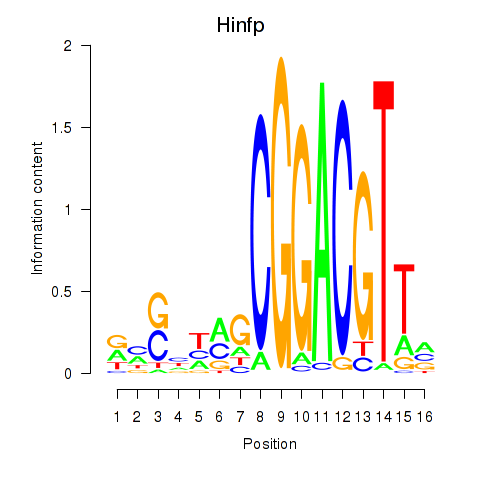
| Hinfp | 3.519 |
|
|
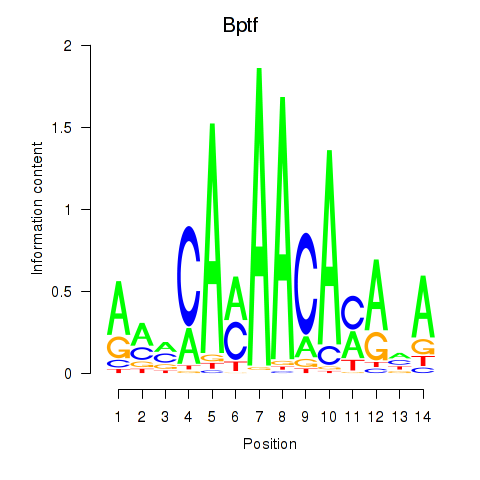
| Bptf | 3.413 |
|
|
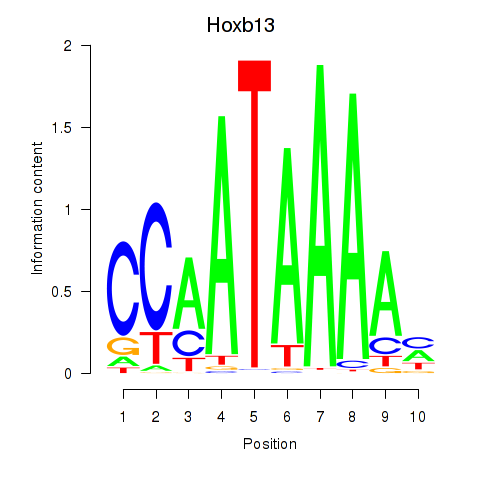
| Hoxb13 | 3.345 |
|
|
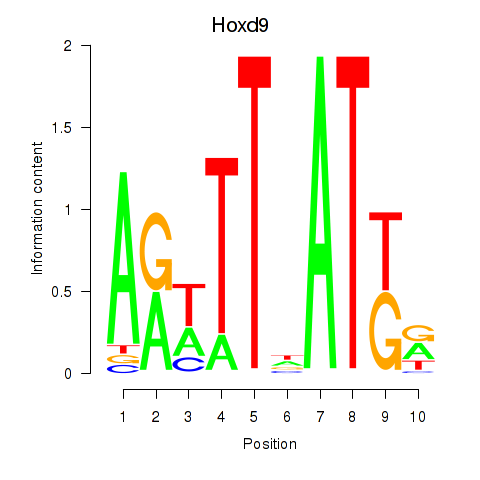
| Hoxd9 | 3.132 |
|
|
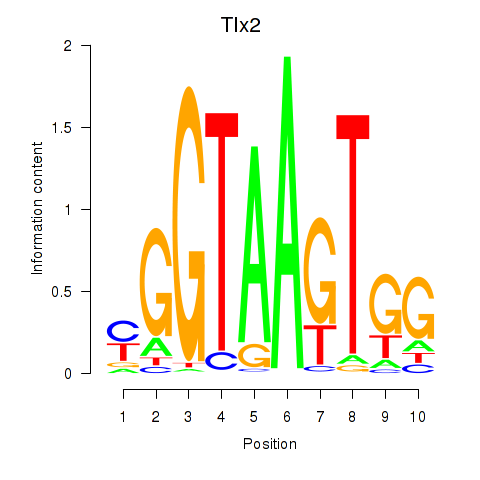
| Tlx2 | 3.064 |
|
|
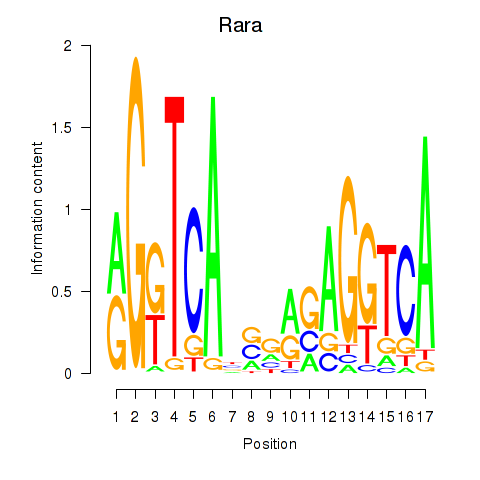
| Rara | 3.022 |
|
|
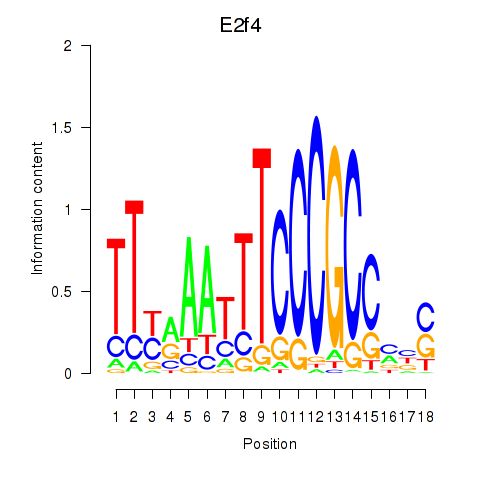
| E2f4 | 2.966 |
|
|
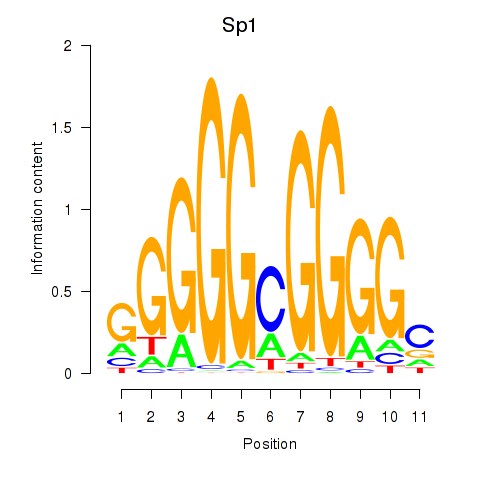
| Sp1 | 2.867 |
|
|
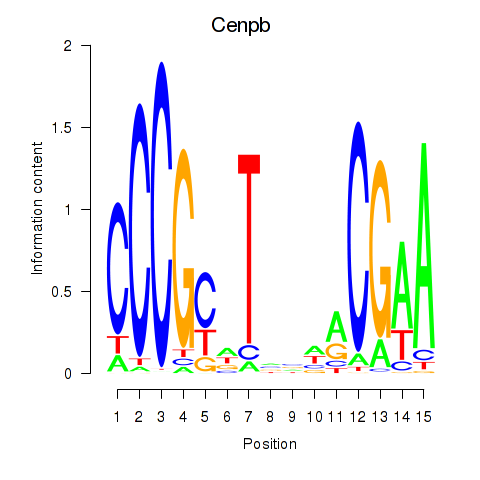
| Cenpb | 2.860 |
|
|
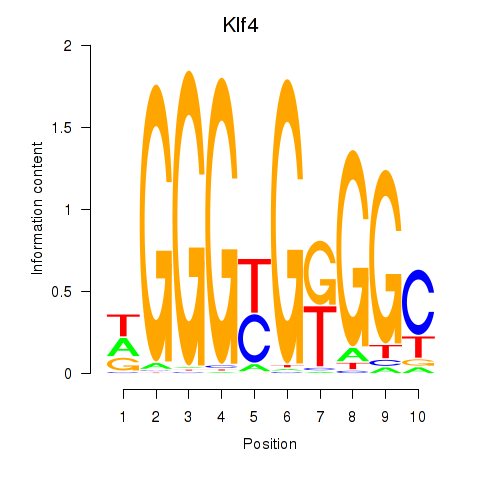
| Klf4_Sp3 | 2.860 |
|
|
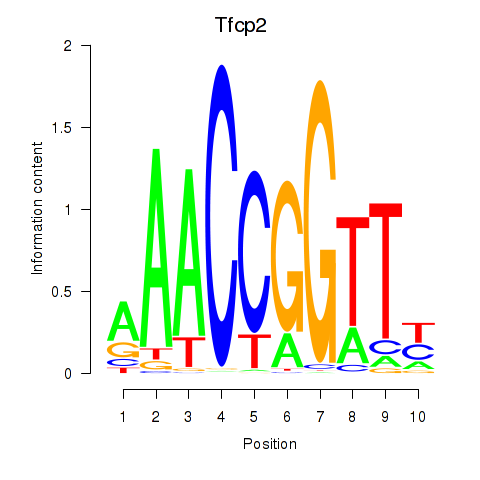
| Tfcp2 | 2.803 |
|
|
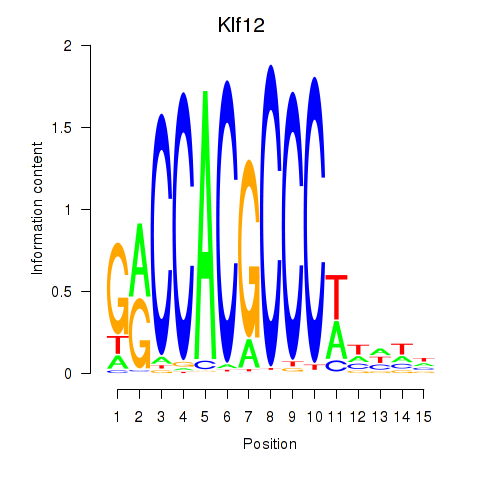
| Klf12_Klf14_Sp4 | 2.801 |
|
|
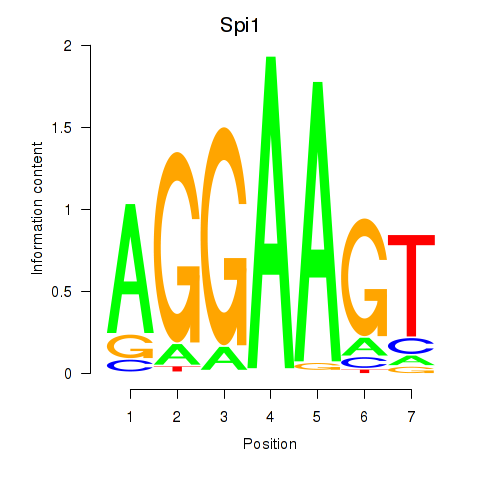
| Spi1 | 2.746 |
|
|
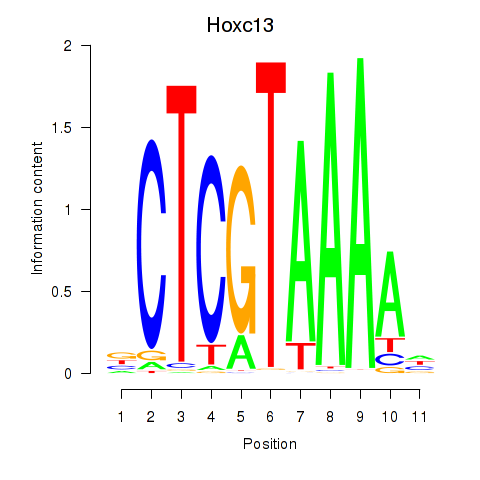
| Hoxc13_Hoxd13 | 2.733 |
|
|
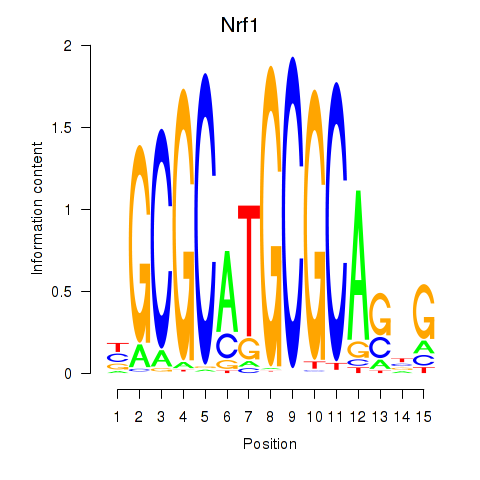
| Nrf1 | 2.729 |
|
|
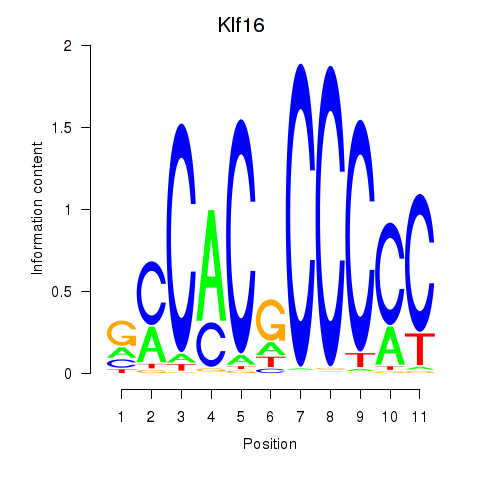
| Klf16_Sp8 | 2.723 |
|
|
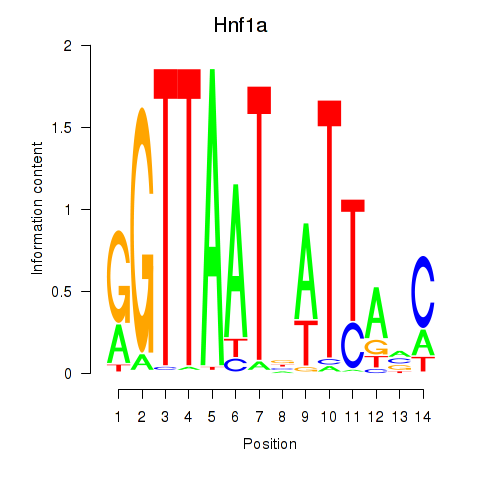
| Hnf1a | 2.723 |
|
|
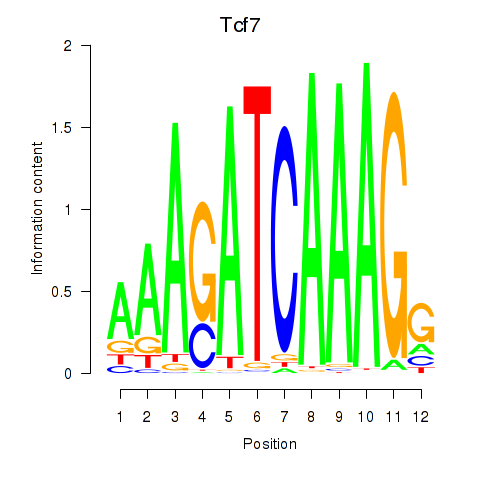
| Tcf7_Tcf7l2 | 2.682 |
|
|
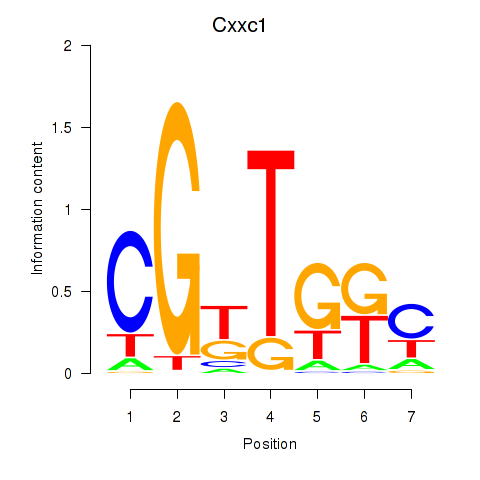
| Cxxc1 | 2.507 |
|
|
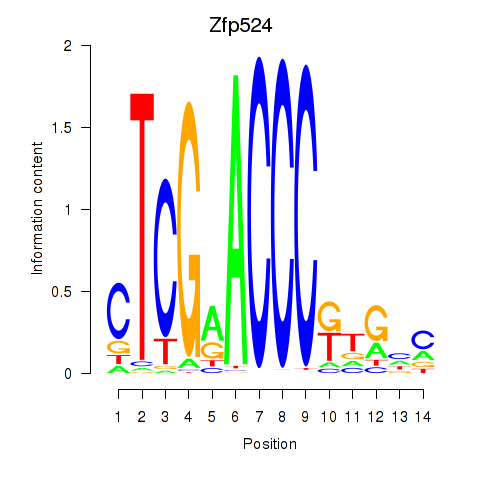
| Zfp524 | 2.480 |
|
|
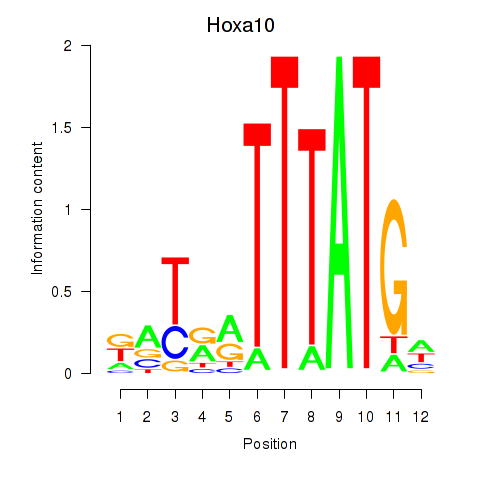
| Hoxa10 | 2.431 |
|
|
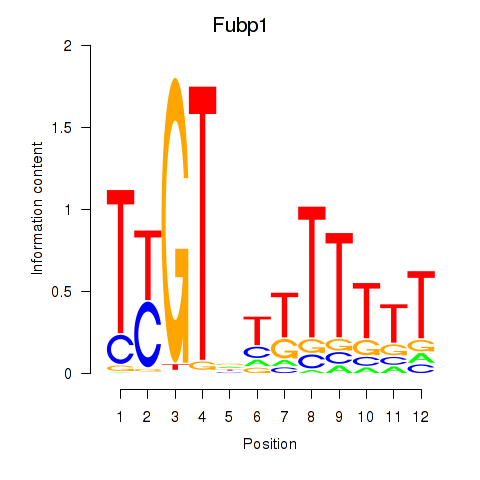
| Fubp1 | 2.312 |
|
|
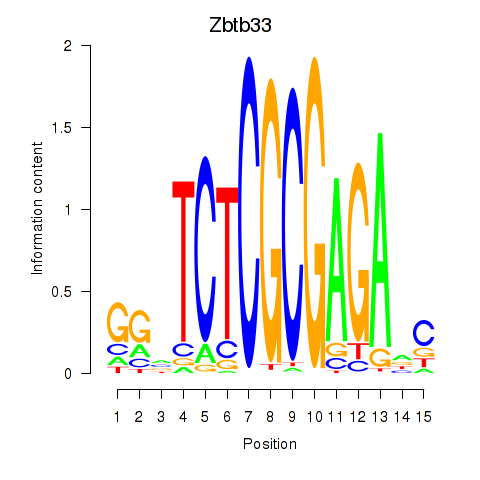
| Zbtb33_Chd2 | 2.235 |
|
|
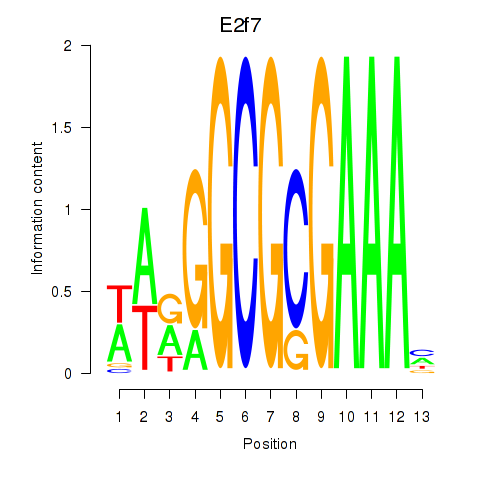
| E2f7 | 2.196 |
|
|
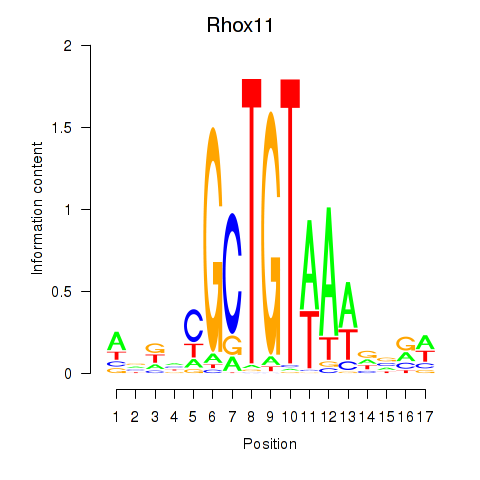
| Rhox11 | 2.143 |
|
|
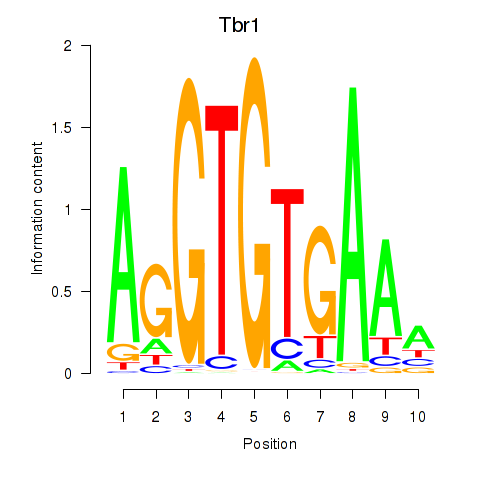
| Tbr1 | 2.109 |
|
|
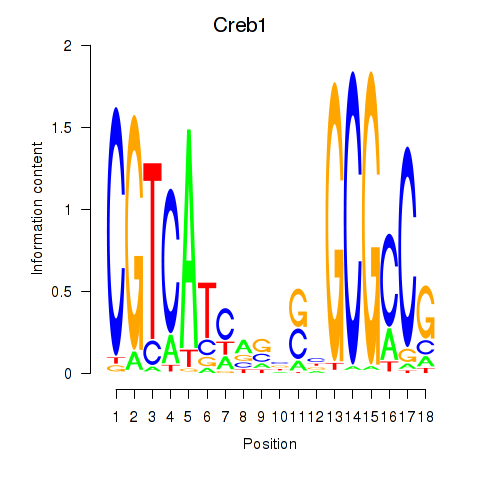
| Creb1 | 2.068 |
|
|
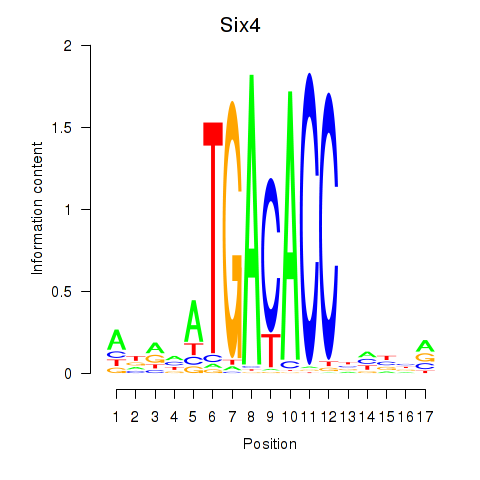
| Six4 | 2.067 |
|
|
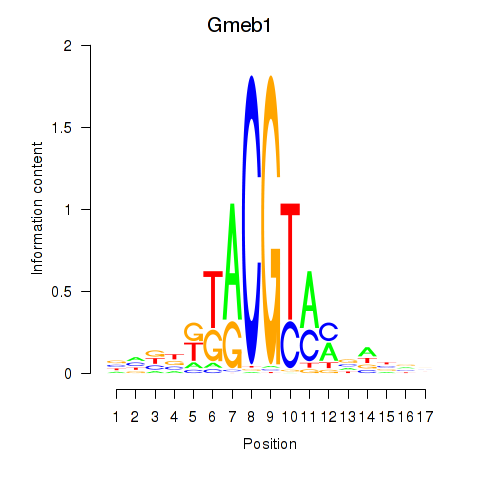
| Gmeb1 | 2.038 |
|
|
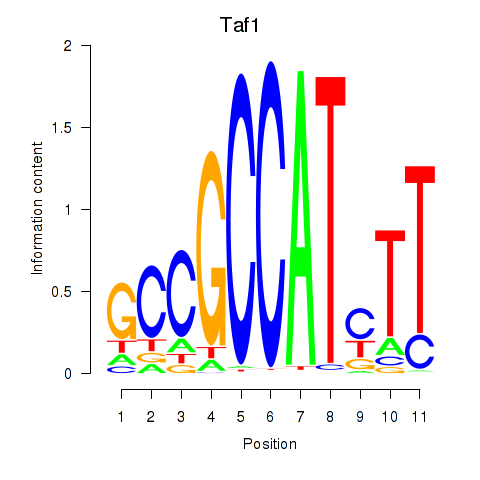
| Taf1 | 2.019 |
|
|
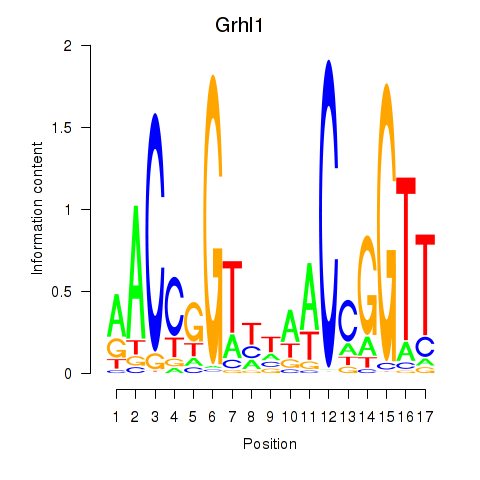
| Grhl1 | 1.991 |
|
|
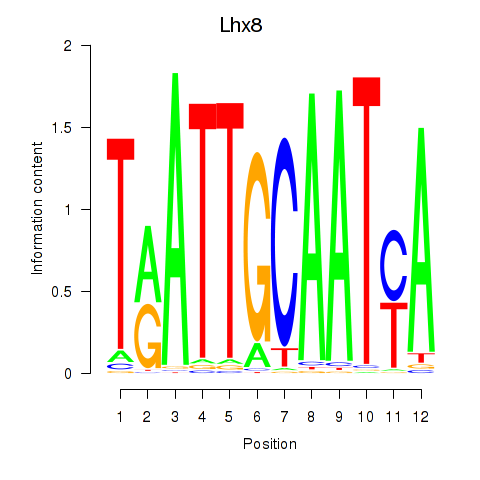
| Lhx8 | 1.929 |
|
|
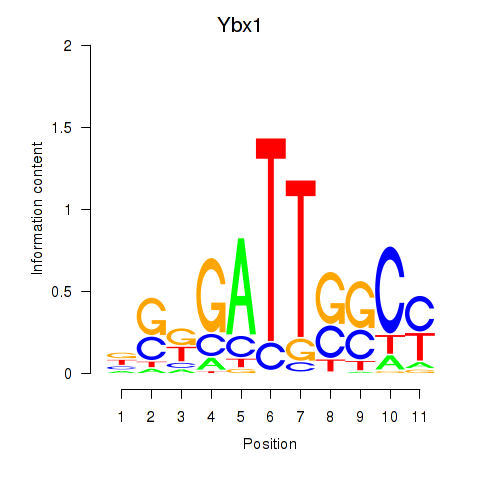
| Ybx1_Nfya_Nfyb_Nfyc_Cebpz | 1.920 |
|
|
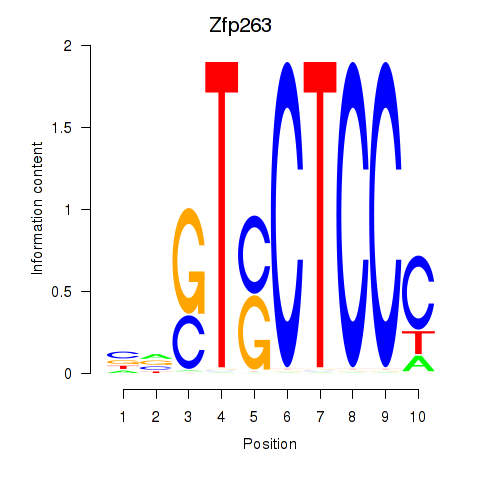
| Zfp263 | 1.909 |
|
|
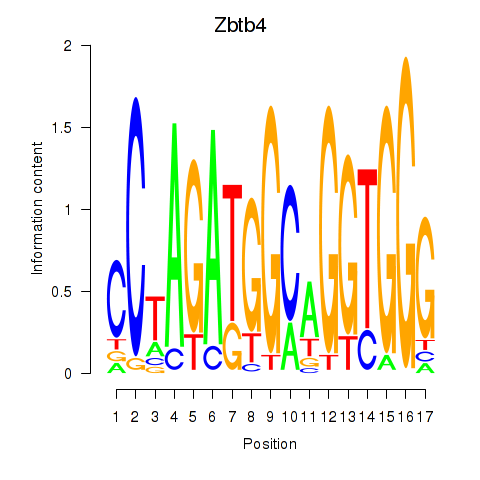
| Zbtb4 | 1.853 |
|
|
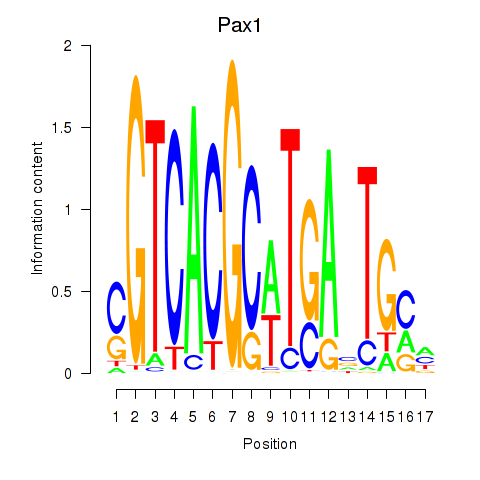
| Pax1_Pax9 | 1.827 |
|
|
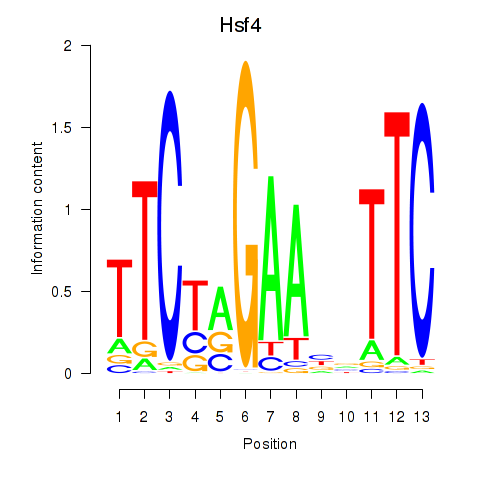
| Hsf4 | 1.801 |
|
|
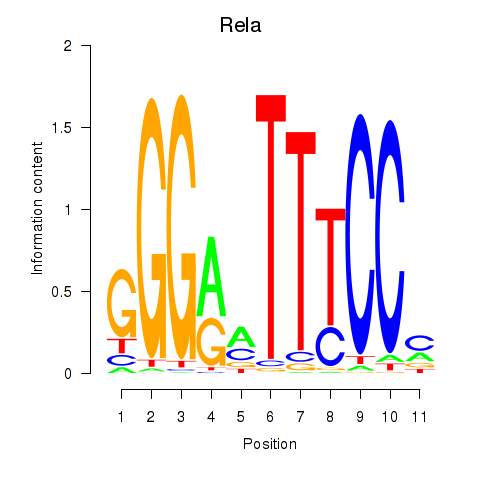
| Rela_Rel_Nfkb1 | 1.760 |
|
|
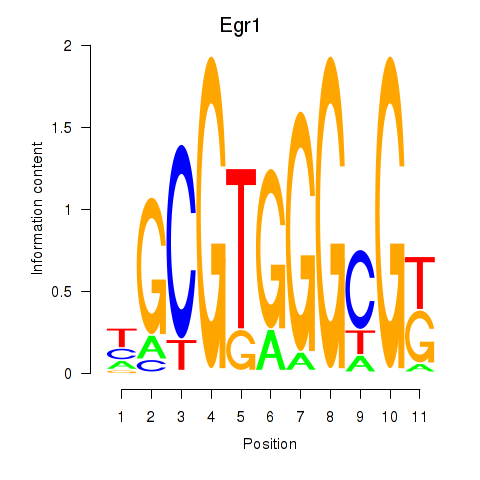
| Egr1 | 1.709 |
|
|
| Hoxa7_Hoxc8 | 1.707 |
|

|
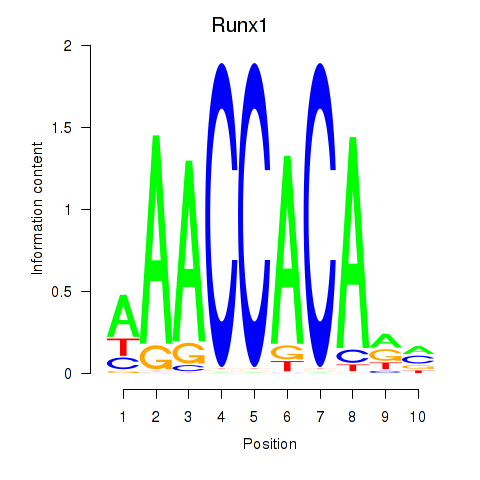
| Runx1 | 1.660 |
|
|
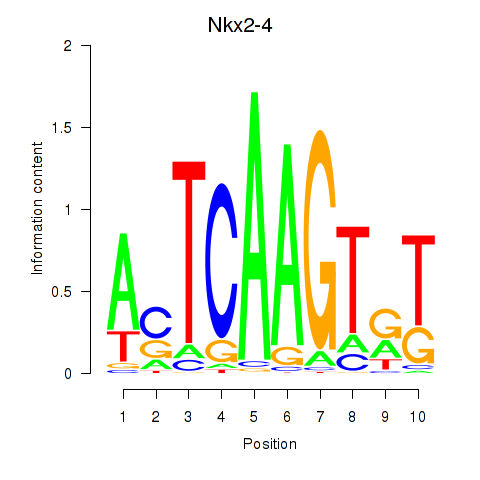
| Nkx2-4 | 1.600 |
|
|
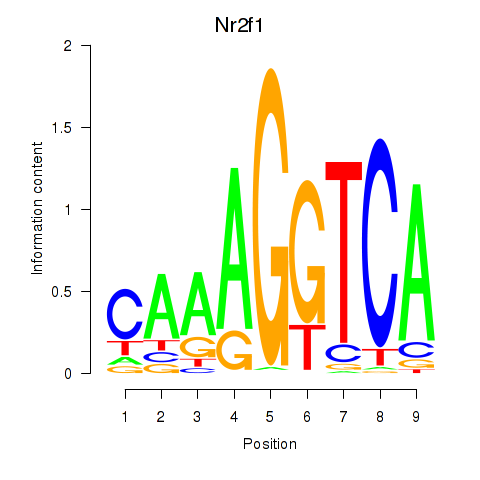
| Nr2f1_Nr4a1 | 1.595 |
|
|
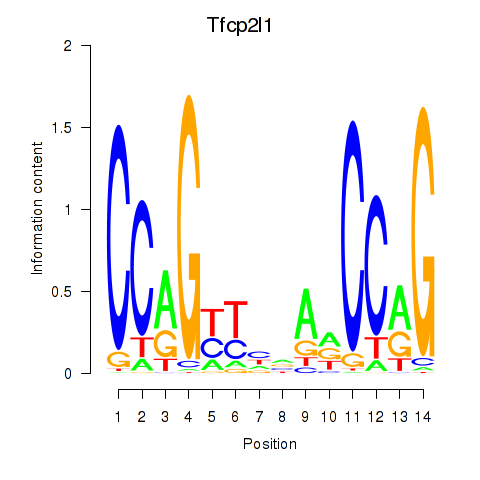
| Tfcp2l1 | 1.591 |
|
|
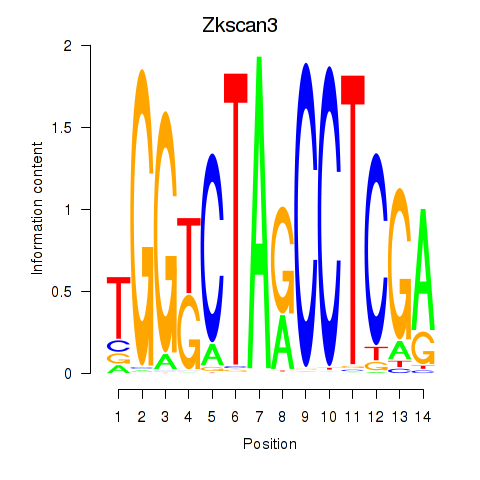
| Zkscan3 | 1.542 |
|
|
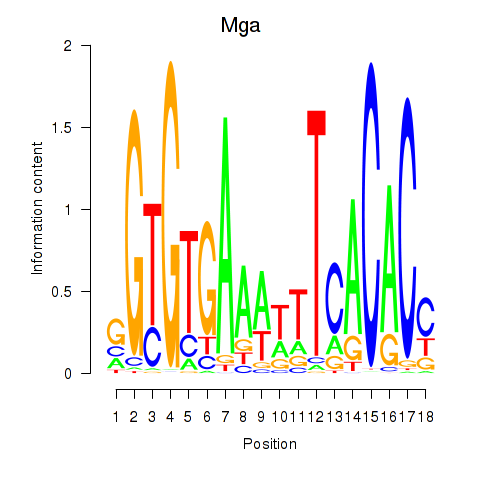
| Mga | 1.535 |
|
|
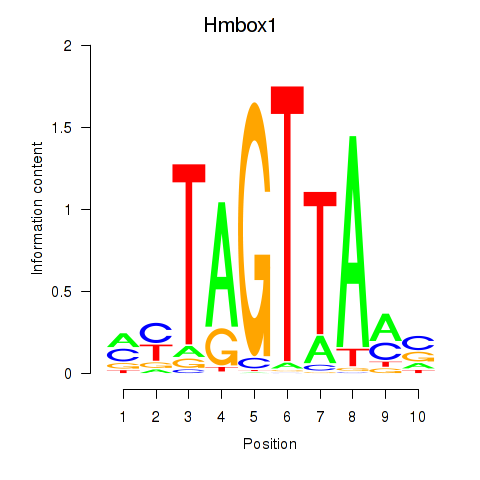
| Hmbox1 | 1.518 |
|
|
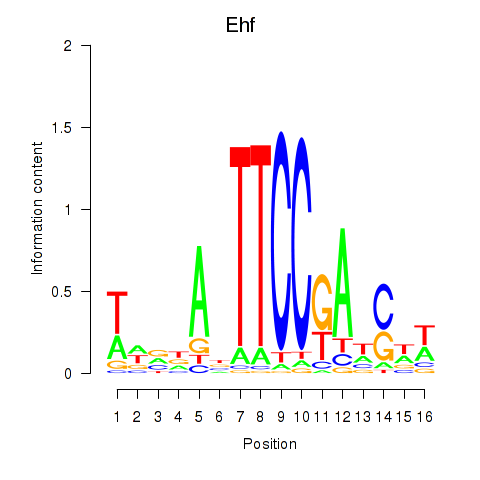
| Ehf | 1.515 |
|
|
| Creb3 | 1.506 |
|

|
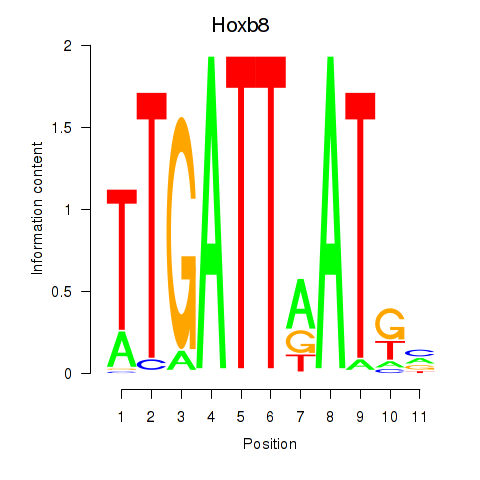
| Hoxb8_Pdx1 | 1.506 |
|
|
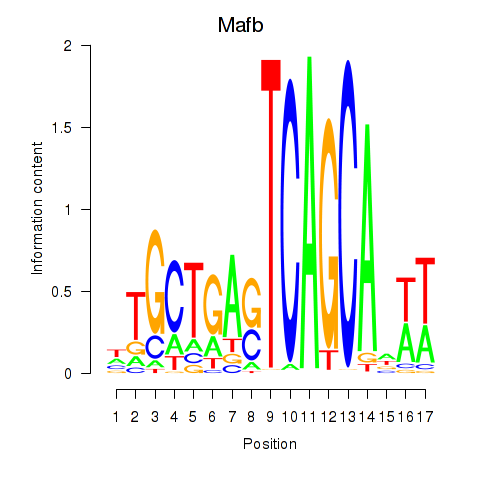
| Mafb | 1.495 |
|
|
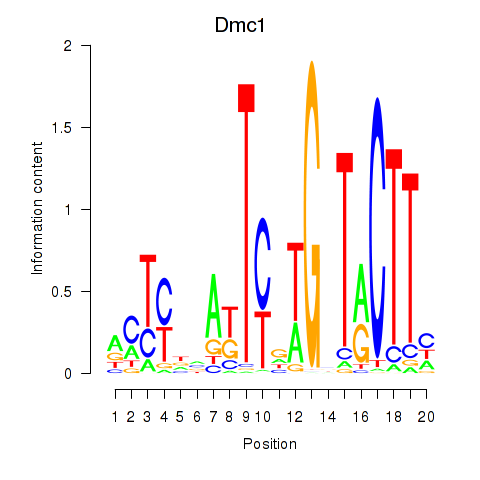
| Dmc1 | 1.447 |
|
|
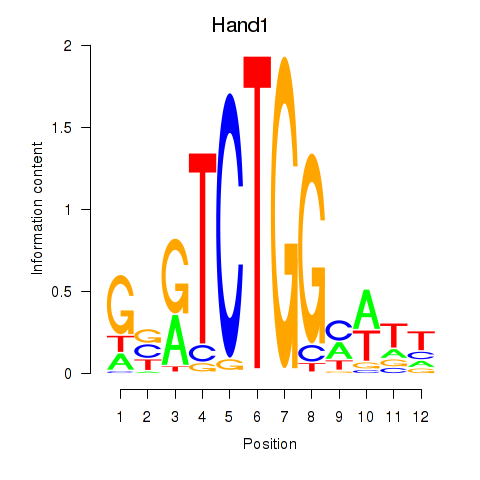
| Hand1 | 1.431 |
|
|
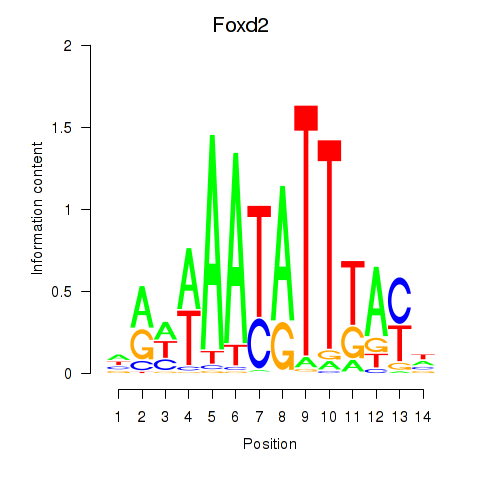
| Foxd2 | 1.402 |
|
|
| Nr0b1 | 1.344 |
|

|
| Pitx3 | 1.336 |
|

|
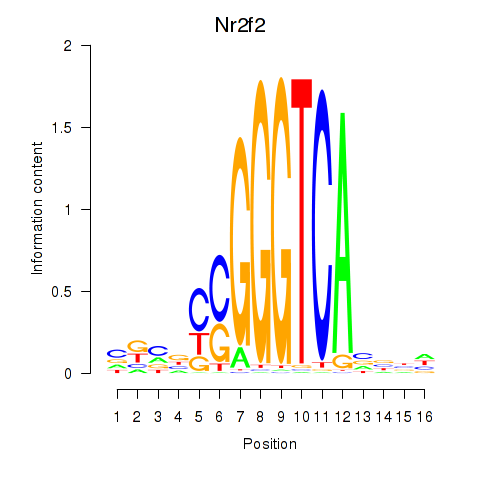
| Nr2f2 | 1.316 |
|
|
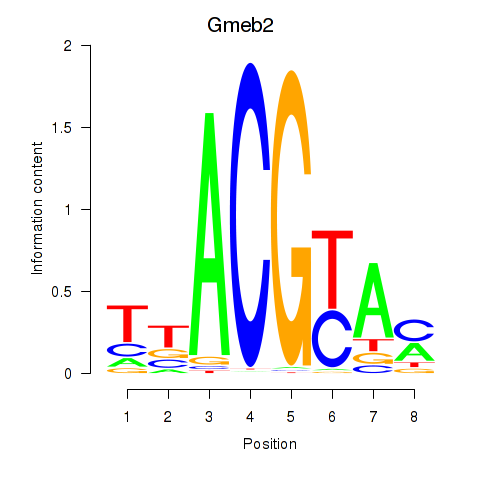
| Gmeb2 | 1.310 |
|
|
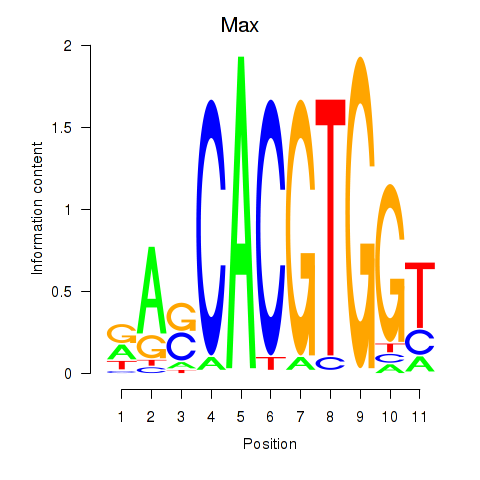
| Max_Mycn | 1.305 |
|
|
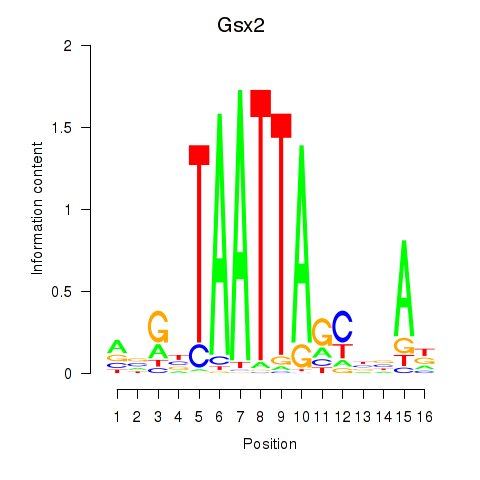
| Gsx2_Hoxd3_Vax1 | 1.300 |
|
|
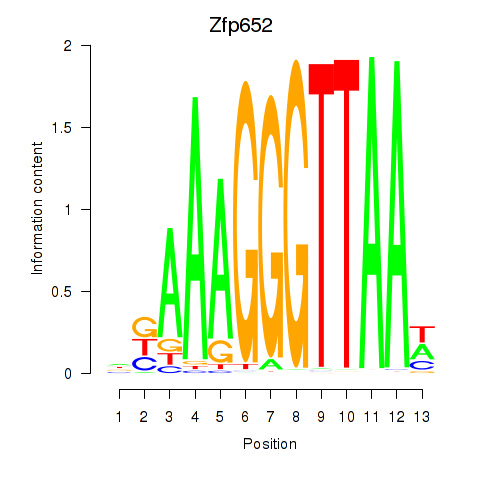
| Zfp652 | 1.300 |
|
|
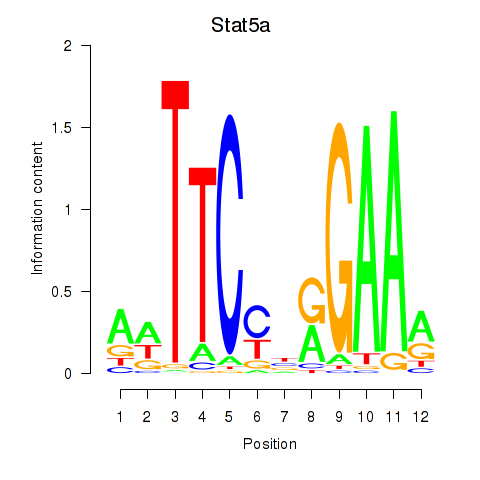
| Stat5a | 1.294 |
|
|
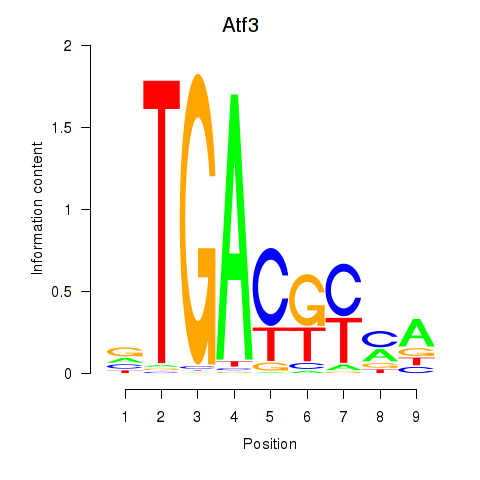
| Atf3 | 1.269 |
|
|
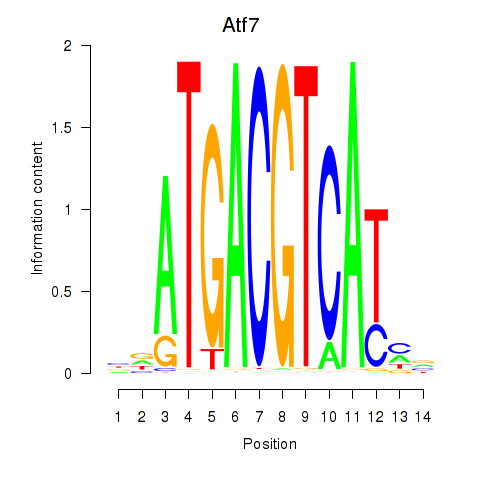
| Atf7_E4f1 | 1.265 |
|
|
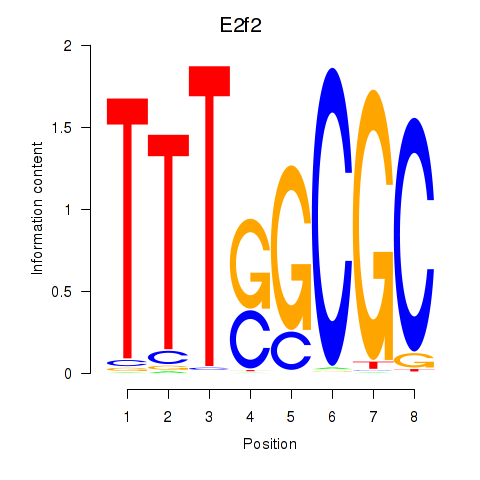
| E2f2_E2f5 | 1.254 |
|
|
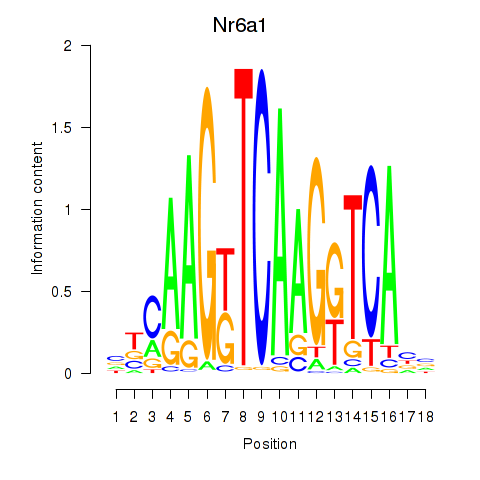
| Nr6a1 | 1.232 |
|
|
| Irf3 | 1.232 |
|
|
| Pknox2_Pknox1 | 1.232 |
|
|
| Mtf1 | 1.220 |
|
|
| Zbtb7a | 1.213 |
|
|
| Nr2c2 | 1.211 |
|
|
| Foxo3 | 1.207 |
|
|
| Nfatc2 | 1.178 |
|
|
| Nr1i3 | 1.169 |
|
|
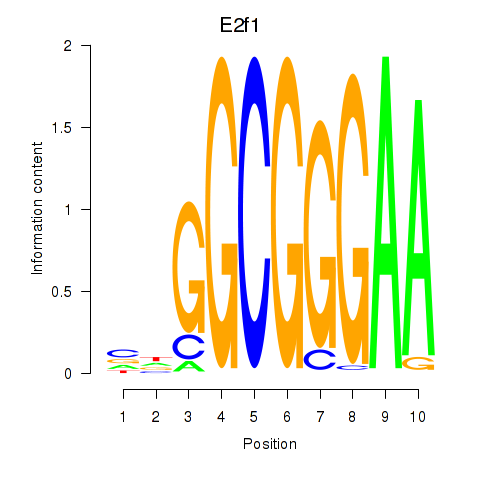
| E2f1 | 1.159 |
|
|
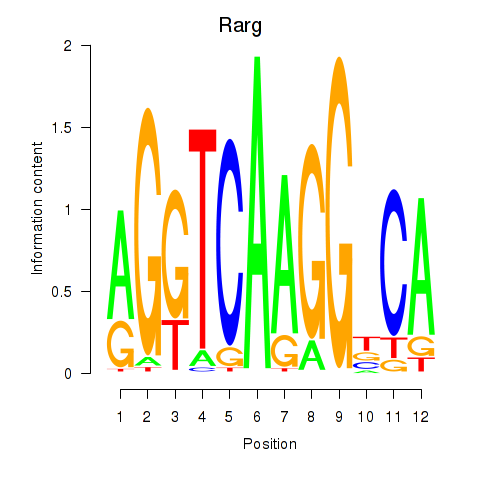
| Rarg | 1.147 |
|
|
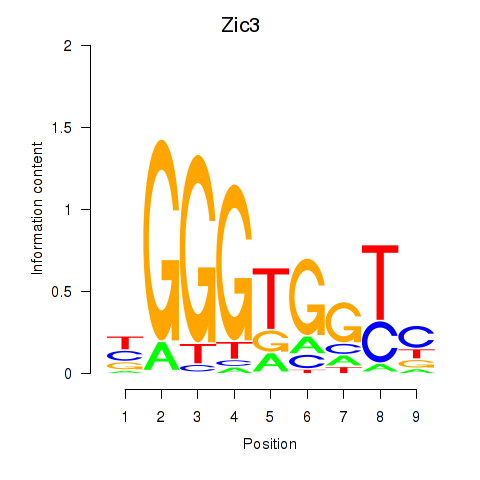
| Zic3 | 1.135 |
|
|
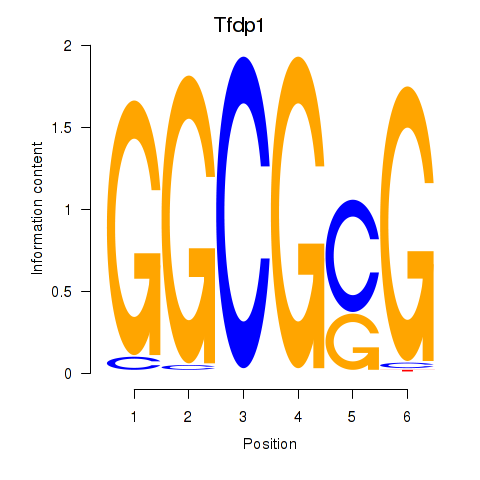
| Tfdp1_Wt1_Egr2 | 1.122 |
|
|
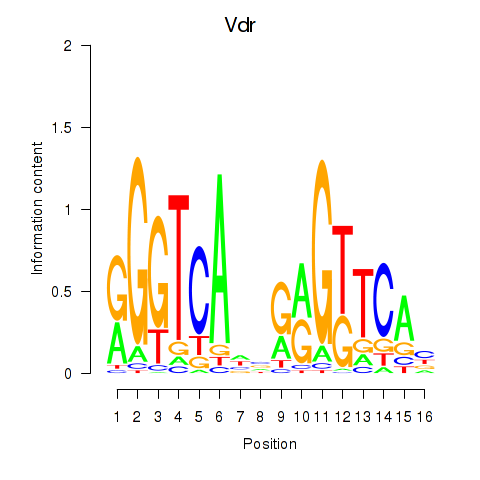
| Vdr | 1.115 |
|
|
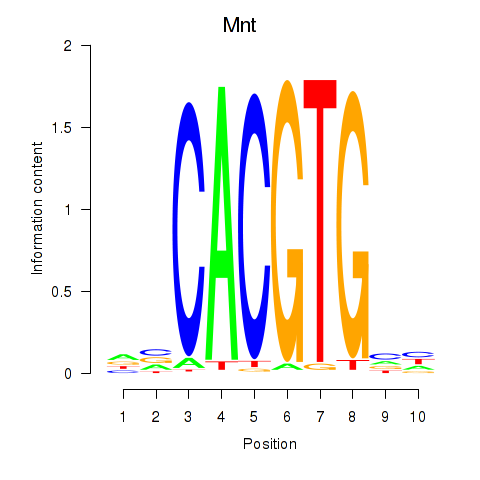
| Mnt | 1.094 |
|
|
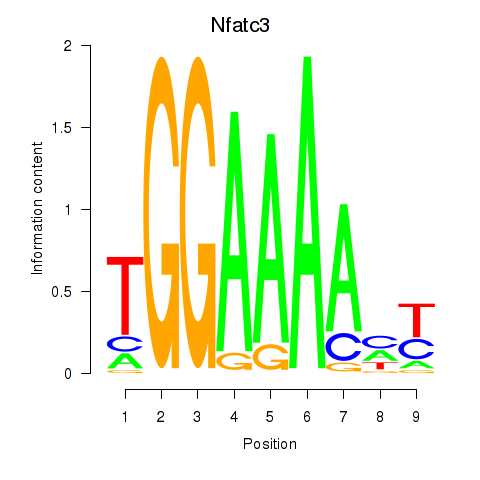
| Nfatc3 | 1.083 |
|
|
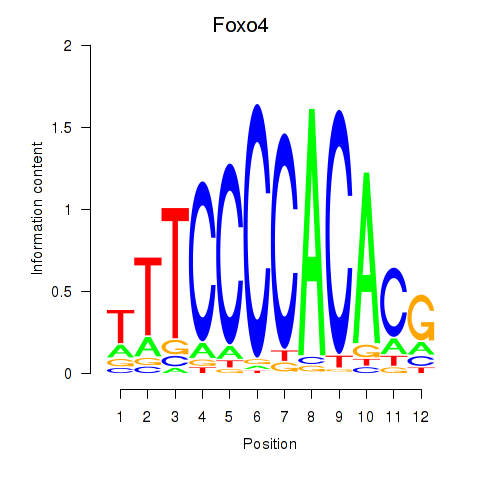
| Foxo4 | 1.071 |
|
|
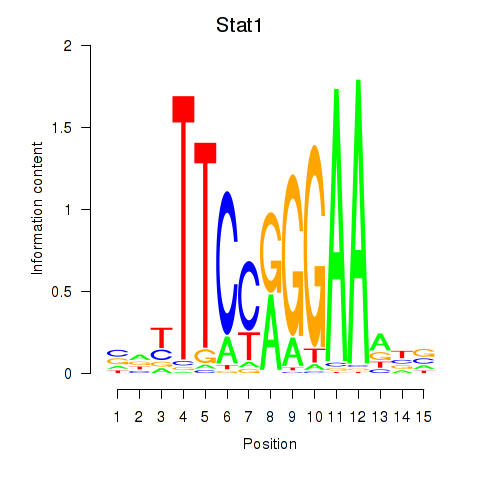
| Stat1 | 1.066 |
|
|
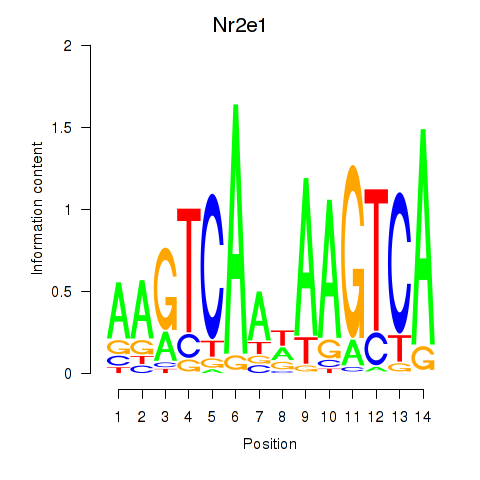
| Nr2e1 | 1.057 |
|
|
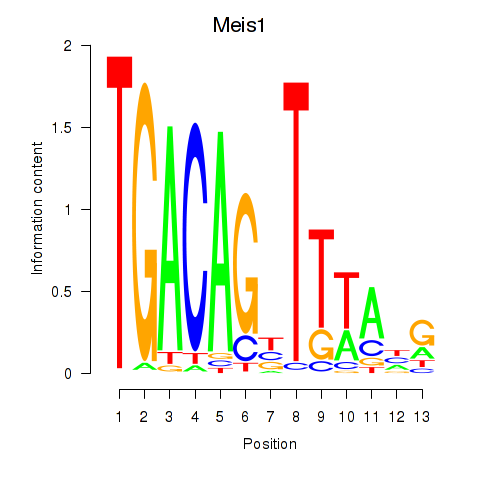
| Meis1 | 1.049 |
|
|
| Thra | 1.047 |
|

|
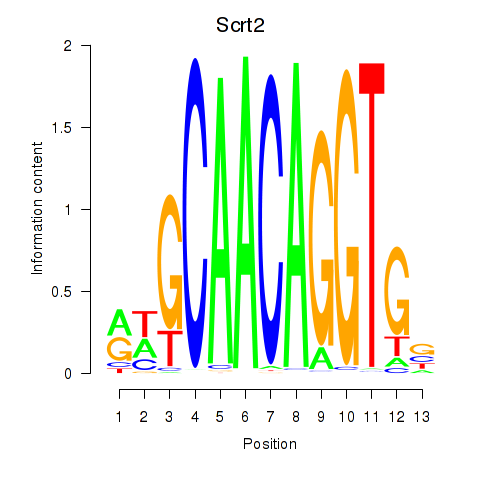
| Scrt2 | 1.032 |
|
|
| Zbtb12 | 1.006 |
|
|
| Snai1_Zeb1_Snai2 | 1.000 |
|
|
| Hoxb6 | 0.996 |
|
|
| Tbx5 | 0.987 |
|
|
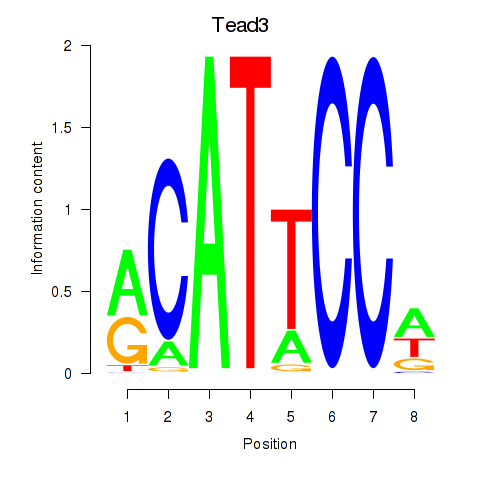
| Tead3_Tead4 | 0.983 |
|
|
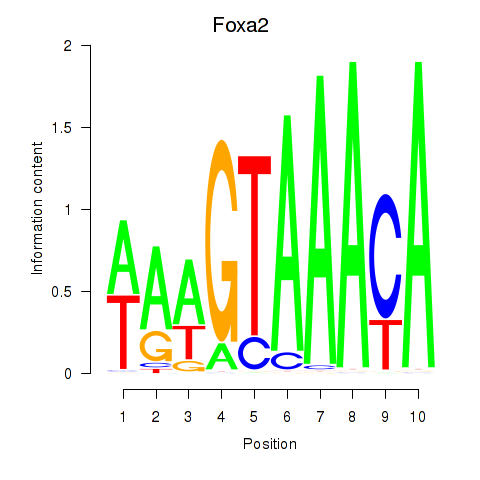
| Foxa2_Foxa1 | 0.982 |
|
|
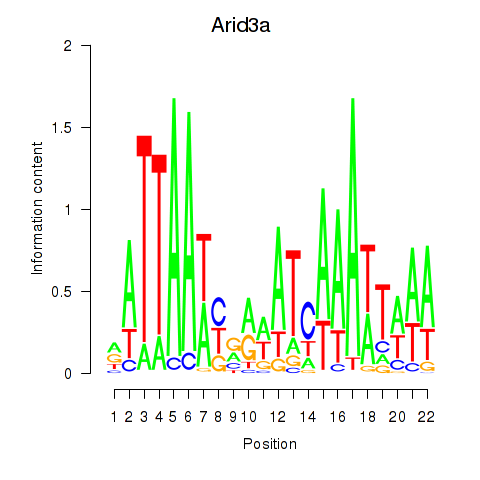
| Arid3a | 0.980 |
|
|
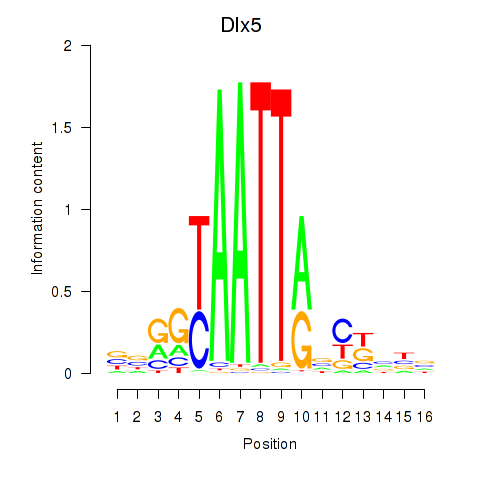
| Dlx5_Dlx4 | 0.972 |
|
|
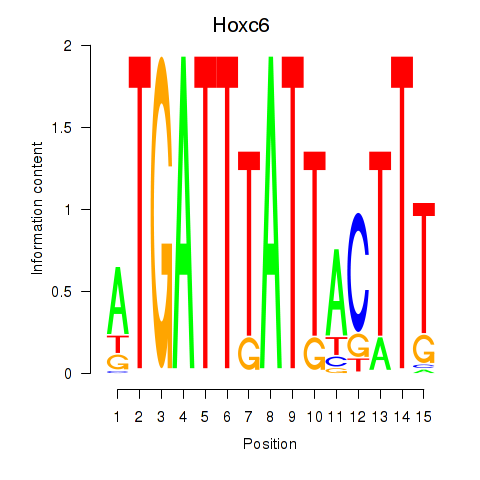
| Hoxc6 | 0.969 |
|
|
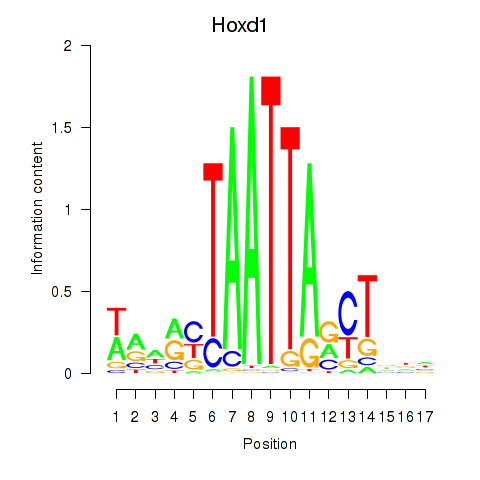
| Hoxd1 | 0.957 |
|
|
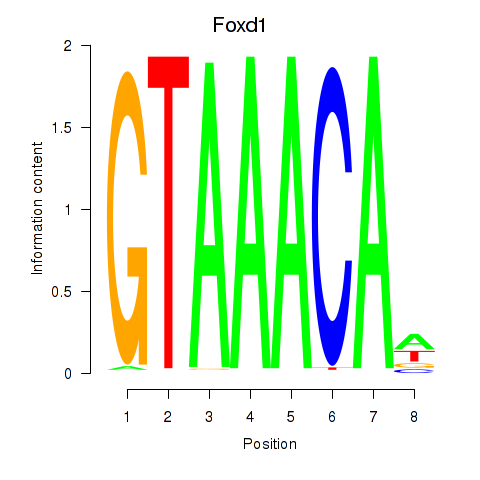
| Foxd1 | 0.945 |
|
|
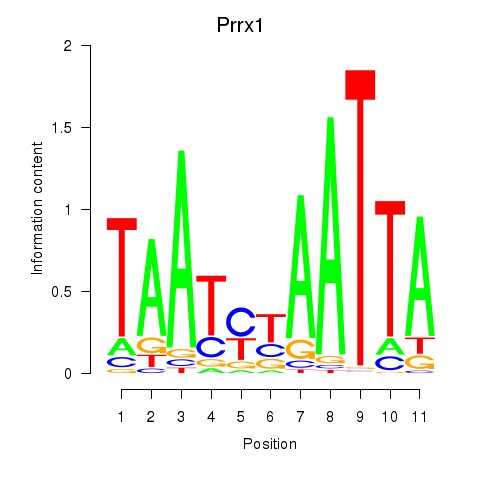
| Prrx1_Isx_Prrxl1 | 0.941 |
|
|
| Foxc1 | 0.936 |
|

|
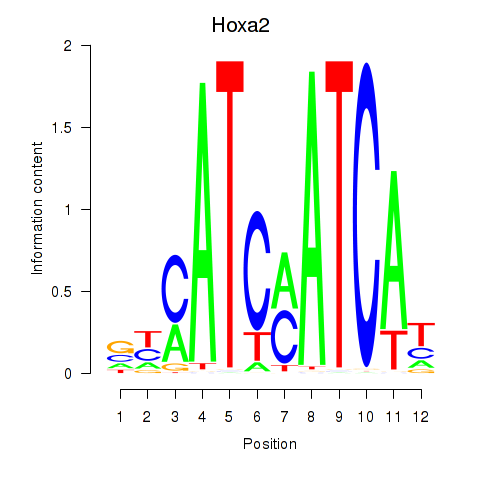
| Hoxa2 | 0.927 |
|
|
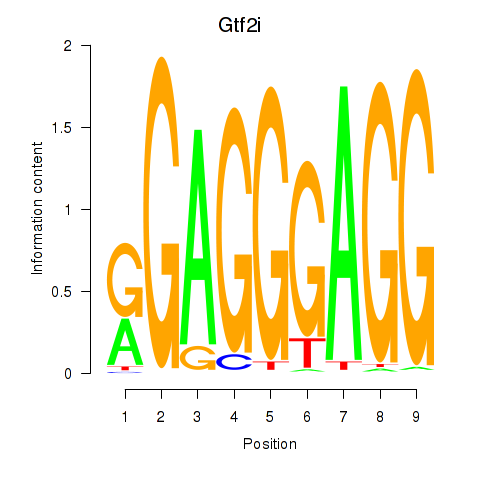
| Gtf2i_Gtf2f1 | 0.908 |
|
|
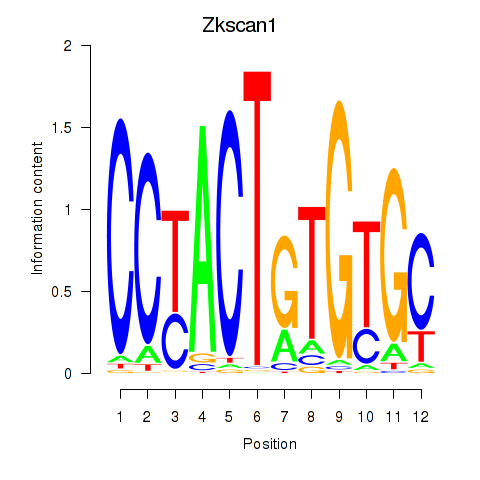
| Zkscan1 | 0.906 |
|
|
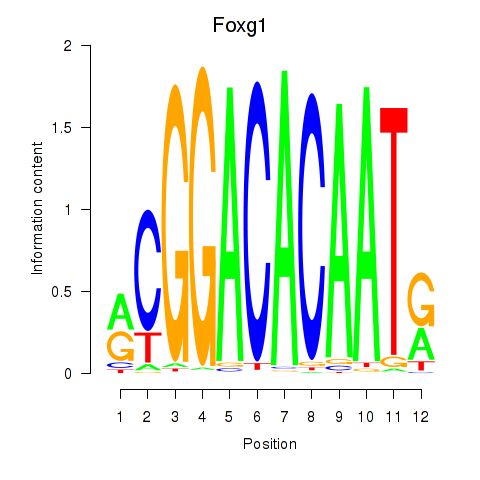
| Foxg1 | 0.902 |
|
|
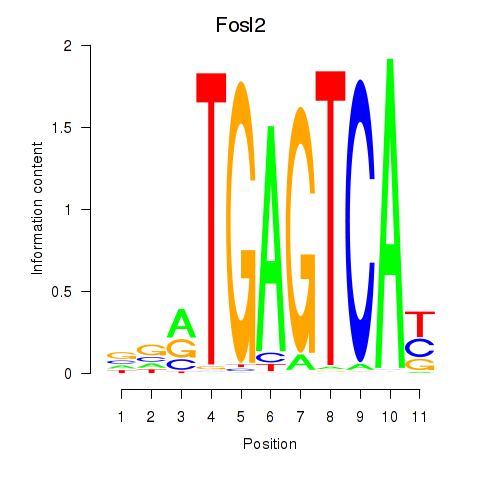
| Fosl2_Bach2 | 0.894 |
|
|
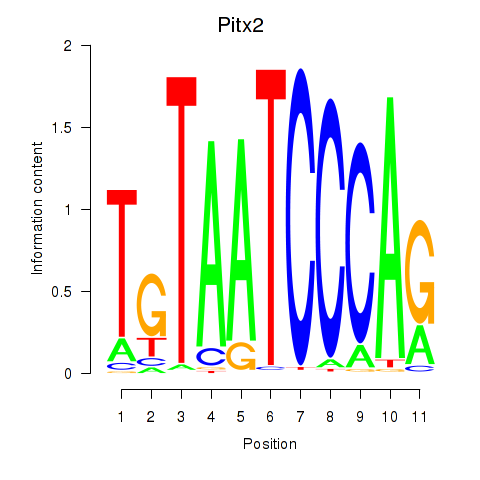
| Pitx2_Otx2 | 0.894 |
|
|
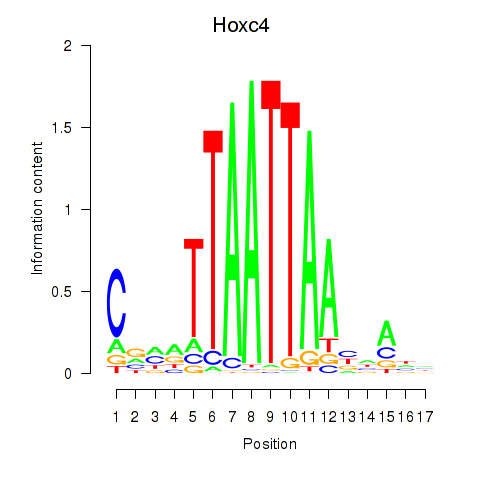
| Hoxc4_Arx_Otp_Esx1_Phox2b | 0.892 |
|
|
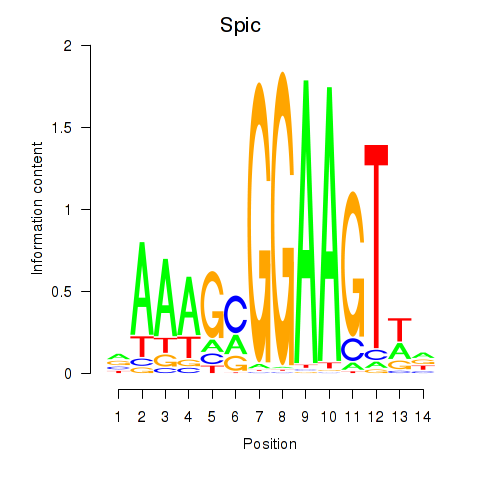
| Spic | 0.891 |
|
|
| Pitx1 | 0.878 |
|
|
| En2 | 0.848 |
|
|
| Foxa3 | 0.845 |
|
|
| Hnf4a | 0.818 |
|
|
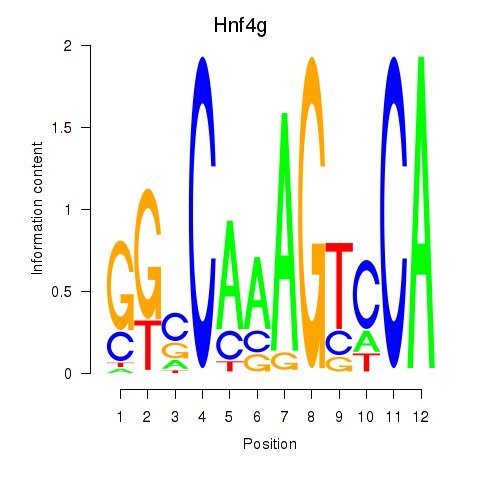
| Hnf4g | 0.798 |
|
|
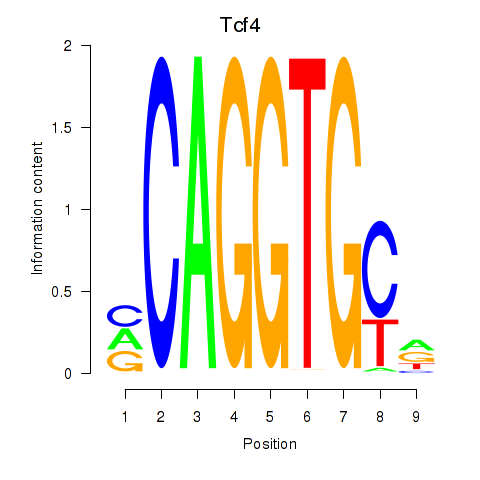
| Tcf4_Mesp1 | 0.789 |
|
|
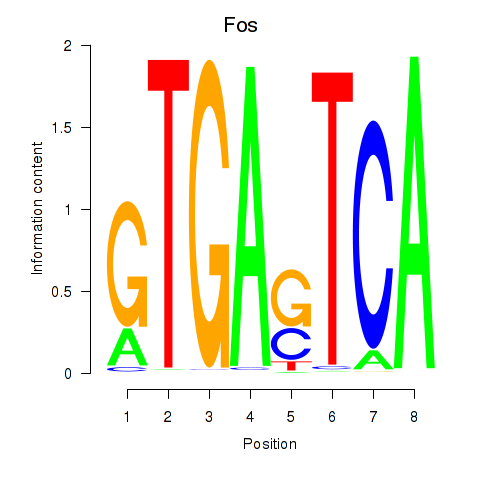
| Fos | 0.788 |
|
|
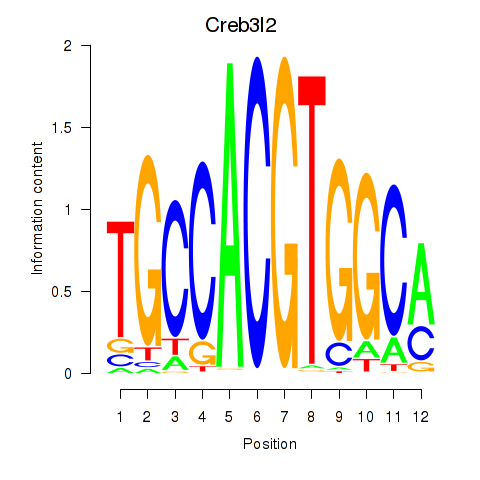
| Creb3l2 | 0.785 |
|
|
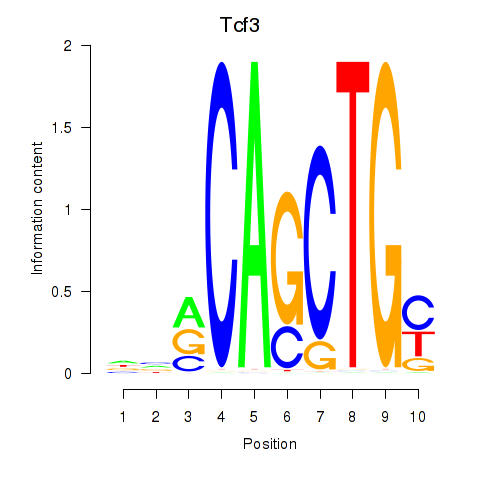
| Tcf3 | 0.772 |
|
|
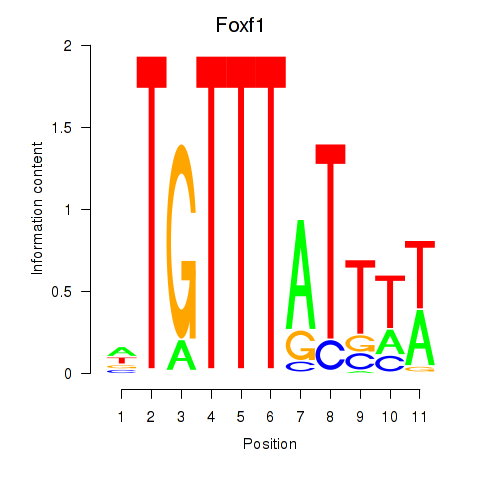
| Foxf1 | 0.772 |
|
|
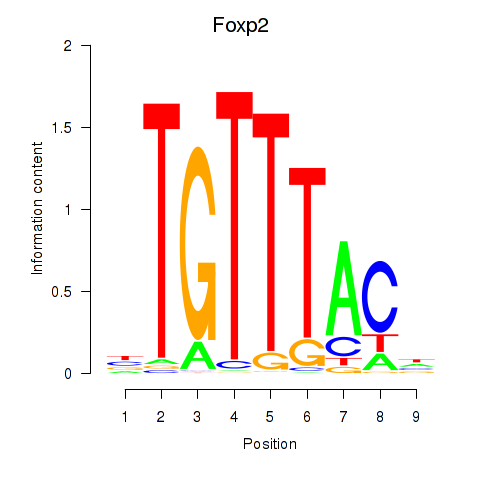
| Foxp2_Foxp3 | 0.750 |
|
|
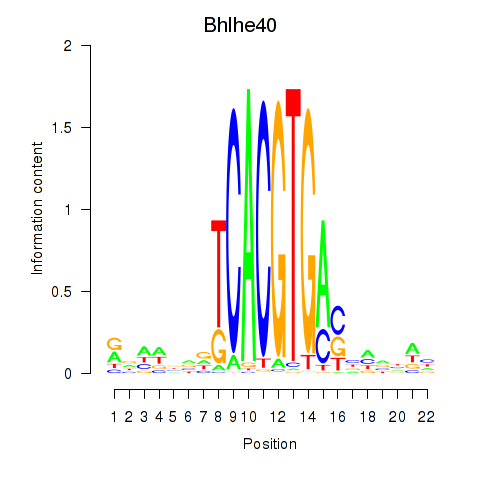
| Bhlhe40 | 0.726 |
|
|
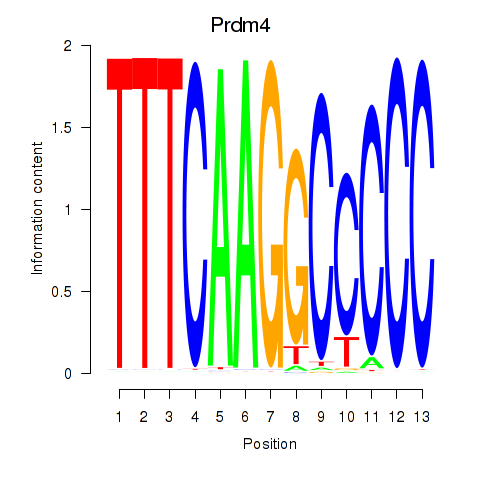
| Prdm4 | 0.703 |
|
|
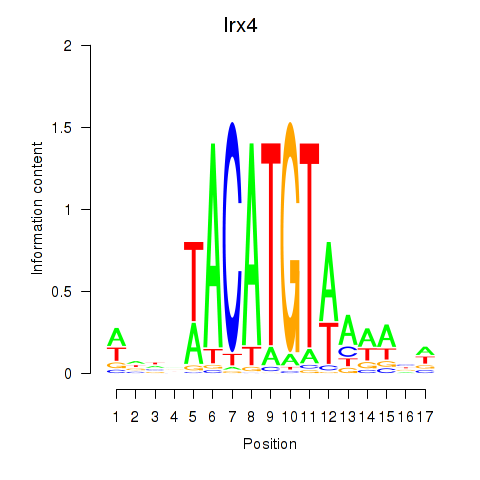
| Irx4 | 0.703 |
|
|
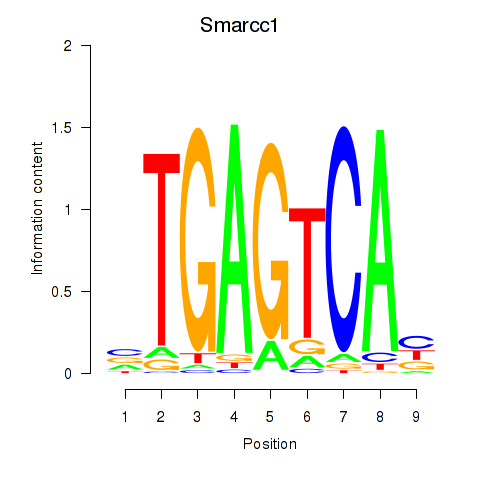
| Smarcc1_Fosl1 | 0.700 |
|
|
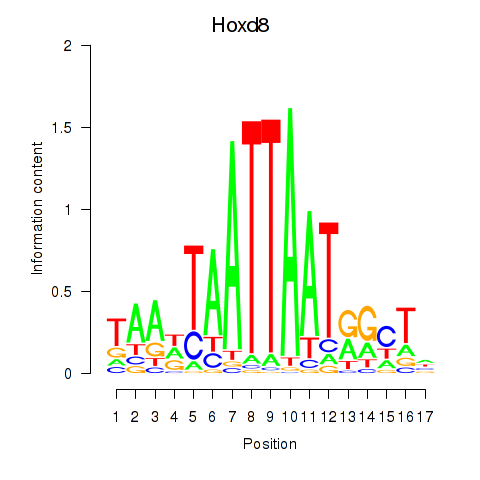
| Hoxd8 | 0.697 |
|
|
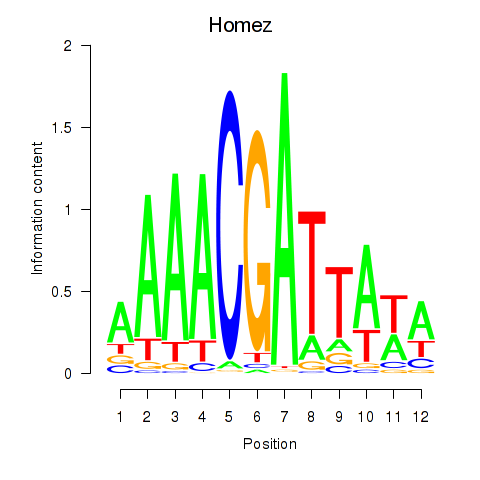
| Homez | 0.685 |
|
|
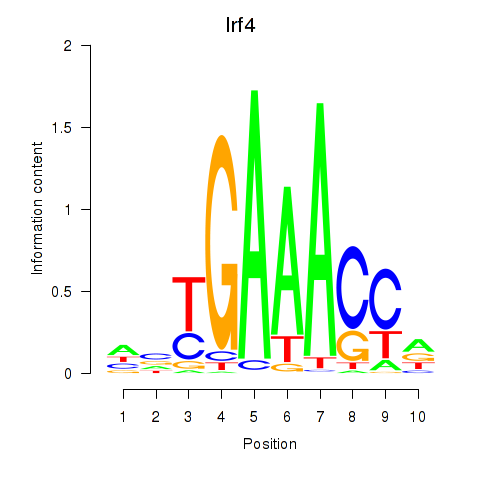
| Irf4 | 0.677 |
|
|
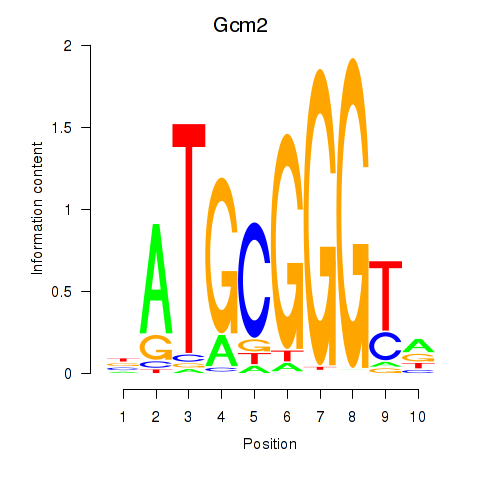
| Gcm2 | 0.672 |
|
|
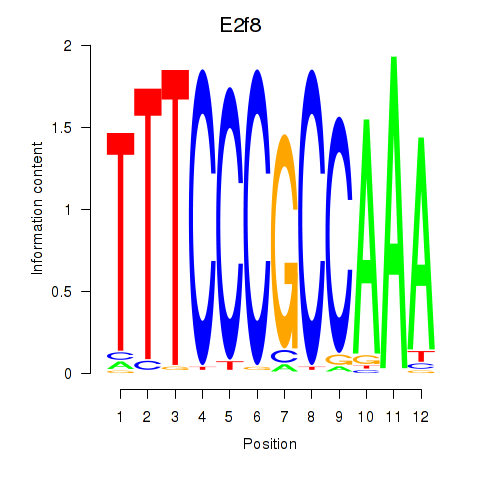
| E2f8 | 0.657 |
|
|
| Nkx2-3 | 0.641 |
|
|
| Foxc2 | 0.641 |
|
|
| Tbx20 | 0.637 |
|
|
| Gli1 | 0.626 |
|
|
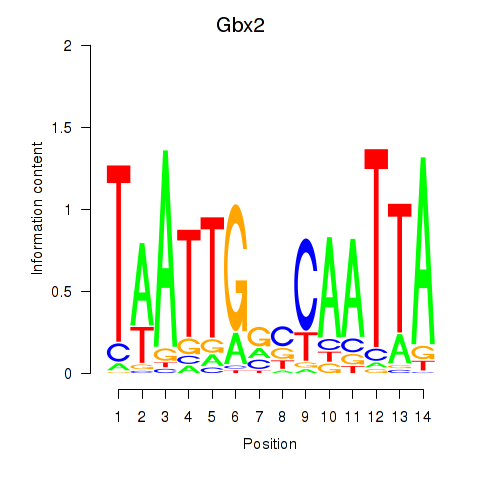
| Gbx2 | 0.623 |
|
|
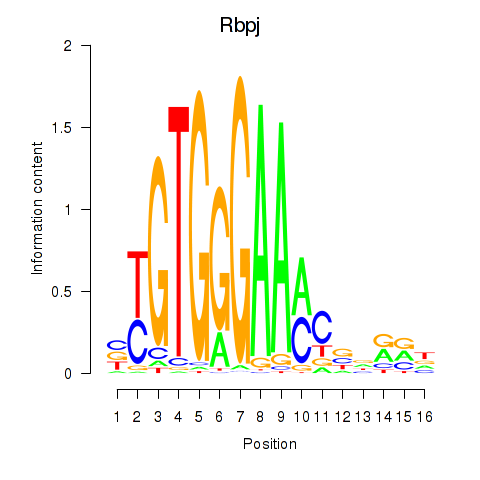
| Rbpj | 0.607 |
|
|
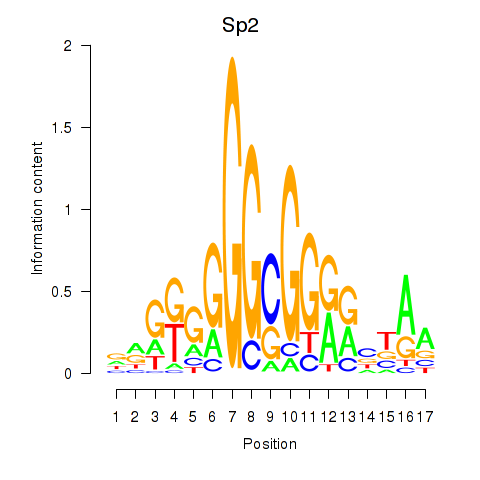
| Sp2 | 0.603 |
|
|
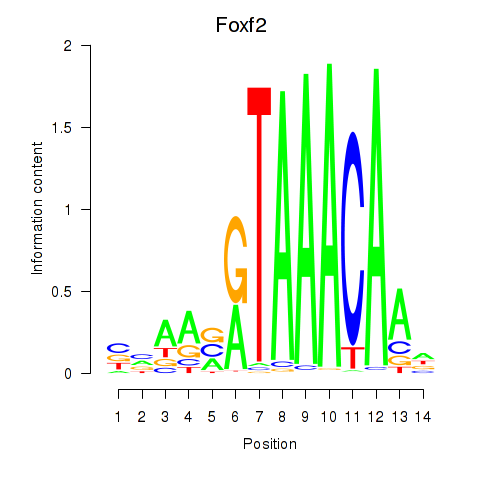
| Foxf2 | 0.601 |
|
|
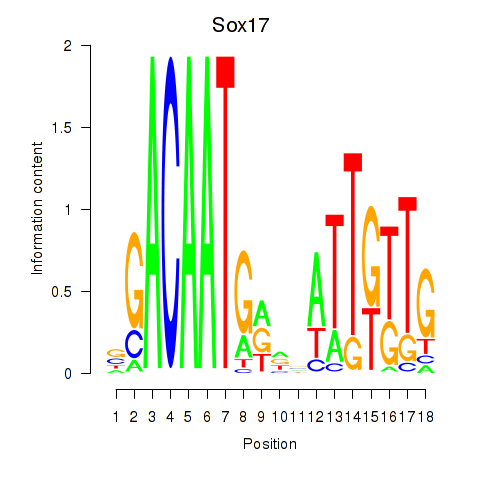
| Sox17 | 0.597 |
|
|
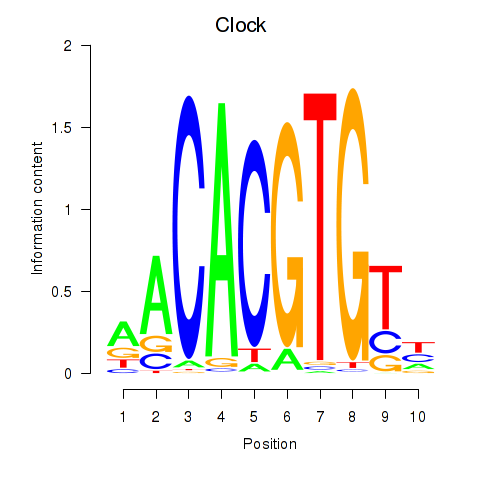
| Clock | 0.590 |
|
|
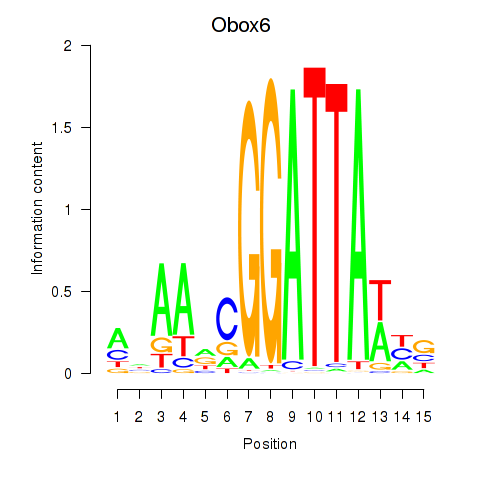
| Obox6_Obox5 | 0.589 |
|
|
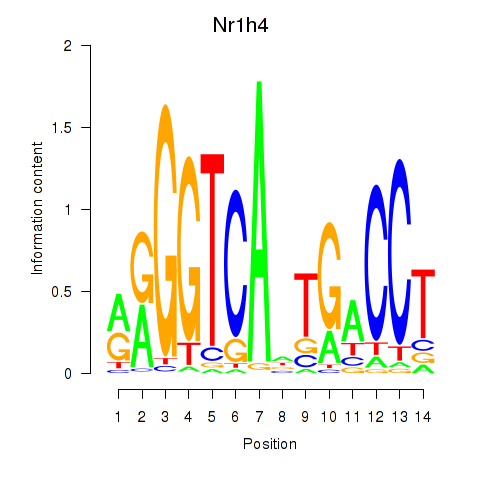
| Nr1h4 | 0.578 |
|
|
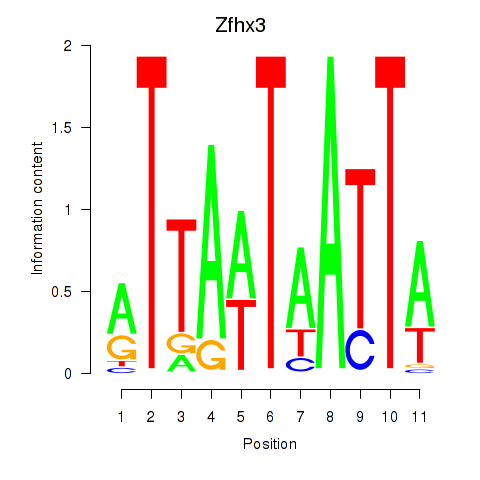
| Zfhx3 | 0.576 |
|
|
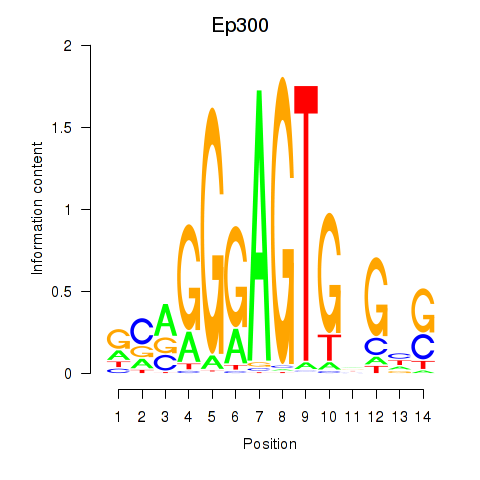
| Ep300 | 0.569 |
|
|
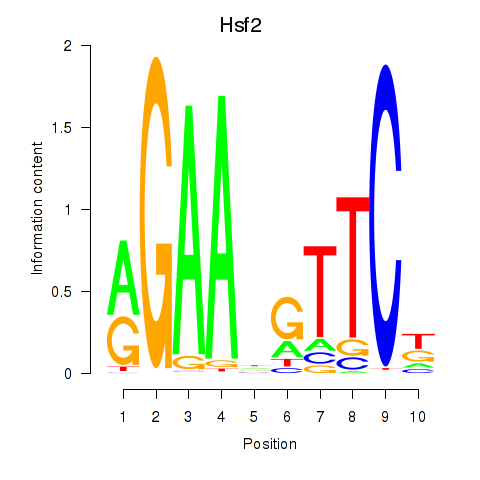
| Hsf2 | 0.558 |
|
|
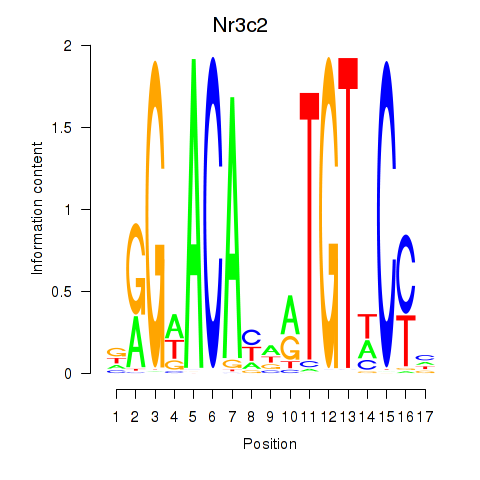
| Nr3c2 | 0.554 |
|
|
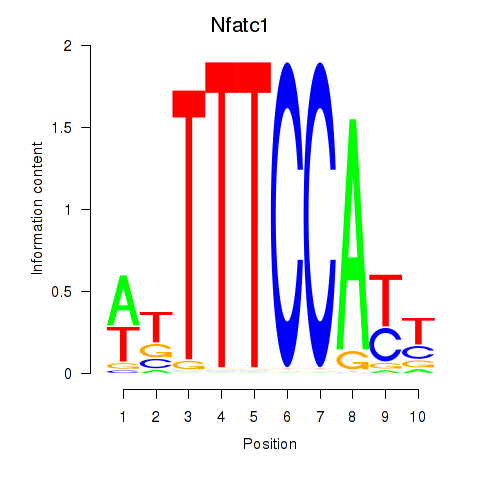
| Nfatc1 | 0.546 |
|
|
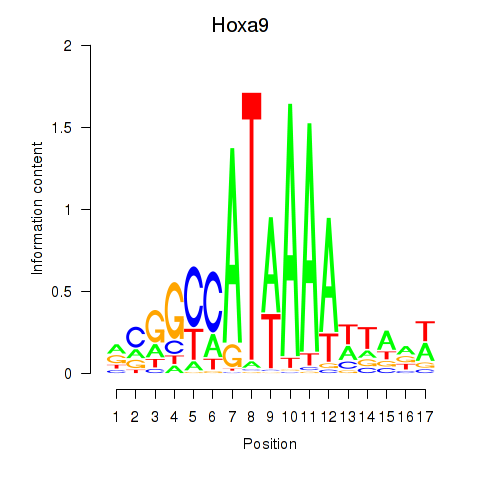
| Hoxa9_Hoxb9 | 0.543 |
|
|
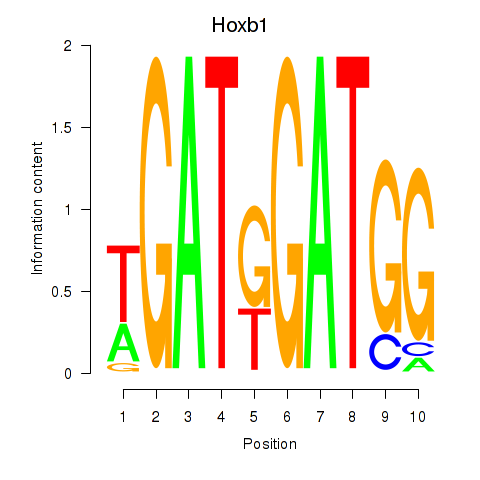
| Hoxb1 | 0.541 |
|
|
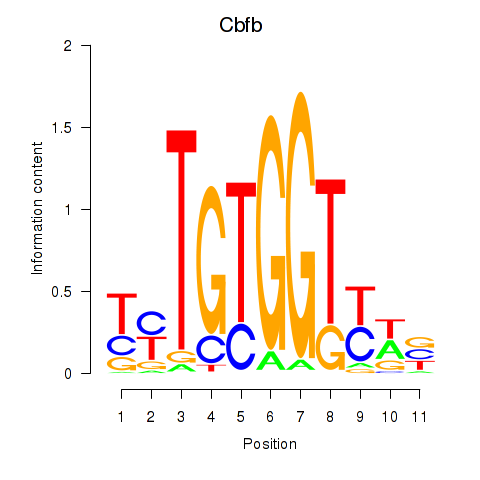
| Cbfb | 0.539 |
|
|
| Myod1 | 0.536 |
|
|
| Vsx1_Uncx_Prrx2_Shox2_Noto | 0.517 |
|
|
| Nkx3-1 | 0.505 |
|
|
| Hmx3 | 0.495 |
|
|
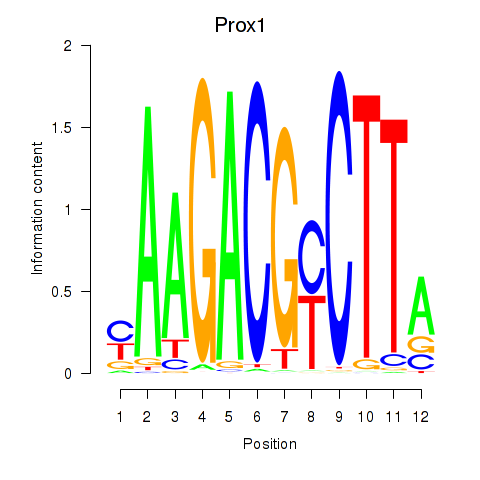
| Prox1 | 0.490 |
|
|
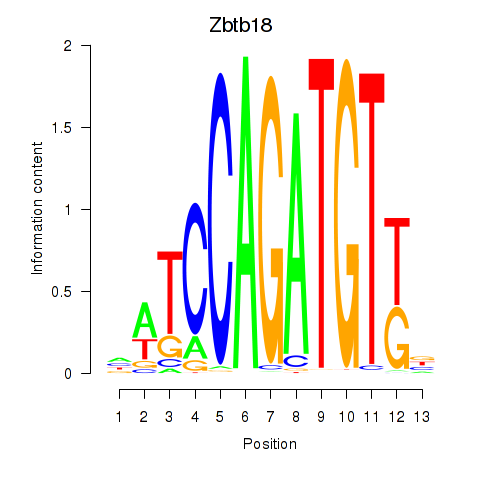
| Zbtb18 | 0.485 |
|
|
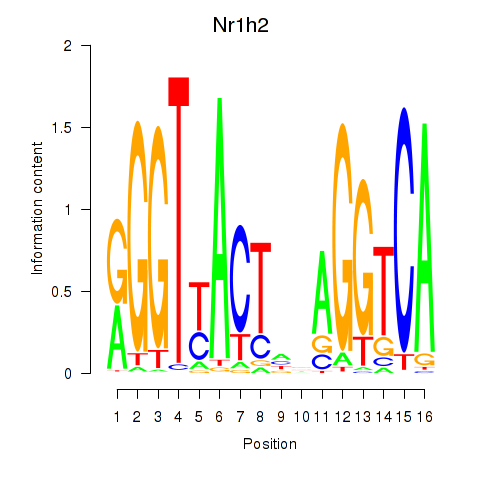
| Nr1h2 | 0.477 |
|
|
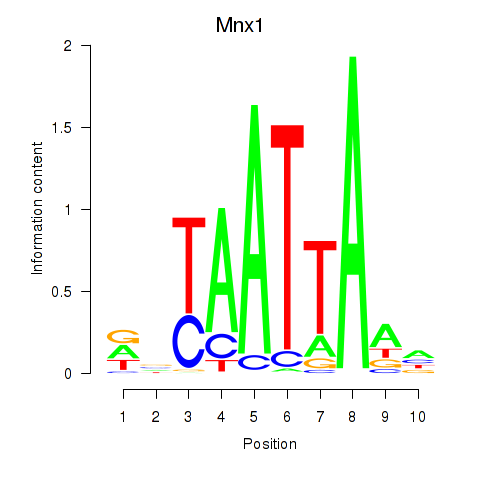
| Mnx1_Lhx6_Lmx1a | 0.477 |
|
|
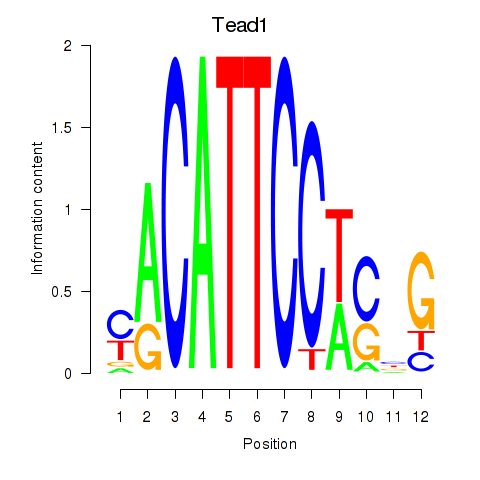
| Tead1 | 0.476 |
|
|
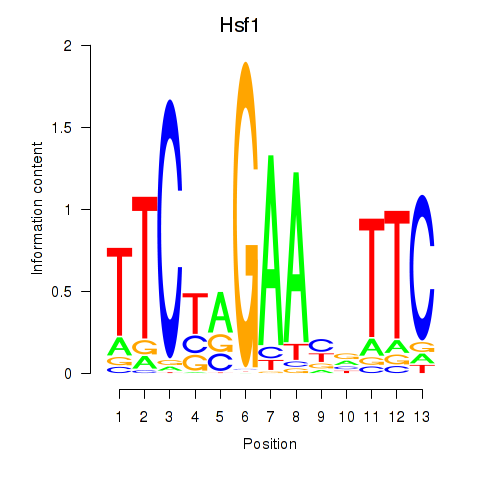
| Hsf1 | 0.476 |
|
|
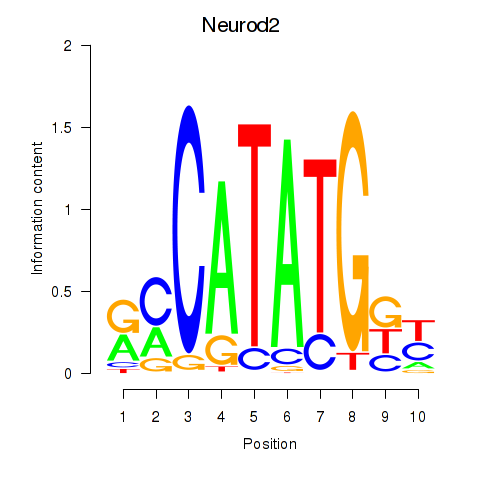
| Neurod2_Bhlha15_Bhlhe22_Olig1 | 0.476 |
|
|
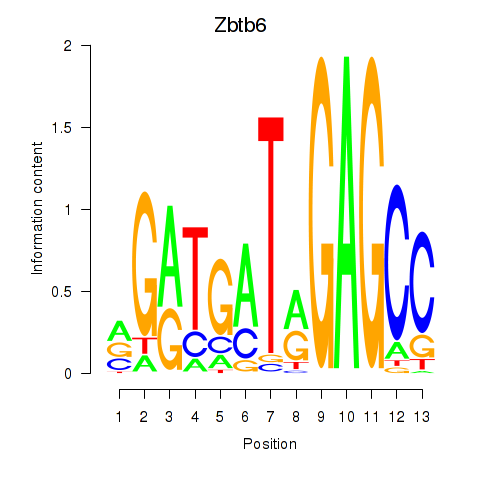
| Zbtb6 | 0.465 |
|
|
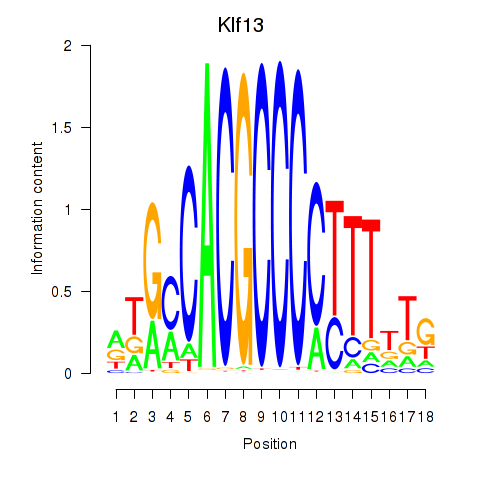
| Klf13 | 0.456 |
|
|
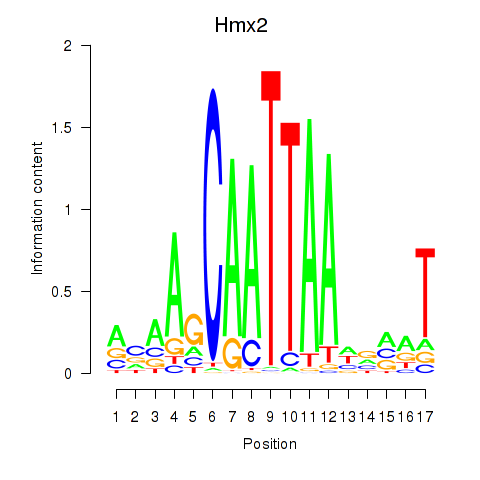
| Hmx2 | 0.451 |
|
|
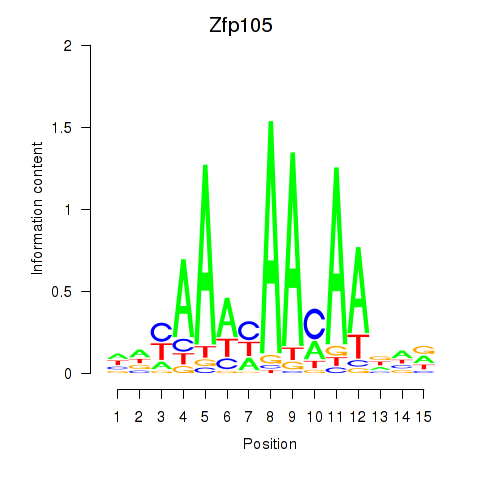
| Zfp105 | 0.450 |
|
|
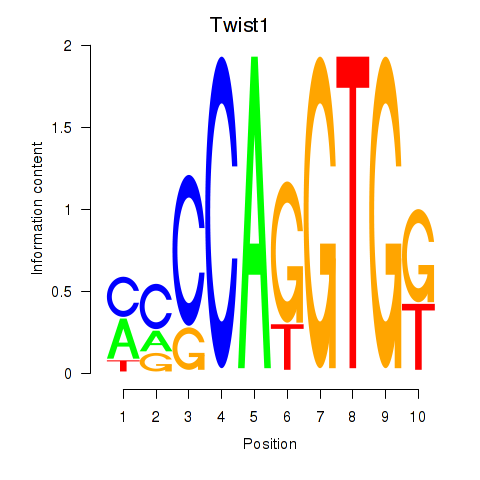
| Twist1 | 0.450 |
|
|
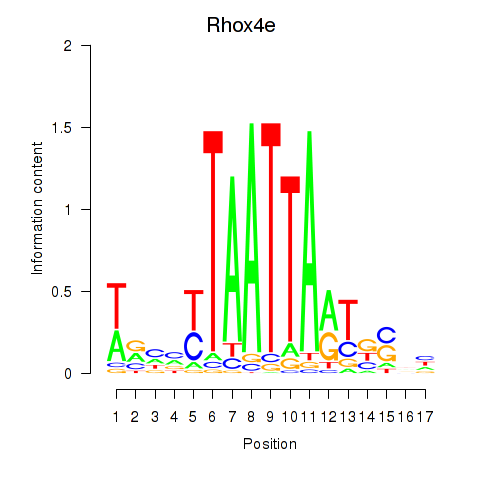
| Rhox4e_Rhox6_Vax2 | 0.446 |
|
|
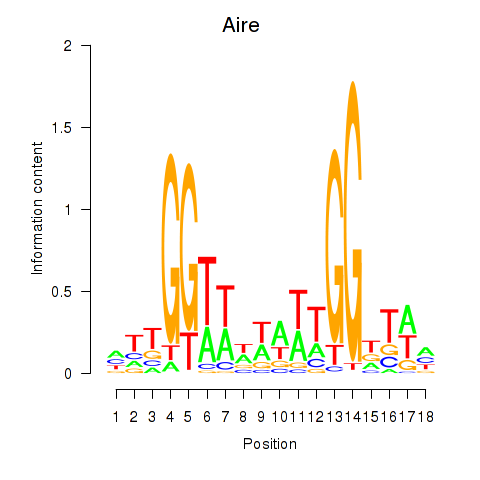
| Aire | 0.441 |
|
|
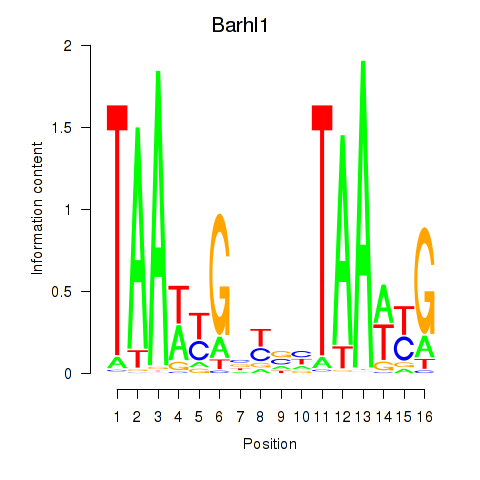
| Barhl1 | 0.435 |
|
|
| Hoxc10 | 0.428 |
|

|
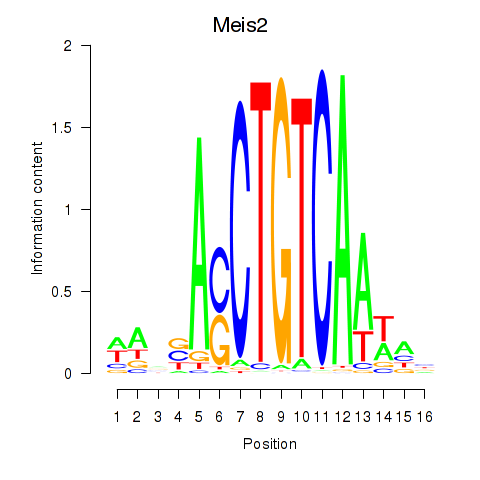
| Meis2 | 0.417 |
|
|
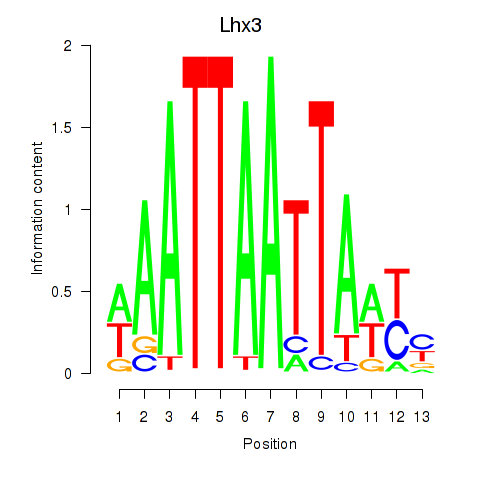
| Lhx3 | 0.403 |
|
|
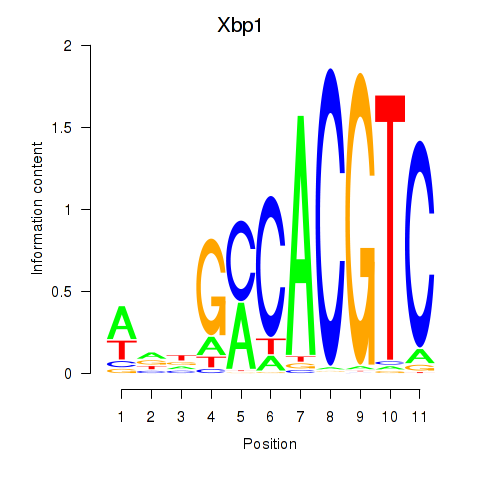
| Xbp1_Creb3l1 | 0.401 |
|
|
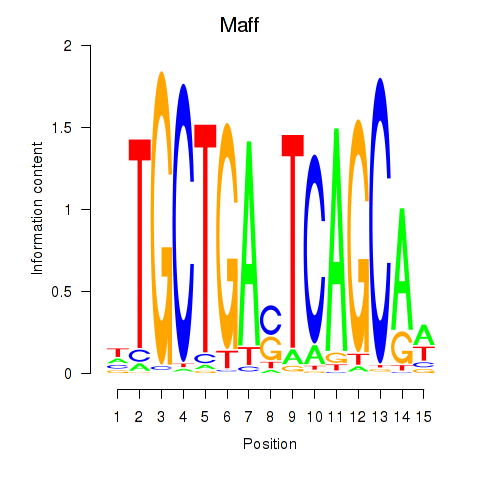
| Maff | 0.401 |
|
|
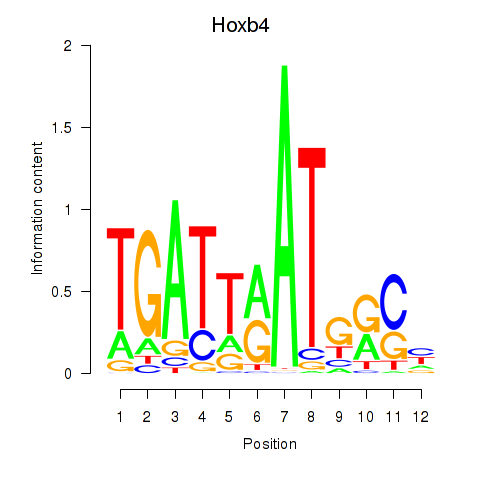
| Hoxb4 | 0.393 |
|
|
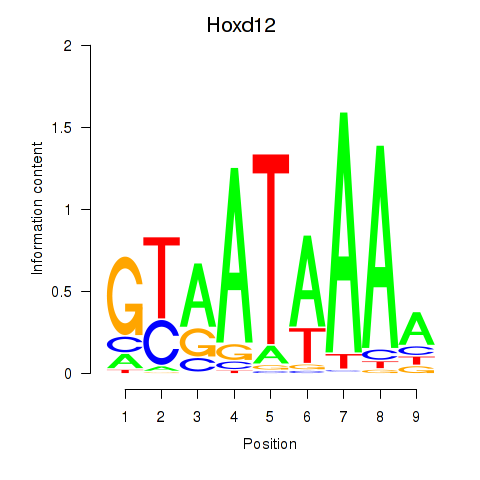
| Hoxd12 | 0.391 |
|
|
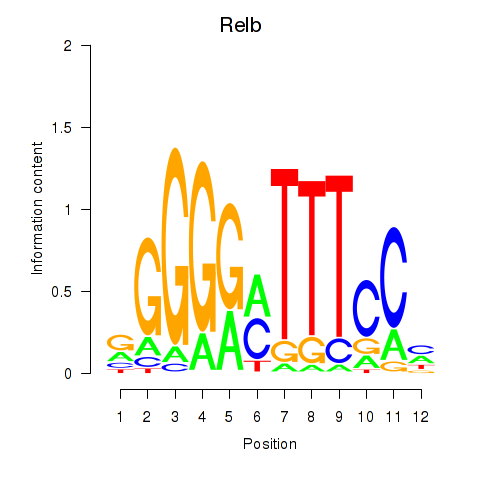
| Relb | 0.385 |
|
|
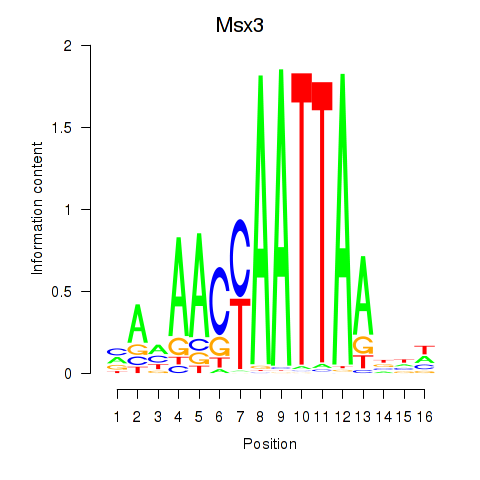
| Msx3 | 0.379 |
|
|
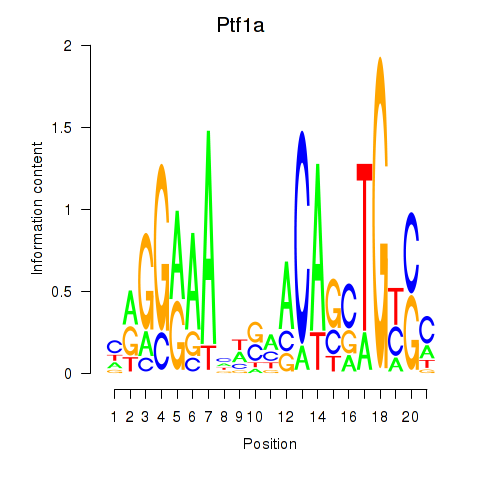
| Ptf1a | 0.378 |
|
|
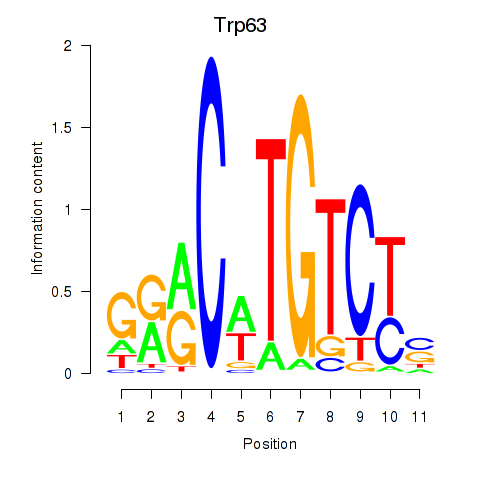
| Trp63 | 0.362 |
|
|
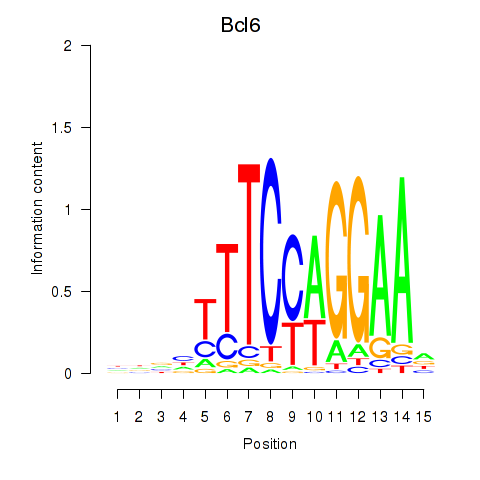
| Bcl6 | 0.360 |
|
|
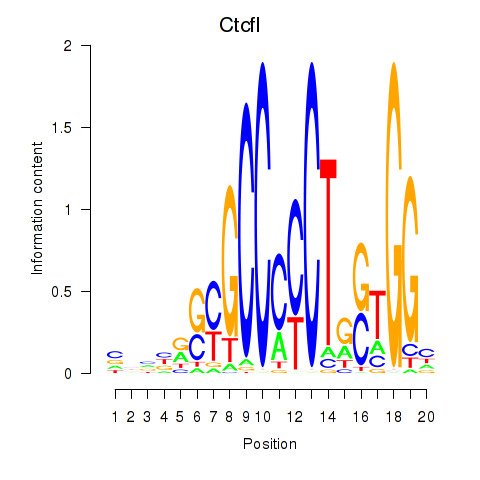
| Ctcfl_Ctcf | 0.355 |
|
|
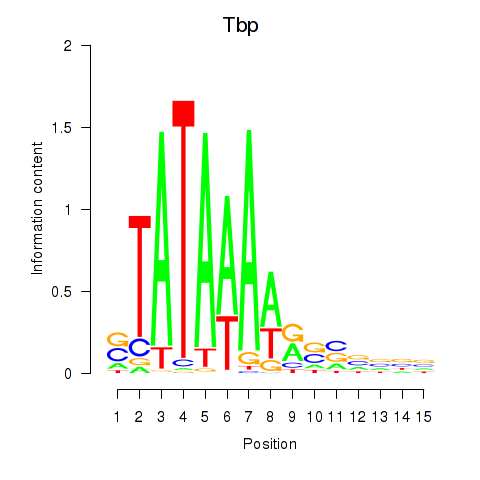
| Tbp | 0.352 |
|
|
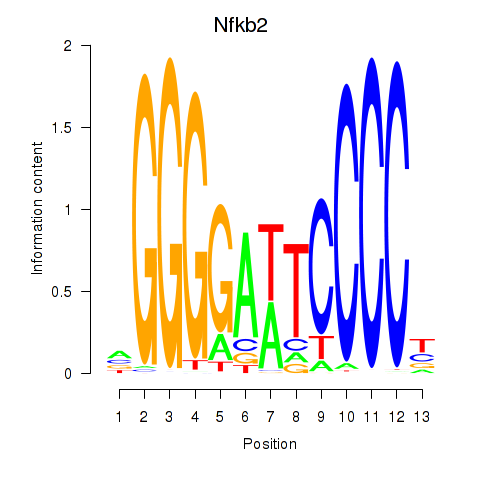
| Nfkb2 | 0.344 |
|
|
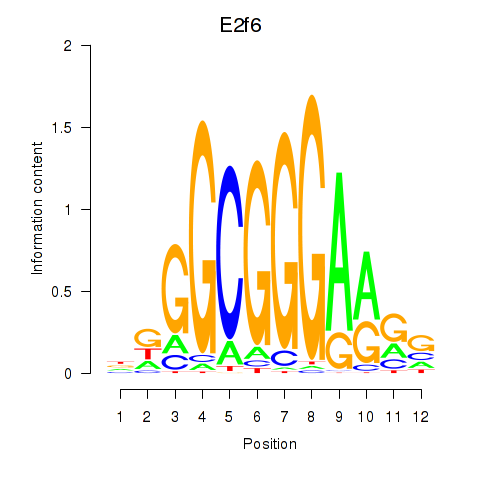
| E2f6 | 0.341 |
|
|
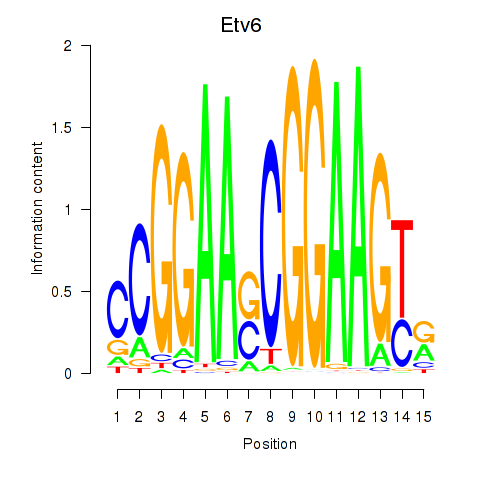
| Etv6 | 0.326 |
|
|
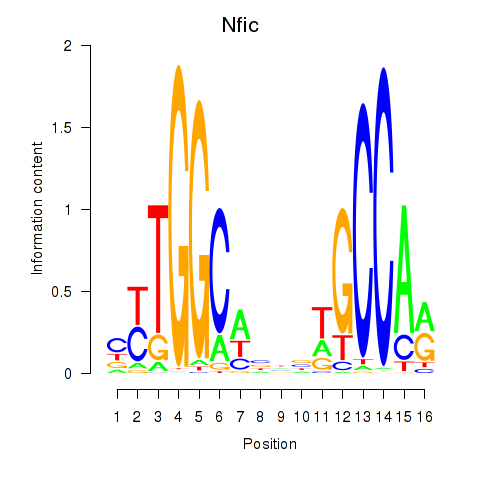
| Nfic_Nfib | 0.325 |
|
|
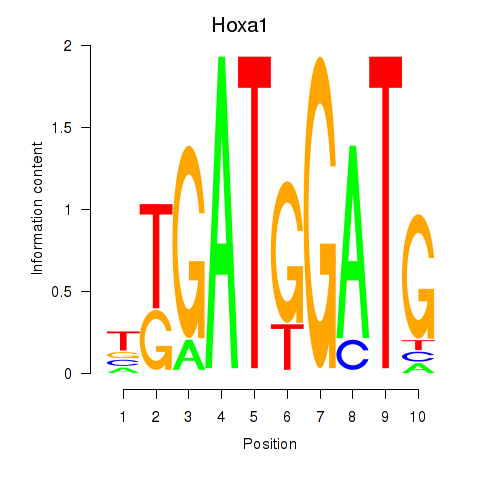
| Hoxa1 | 0.325 |
|
|
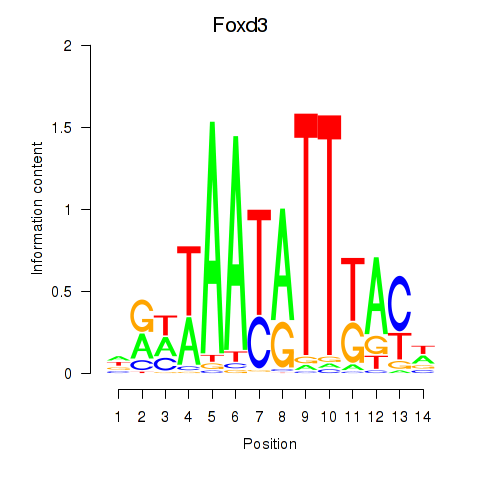
| Foxd3 | 0.316 |
|
|
| Foxn1 | 0.303 |
|

|
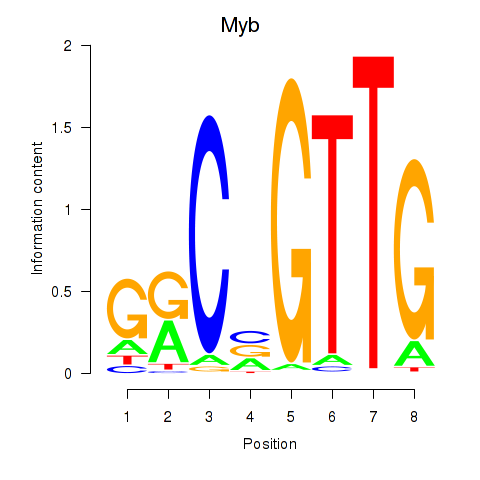
| Myb | 0.294 |
|
|
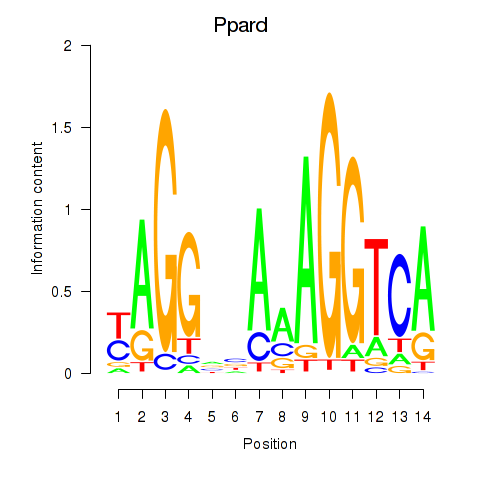
| Ppard | 0.290 |
|
|
| Pou6f2_Pou4f2 | 0.281 |
|
|
| Sox4 | 0.280 |
|
|
| Nfatc4 | 0.266 |
|
|
| Srf | 0.249 |
|
|
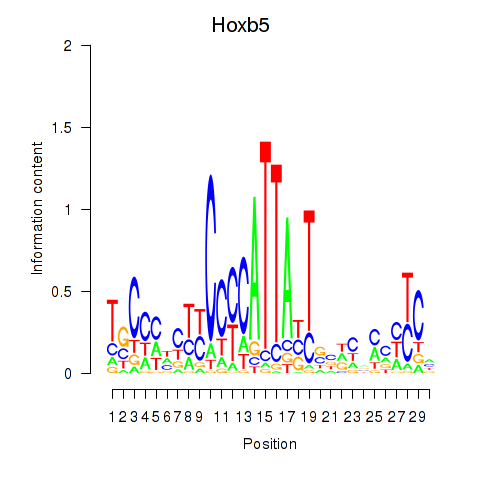
| Hoxb5 | 0.222 |
|
|
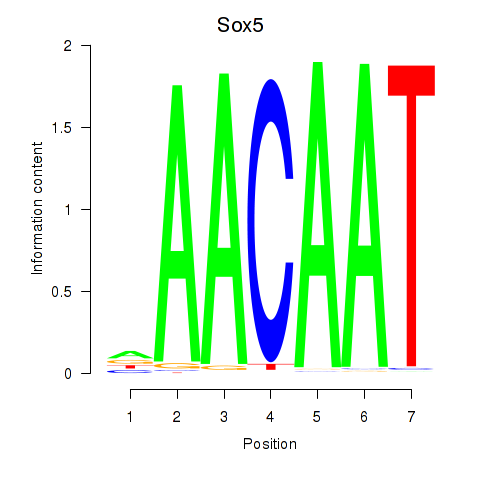
| Sox5_Sry | 0.216 |
|
|
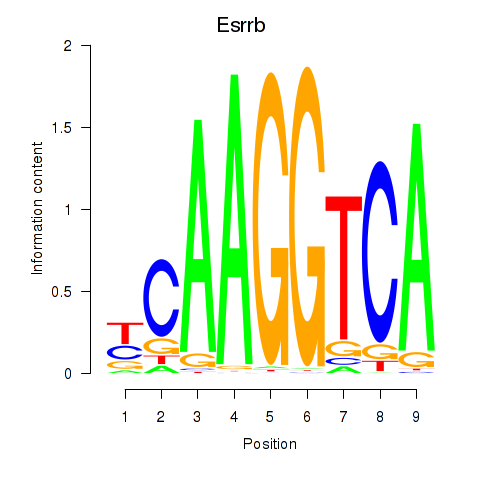
| Esrrb_Esrra | 0.209 |
|
|
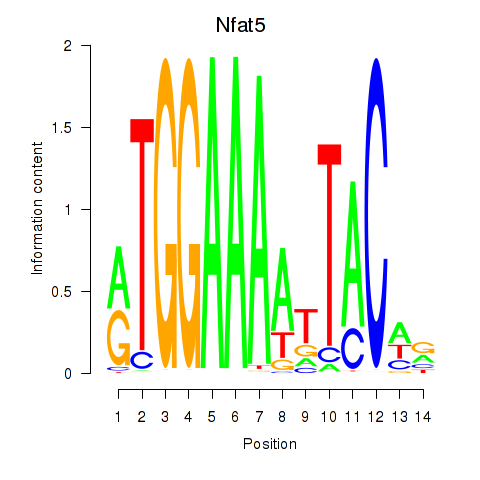
| Nfat5 | 0.209 |
|
|
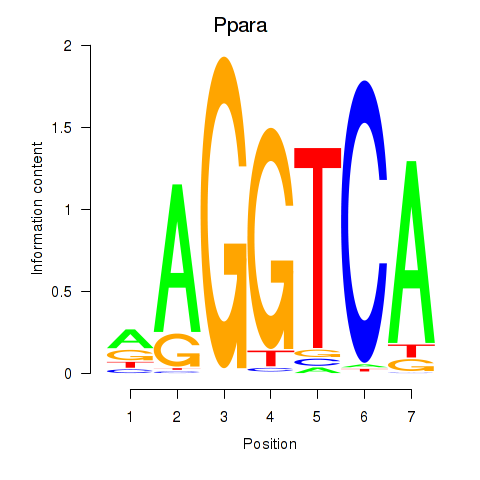
| Ppara | 0.202 |
|
|
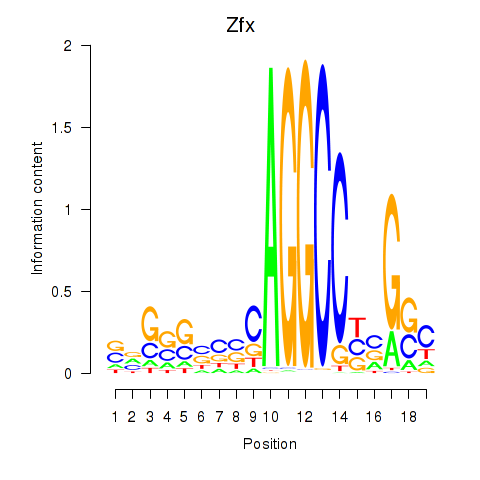
| Zfx_Zfp711 | 0.202 |
|
|
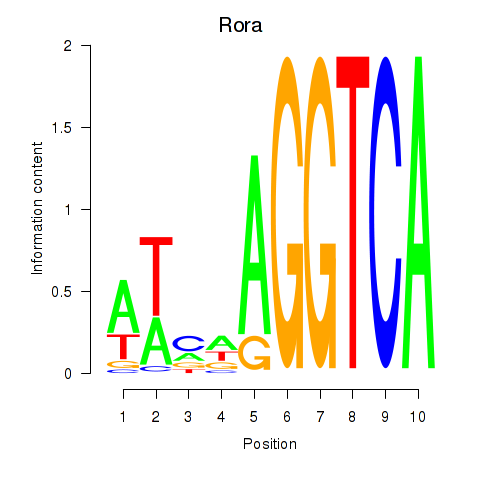
| Rora | 0.198 |
|
|
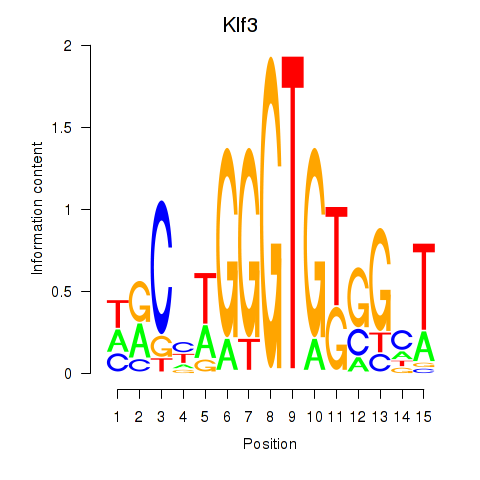
| Klf3 | 0.197 |
|
|
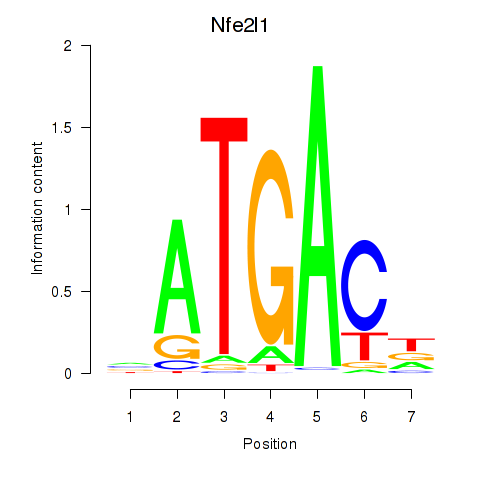
| Nfe2l1_Mafg | 0.189 |
|
|
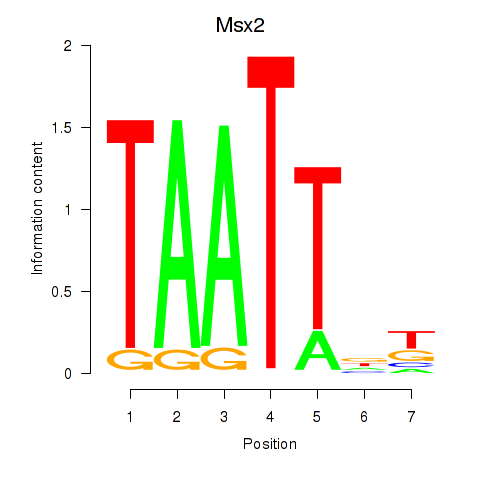
| Msx2_Hoxd4 | 0.186 |
|
|
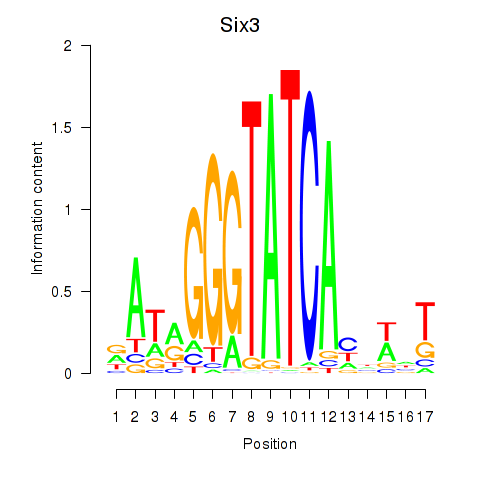
| Six3_Six1_Six2 | 0.175 |
|
|
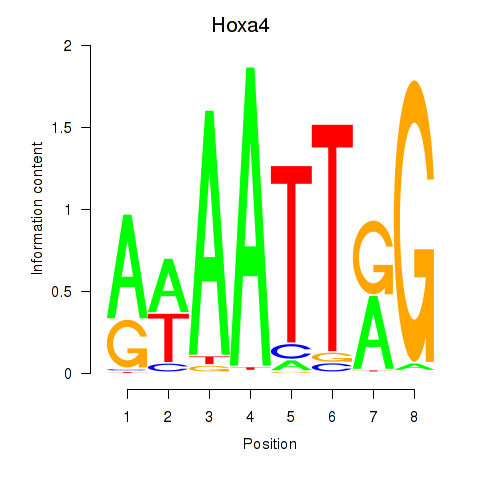
| Hoxa4 | 0.164 |
|
|
| Egr3 | 0.150 |
|
|
| Nanog | 0.137 |
|
|
| Plagl1 | 0.134 |
|
|
| Meox1 | 0.129 |
|
|
| Lhx2_Hoxc5 | 0.129 |
|
|
| Dlx1 | 0.125 |
|
|
| Foxi1_Foxo1 | 0.119 |
|
|
| Hoxa3 | 0.116 |
|
|
| Arnt2 | 0.109 |
|
|
| Fosb | 0.100 |
|
|
| Myog_Tcf12 | 0.098 |
|
|
| Ebf3 | 0.088 |
|
|
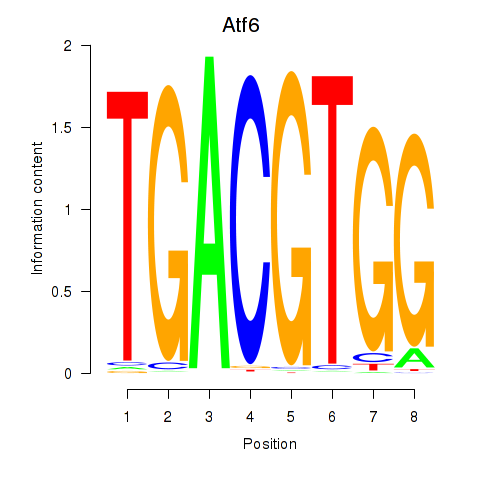
| Atf6 | 0.082 |
|
|
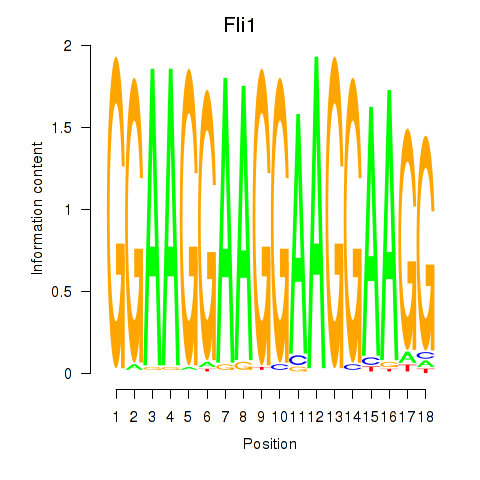
| Fli1 | 0.076 |
|
|
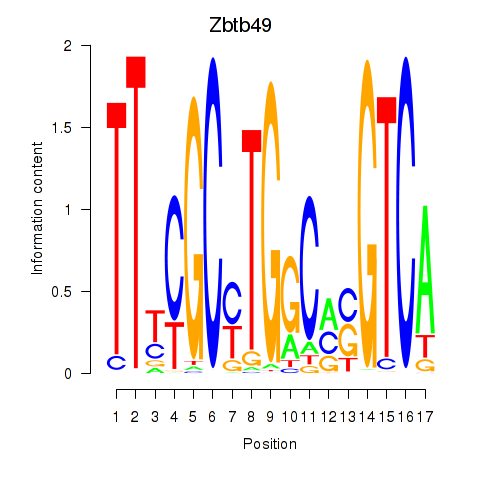
| Zbtb49 | 0.073 |
|
|
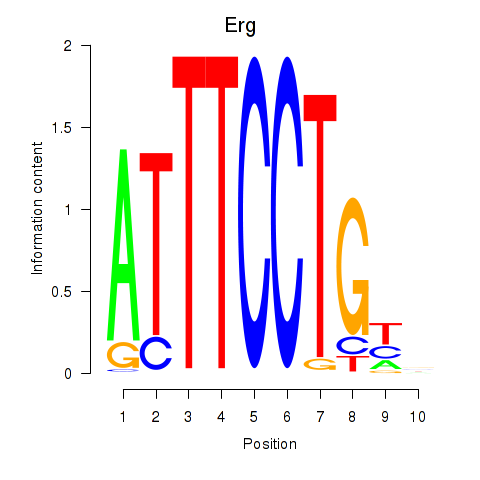
| Erg | 0.062 |
|
|
| Nfe2_Bach1_Mafk | 0.060 |
|
|
| Hoxa5 | 0.051 |
|
|
| Trp73 | 0.041 |
|
|
| Tbx4 | 0.033 |
|

|
| Egr4 | 0.033 |
|
|
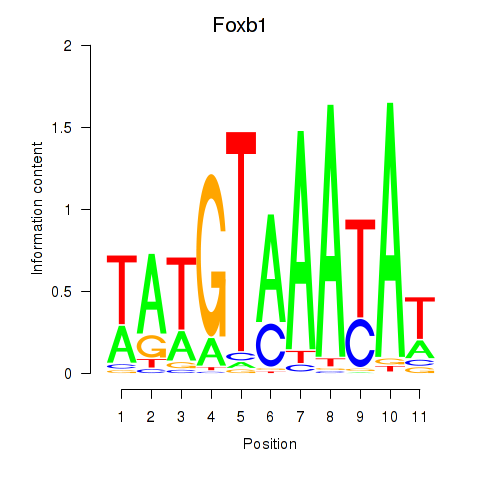
| Foxb1 | 0.030 |
|
|
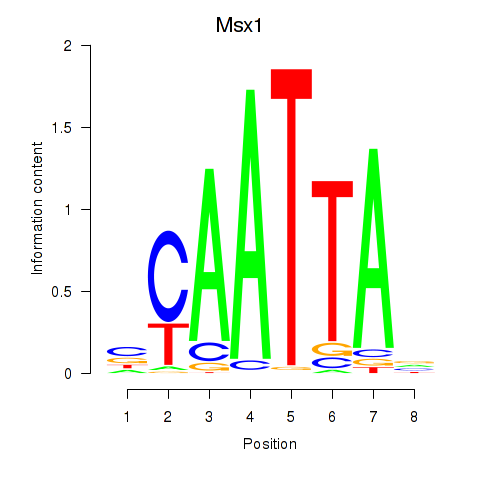
| Msx1_Lhx9_Barx1_Rax_Dlx6 | 0.011 |
|
|
| Hoxa13 | 0.000 |
|

|
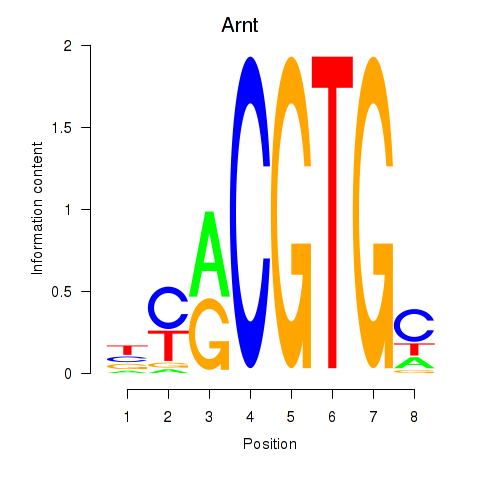
| Arnt | -0.000 |
|
|
| Cdx2 | 0.000 |
|

|
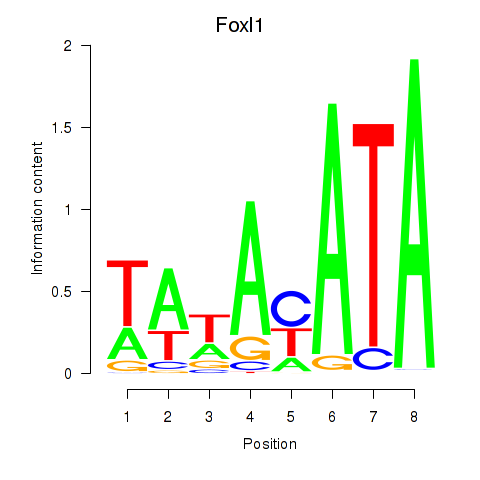
| Foxl1 | -0.000 |
|
|
| Hoxa6 | 0.000 |
|

|
| Hoxb7 | 0.000 |
|
|
| Lef1 | 0.000 |
|

|
| Mzf1 | -0.000 |
|
|
| Pax2 | -0.000 |
|
|
| Pgr_Nr3c1 | 0.000 |
|
|
| Sox15 | 0.000 |
|
|
| Arid5a | -0.008 |
|
|
| Prdm1 | -0.011 |
|
|
| Tbx1_Eomes | -0.018 |
|
|
| Hivep1 | -0.020 |
|
|
| Nr4a2 | -0.028 |
|
|
| Lhx5_Lmx1b_Lhx1 | -0.031 |
|
|
| Mbd2 | -0.043 |
|
|
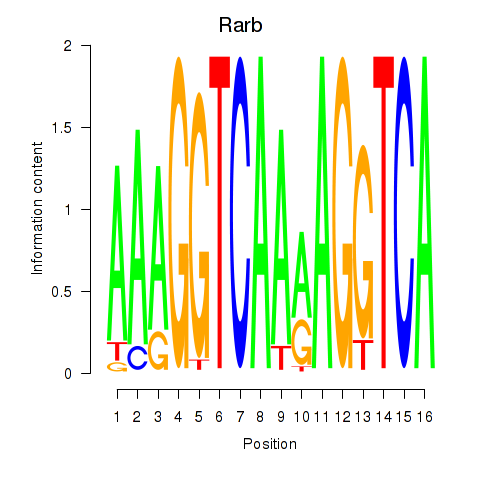
| Rarb | -0.045 |
|
|
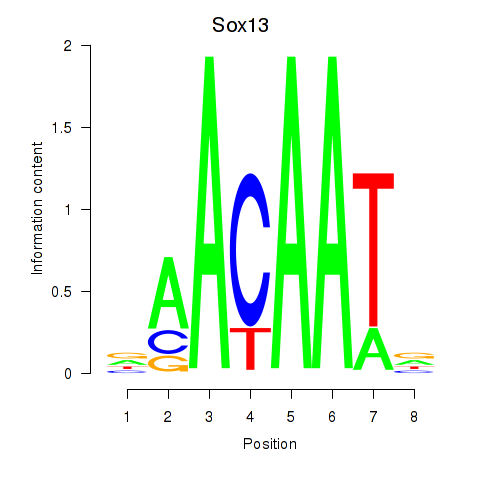
| Sox13 | -0.045 |
|
|
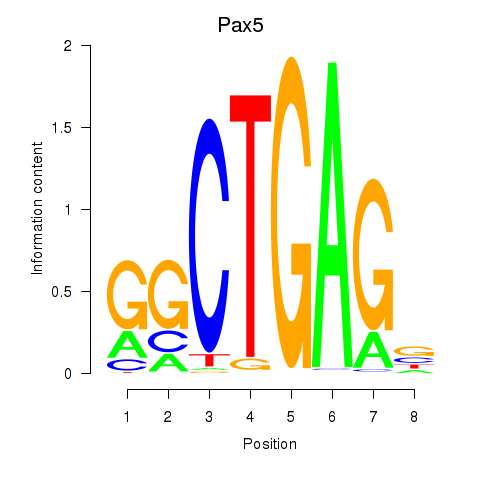
| Pax5 | -0.059 |
|
|
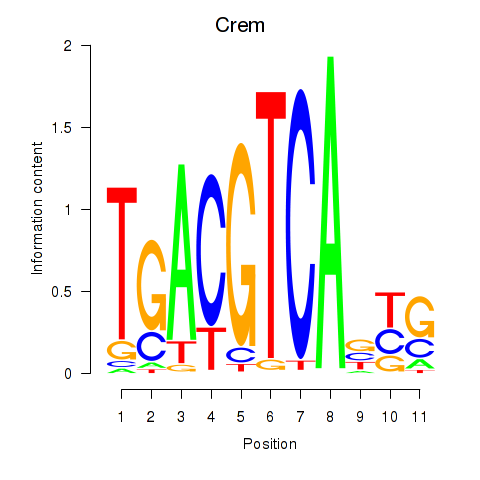
| Crem_Jdp2 | -0.065 |
|
|
| Nkx2-9 | -0.069 |
|
|
| Zfp282 | -0.071 |
|

|
| Foxm1 | -0.073 |
|
|
| Stat6 | -0.075 |
|
|
| Rxra | -0.076 |
|
|
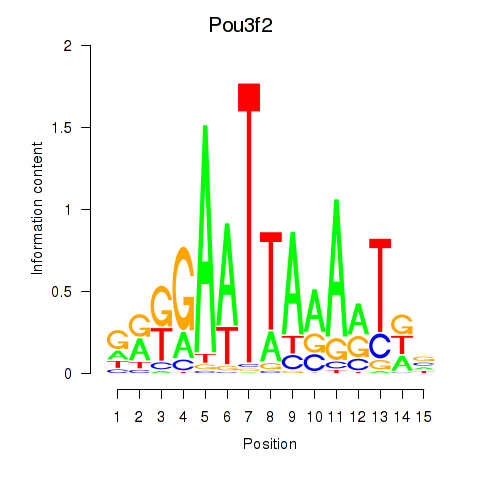
| Pou3f2 | -0.082 |
|
|
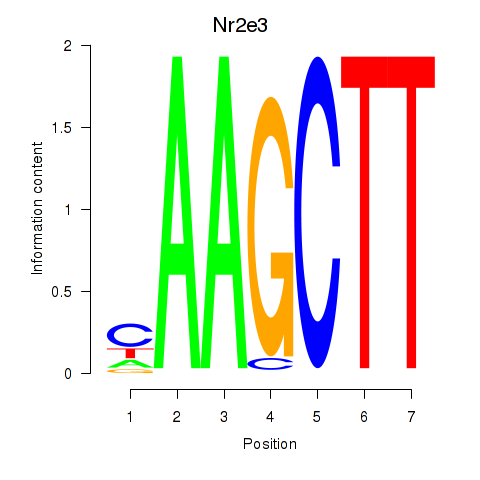
| Nr2e3 | -0.086 |
|
|
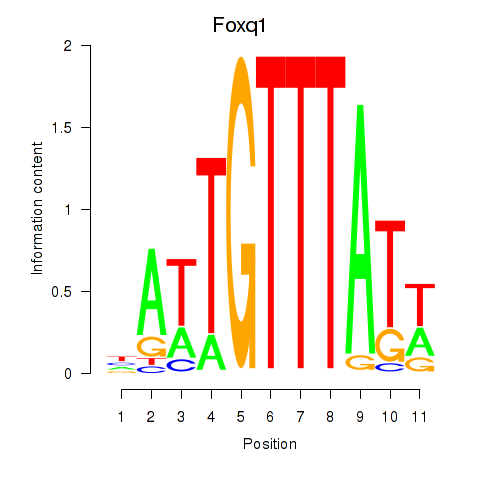
| Foxq1 | -0.088 |
|
|
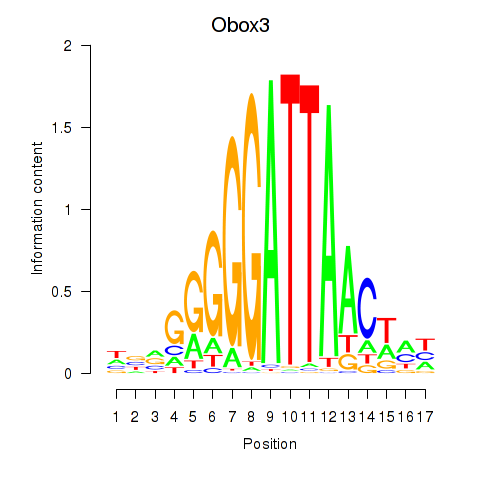
| Obox3 | -0.098 |
|
|
| Gli2 | -0.100 |
|
|
| Zbtb7c | -0.108 |
|
|
| Pax8 | -0.116 |
|
|
| Emx1_Emx2 | -0.124 |
|
|
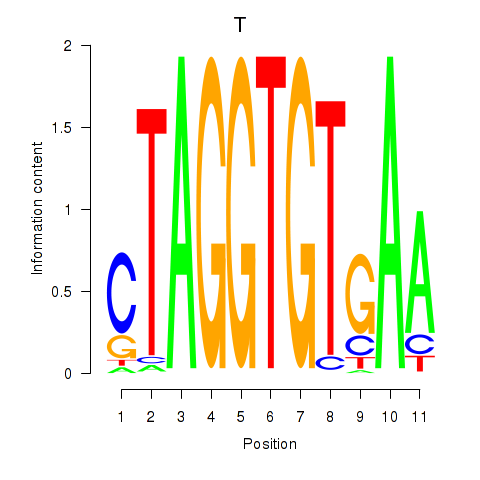
| T | -0.125 |
|
|
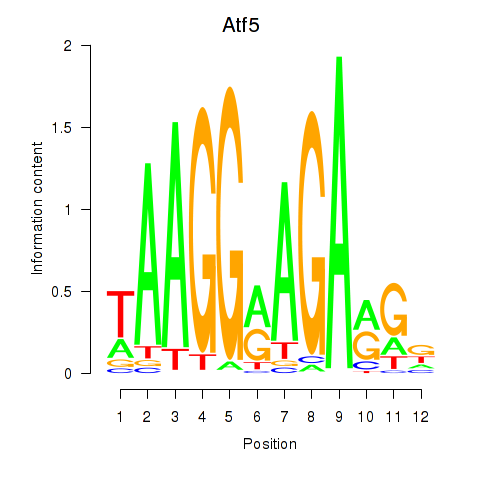
| Atf5 | -0.128 |
|
|
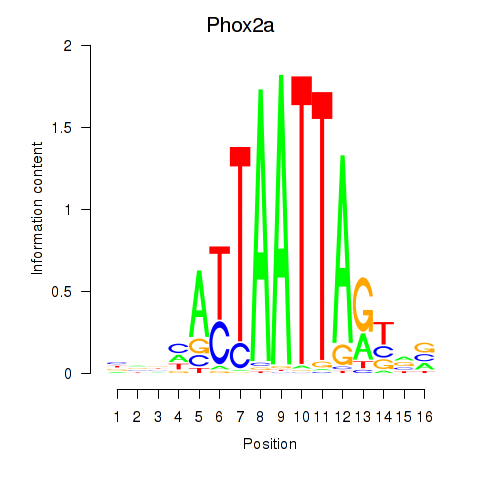
| Phox2a | -0.135 |
|
|
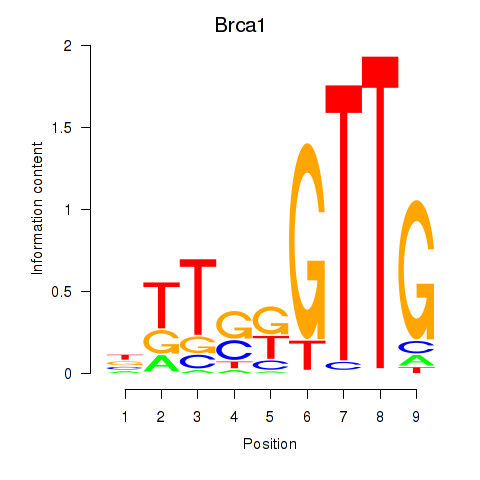
| Brca1 | -0.143 |
|
|
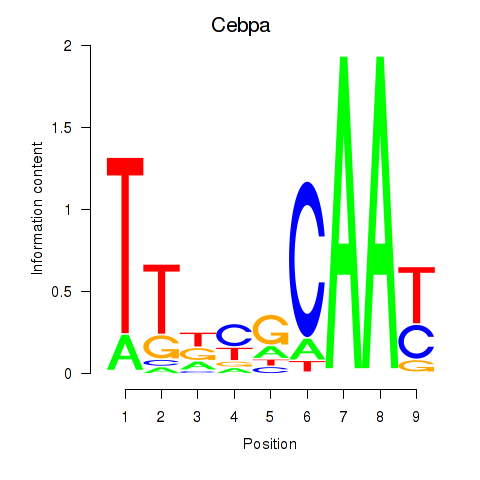
| Cebpa_Cebpg | -0.150 |
|
|
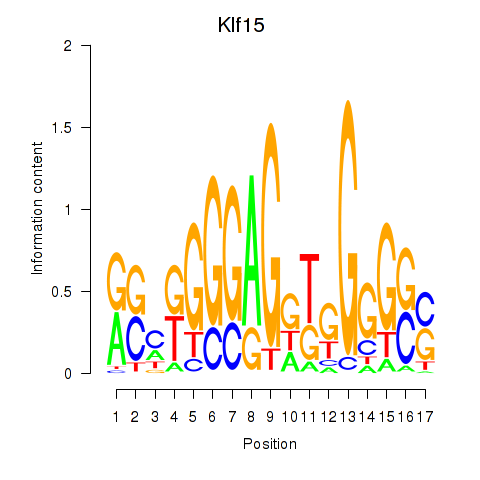
| Klf15 | -0.158 |
|
|
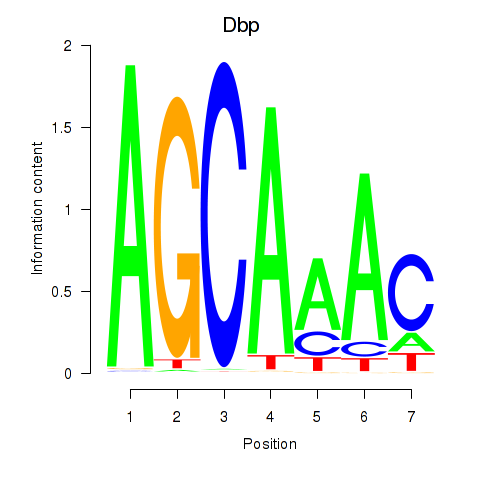
| Dbp | -0.159 |
|
|
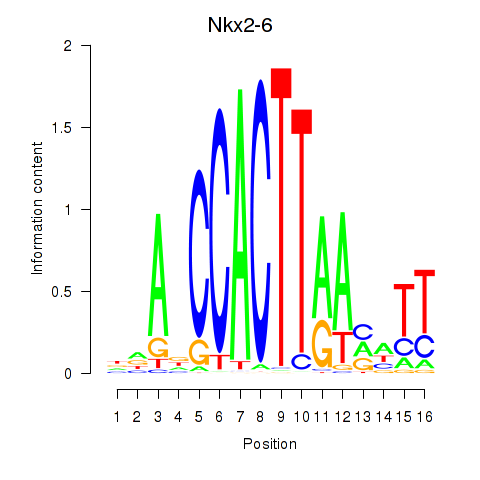
| Nkx2-6 | -0.162 |
|
|
| Tfap2e | -0.163 |
|
|
| Hlx | -0.163 |
|

|
| Cebpd | -0.187 |
|
|
| Elf5 | -0.208 |
|
|
| Atf4 | -0.216 |
|
|
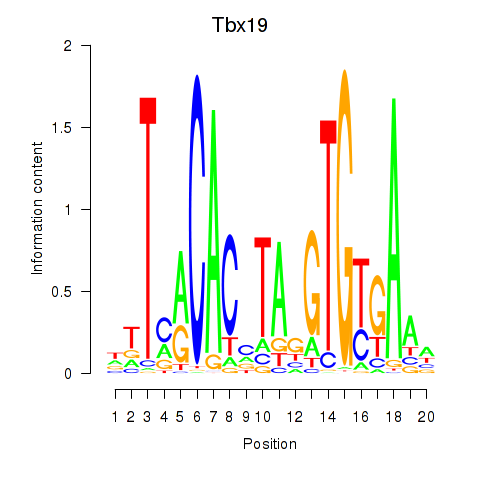
| Tbx19 | -0.225 |
|
|
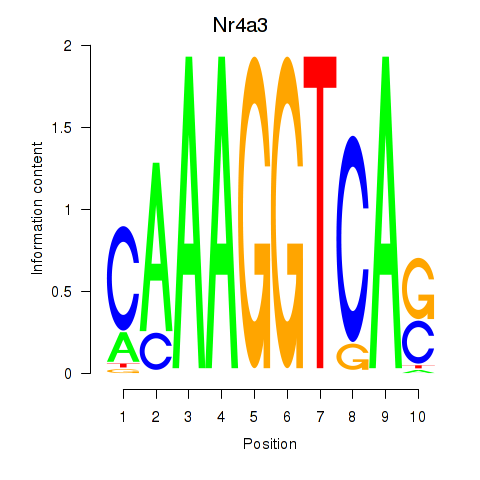
| Nr4a3 | -0.225 |
|
|
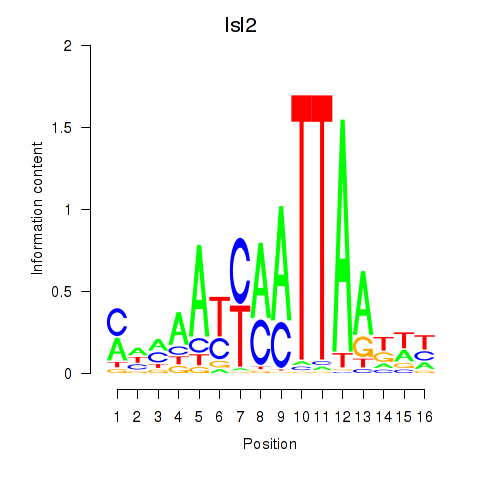
| Isl2 | -0.227 |
|
|
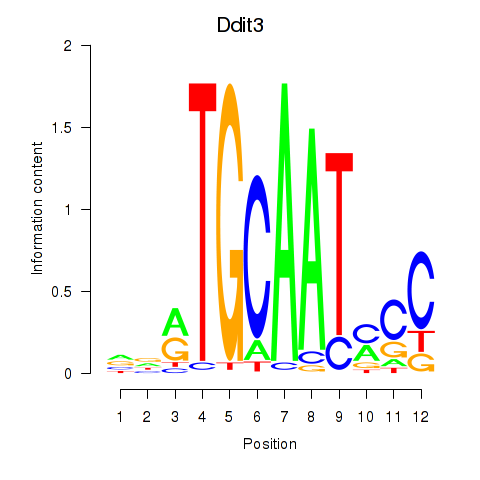
| Ddit3 | -0.230 |
|
|
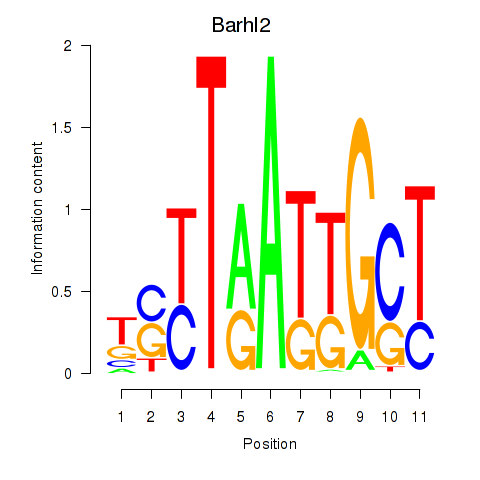
| Barhl2 | -0.234 |
|
|
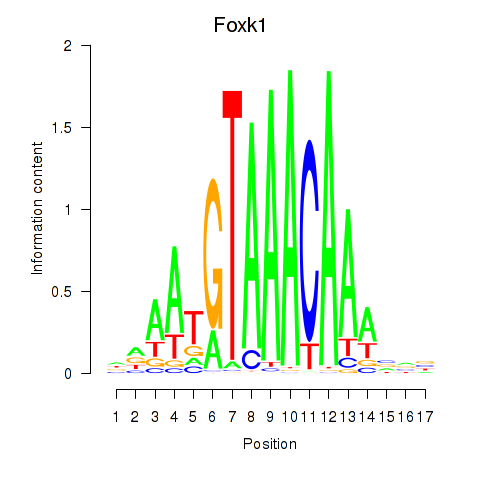
| Foxk1_Foxj1 | -0.235 |
|
|
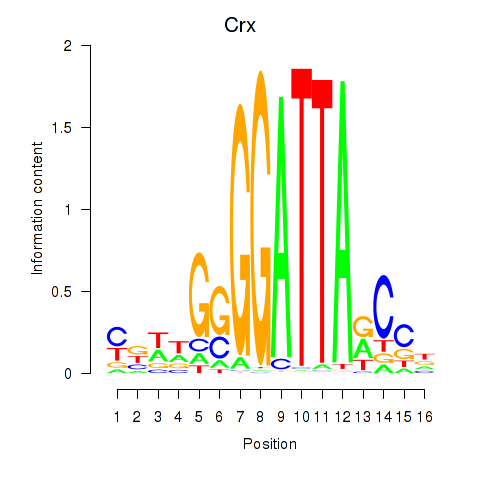
| Crx_Gsc | -0.236 |
|
|
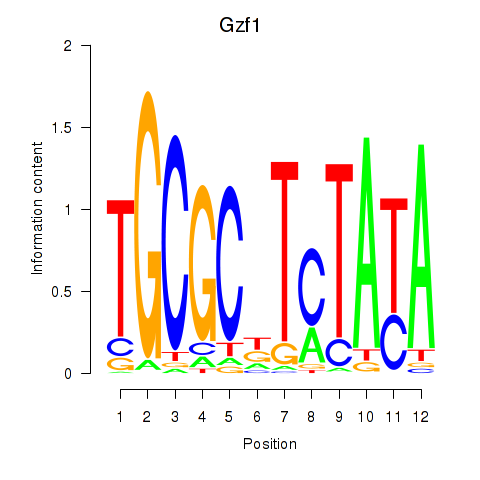
| Gzf1 | -0.258 |
|
|
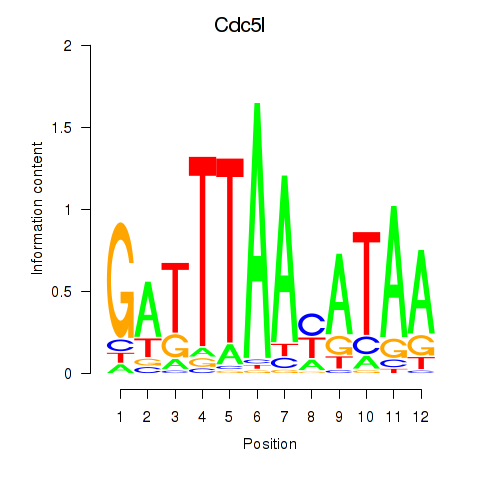
| Cdc5l | -0.280 |
|
|
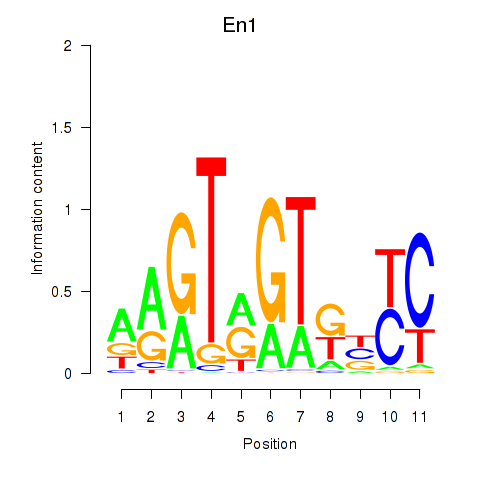
| En1 | -0.282 |
|
|
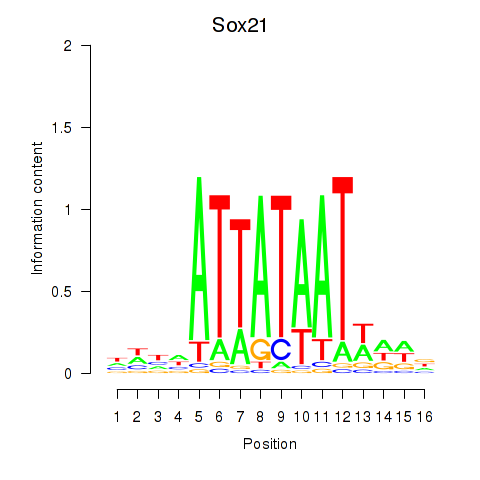
| Sox21 | -0.284 |
|
|
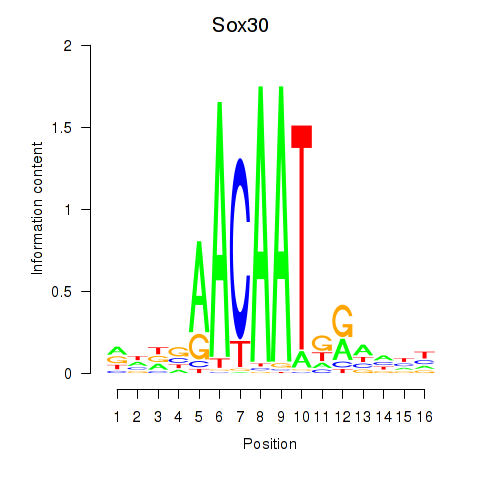
| Sox30 | -0.284 |
|
|
| Ikzf2 | -0.285 |
|
|
| Gsx1_Alx1_Mixl1_Lbx2 | -0.295 |
|
|
| Glis1 | -0.321 |
|
|
| Zfp128 | -0.325 |
|
|
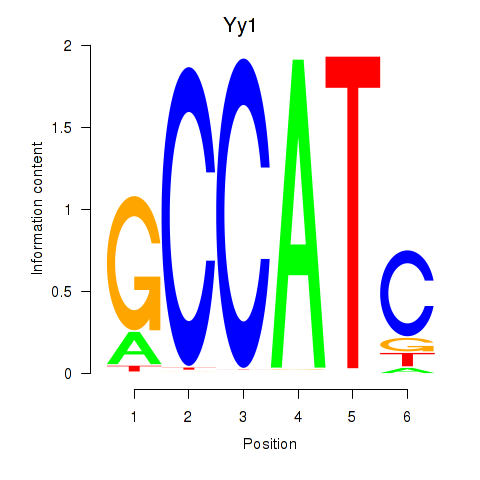
| Yy1_Yy2 | -0.326 |
|
|
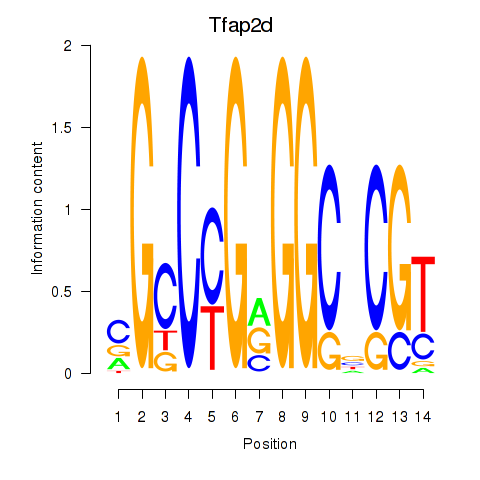
| Tfap2d | -0.328 |
|
|
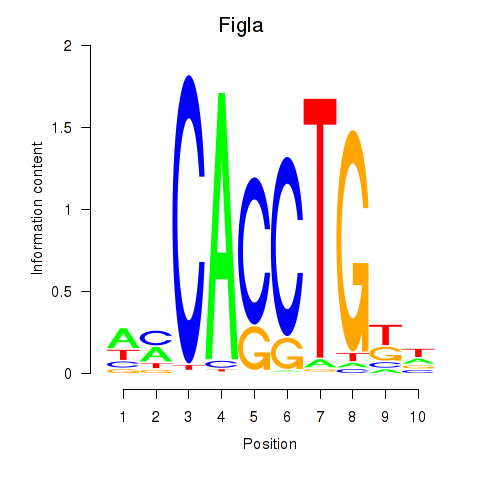
| Figla | -0.329 |
|
|
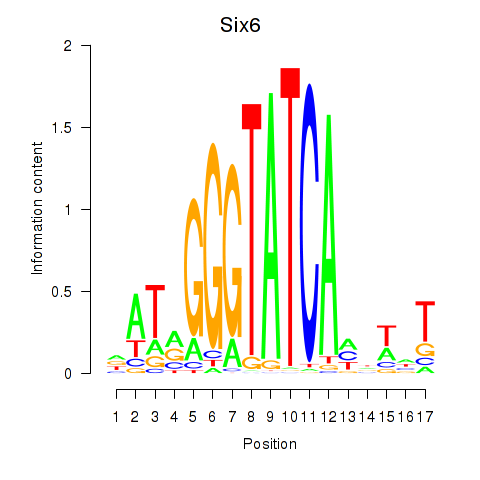
| Six6 | -0.335 |
|
|
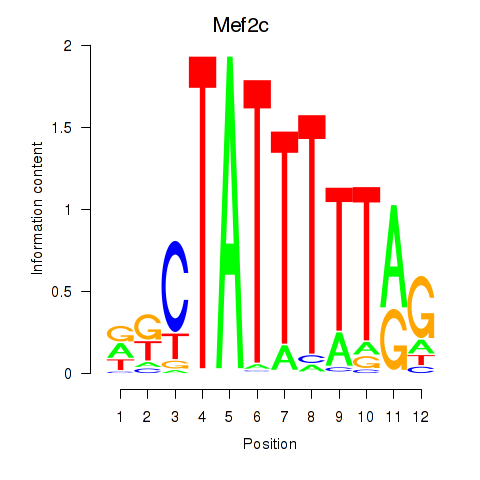
| Mef2c | -0.347 |
|
|
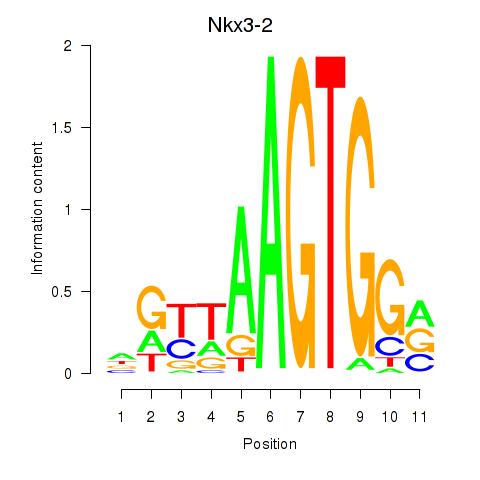
| Nkx3-2 | -0.347 |
|
|
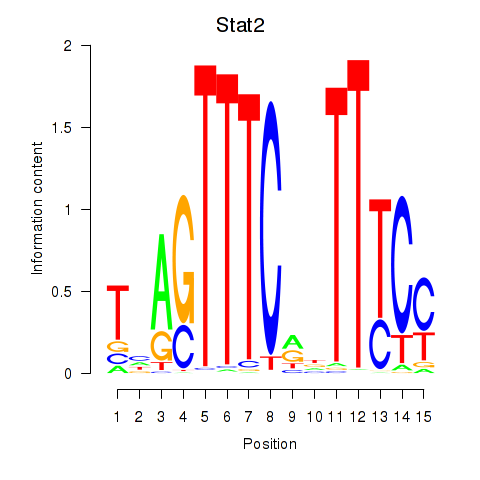
| Stat2 | -0.373 |
|
|
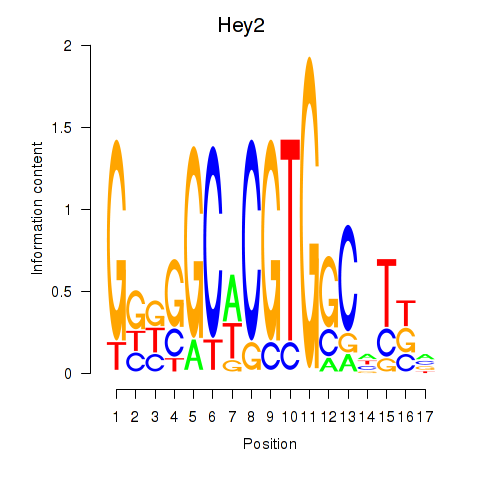
| Hey2 | -0.380 |
|
|
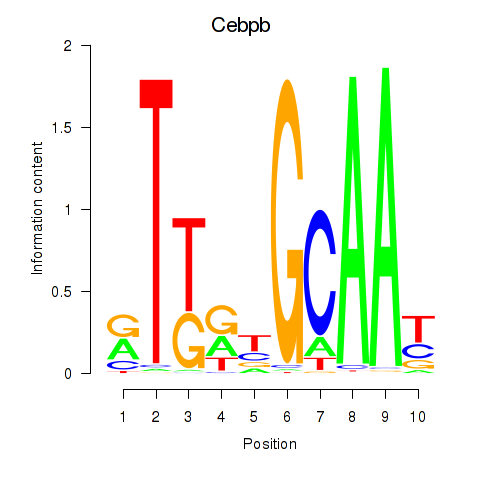
| Cebpb | -0.383 |
|
|
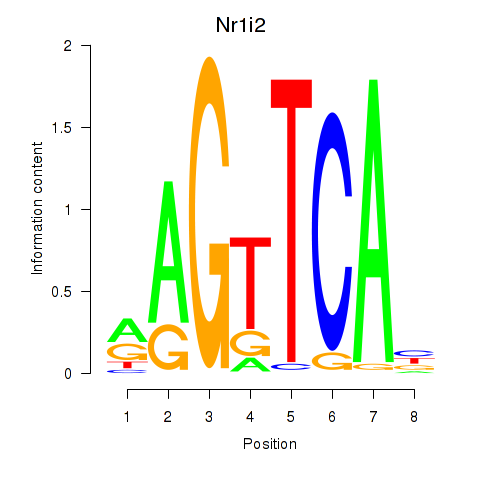
| Nr1i2 | -0.385 |
|
|
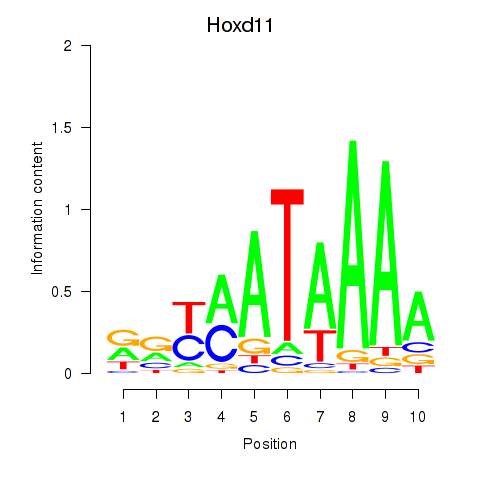
| Hoxd11_Cdx1_Hoxc11 | -0.400 |
|
|
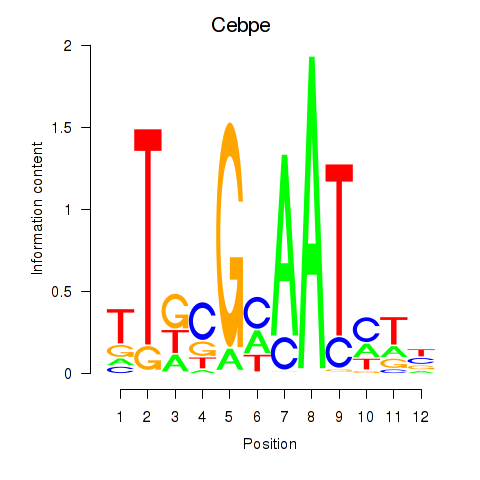
| Cebpe | -0.402 |
|
|
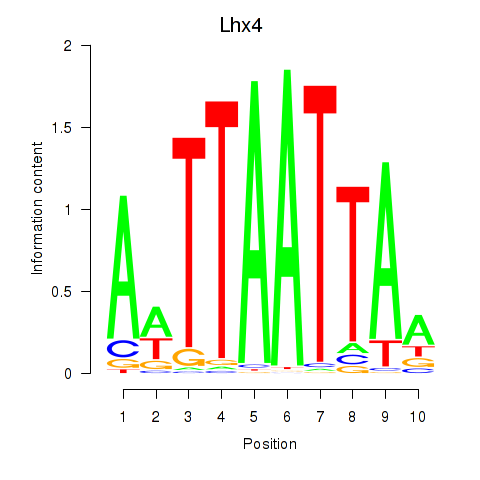
| Lhx4 | -0.404 |
|
|
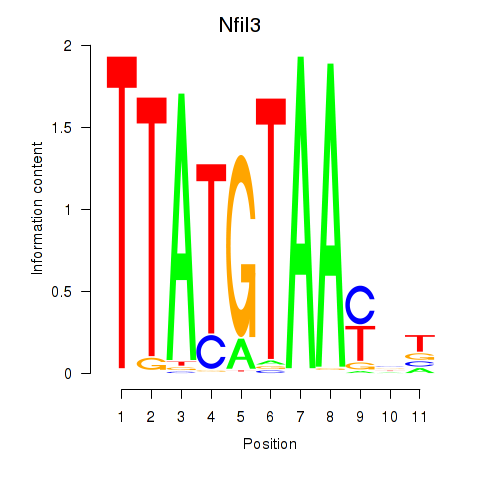
| Nfil3_Tef | -0.414 |
|
|
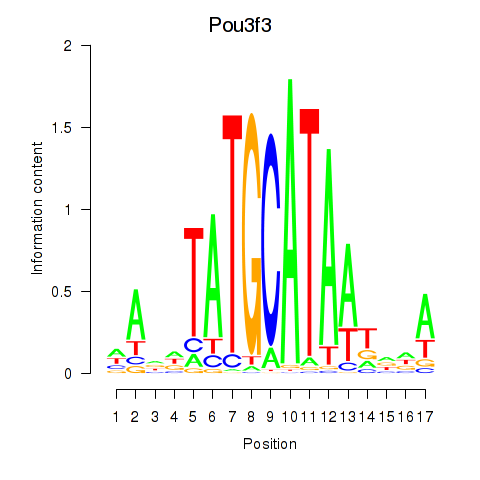
| Pou3f3 | -0.443 |
|
|
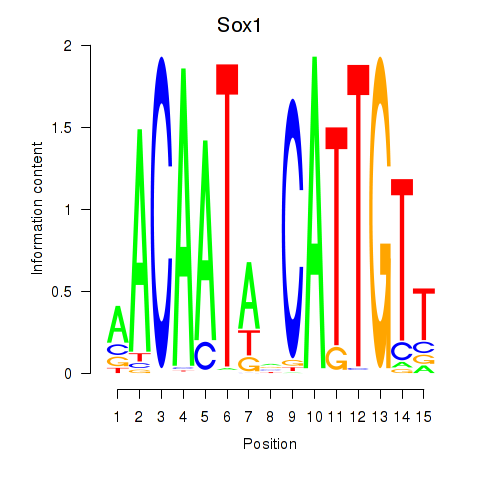
| Sox1 | -0.446 |
|
|
| Ebf1 | -0.448 |
|
|
| Nr2c1 | -0.484 |
|
|
| Glis3 | -0.487 |
|
|
| Myf6 | -0.492 |
|
|
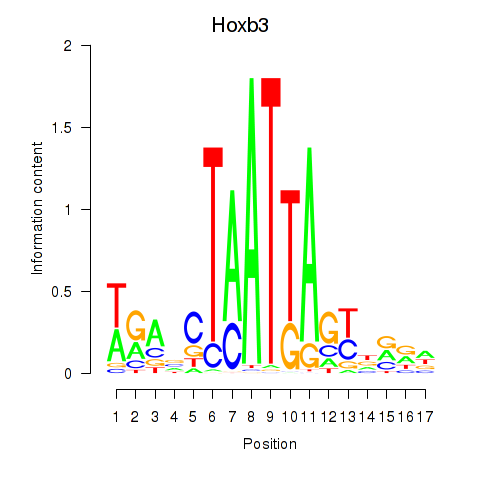
| Hoxb3 | -0.496 |
|
|
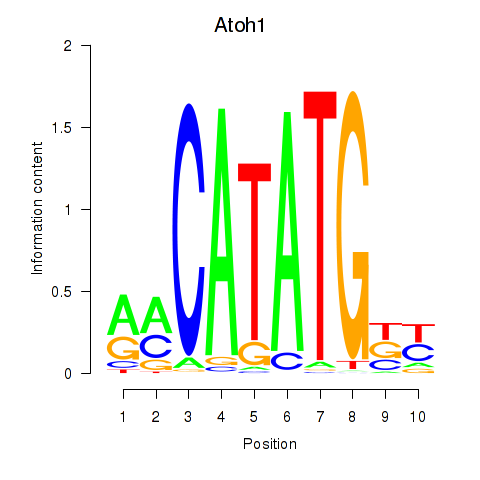
| Atoh1_Bhlhe23 | -0.500 |
|
|
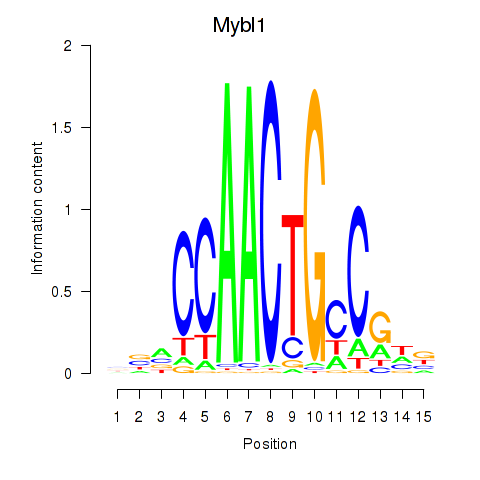
| Mybl1 | -0.506 |
|
|
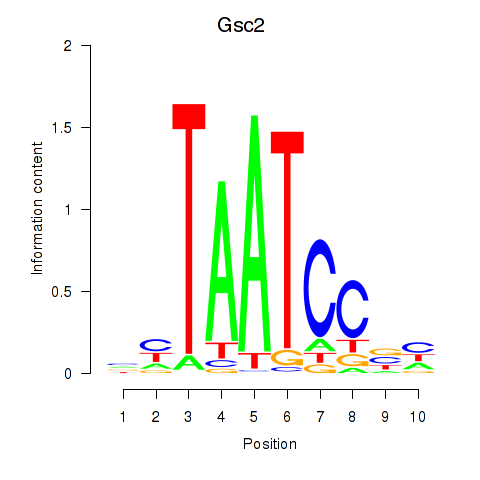
| Gsc2_Dmbx1 | -0.510 |
|
|
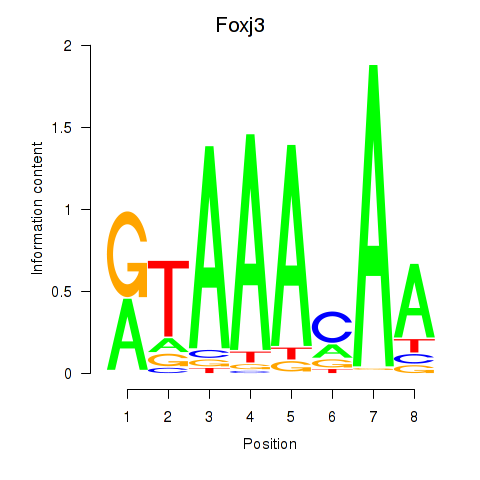
| Foxj3_Tbl1xr1 | -0.532 |
|
|
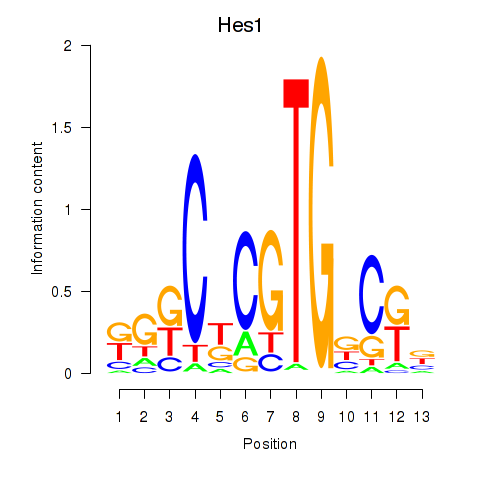
| Hes1 | -0.538 |
|
|
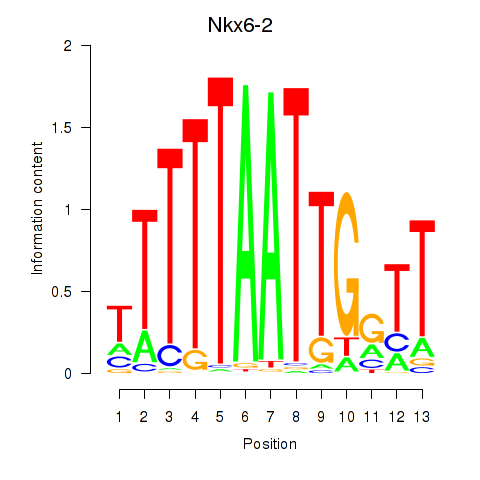
| Nkx6-2 | -0.547 |
|
|
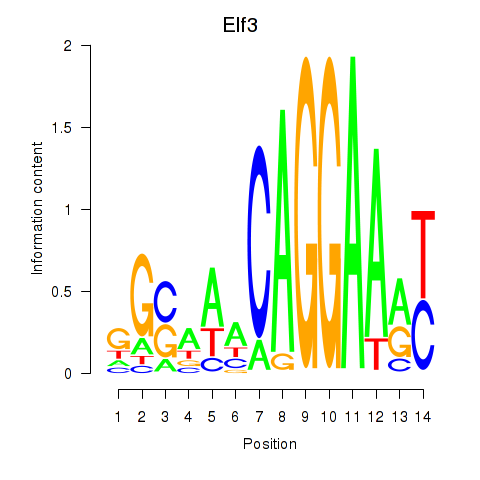
| Elf3 | -0.549 |
|
|
| Insm1 | -0.557 |
|
|
| Tbx3 | -0.559 |
|
|
| Nkx2-5 | -0.567 |
|
|
| Gli3_Zic1 | -0.569 |
|
|
| Batf | -0.572 |
|
|
| Zbtb16 | -0.572 |
|
|
| Alx4 | -0.579 |
|
|
| Mef2d_Mef2a | -0.595 |
|
|
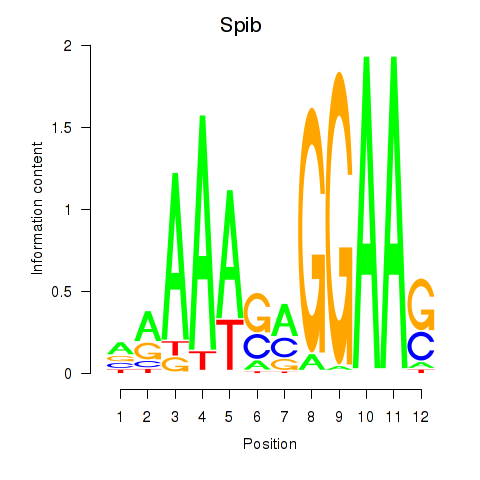
| Spib | -0.603 |
|
|
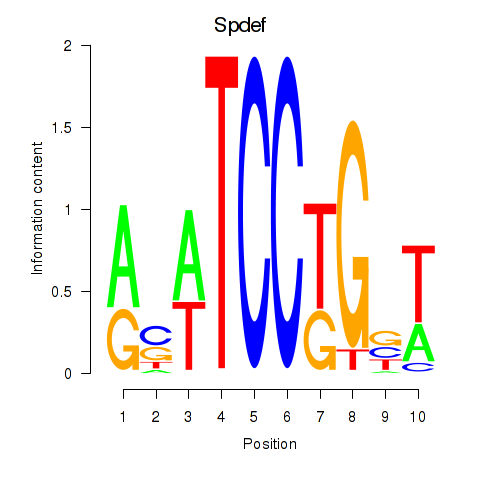
| Spdef | -0.604 |
|
|
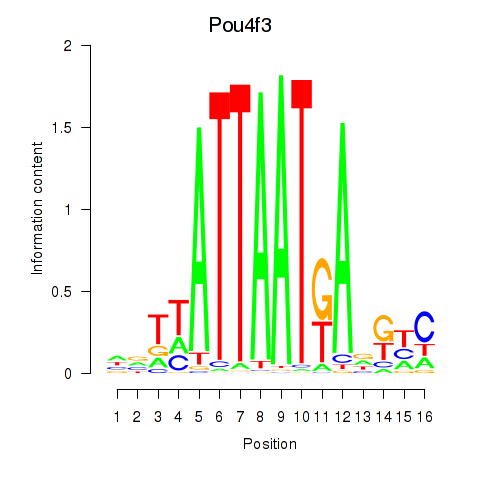
| Pou4f3 | -0.608 |
|
|
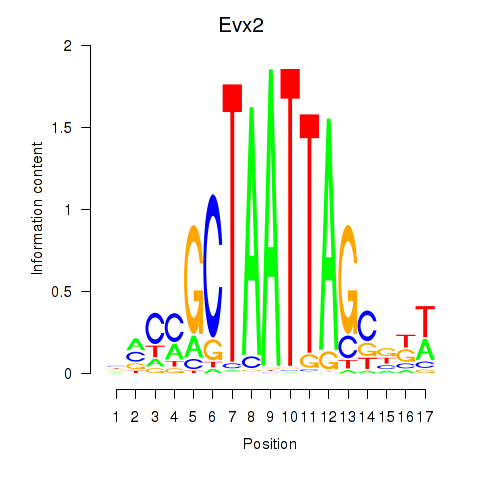
| Evx2 | -0.610 |
|
|
| Hif1a | -0.615 |
|
|
| Pax4 | -0.626 |
|
|
| Zbtb7b | -0.629 |
|
|
| Nr2f6 | -0.651 |
|
|
| Ezh2_Atf2_Ikzf1 | -0.651 |
|
|
| Esrrg | -0.681 |
|
|
| Foxp1_Foxj2 | -0.683 |
|
|
| Batf3 | -0.695 |
|
|
| Tfap2a | -0.705 |
|
|
| Hdx | -0.710 |
|
|
| Hmx1 | -0.713 |
|
|
| Smad3 | -0.719 |
|
|
| Hoxb2_Dlx2 | -0.721 |
|
|
| Onecut2_Onecut3 | -0.733 |
|
|
| Maf_Nrl | -0.741 |
|
|
| Obox1 | -0.741 |
|
|
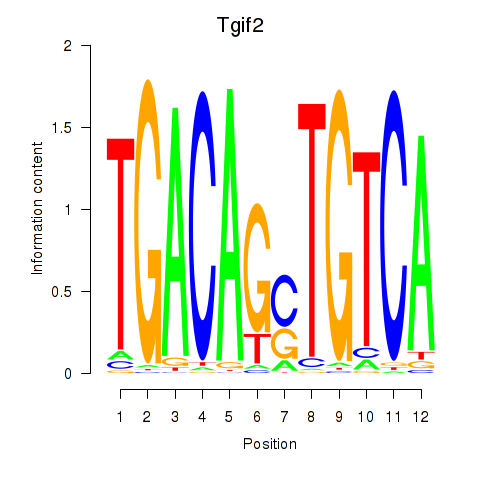
| Tgif2_Tgif2lx1_Tgif2lx2 | -0.763 |
|
|
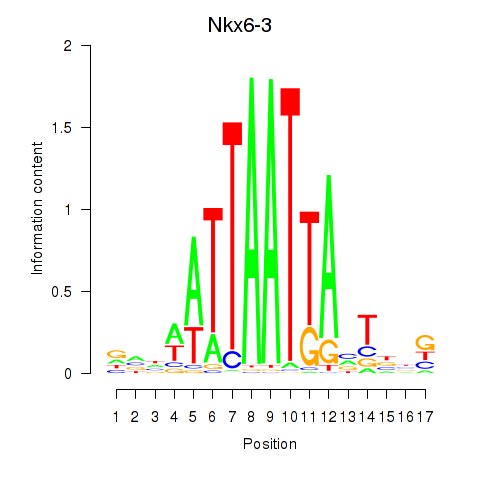
| Nkx6-3_Dbx2_Barx2 | -0.766 |
|
|
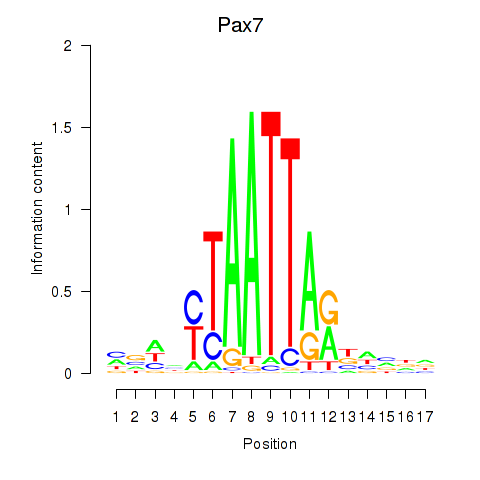
| Pax7 | -0.785 |
|
|
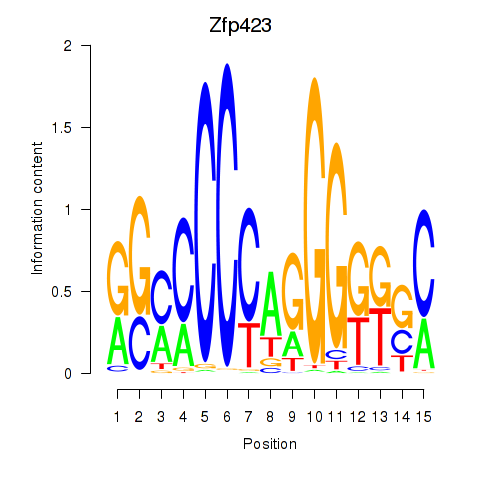
| Zfp423 | -0.804 |
|
|
| Isl1 | -0.824 |
|
|
| Vsx2_Dlx3 | -0.829 |
|
|
| Trp53 | -0.835 |
|
|
| Etv4 | -0.843 |
|
|
| Neurod1 | -0.845 |
|
|
| Esr2 | -0.849 |
|
|
| Pparg_Rxrg | -0.851 |
|
|
| Atf1_Creb5 | -0.852 |
|
|
| Zbtb14 | -0.855 |
|
|
| Hlf | -0.855 |
|
|
| Pbx2 | -0.856 |
|
|
| Esr1 | -0.859 |
|
|
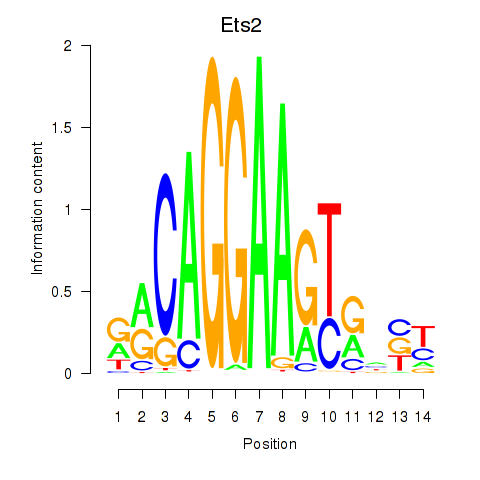
| Ets2 | -0.878 |
|
|
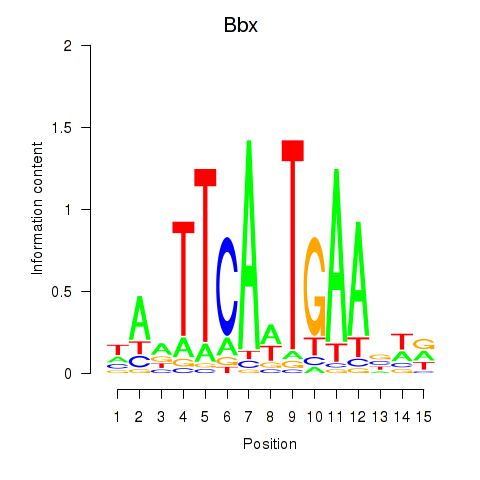
| Bbx | -0.882 |
|
|
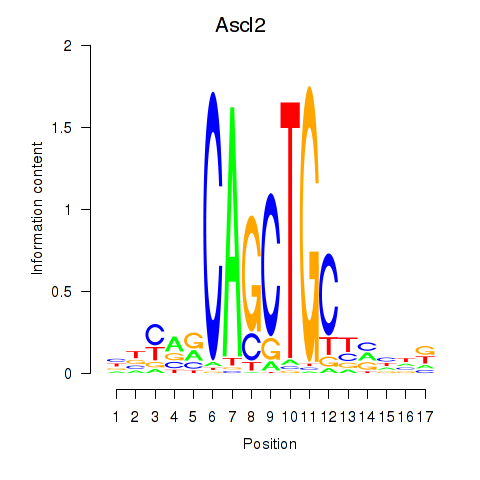
| Ascl2 | -0.888 |
|
|
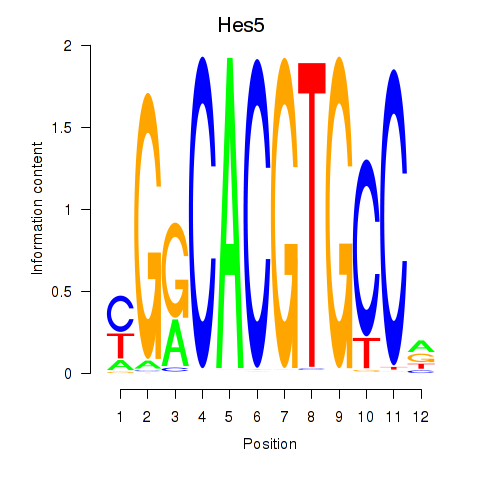
| Hes5_Hes7 | -0.894 |
|
|
| Prdm14 | -0.906 |
|
|
| Gata6 | -0.914 |
|
|
| Rfx2_Rfx7 | -0.919 |
|
|
| Zfp410 | -0.927 |
|
|
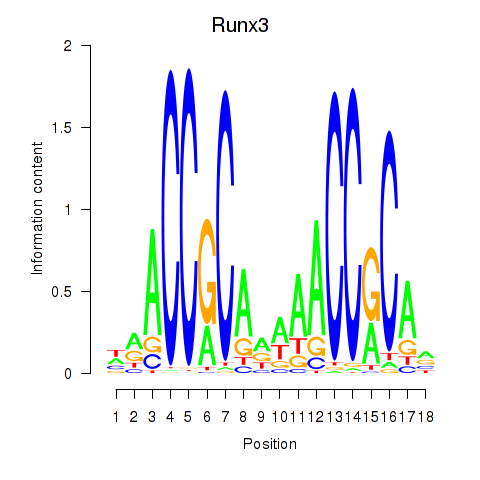
| Runx3 | -0.954 |
|
|
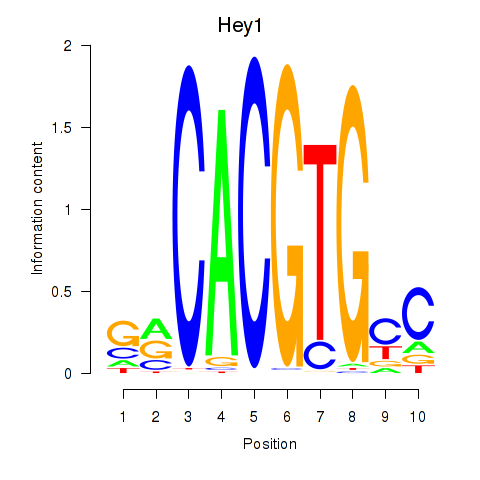
| Hey1_Myc_Mxi1 | -0.955 |
|
|
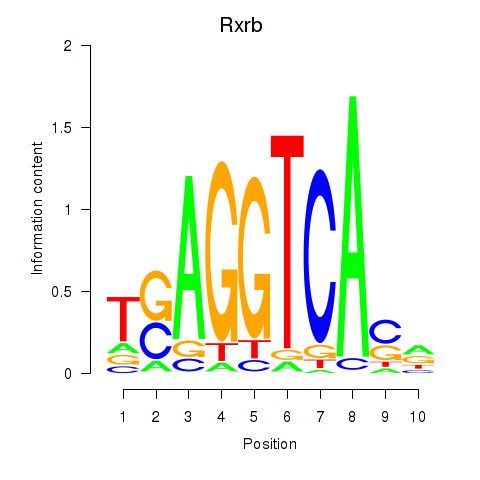
| Rxrb | -0.974 |
|
|
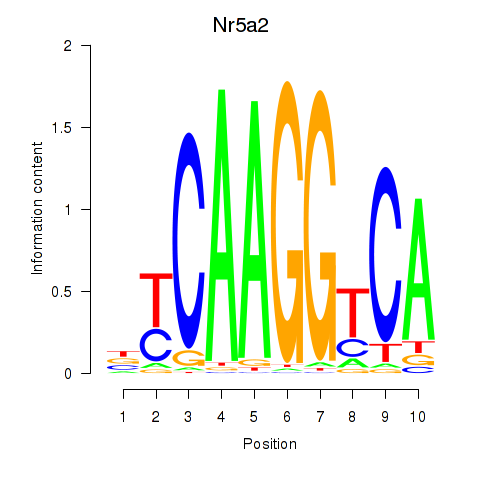
| Nr5a2 | -0.976 |
|
|
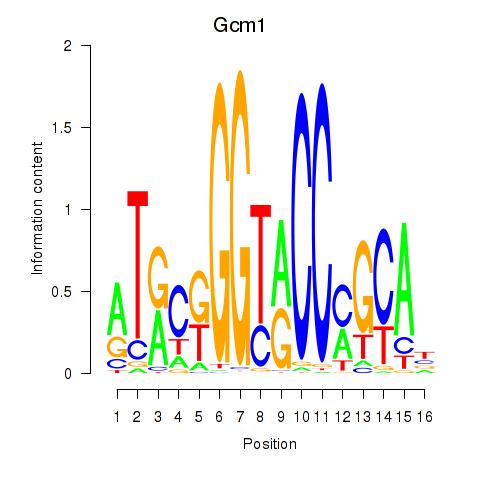
| Gcm1 | -0.984 |
|
|
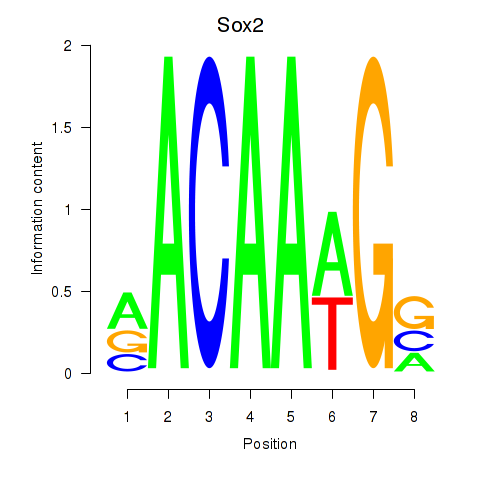
| Sox2 | -0.987 |
|
|
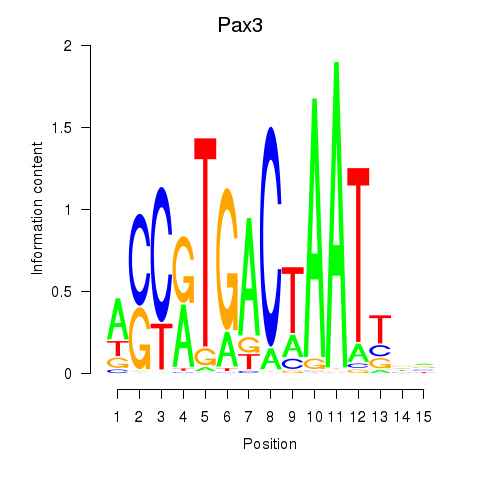
| Pax3 | -0.992 |
|
|
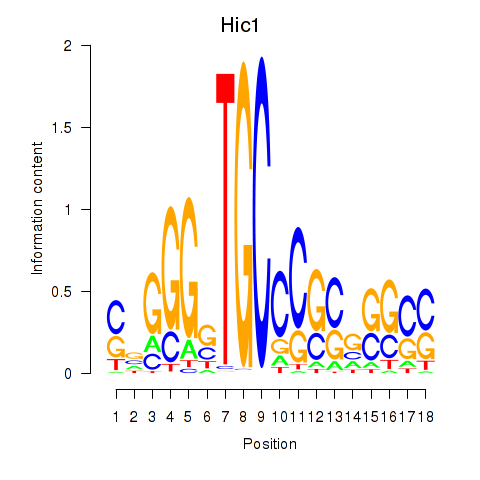
| Hic1 | -0.998 |
|
|
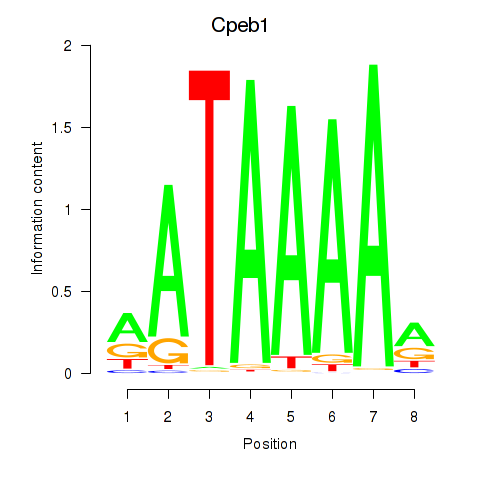
| Cpeb1 | -1.000 |
|
|
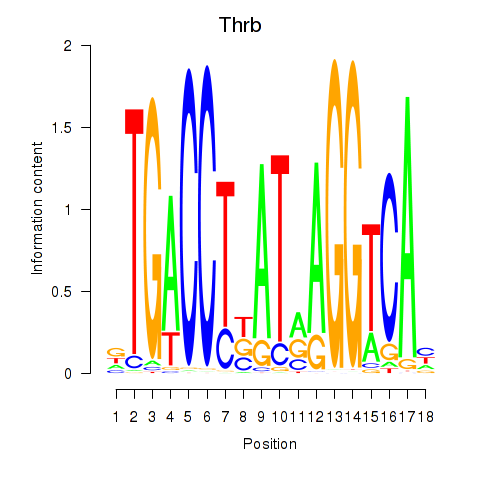
| Thrb | -1.013 |
|
|
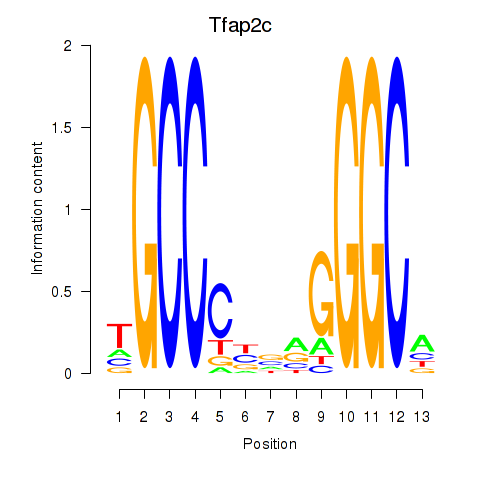
| Tfap2c | -1.014 |
|
|
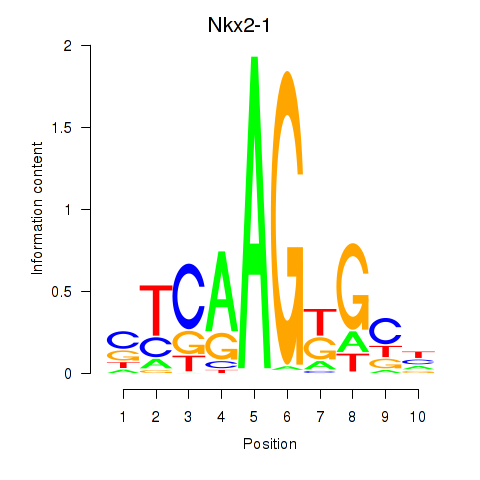
| Nkx2-1 | -1.016 |
|
|
| Smad4 | -1.026 |
|
|
| Epas1_Bcl3 | -1.064 |
|
|
| Gbx1_Nobox_Alx3 | -1.075 |
|
|
| Nhlh1 | -1.076 |
|
|
| Nkx1-1_Nkx1-2 | -1.077 |
|
|
| Sox6_Sox9 | -1.096 |
|
|
| Pou2f2_Pou3f1 | -1.103 |
|
|
| Ovol1 | -1.104 |
|

|
| Zic4 | -1.117 |
|
|
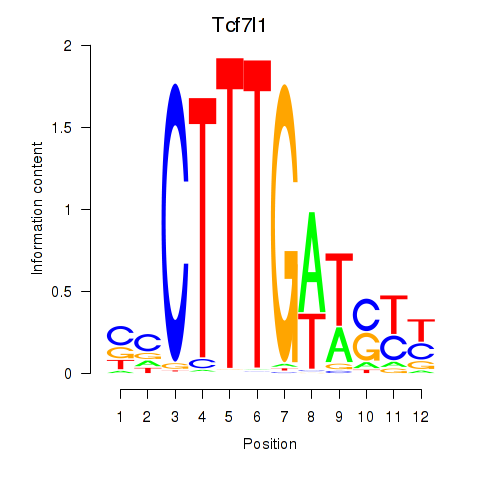
| Tcf7l1 | -1.135 |
|
|
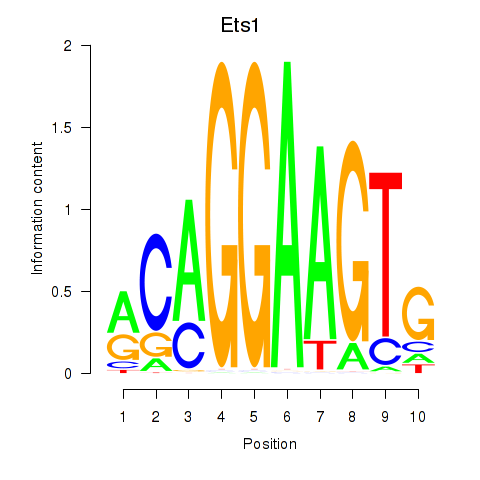
| Ets1 | -1.154 |
|
|
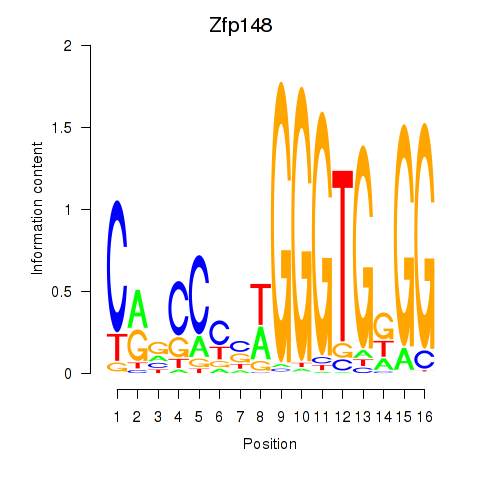
| Zfp148 | -1.157 |
|
|
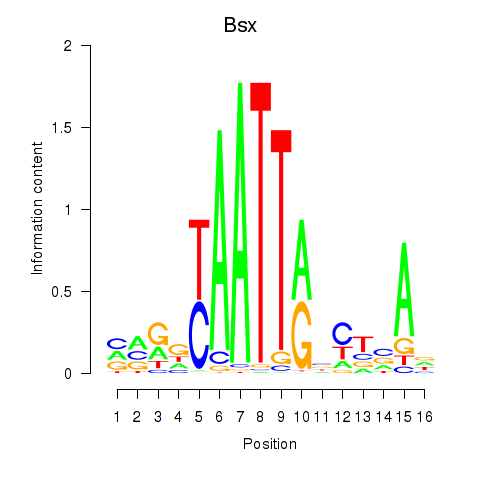
| Bsx | -1.158 |
|
|
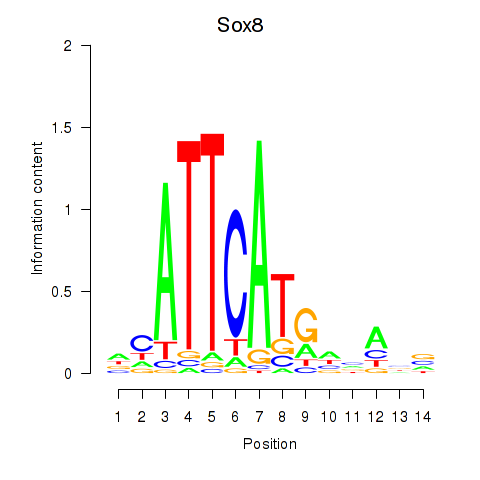
| Sox8 | -1.166 |
|
|
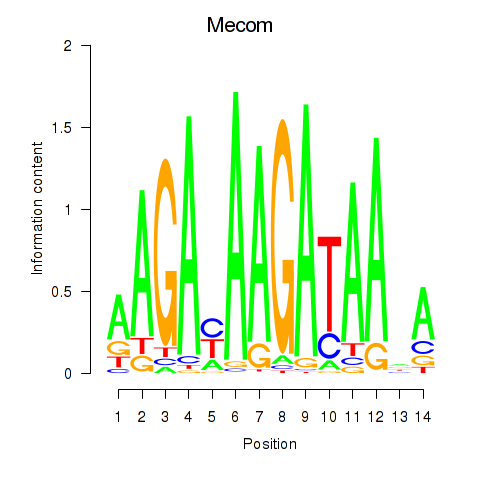
| Mecom | -1.197 |
|
|
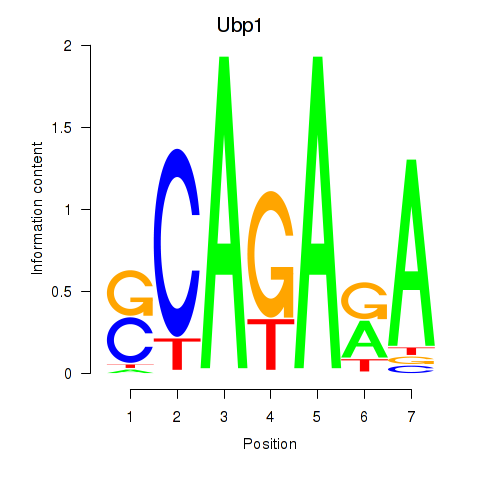
| Ubp1 | -1.198 |
|
|
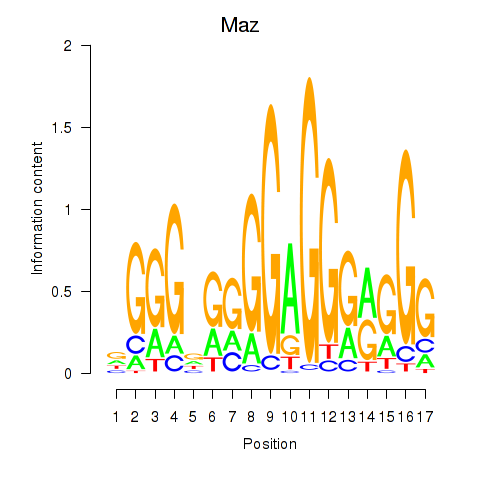
| Maz_Zfp281 | -1.215 |
|
|
| Nfe2l2 | -1.247 |
|
|
| Hmga1 | -1.248 |
|
|
| Otx1 | -1.260 |
|
|
| Pou5f1 | -1.263 |
|
|
| Jun | -1.295 |
|
|
| Klf8 | -1.297 |
|
|
| Nfia | -1.303 |
|
|
| Olig2_Olig3 | -1.309 |
|
|
| Cux1 | -1.365 |
|
|
| Tbx21 | -1.372 |
|

|
| Tfap4 | -1.399 |
|
|
| Bcl6b | -1.404 |
|
|
| Rreb1 | -1.406 |
|
|
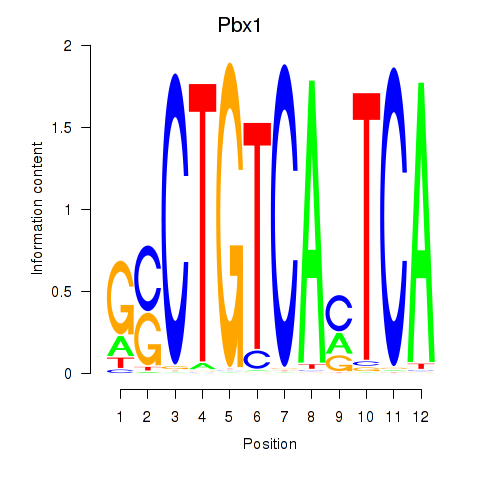
| Pbx1_Pbx3 | -1.431 |
|
|
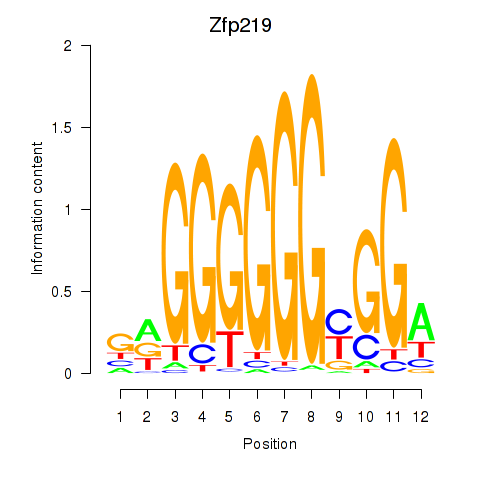
| Zfp219_Zfp740 | -1.440 |
|
|
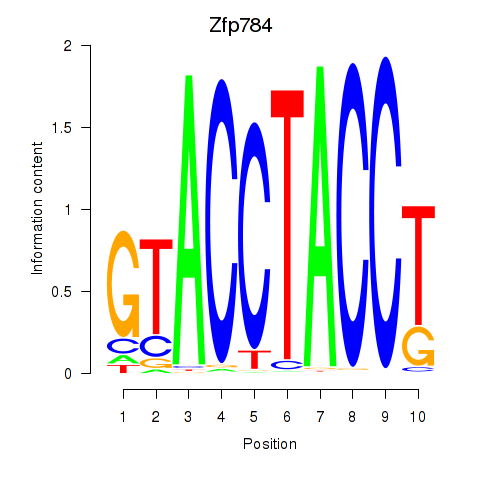
| Zfp784 | -1.447 |
|
|
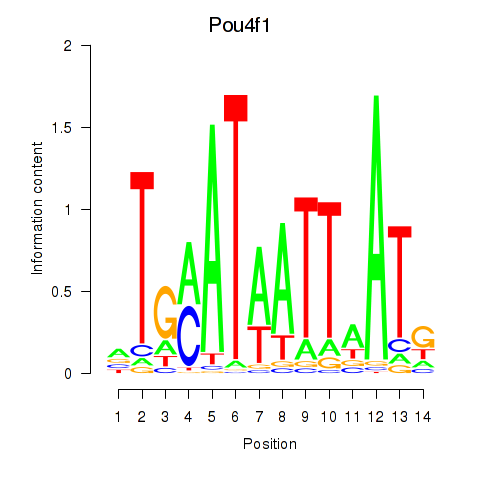
| Pou4f1_Pou6f1 | -1.477 |
|
|
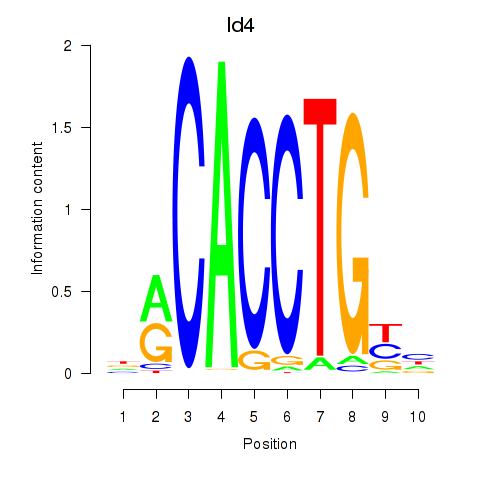
| Id4 | -1.524 |
|
|
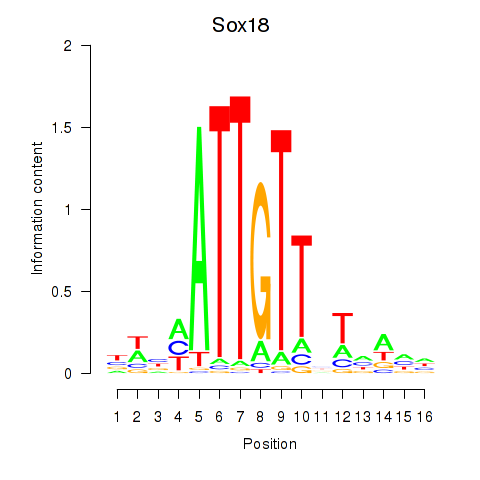
| Sox18_Sox12 | -1.534 |
|
|
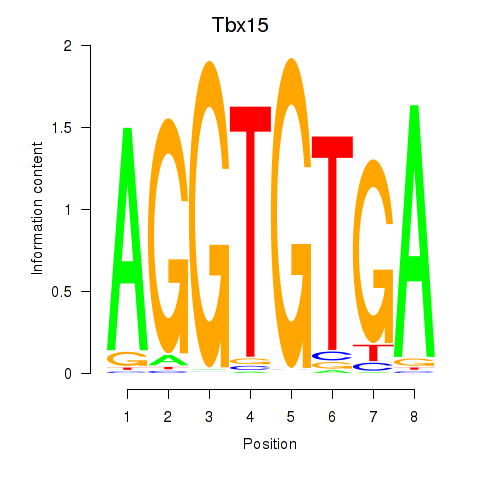
| Tbx15 | -1.537 |
|
|
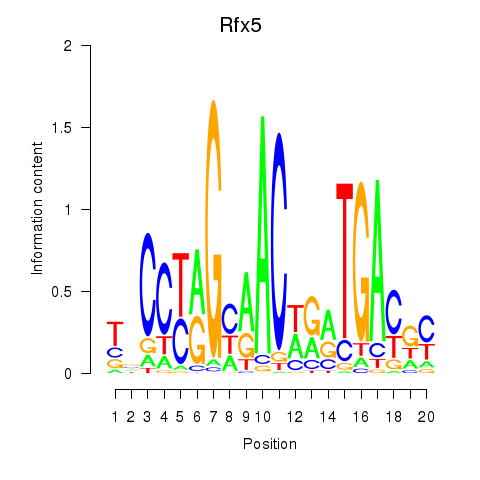
| Rfx5 | -1.542 |
|
|
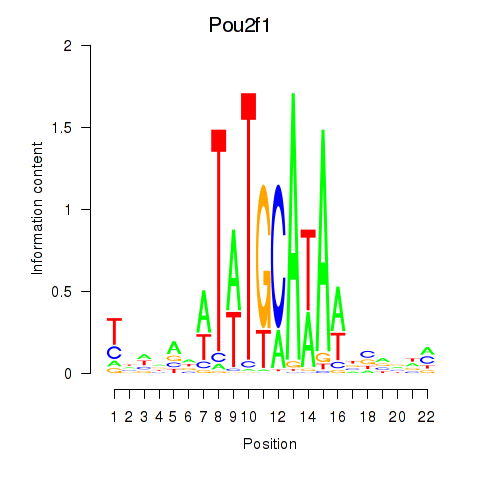
| Pou2f1 | -1.546 |
|
|
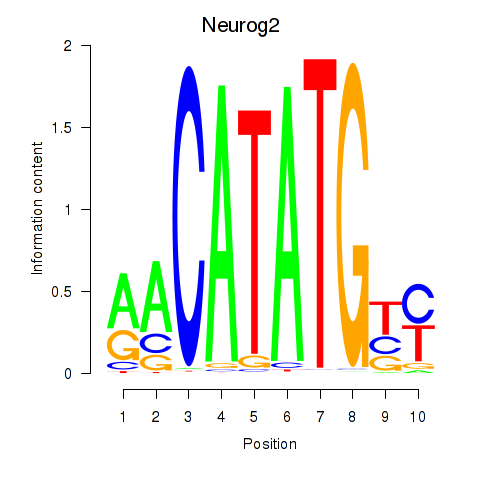
| Neurog2 | -1.567 |
|
|
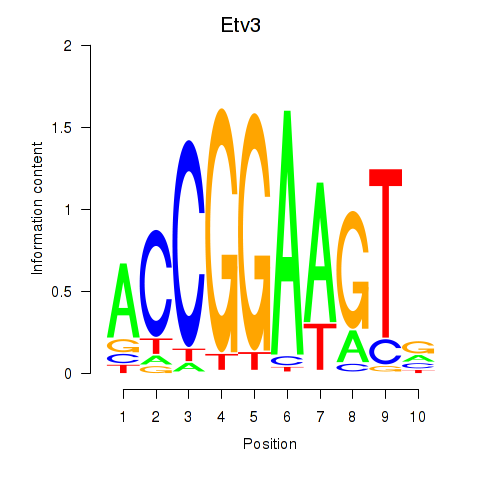
| Etv3_Erf_Fev_Elk4_Elk1_Elk3 | -1.647 |
|
|
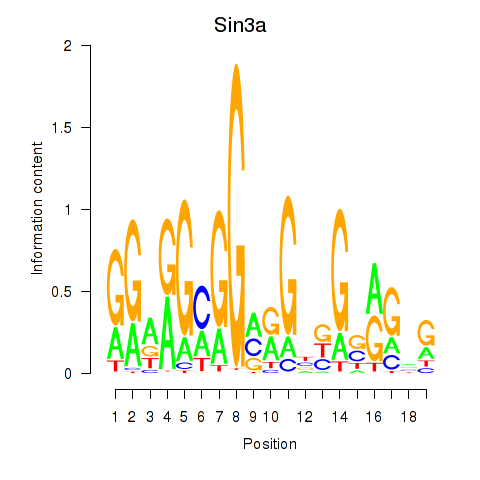
| Sin3a | -1.652 |
|
|
| Tbx2 | -1.663 |
|
|
| Sox11 | -1.665 |
|
|
| Smad2 | -1.676 |
|
|
| Klf1 | -1.691 |
|
|
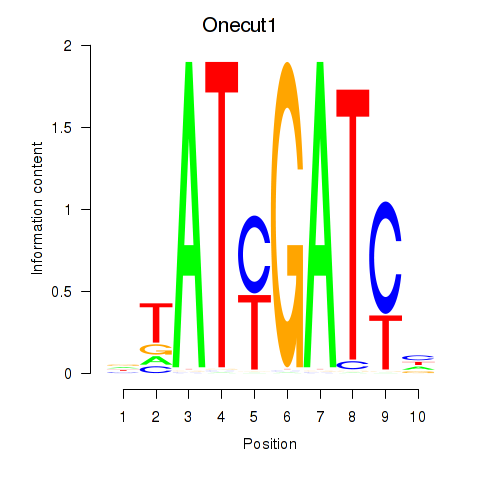
| Onecut1_Cux2 | -1.692 |
|
|
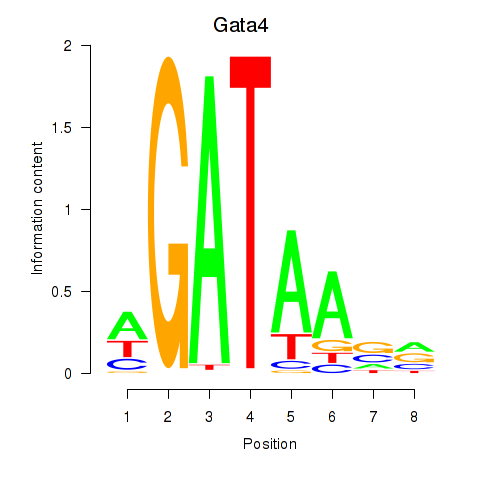
| Gata4 | -1.701 |
|
|
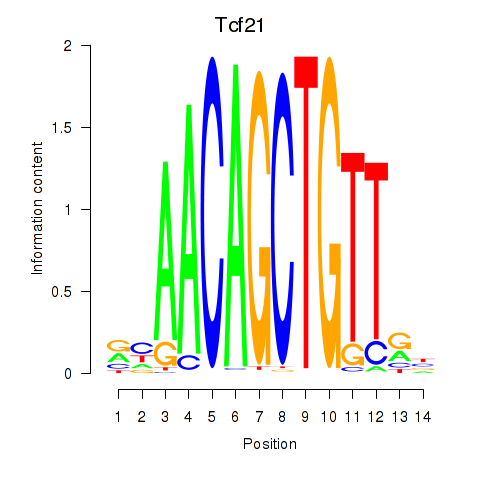
| Tcf21_Msc | -1.755 |
|
|
| Foxo6 | -1.766 |
|

|
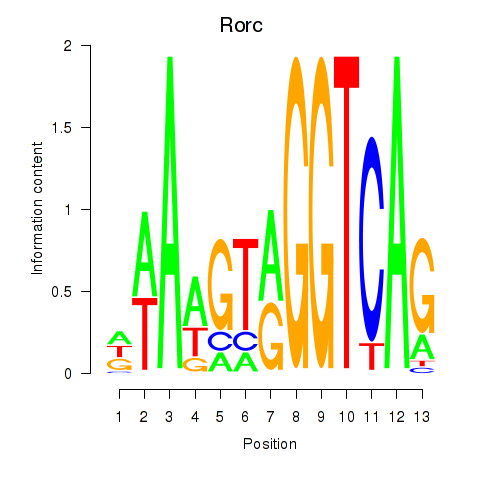
| Rorc_Nr1d1 | -1.770 |
|
|
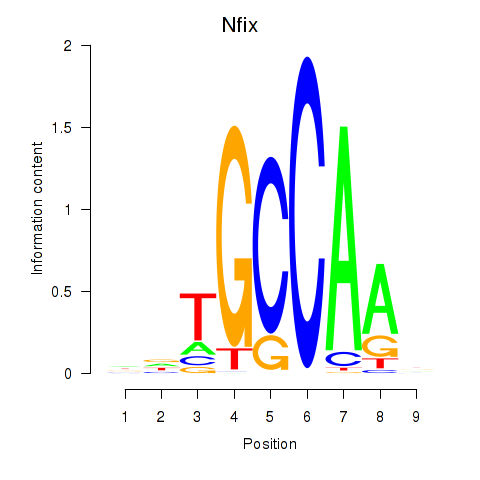
| Nfix | -1.784 |
|
|
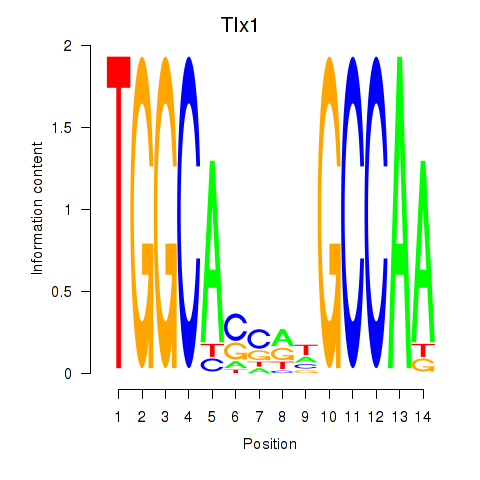
| Tlx1 | -1.827 |
|
|
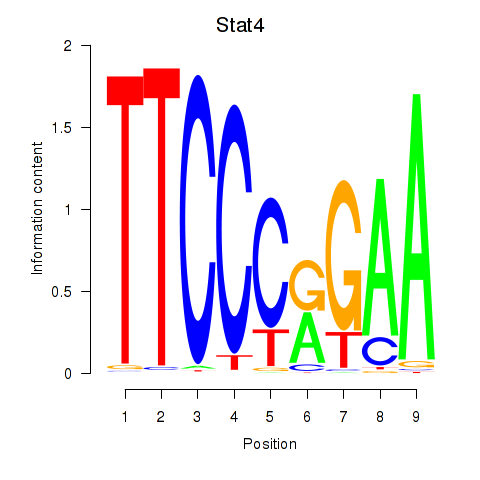
| Stat4_Stat3_Stat5b | -1.859 |
|
|
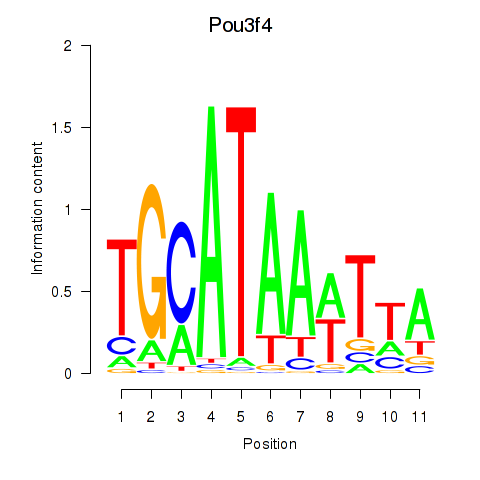
| Pou3f4 | -1.860 |
|
|
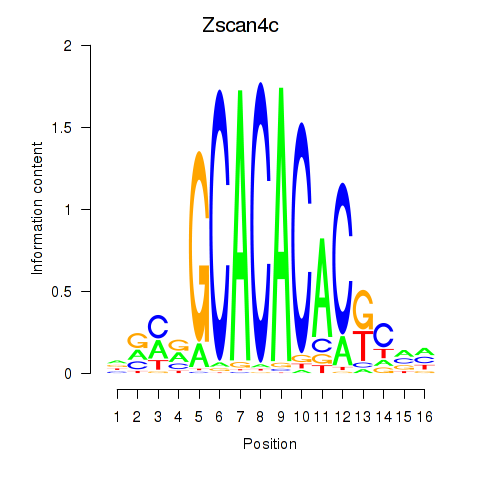
| Zscan4c | -1.932 |
|
|
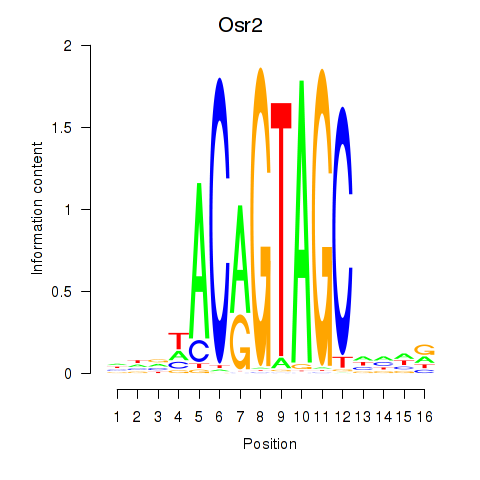
| Osr2_Osr1 | -1.947 |
|
|
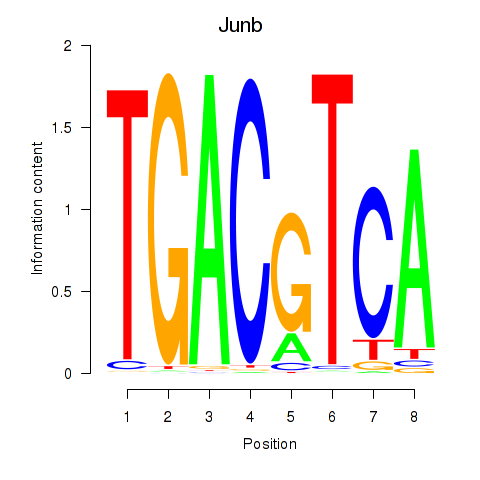
| Junb_Jund | -1.973 |
|
|
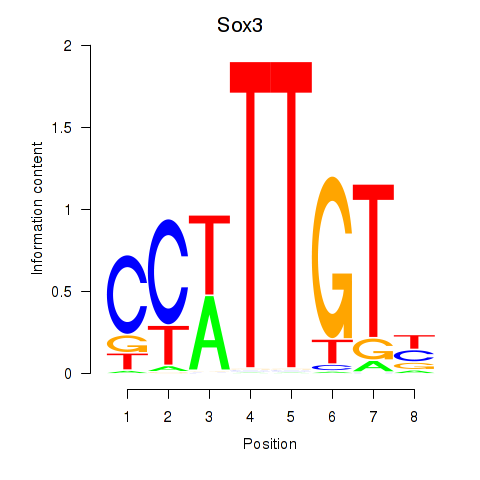
| Sox3_Sox10 | -1.998 |
|
|
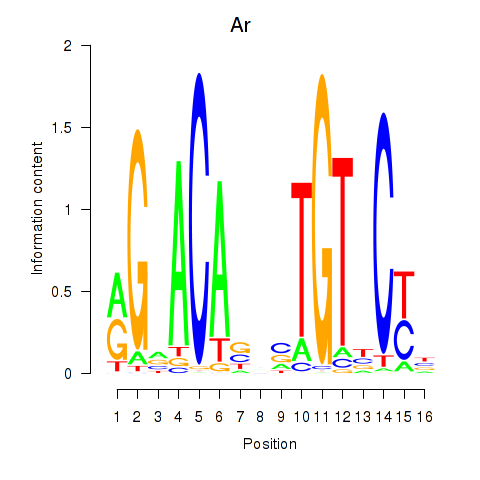
| Ar | -2.014 |
|
|
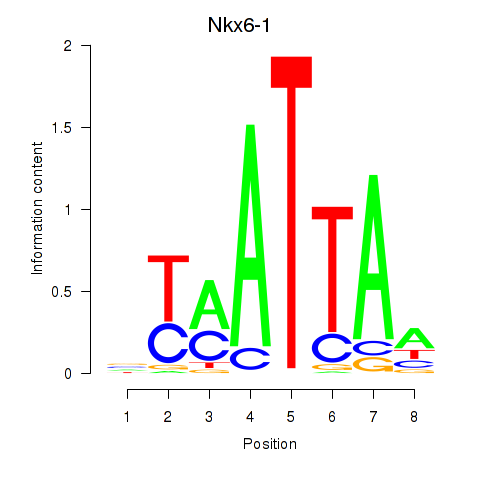
| Nkx6-1_Evx1_Hesx1 | -2.032 |
|
|
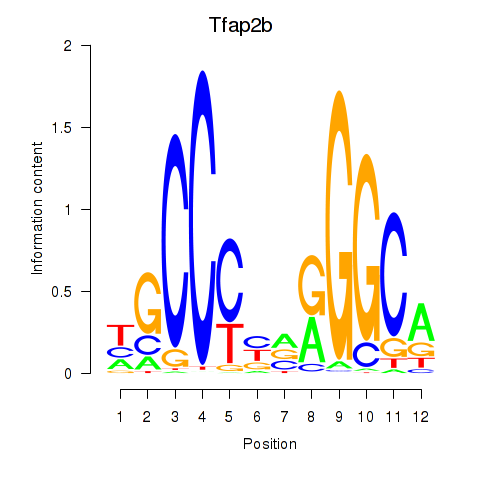
| Tfap2b | -2.032 |
|
|
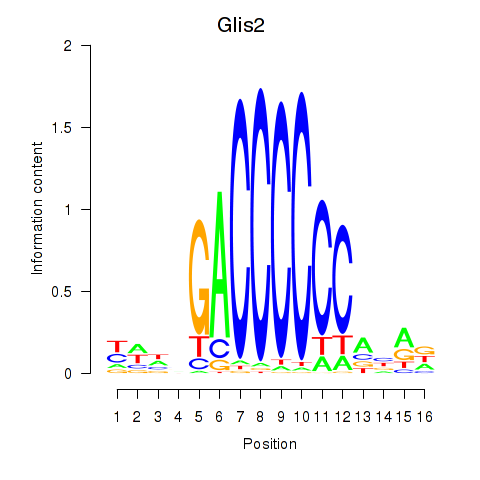
| Glis2 | -2.055 |
|
|
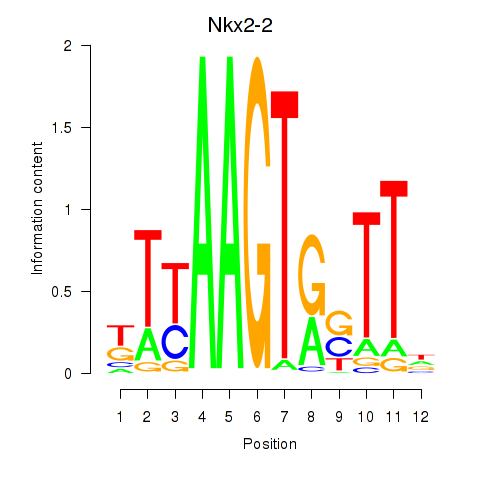
| Nkx2-2 | -2.134 |
|
|
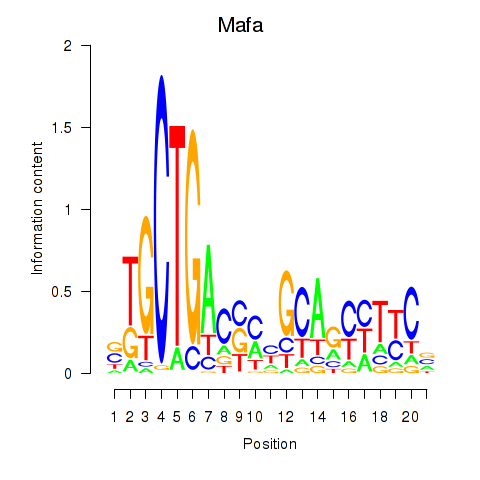
| Mafa | -2.198 |
|
|
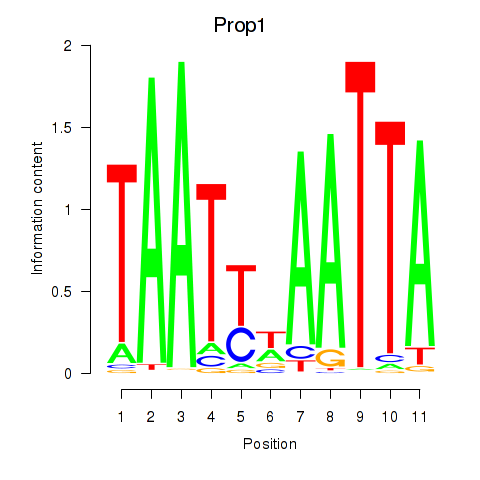
| Prop1 | -2.269 |
|
|
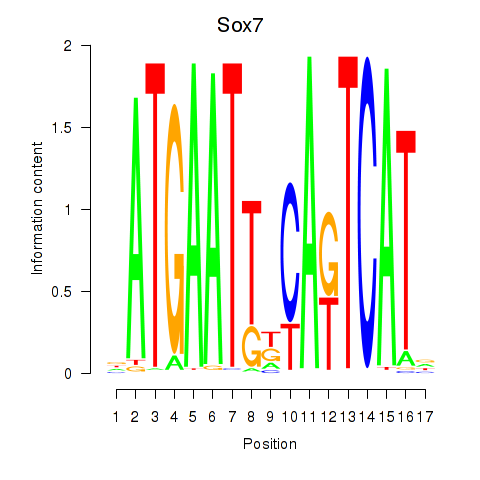
| Sox7 | -2.302 |
|
|
| Gata5 | -2.388 |
|
|
| Plag1 | -2.393 |
|
|
| Zbtb3 | -2.515 |
|
|
| Irx5 | -2.516 |
|
|
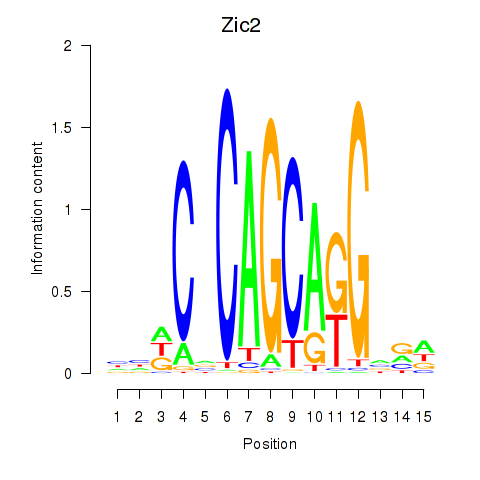
| Zic2 | -2.605 |
|
|
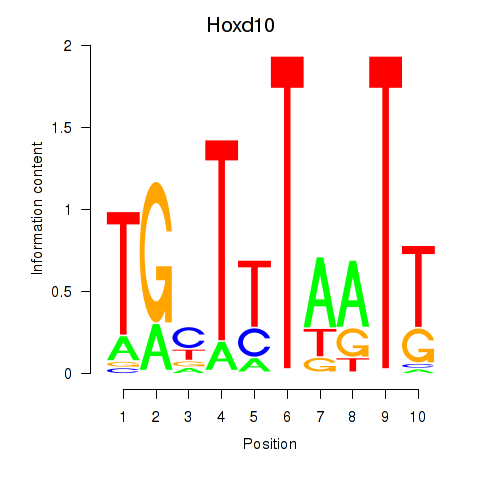
| Hoxd10 | -2.625 |
|
|
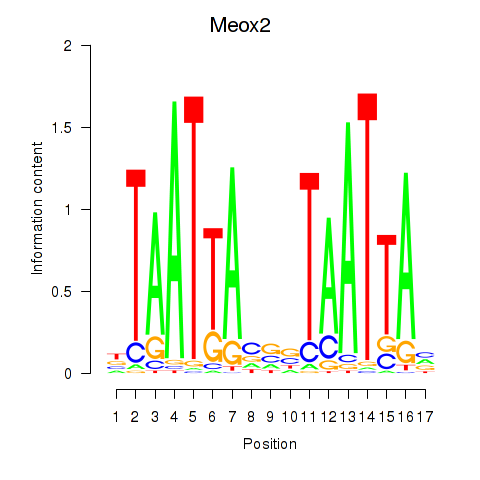
| Meox2 | -2.869 |
|
|
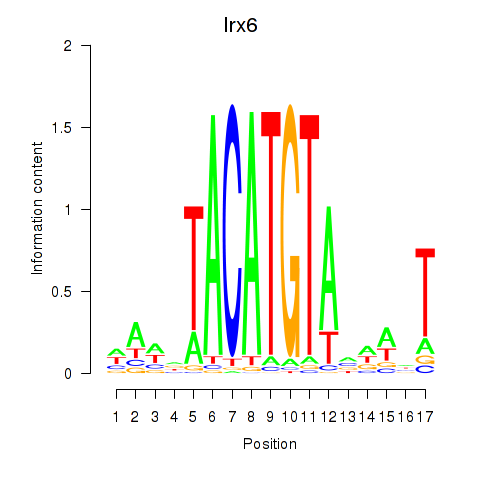
| Irx6_Irx2_Irx3 | -2.873 |
|
|
| Hic2 | -2.911 |
|
|
| Klf6_Patz1 | -3.298 |
|
|
| Gata2_Gata1 | -3.319 |
|
|
| Gata3 | -3.490 |
|
|
| Zfp691 | -3.535 |
|
|
| Hmga2 | -3.607 |
|
|
| Zfp110 | -3.734 |
|
|
| Chd1_Pml | -3.852 |
|
|
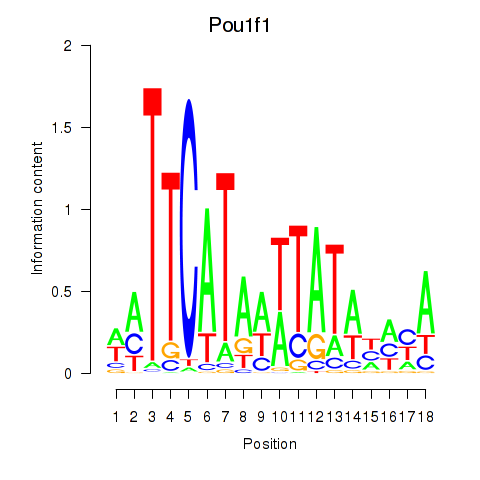
| Pou1f1 | -3.887 |
|
|
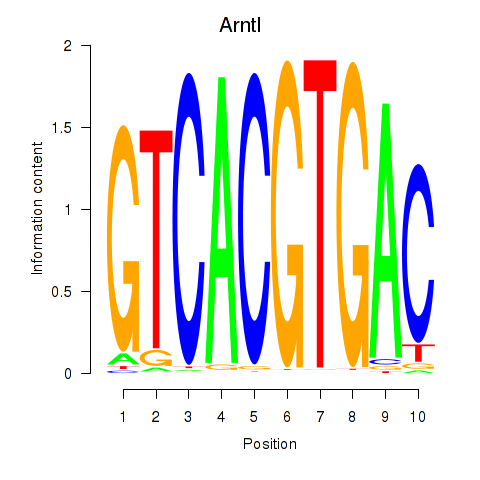
| Arntl_Tfe3_Mlx_Mitf_Mlxipl_Tfec | -4.091 |
|
|
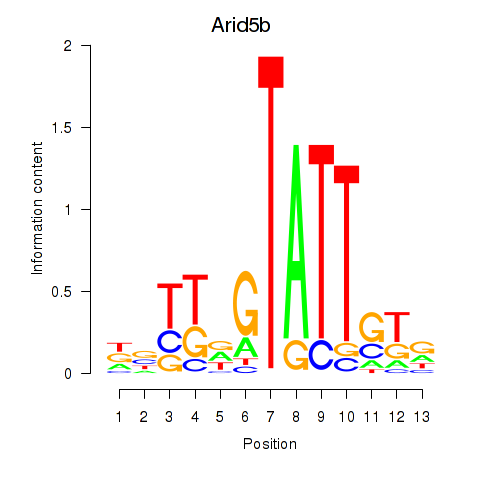
| Arid5b | -4.137 |
|
|
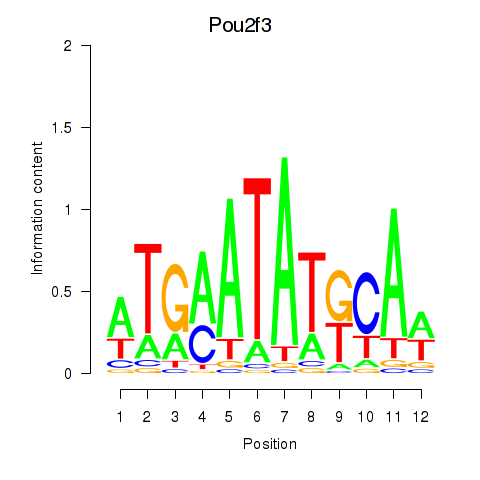
| Pou2f3 | -4.173 |
|
|
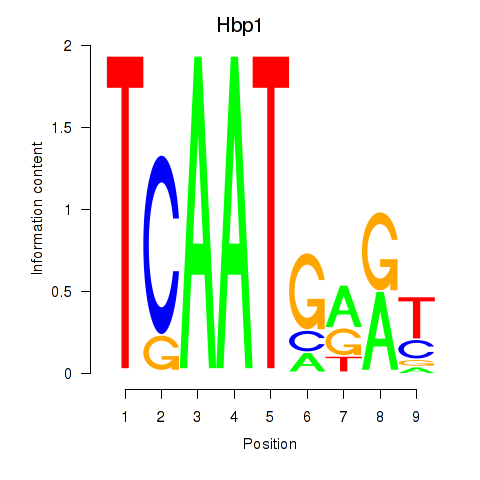
| Hbp1 | -4.427 |
|
|
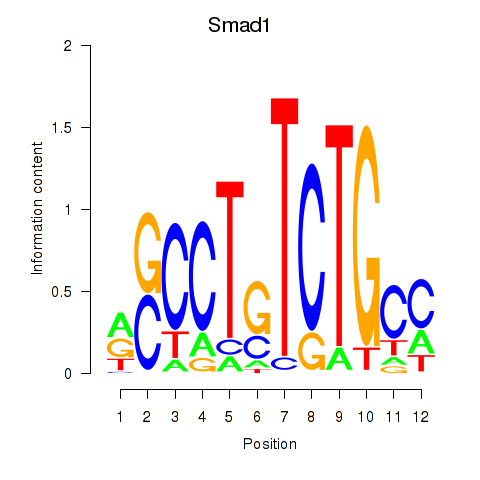
| Smad1 | -4.769 |
|
|
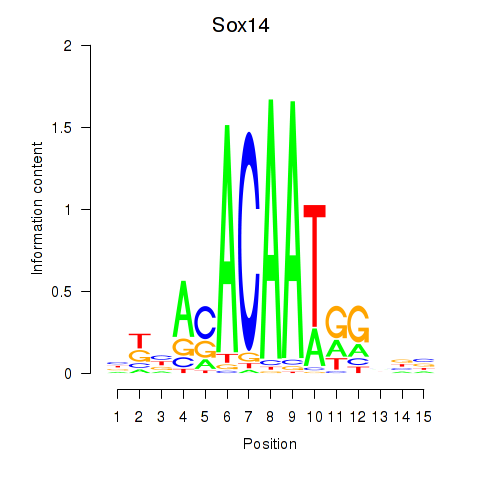
| Sox14 | -5.147 |
|
|
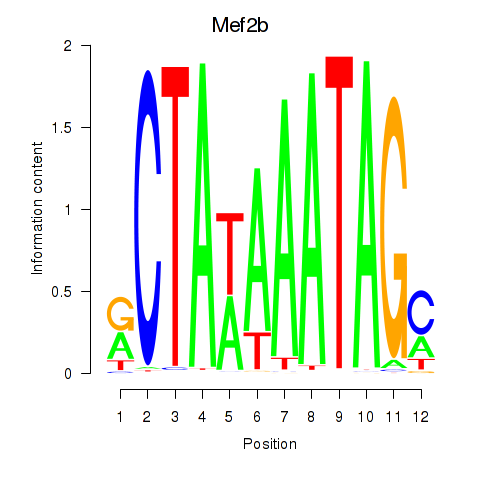
| Mef2b | -5.198 |
|
|
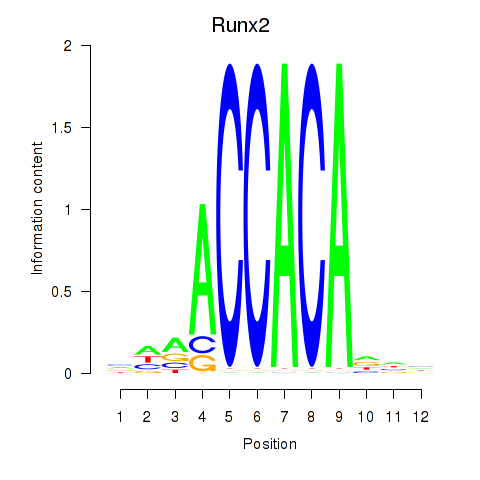
| Runx2_Bcl11a | -5.717 |
|
|
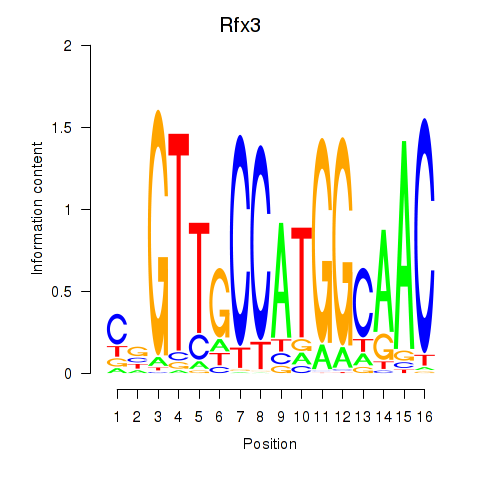
| Rfx3_Rfx1_Rfx4 | -5.946 |
|
|
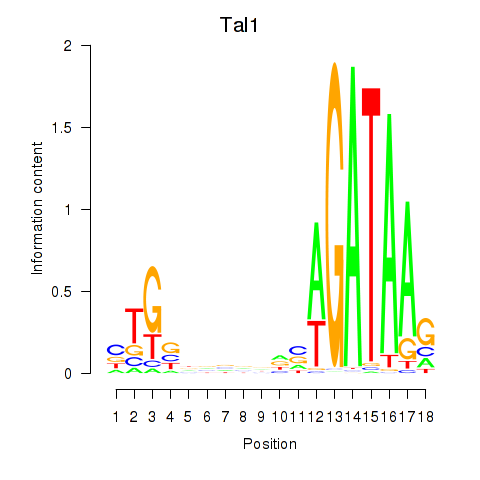
| Tal1 | -6.665 |
|
|
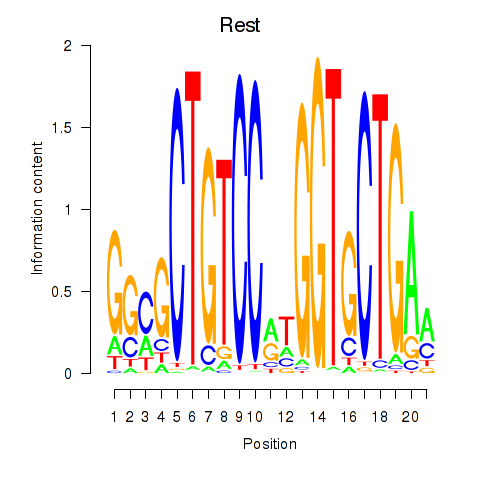
| Rest | -7.168 |
|
|
| Tgif1_Meis3 | -8.480 |
|
|