Project
ENCODE: H3K4me3 ChIP-Seq of different mouse tissues during embryonic development
Navigation
Downloads
Sample name: neuraltube115
QC summary table
QC statistics for this sample |
Comparison with ChIP-Seq ENCODE datasets |
||
Mapping |
|||
Fraction of mapped reads for the IP replicates: |
0.820 | 66th percentile | |
Fraction of mapped reads for the background replicates: |
0.818 | 66th percentile | |
ChIP enrichment signal intensity |
|||
Noise level ChIP signal intensity: |
0.125 | 12nd percentile | |
Error in fit of enrichment distribution: |
0.455 | 34th percentile | |
Peak statistics |
|||
Number of peaks: |
62514 | 93rd percentile | |
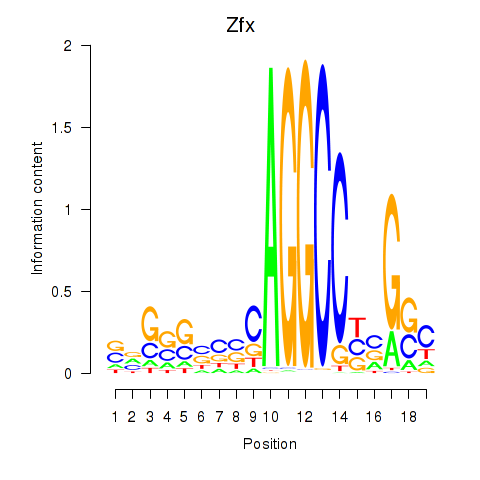
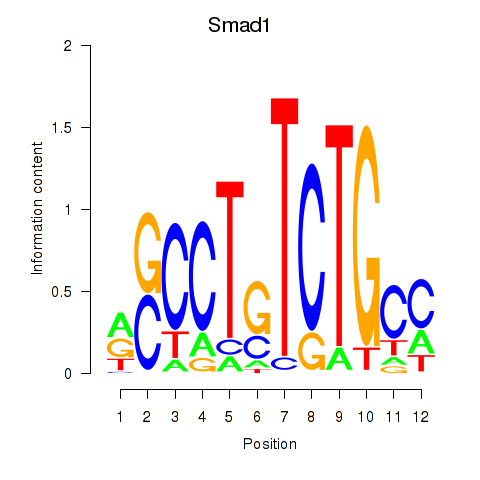
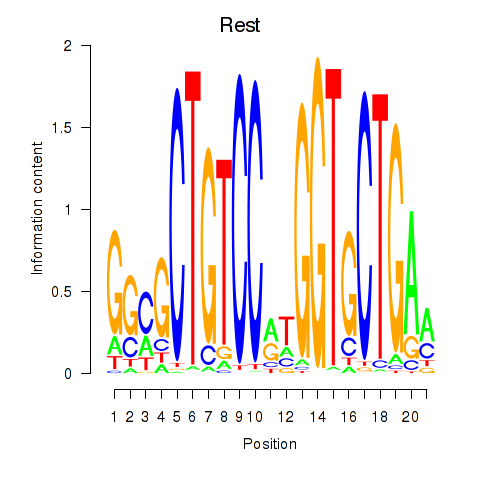
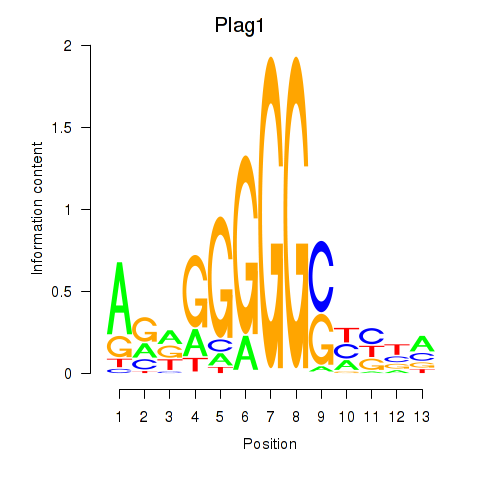
Regulatory motifs sorted by significance (z-value) for sample neuraltube115.
Regulatory motifs sorted by significance (z-value).
| WM name | Z-value | Associated genes | Logo |
|---|---|---|---|
| Zfx_Zfp711 | 9.546 |
|
|
| Smad1 | 6.096 |
|
|
| Rest | 5.943 |
|
|
| Plag1 | 5.005 |
|
|
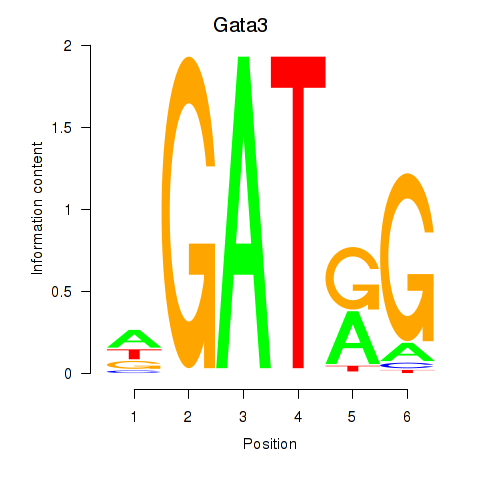
| Gata3 | 4.361 |
|
|
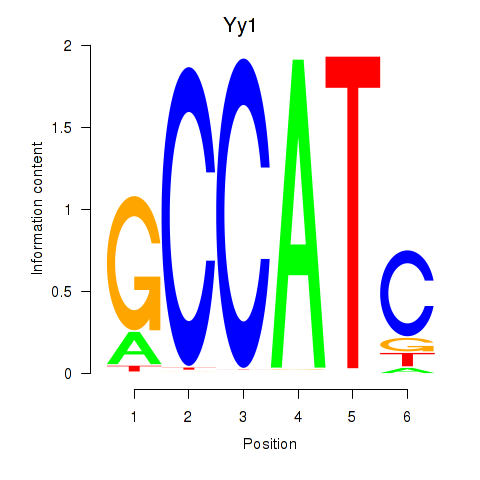
| Yy1_Yy2 | 4.130 |
|
|
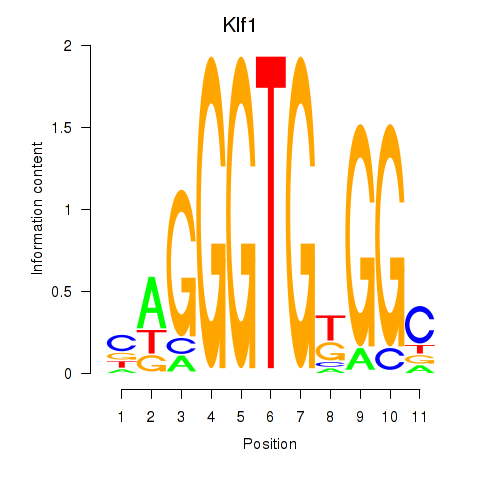
| Klf1 | 3.487 |
|
|
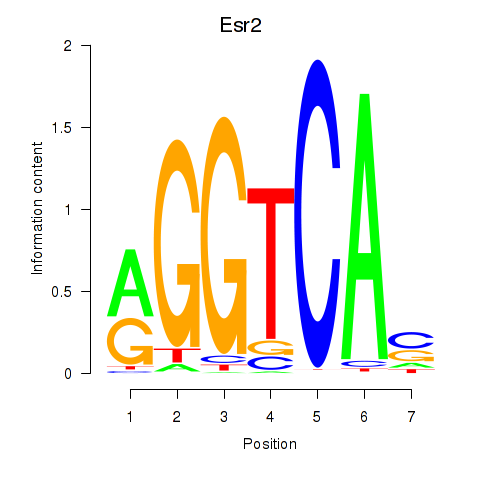
| Esr2 | 3.422 |
|
|
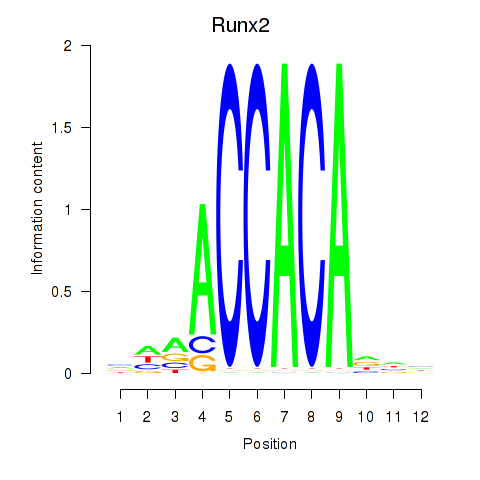
| Runx2_Bcl11a | 3.022 |
|
|
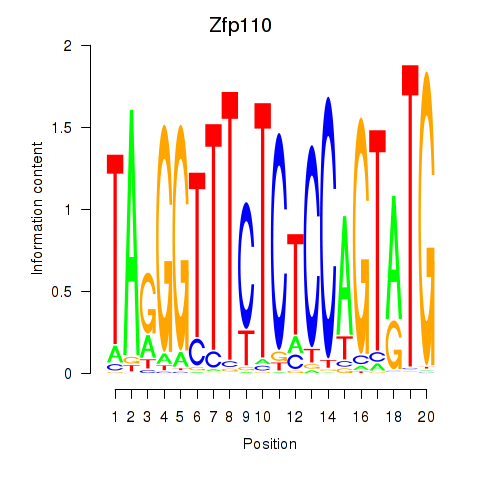
| Zfp110 | 2.945 |
|
|
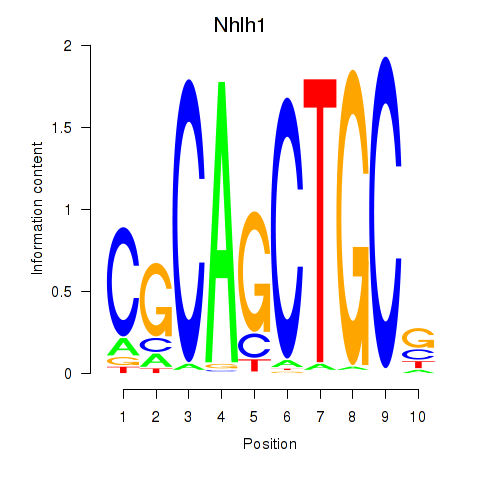
| Nhlh1 | 2.909 |
|
|
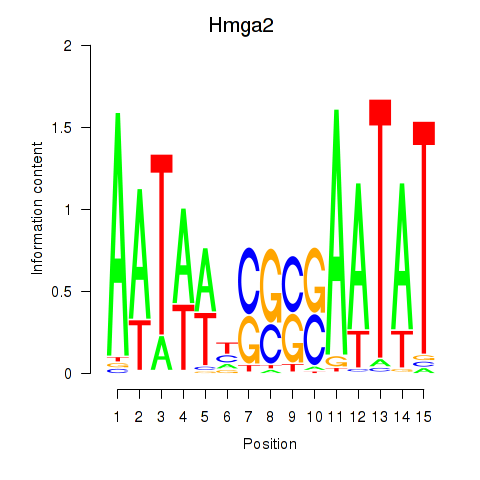
| Hmga2 | 2.780 |
|
|
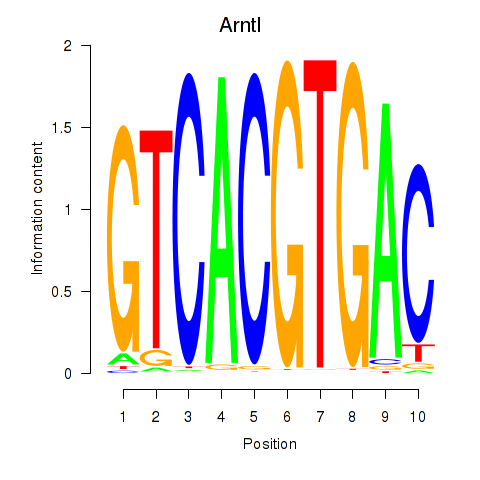
| Arntl_Tfe3_Mlx_Mitf_Mlxipl_Tfec | 2.705 |
|
|
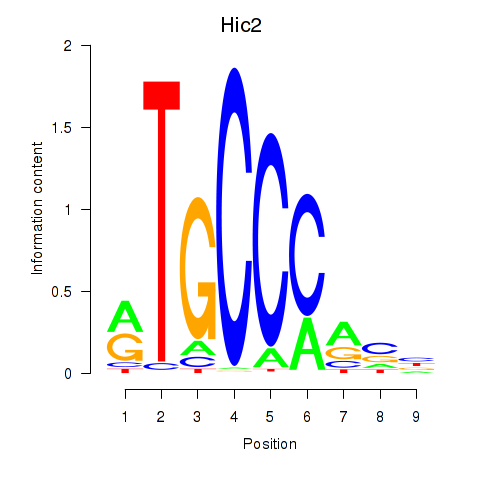
| Hic2 | 2.704 |
|
|
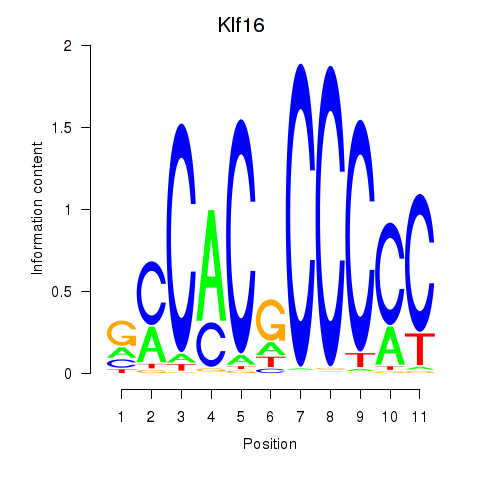
| Klf16_Sp8 | 2.631 |
|
|
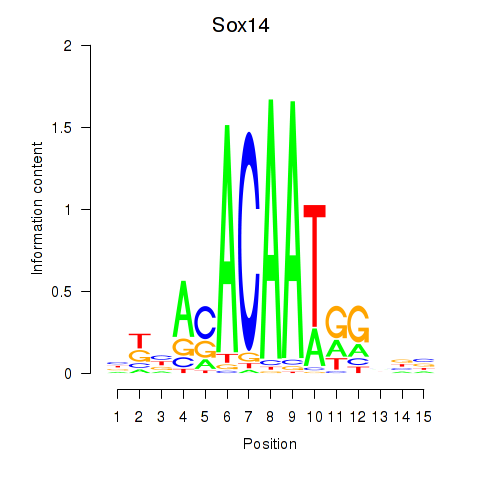
| Sox14 | 2.611 |
|
|
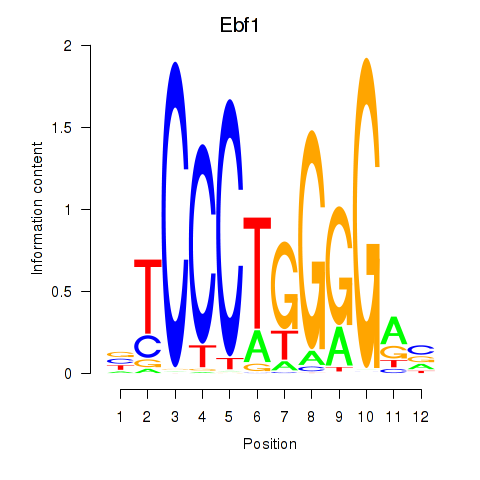
| Ebf1 | 2.509 |
|
|
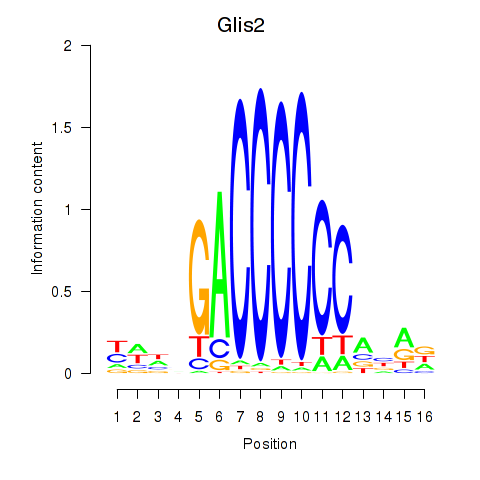
| Glis2 | 2.503 |
|
|
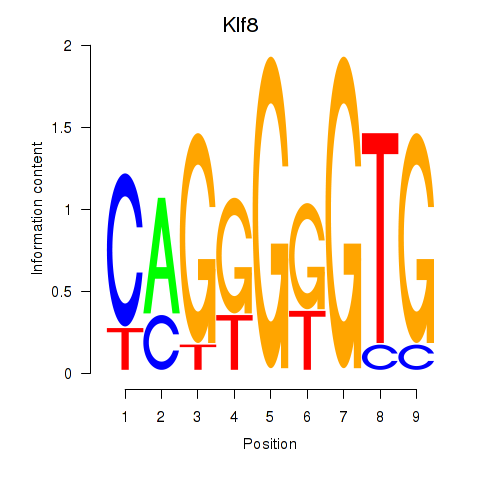
| Klf8 | 2.481 |
|
|
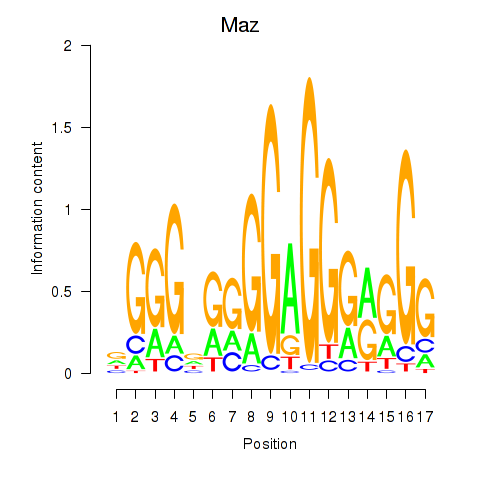
| Maz_Zfp281 | 2.434 |
|
|
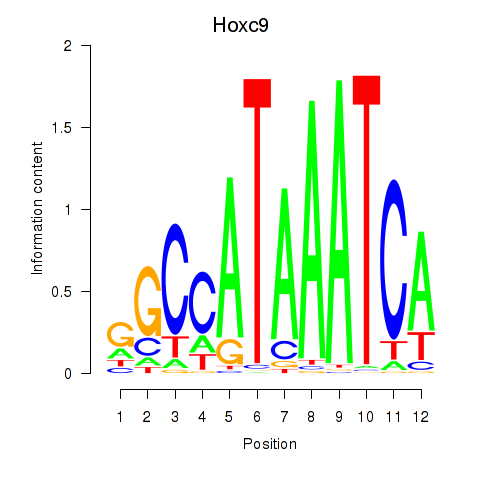
| Hoxc9 | 2.366 |
|
|
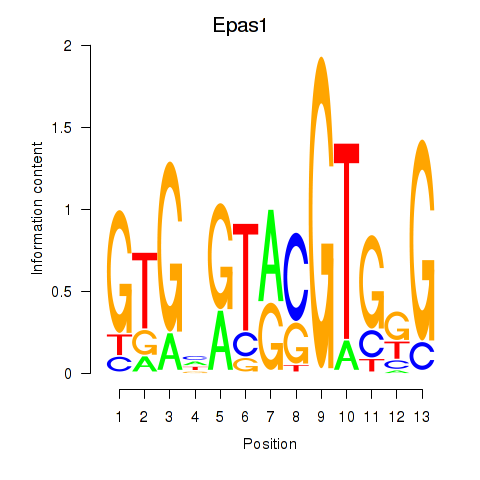
| Epas1_Bcl3 | 2.363 |
|
|
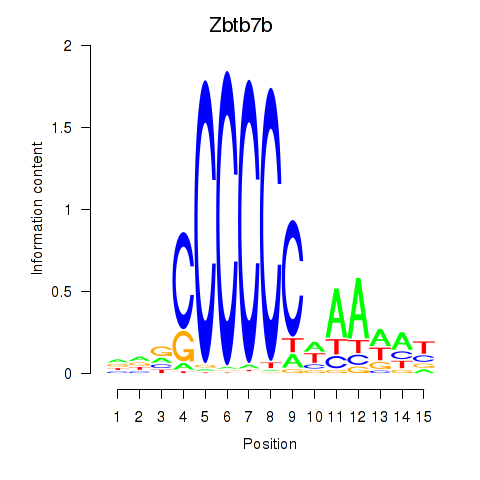
| Zbtb7b | 2.360 |
|
|
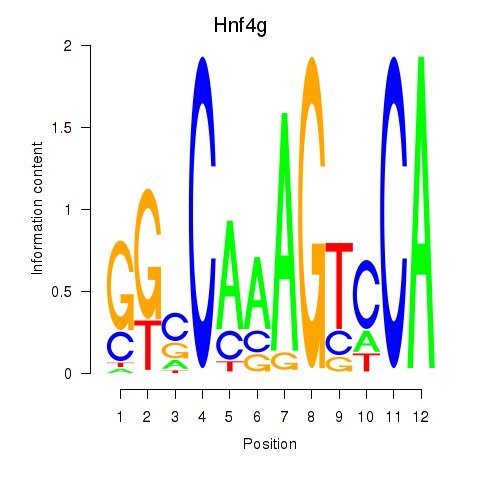
| Hnf4g | 2.352 |
|
|
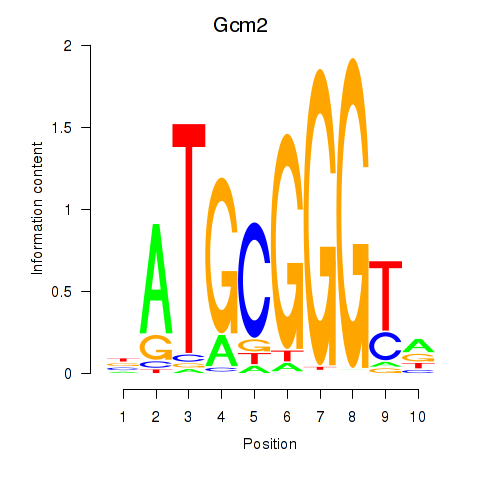
| Gcm2 | 2.325 |
|
|
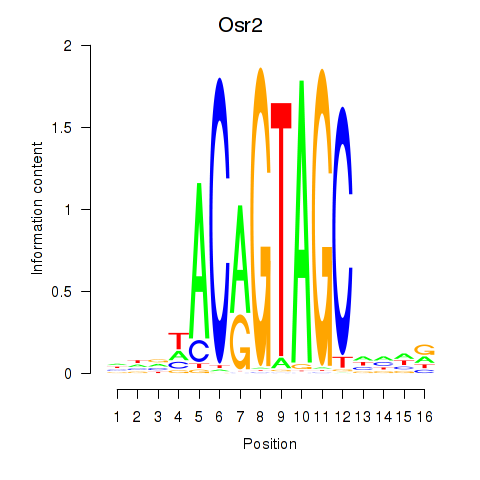
| Osr2_Osr1 | 2.285 |
|
|
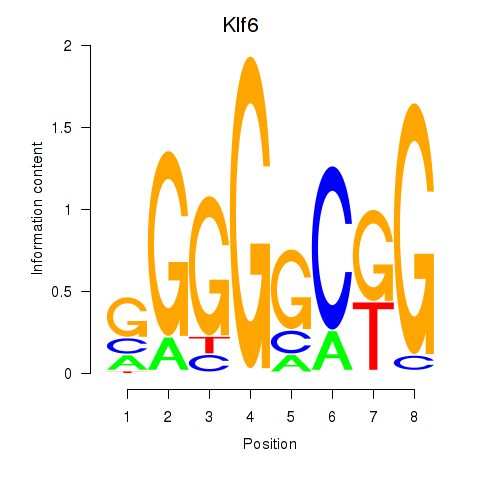
| Klf6_Patz1 | 2.284 |
|
|
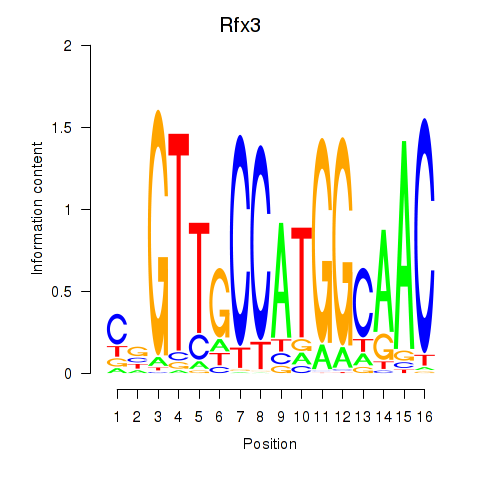
| Rfx3_Rfx1_Rfx4 | 2.218 |
|
|
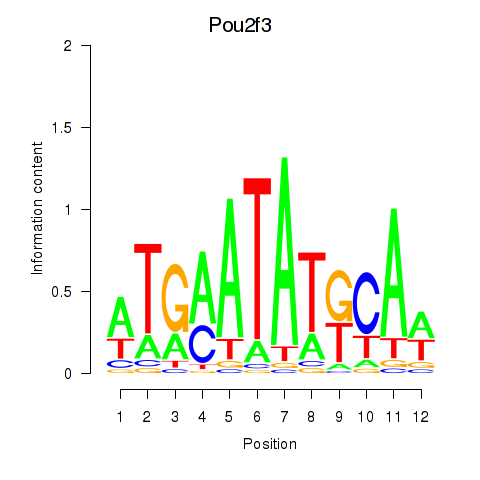
| Pou2f3 | 2.163 |
|
|
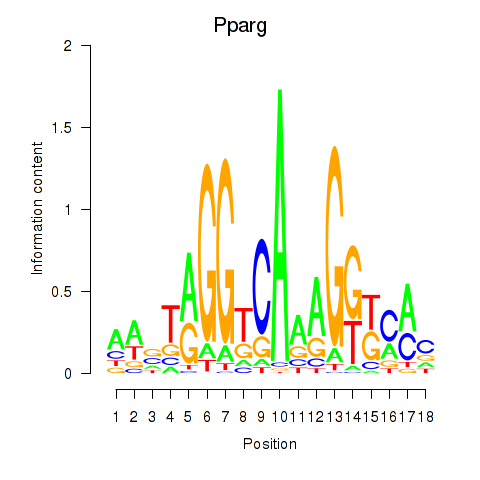
| Pparg_Rxrg | 2.159 |
|
|
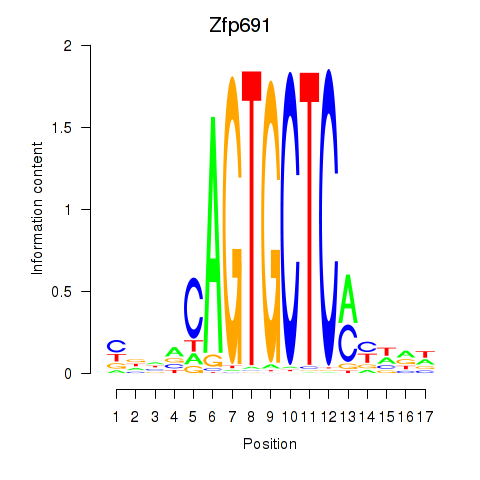
| Zfp691 | 2.066 |
|
|
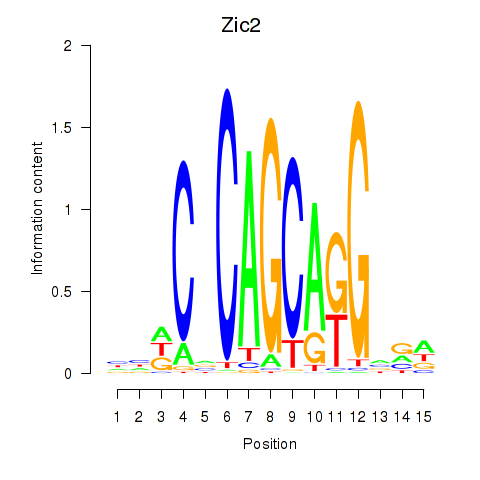
| Zic2 | 2.052 |
|
|
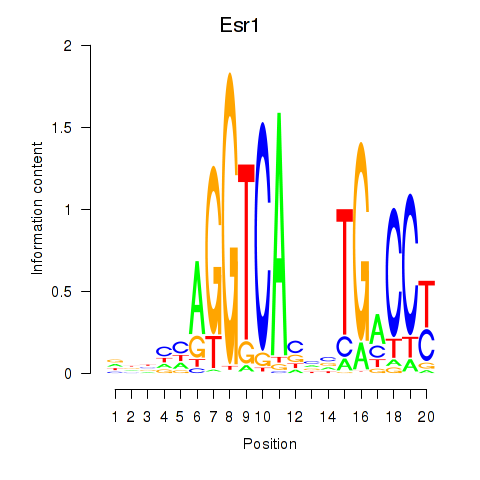
| Esr1 | 2.045 |
|
|
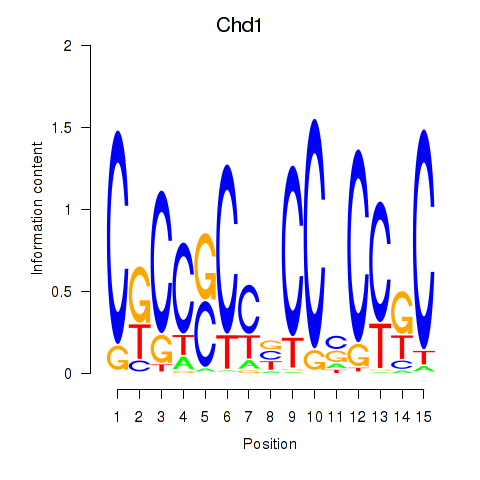
| Chd1_Pml | 2.033 |
|
|
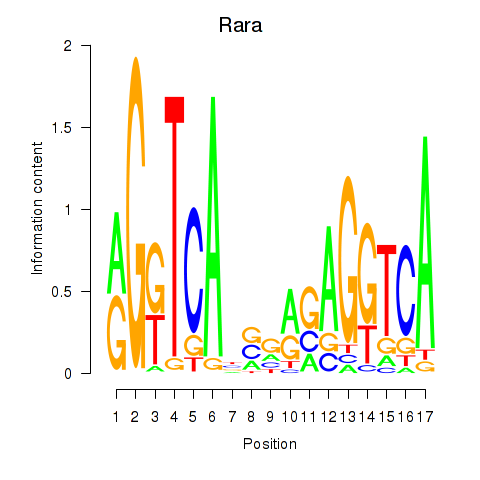
| Rara | 2.018 |
|
|
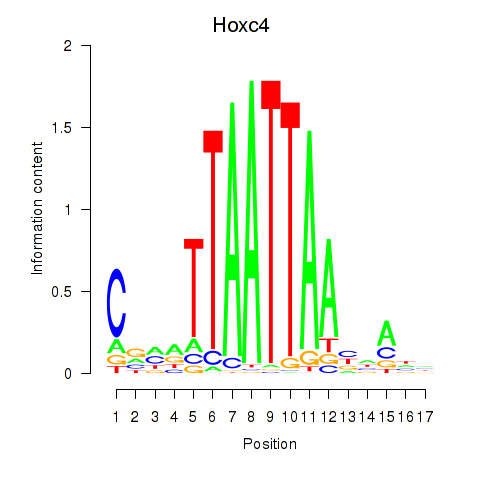
| Hoxc4_Arx_Otp_Esx1_Phox2b | 2.014 |
|
|
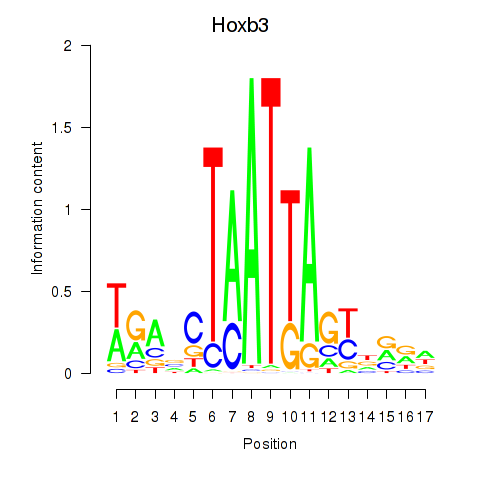
| Hoxb3 | 1.887 |
|
|
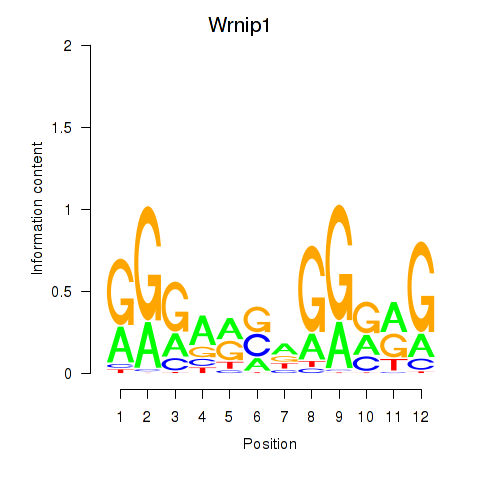
| Wrnip1_Mta3_Rcor1 | 1.818 |
|
|
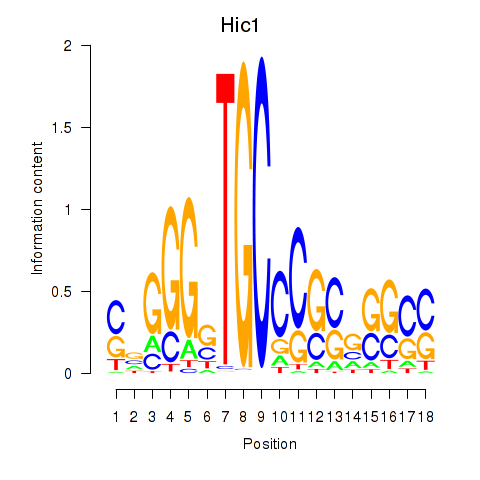
| Hic1 | 1.753 |
|
|
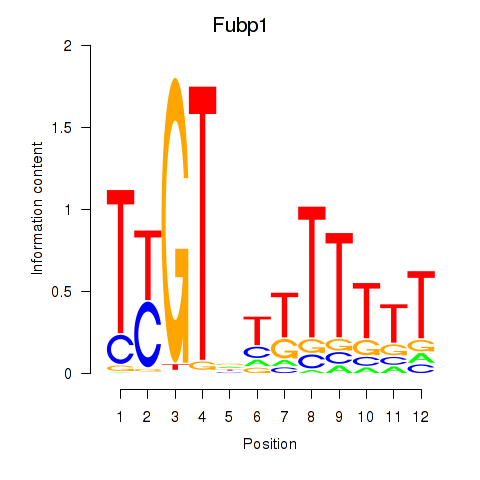
| Fubp1 | 1.742 |
|
|
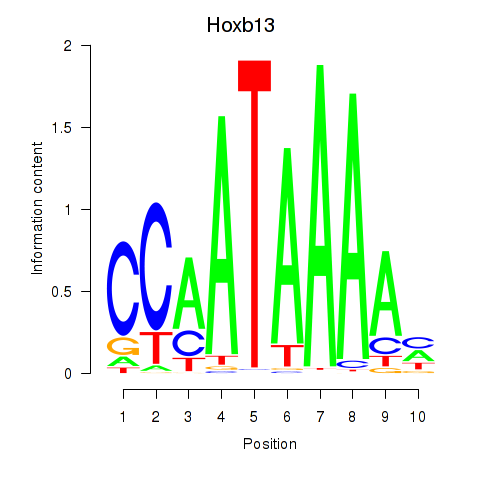
| Hoxb13 | 1.733 |
|
|
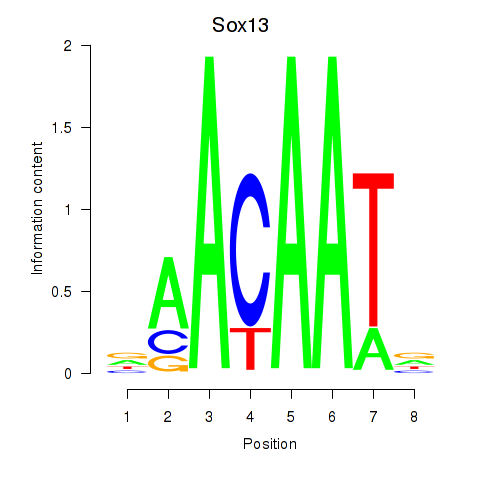
| Sox13 | 1.706 |
|
|
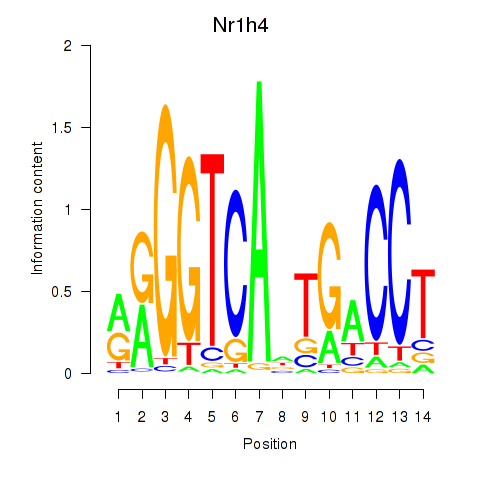
| Nr1h4 | 1.678 |
|
|
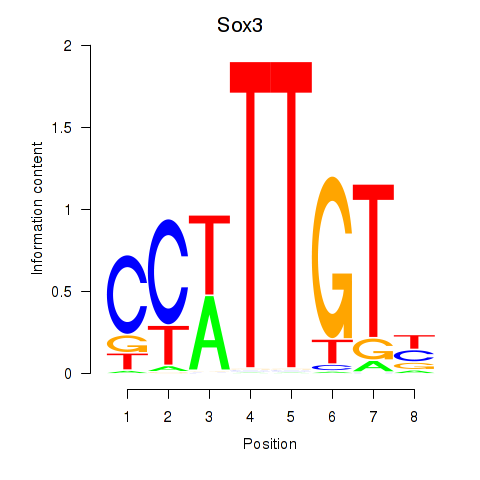
| Sox3_Sox10 | 1.672 |
|
|
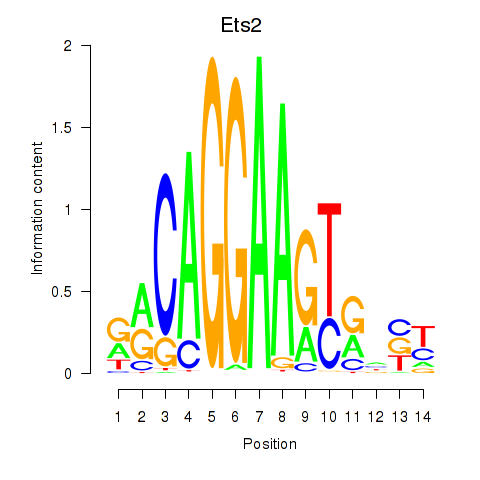
| Ets2 | 1.669 |
|
|
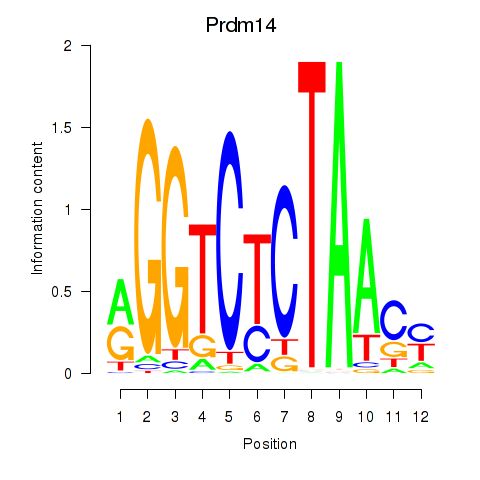
| Prdm14 | 1.630 |
|
|
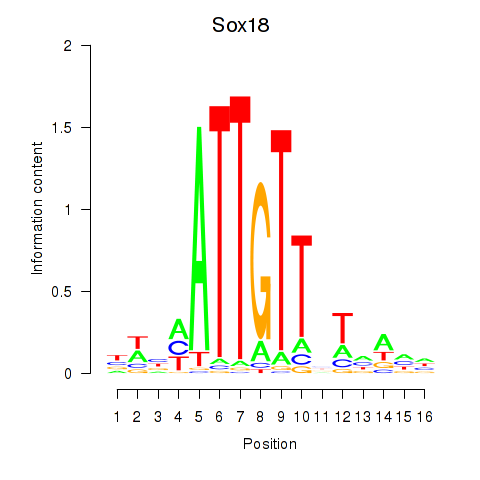
| Sox18_Sox12 | 1.621 |
|
|
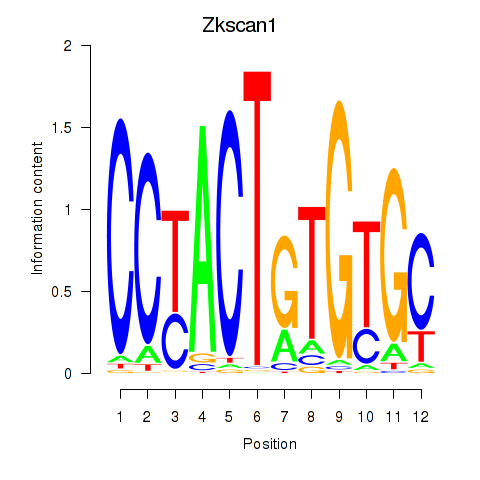
| Zkscan1 | 1.619 |
|
|
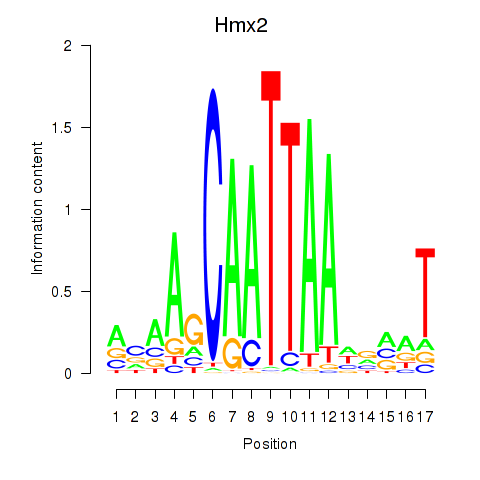
| Hmx2 | 1.485 |
|
|
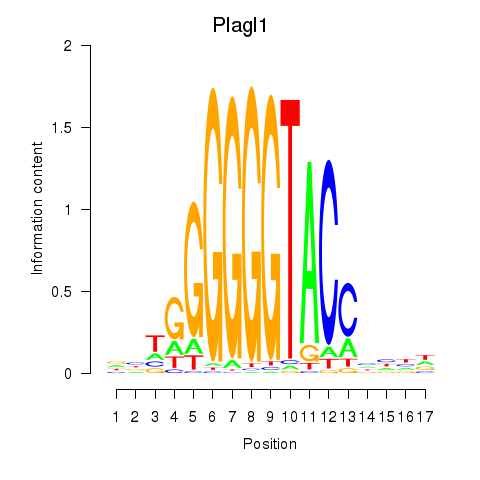
| Plagl1 | 1.464 |
|
|
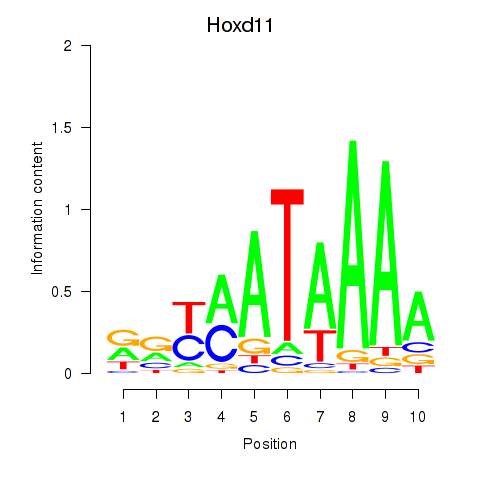
| Hoxd11_Cdx1_Hoxc11 | 1.444 |
|
|
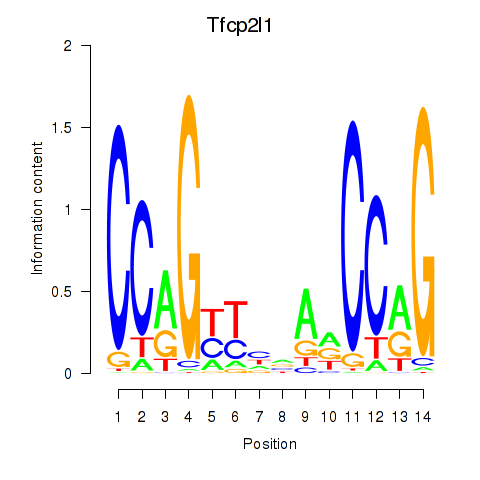
| Tfcp2l1 | 1.428 |
|
|
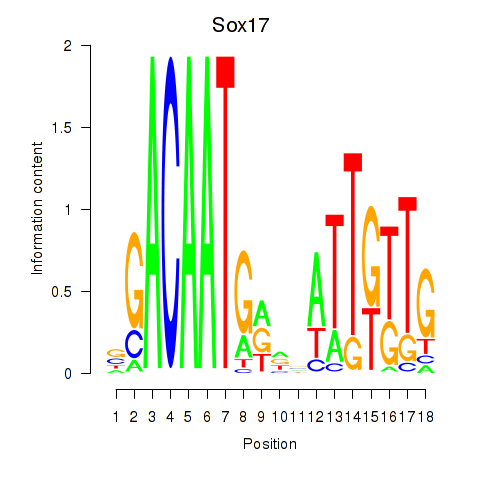
| Sox17 | 1.406 |
|
|
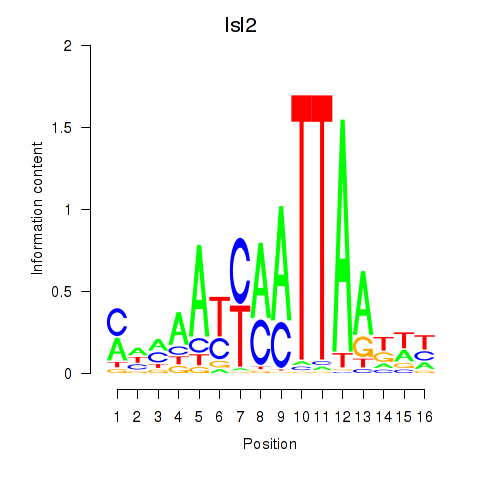
| Isl2 | 1.385 |
|
|
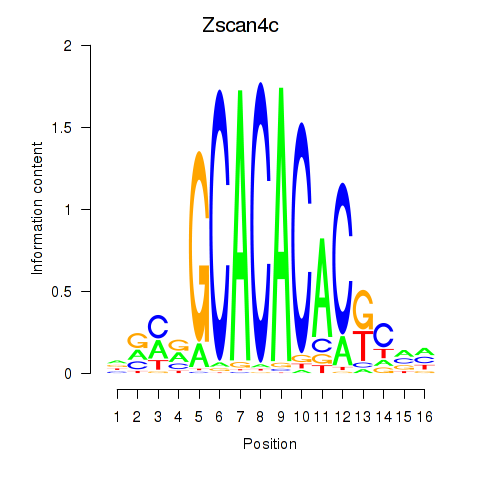
| Zscan4c | 1.371 |
|
|
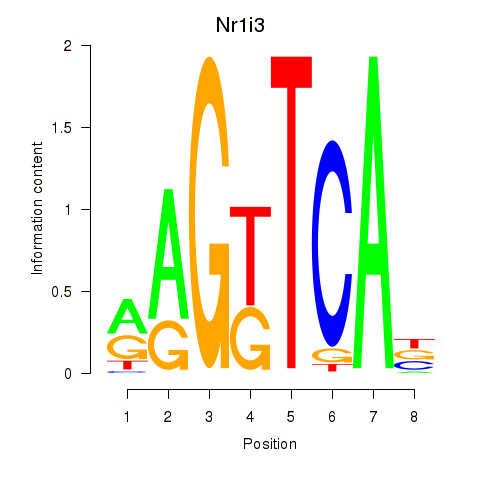
| Nr1i3 | 1.364 |
|
|
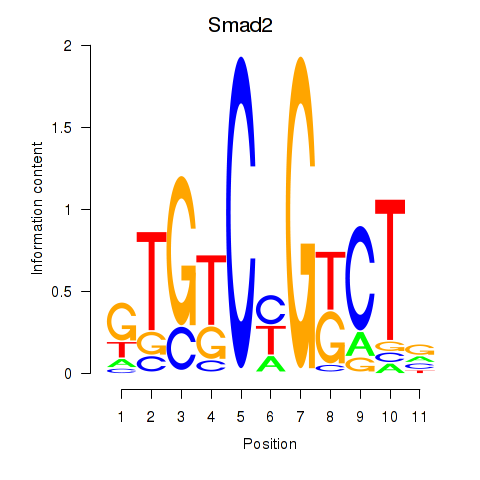
| Smad2 | 1.354 |
|
|
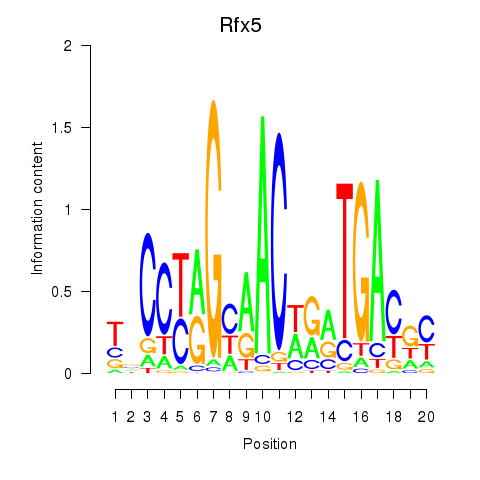
| Rfx5 | 1.311 |
|
|
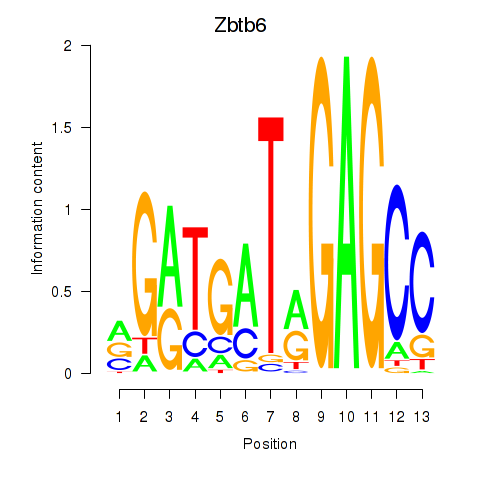
| Zbtb6 | 1.304 |
|
|
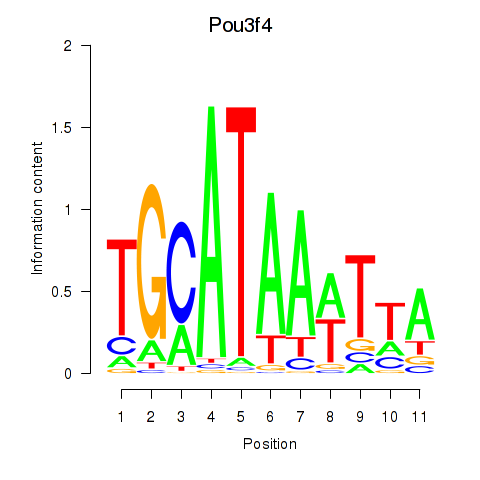
| Pou3f4 | 1.290 |
|
|
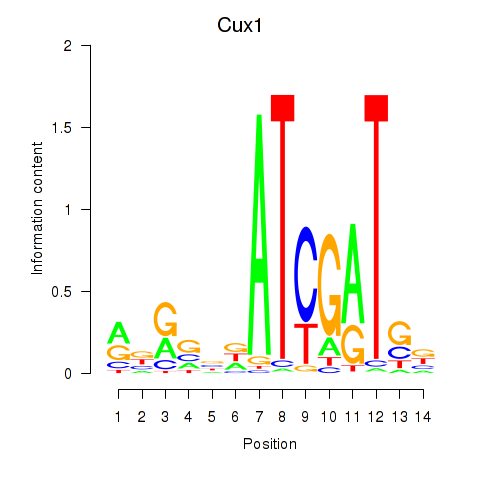
| Cux1 | 1.272 |
|
|
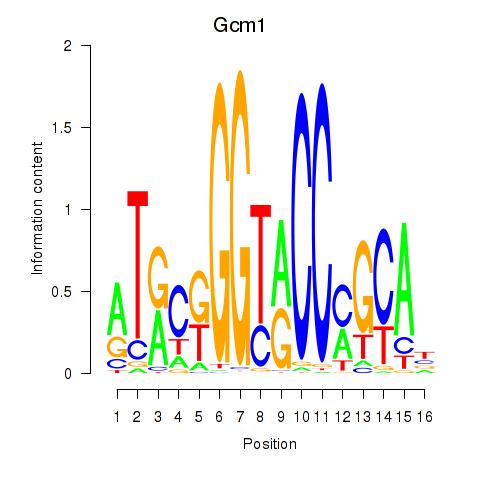
| Gcm1 | 1.268 |
|
|
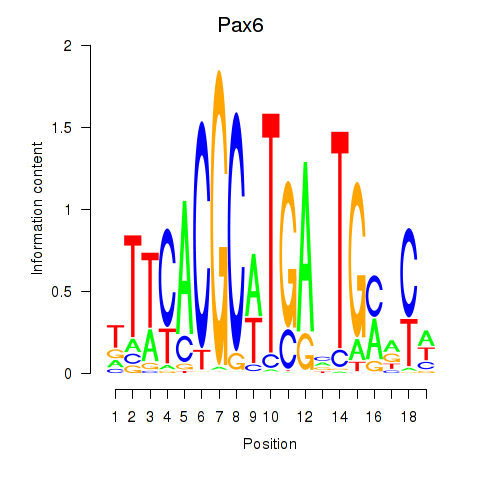
| Pax6 | 1.222 |
|
|
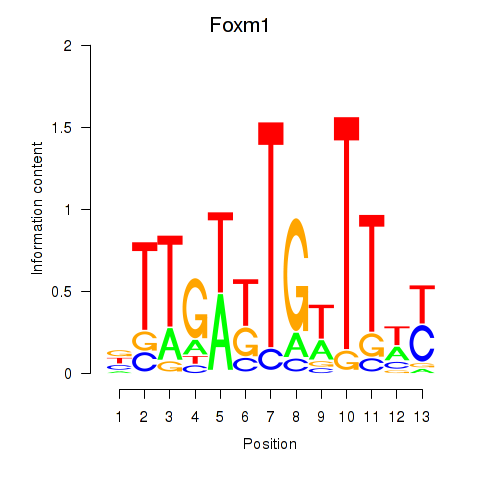
| Foxm1 | 1.210 |
|
|
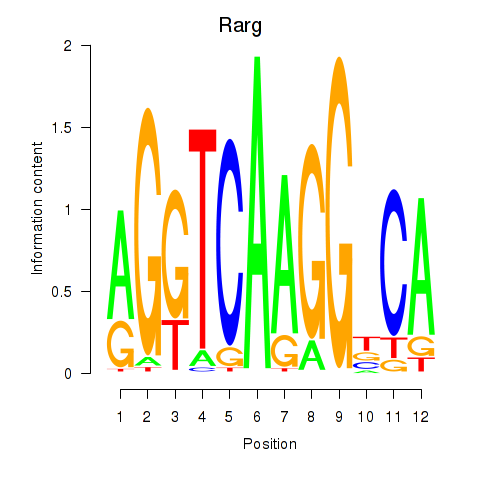
| Rarg | 1.176 |
|
|
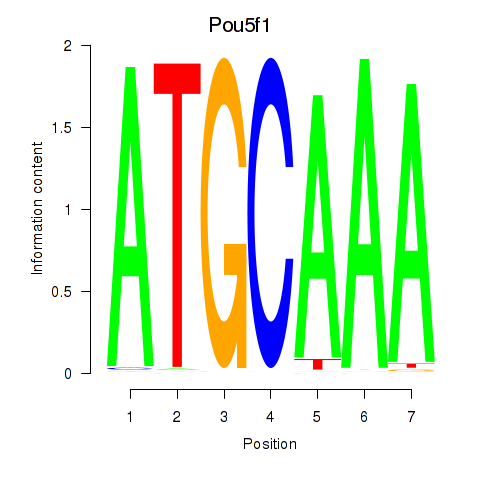
| Pou5f1 | 1.162 |
|
|
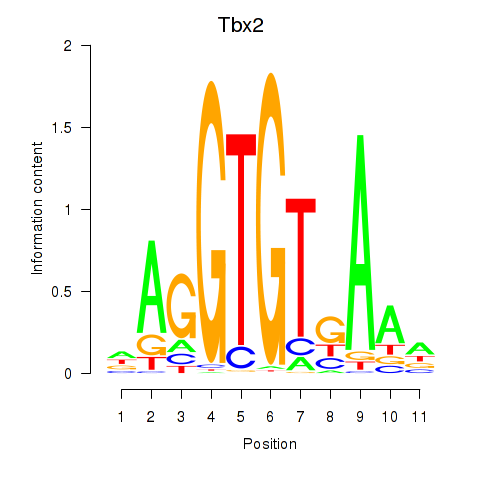
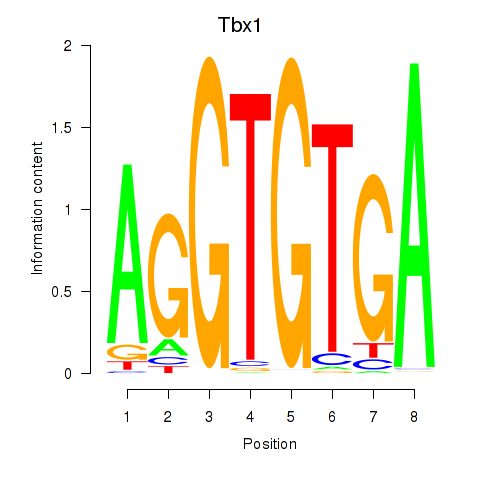
| Tbx2 | 1.159 |
|
|
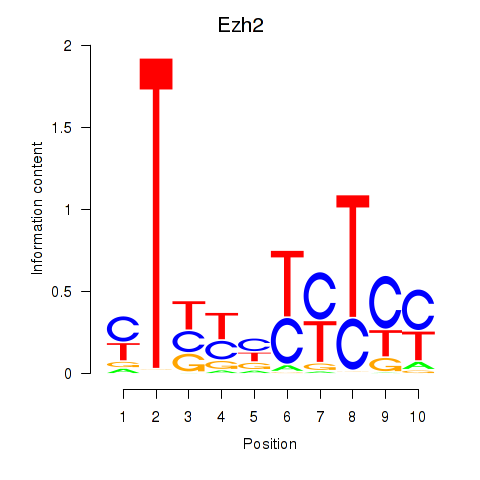
| Ezh2_Atf2_Ikzf1 | 1.154 |
|
|
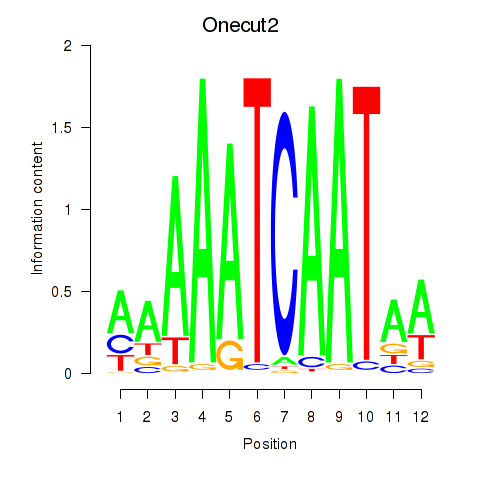
| Onecut2_Onecut3 | 1.088 |
|
|
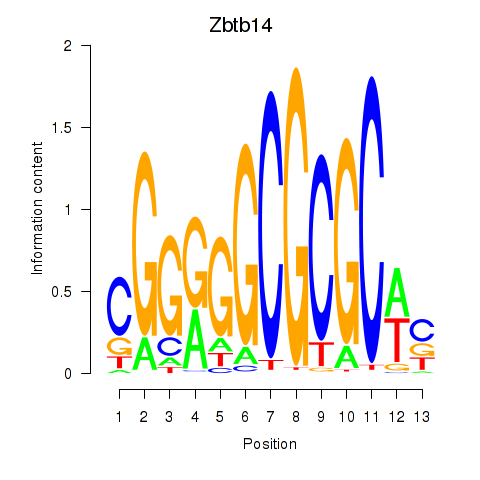
| Zbtb14 | 1.087 |
|
|
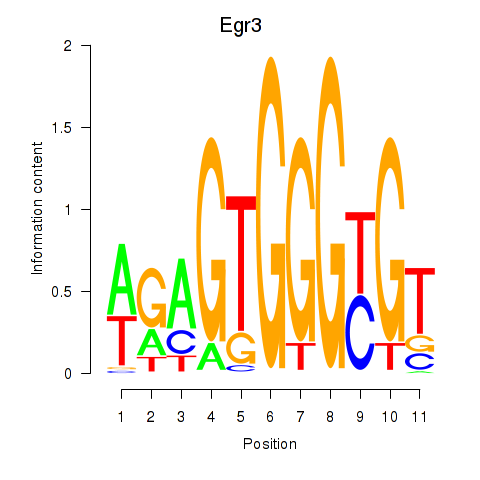
| Egr3 | 1.084 |
|
|
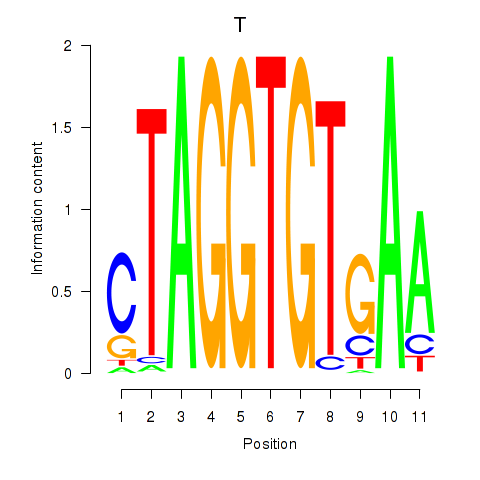
| T | 1.083 |
|
|
| Tfap2c | 1.057 |
|
|
| Tfap2b | 1.039 |
|
|
| Zfp784 | 1.027 |
|
|
| Insm1 | 1.026 |
|
|
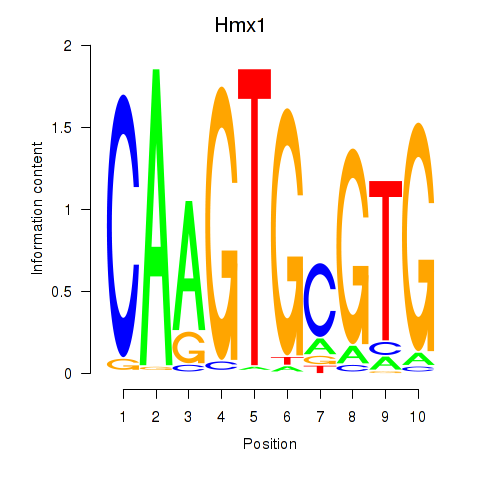
| Hmx1 | 1.014 |
|
|
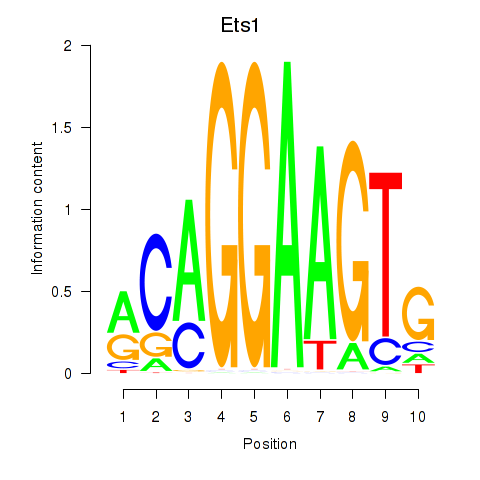
| Ets1 | 1.010 |
|
|
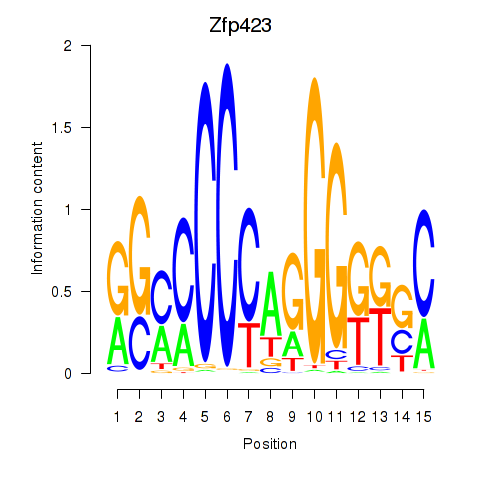
| Zfp423 | 0.989 |
|
|
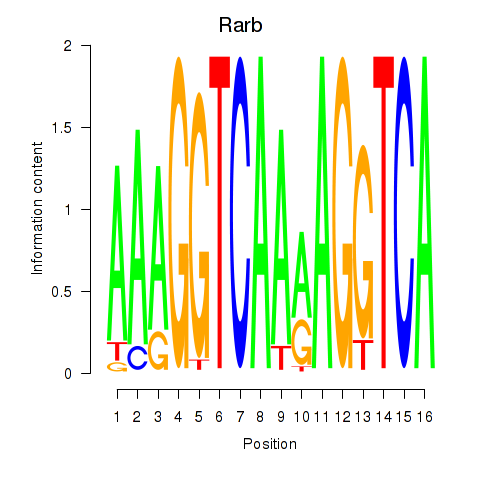
| Rarb | 0.973 |
|
|
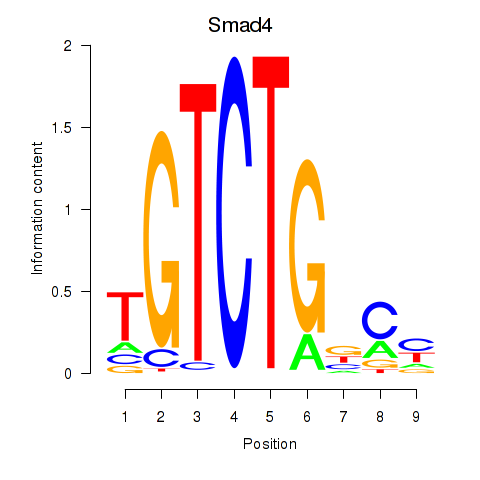
| Smad4 | 0.964 |
|
|
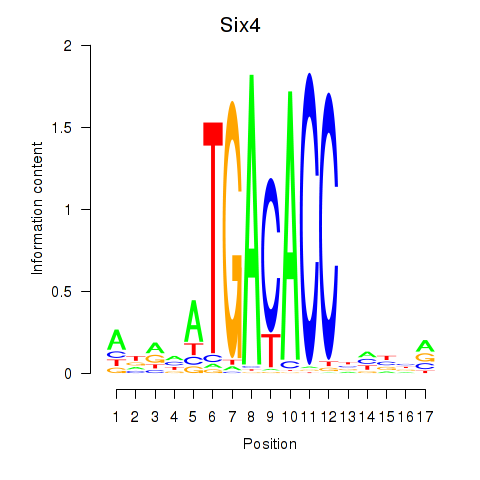
| Six4 | 0.946 |
|
|
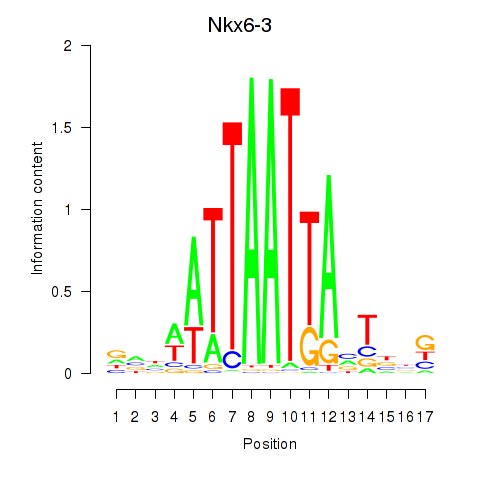
| Nkx6-3_Dbx2_Barx2 | 0.945 |
|
|
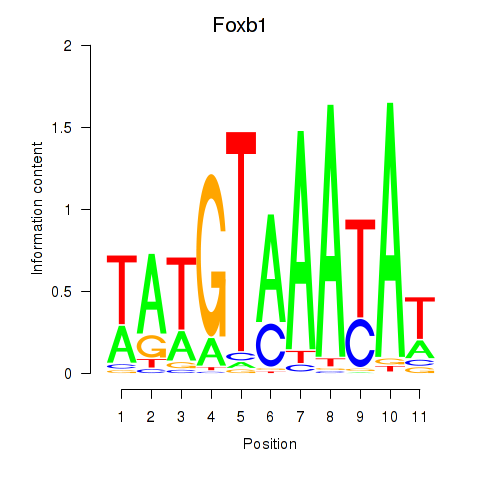
| Foxb1 | 0.936 |
|
|
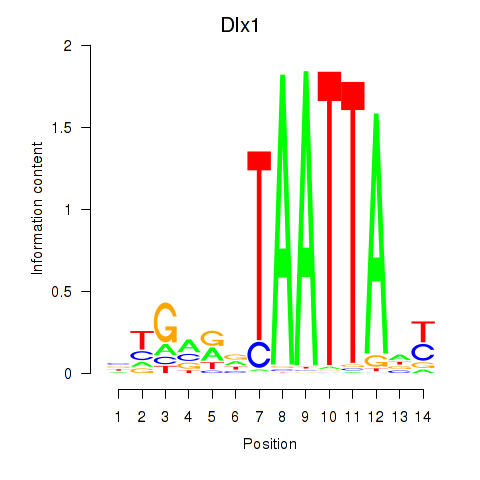
| Dlx1 | 0.927 |
|
|
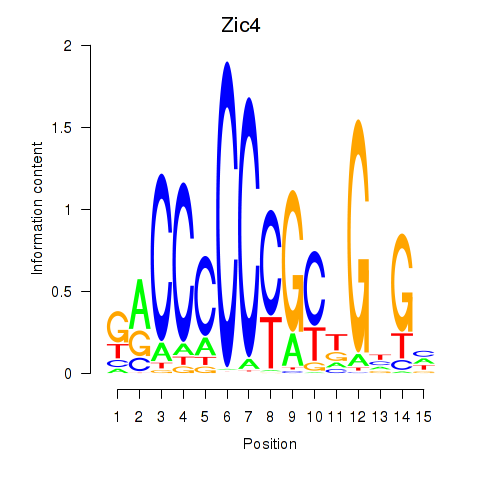
| Zic4 | 0.921 |
|
|
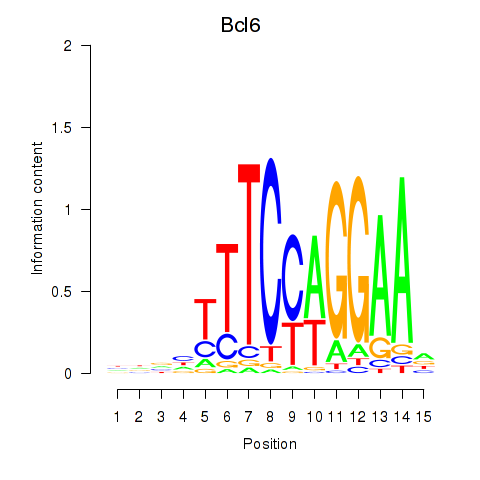
| Bcl6 | 0.921 |
|
|
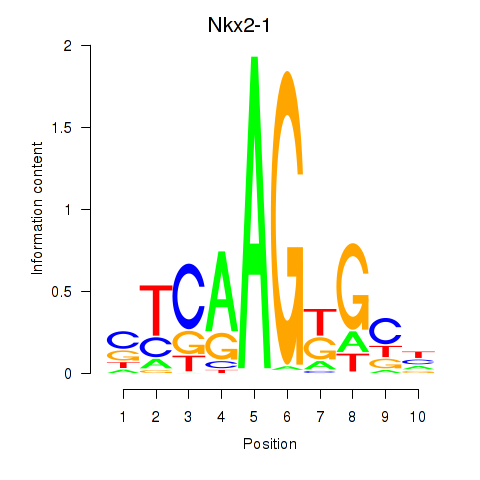
| Nkx2-1 | 0.920 |
|
|
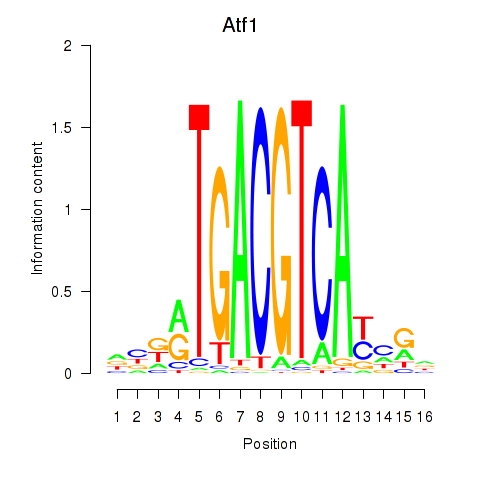
| Atf1_Creb5 | 0.911 |
|
|
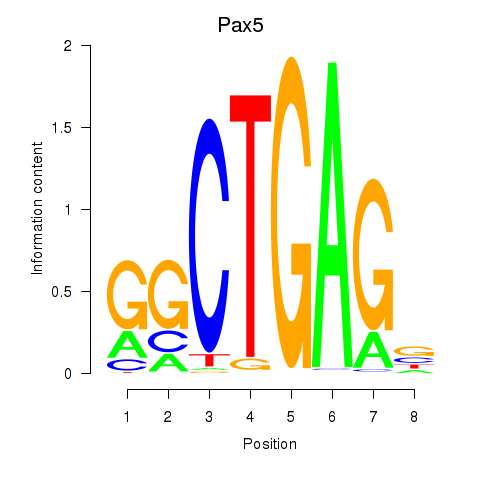
| Pax5 | 0.888 |
|
|
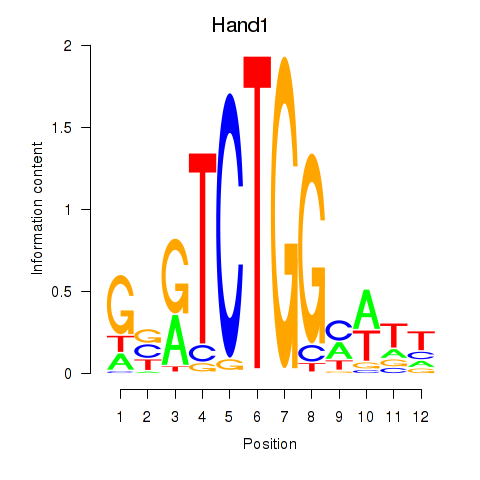
| Hand1 | 0.885 |
|
|
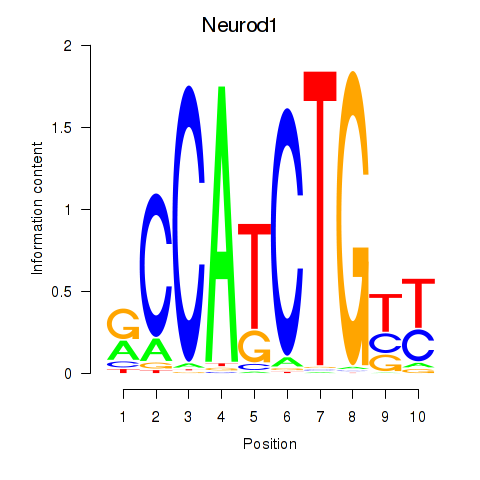
| Neurod1 | 0.883 |
|
|
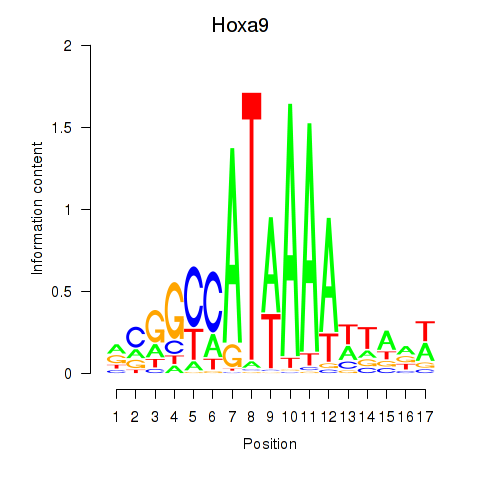
| Hoxa9_Hoxb9 | 0.877 |
|
|
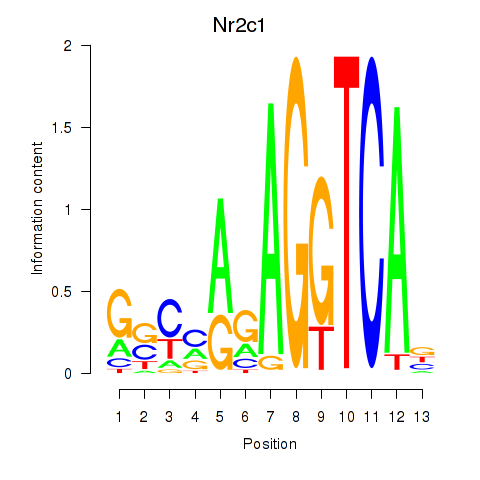
| Nr2c1 | 0.876 |
|
|
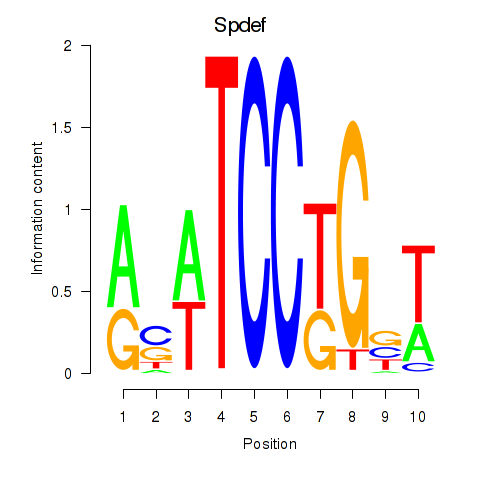
| Spdef | 0.873 |
|
|
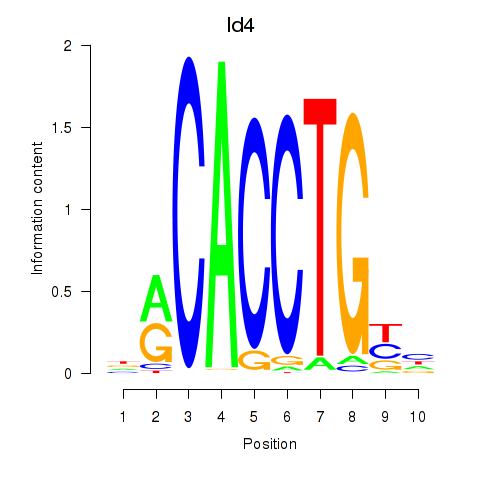
| Id4 | 0.865 |
|
|
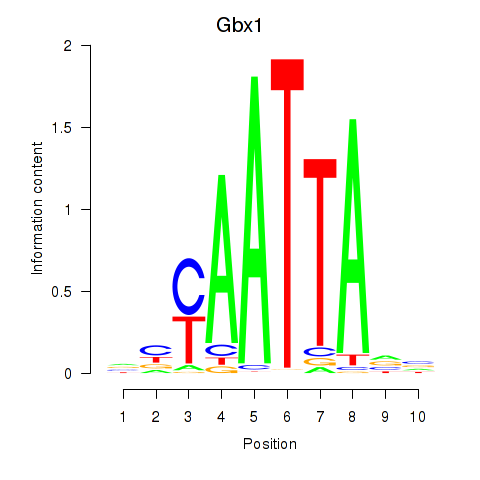
| Gbx1_Nobox_Alx3 | 0.859 |
|
|
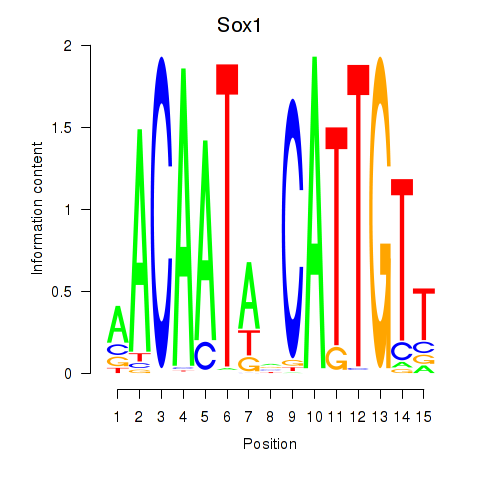
| Sox1 | 0.858 |
|
|
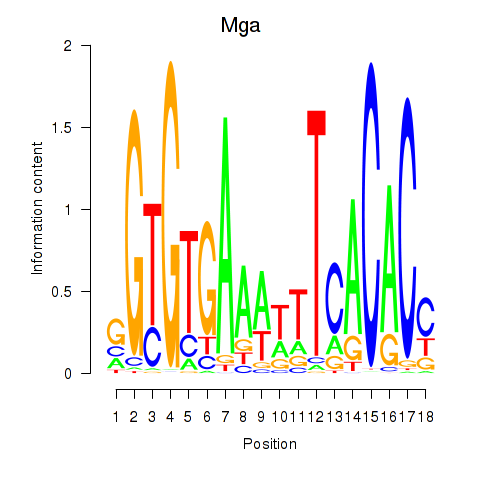
| Mga | 0.840 |
|
|
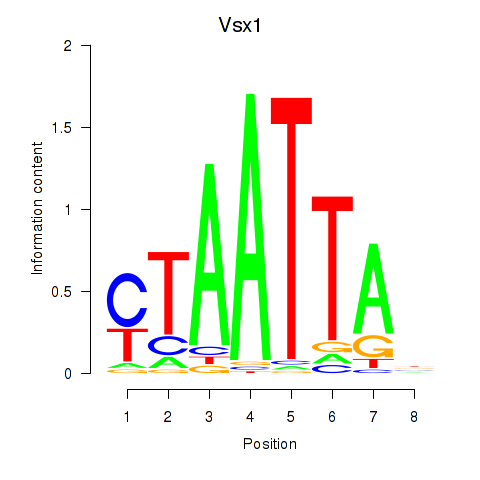
| Vsx1_Uncx_Prrx2_Shox2_Noto | 0.833 |
|
|
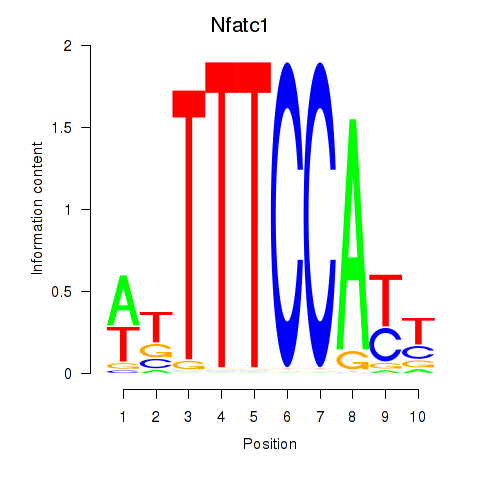
| Nfatc1 | 0.822 |
|
|
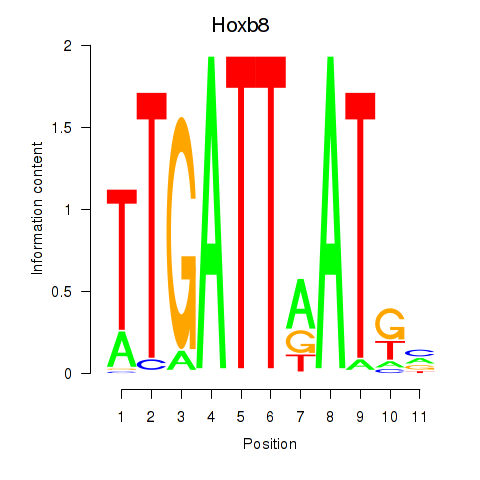
| Hoxb8_Pdx1 | 0.779 |
|
|
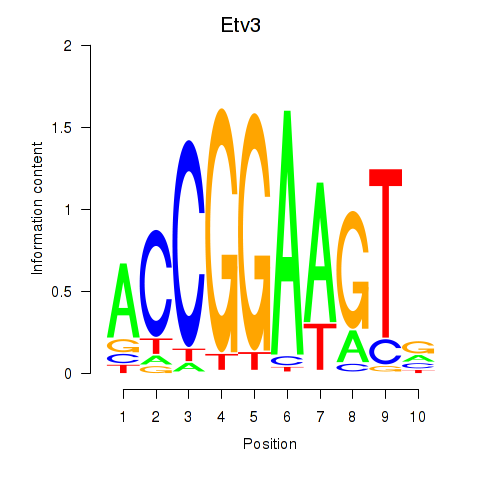
| Etv3_Erf_Fev_Elk4_Elk1_Elk3 | 0.772 |
|
|
| Zfp282 | 0.762 |
|

|
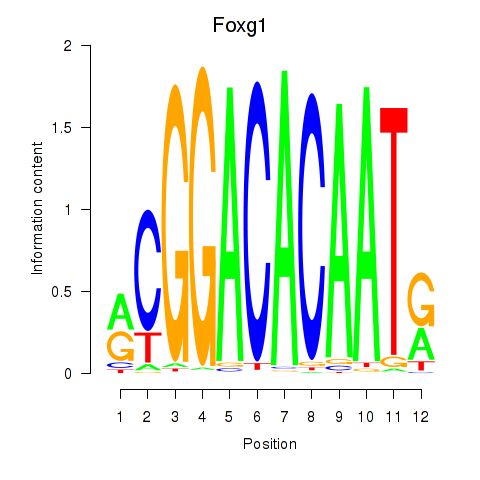
| Foxg1 | 0.754 |
|
|
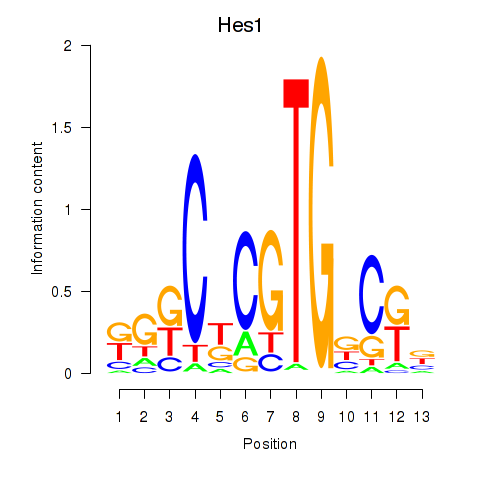
| Hes1 | 0.729 |
|
|
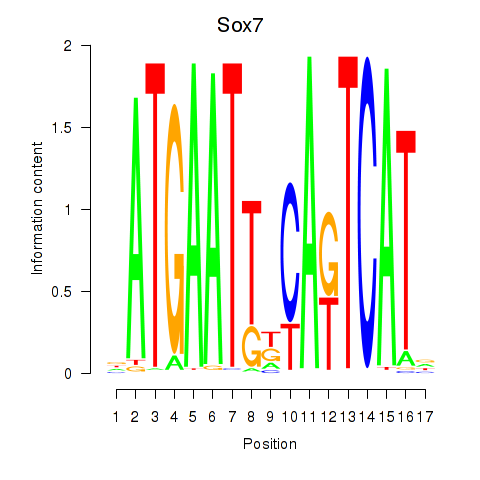
| Sox7 | 0.729 |
|
|
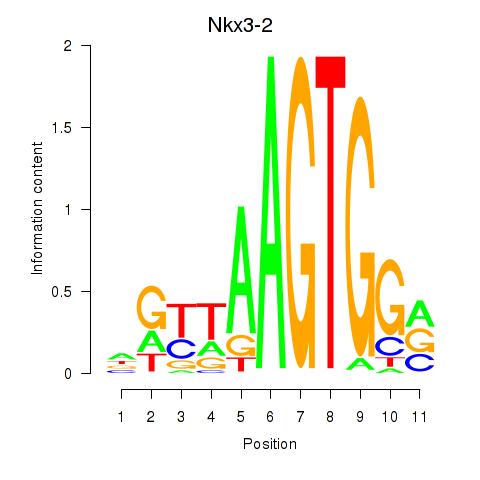
| Nkx3-2 | 0.723 |
|
|
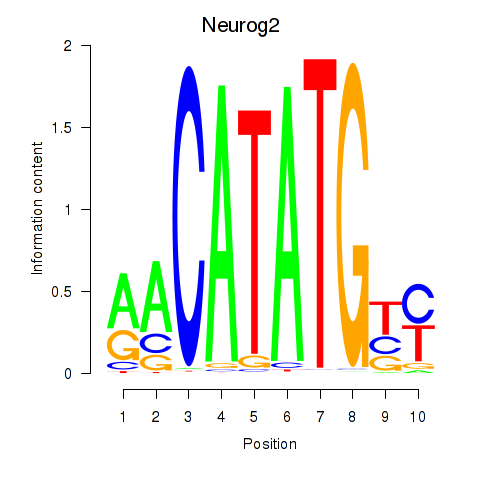
| Neurog2 | 0.714 |
|
|
| Foxd3 | 0.702 |
|
|
| Arid5b | 0.678 |
|
|
| En1 | 0.673 |
|
|
| Hoxc10 | 0.668 |
|

|
| Foxo6 | 0.649 |
|

|
| Tfap2d | 0.635 |
|
|
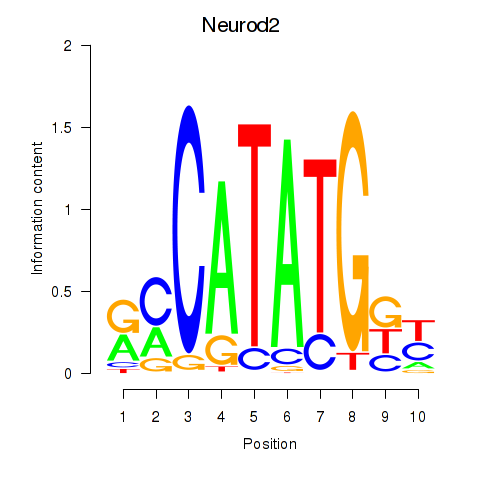
| Neurod2_Bhlha15_Bhlhe22_Olig1 | 0.635 |
|
|
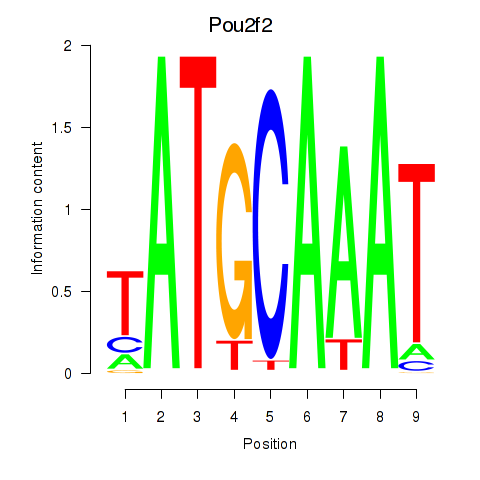
| Pou2f2_Pou3f1 | 0.610 |
|
|
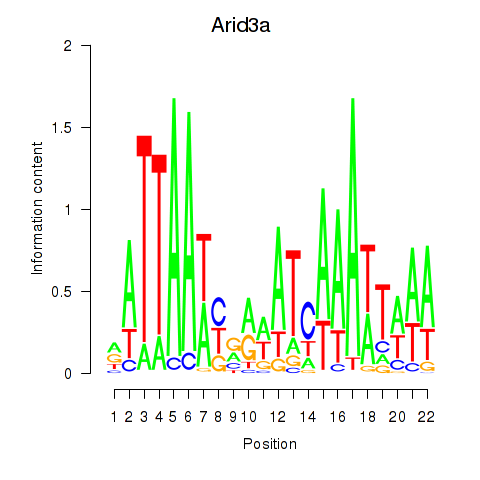
| Arid3a | 0.605 |
|
|
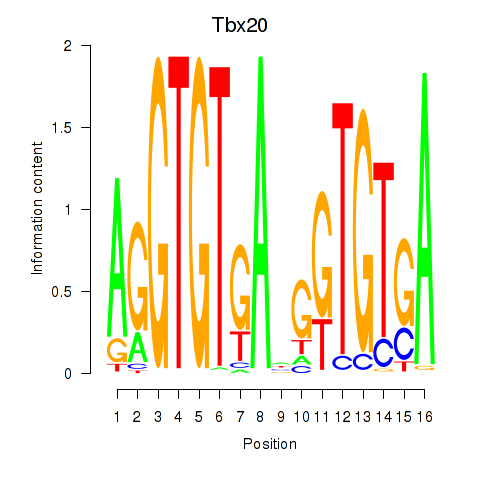
| Tbx20 | 0.604 |
|
|
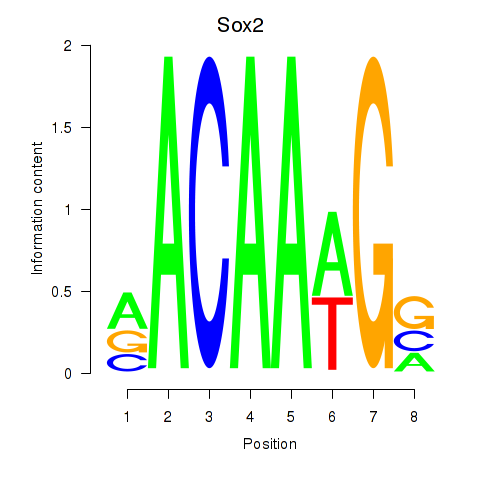
| Sox2 | 0.601 |
|
|
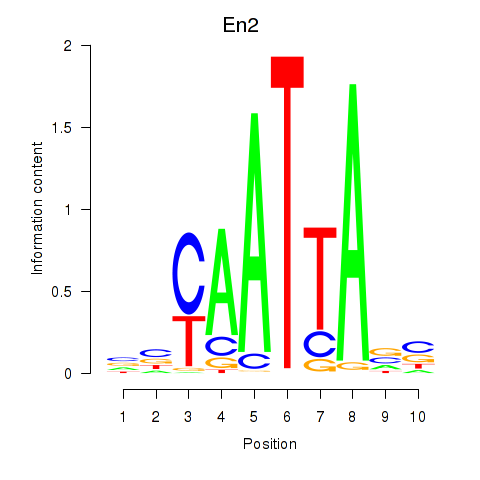
| En2 | 0.597 |
|
|
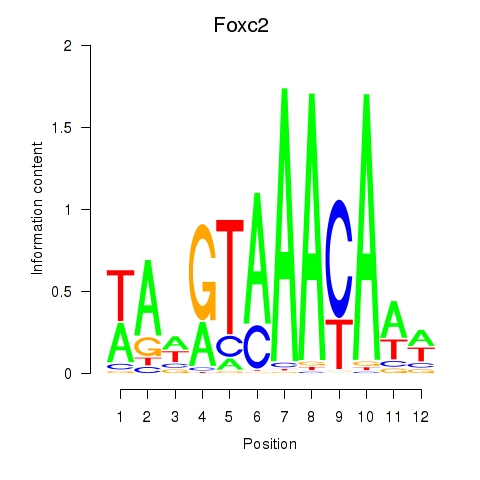
| Foxc2 | 0.587 |
|
|
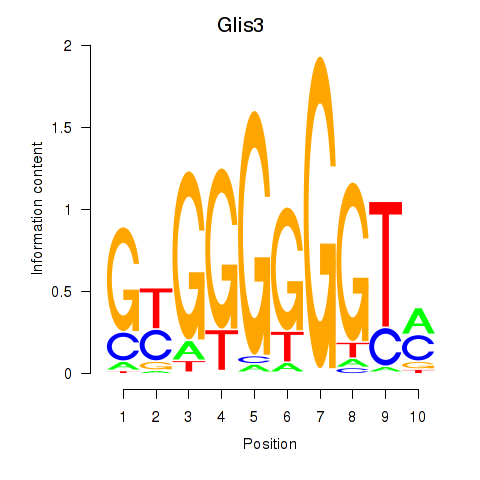
| Glis3 | 0.584 |
|
|
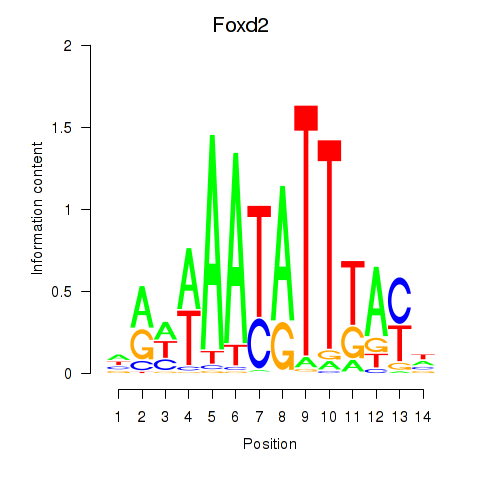
| Foxd2 | 0.580 |
|
|
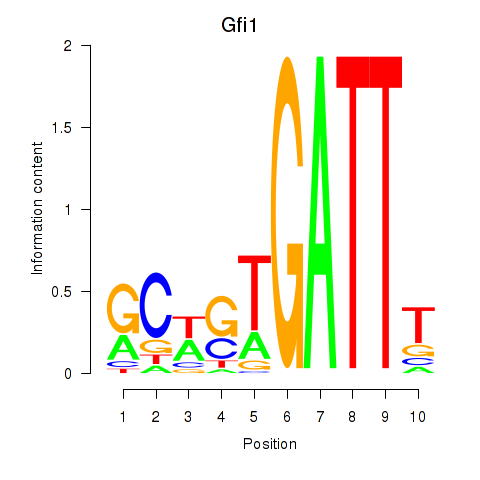
| Gfi1_Gfi1b | 0.573 |
|
|
| Hlx | 0.569 |
|

|
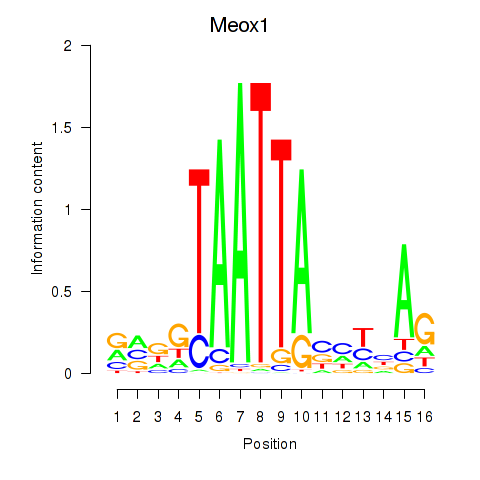
| Meox1 | 0.563 |
|
|
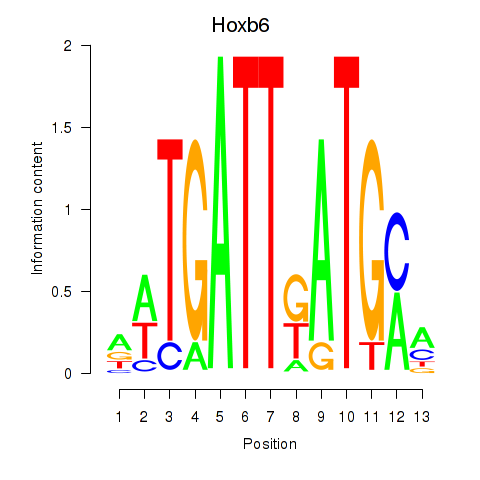
| Hoxb6 | 0.562 |
|
|
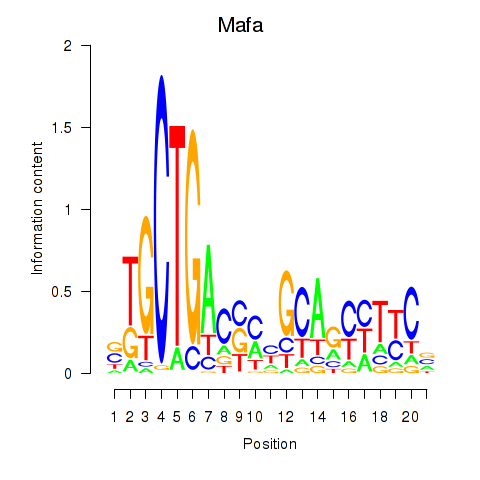
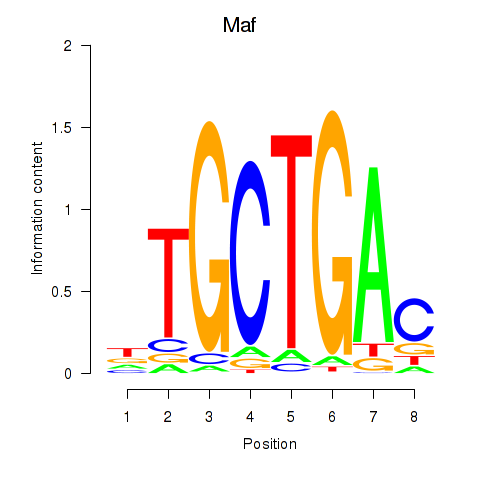
| Mafa | 0.537 |
|
|
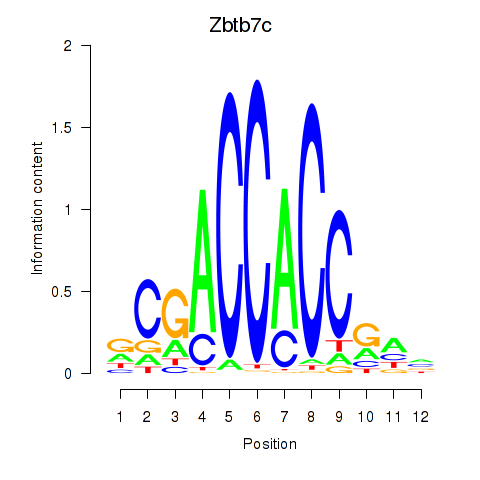
| Zbtb7c | 0.535 |
|
|
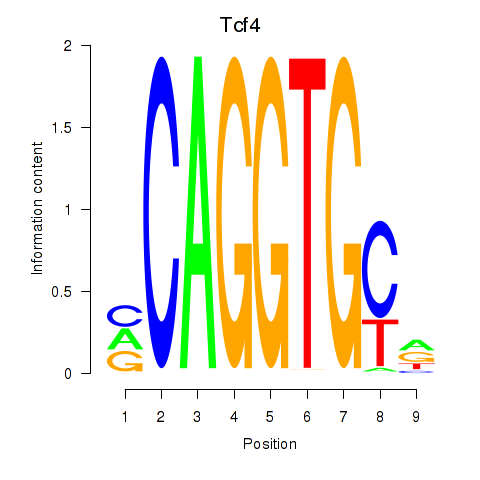
| Tcf4_Mesp1 | 0.528 |
|
|
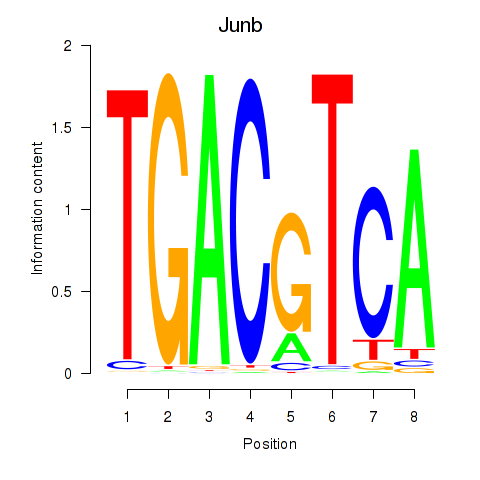
| Junb_Jund | 0.510 |
|
|
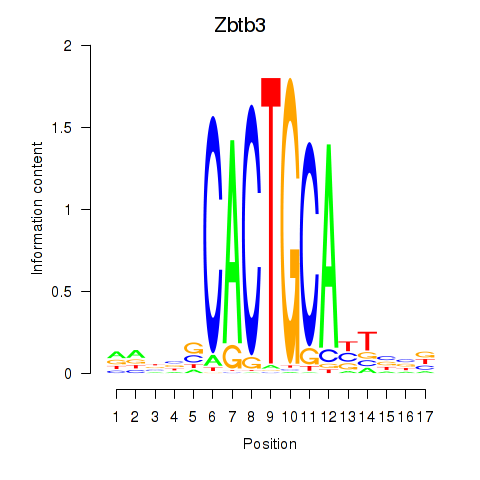
| Zbtb3 | 0.485 |
|
|
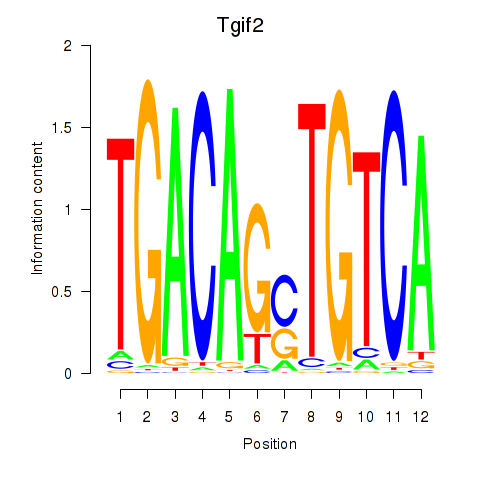
| Tgif2_Tgif2lx1_Tgif2lx2 | 0.482 |
|
|
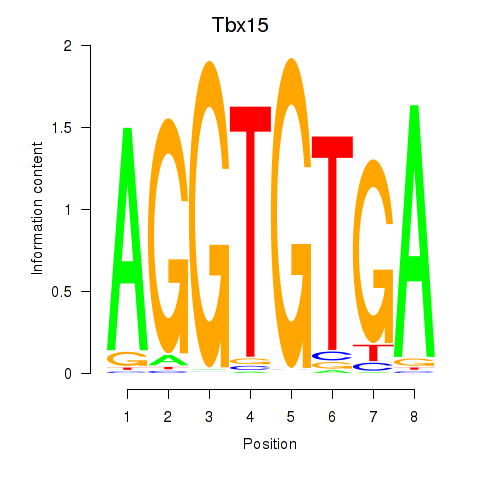
| Tbx15 | 0.480 |
|
|
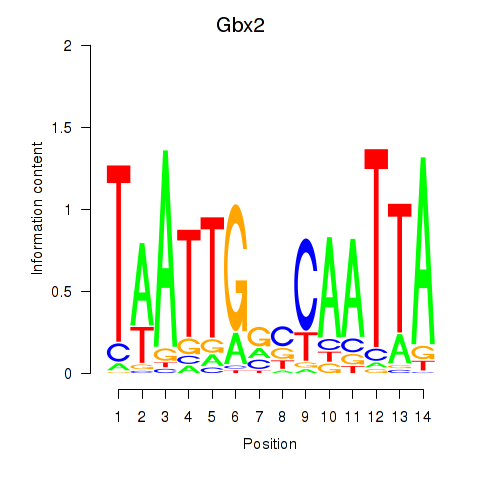
| Gbx2 | 0.477 |
|
|
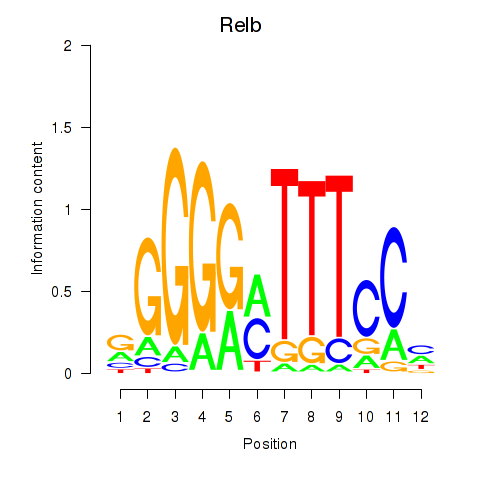
| Relb | 0.475 |
|
|
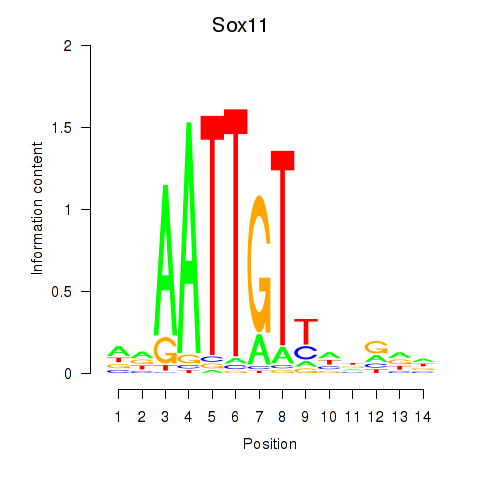
| Sox11 | 0.472 |
|
|
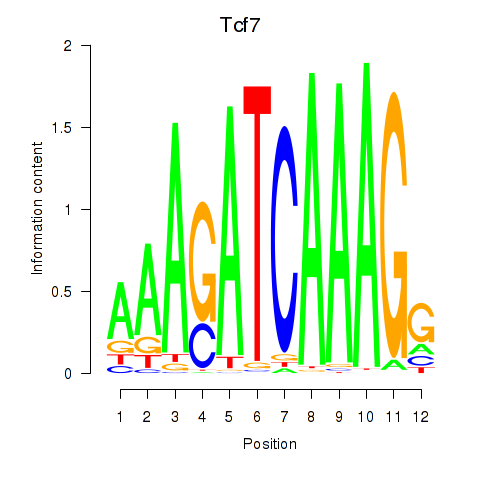
| Tcf7_Tcf7l2 | 0.471 |
|
|
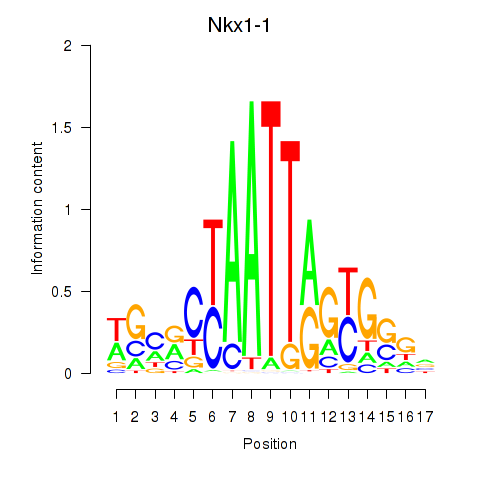
| Nkx1-1_Nkx1-2 | 0.469 |
|
|
| Gli1 | 0.460 |
|
|
| Tbx21 | 0.459 |
|

|
| Foxf2 | 0.459 |
|
|
| Foxq1 | 0.458 |
|
|
| Hoxb5 | 0.444 |
|
|
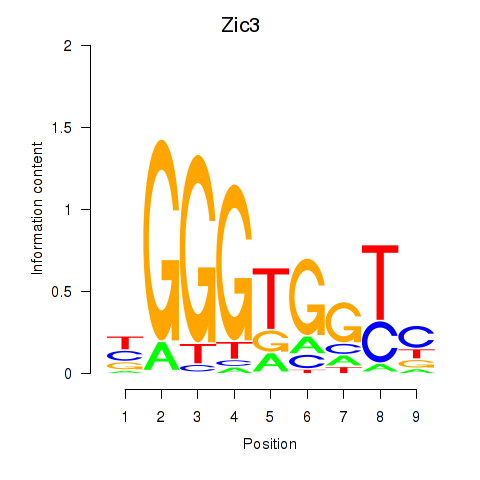
| Zic3 | 0.426 |
|
|
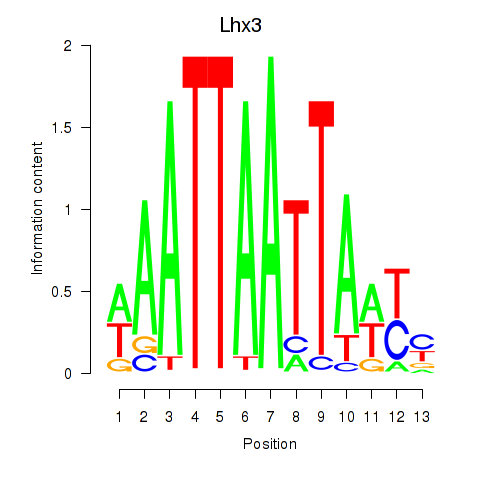
| Lhx3 | 0.423 |
|
|
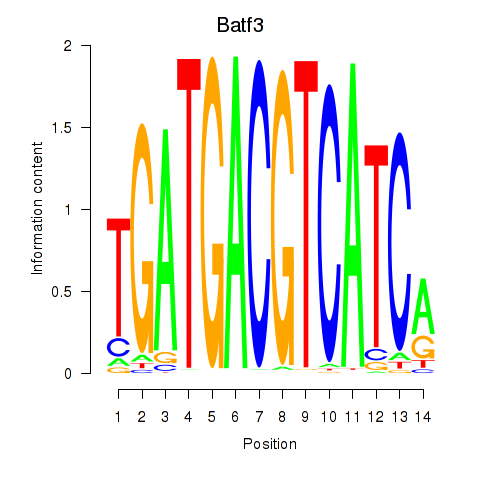
| Batf3 | 0.420 |
|
|
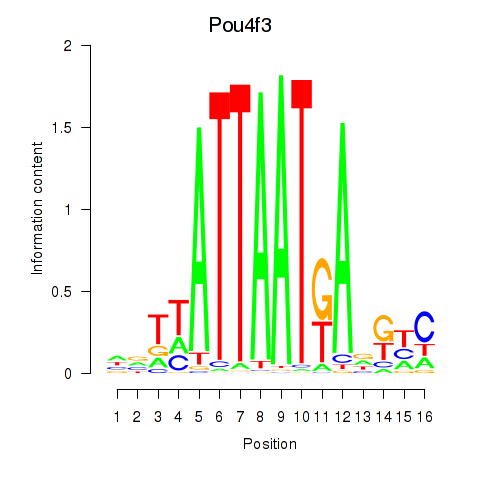
| Pou4f3 | 0.416 |
|
|
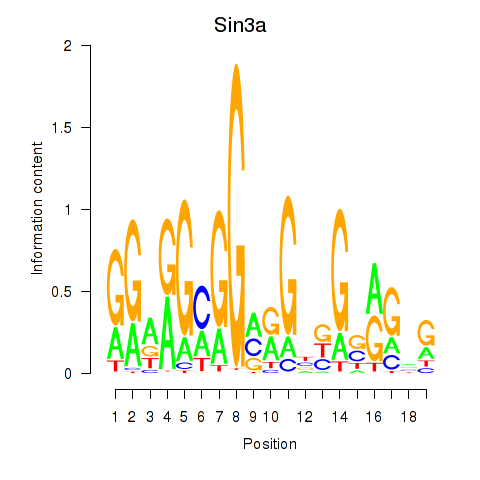
| Sin3a | 0.412 |
|
|
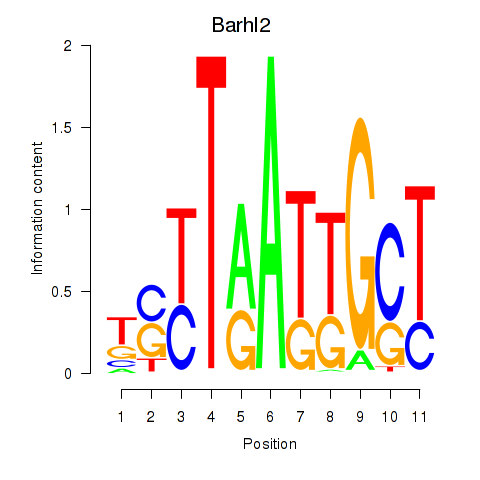
| Barhl2 | 0.389 |
|
|
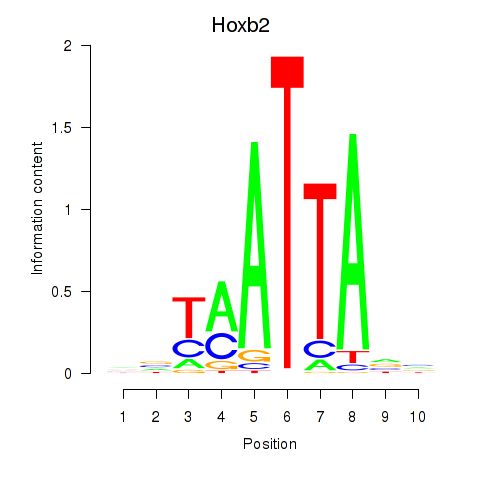
| Hoxb2_Dlx2 | 0.369 |
|
|
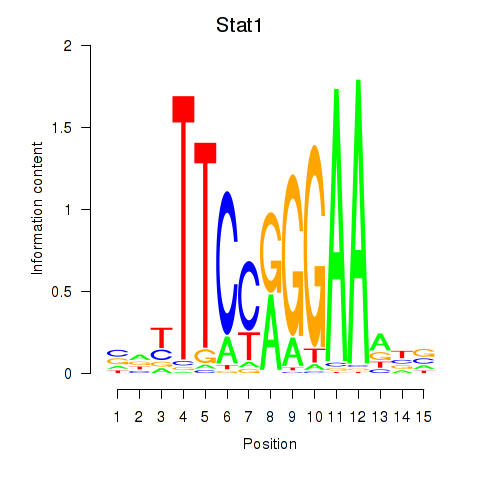
| Stat1 | 0.353 |
|
|
| Meox2 | 0.352 |
|
|
| Nfe2l2 | 0.346 |
|
|
| Hey2 | 0.340 |
|
|
| Sox8 | 0.336 |
|
|
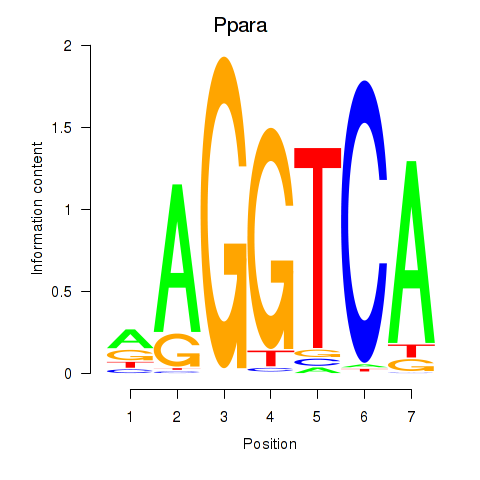
| Ppara | 0.322 |
|
|
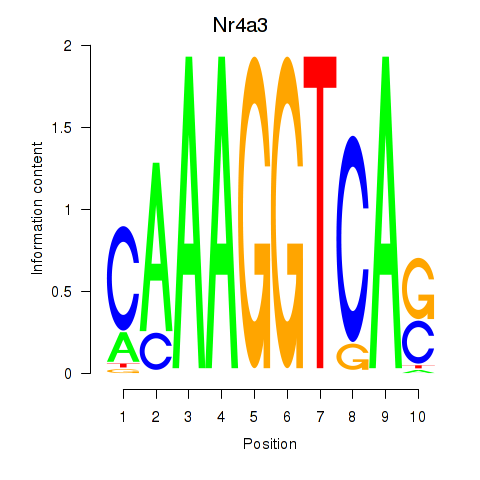
| Nr4a3 | 0.315 |
|
|
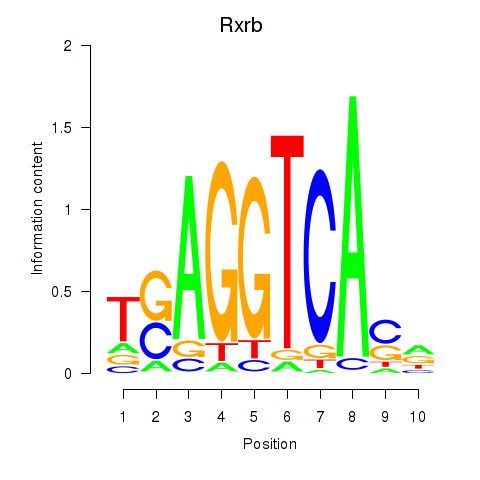
| Rxrb | 0.315 |
|
|
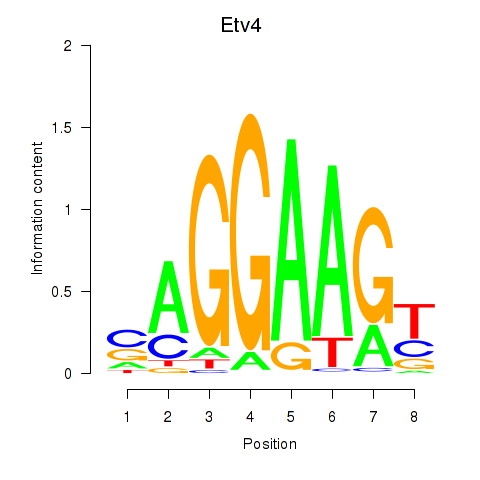
| Etv4 | 0.311 |
|
|
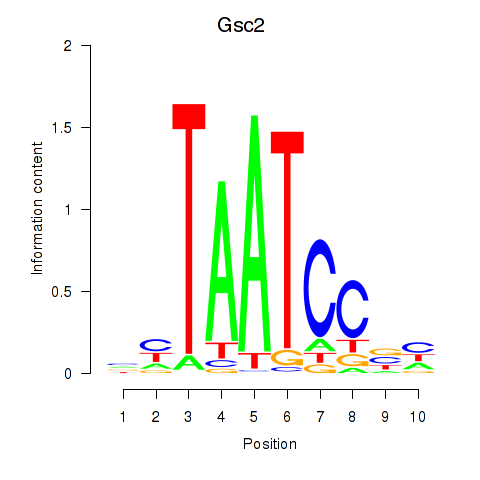
| Gsc2_Dmbx1 | 0.310 |
|
|
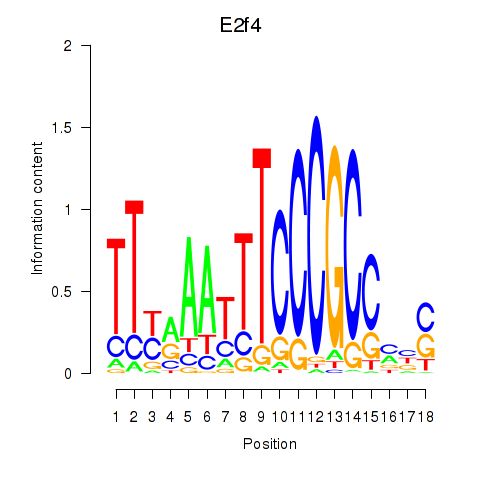
| E2f4 | 0.310 |
|
|
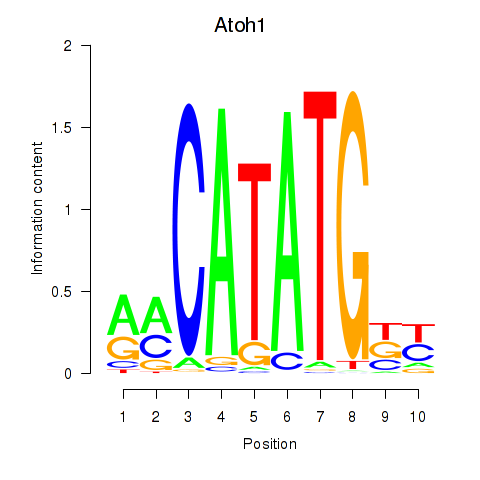
| Atoh1_Bhlhe23 | 0.308 |
|
|
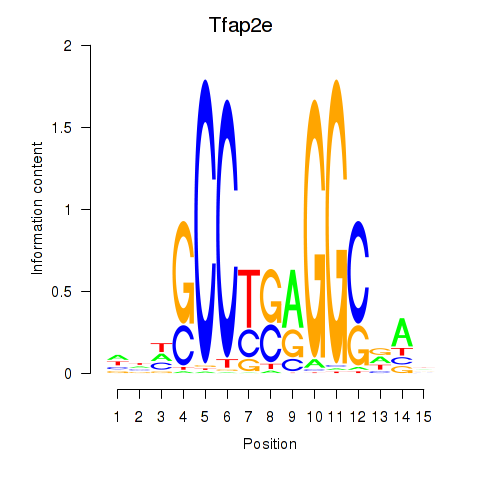
| Tfap2e | 0.303 |
|
|
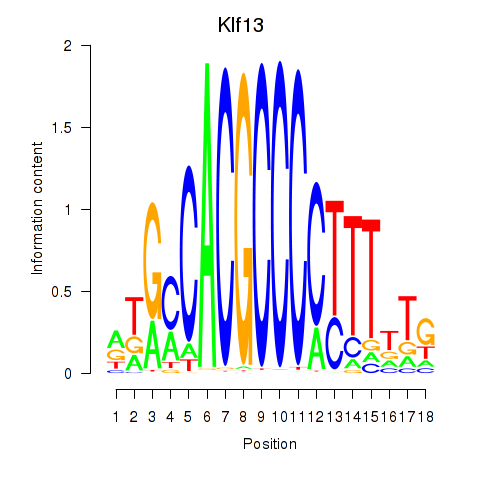
| Klf13 | 0.298 |
|
|
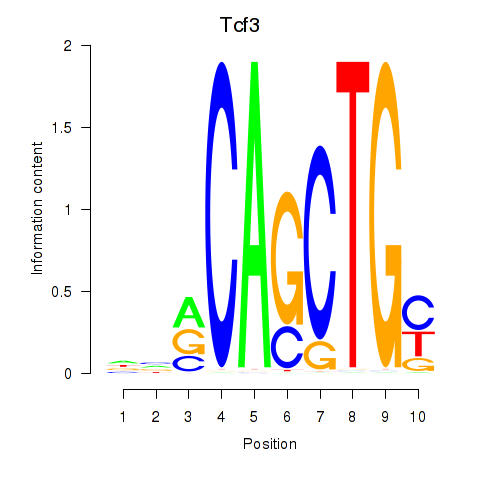
| Tcf3 | 0.282 |
|
|
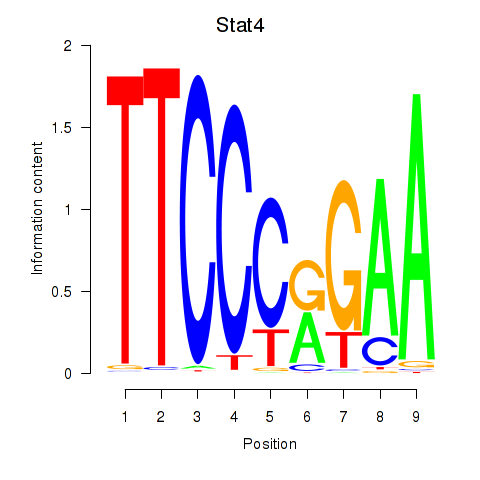
| Stat4_Stat3_Stat5b | 0.282 |
|
|
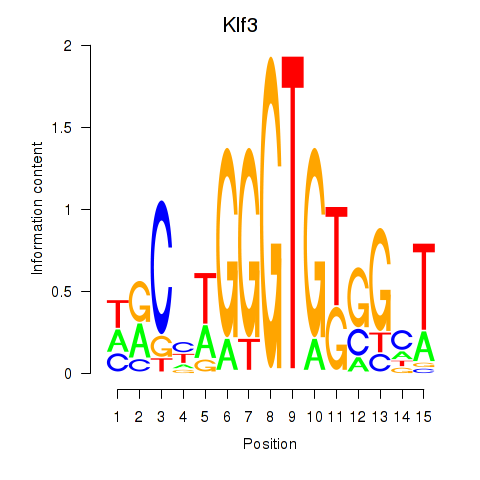
| Klf3 | 0.281 |
|
|
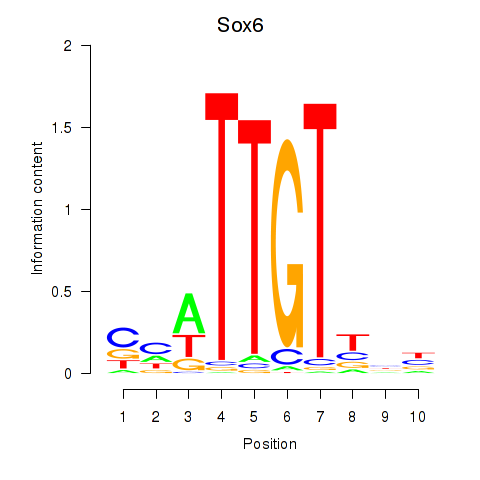
| Sox6_Sox9 | 0.280 |
|
|
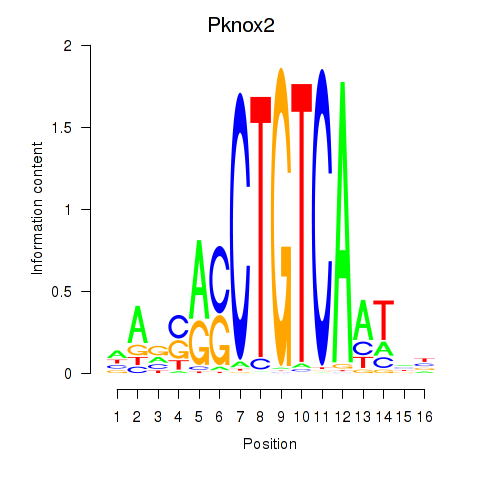
| Pknox2_Pknox1 | 0.278 |
|
|
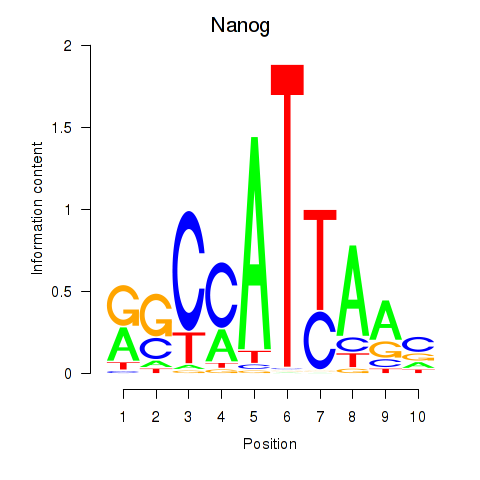
| Nanog | 0.273 |
|
|
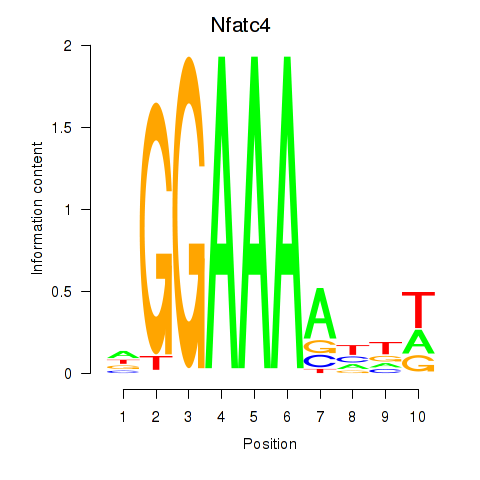
| Nfatc4 | 0.266 |
|
|
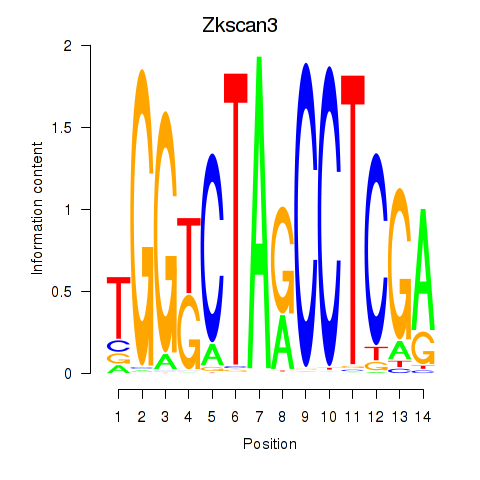
| Zkscan3 | 0.262 |
|
|
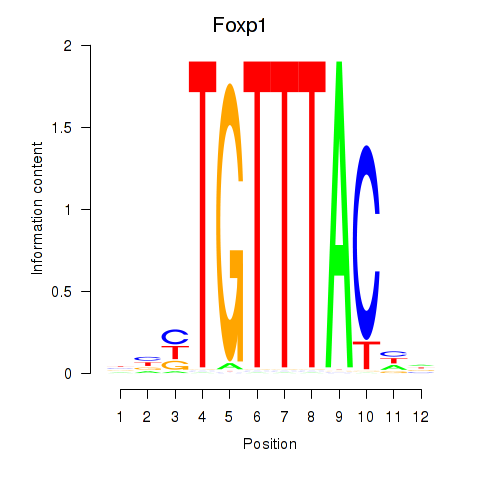
| Foxp1_Foxj2 | 0.262 |
|
|
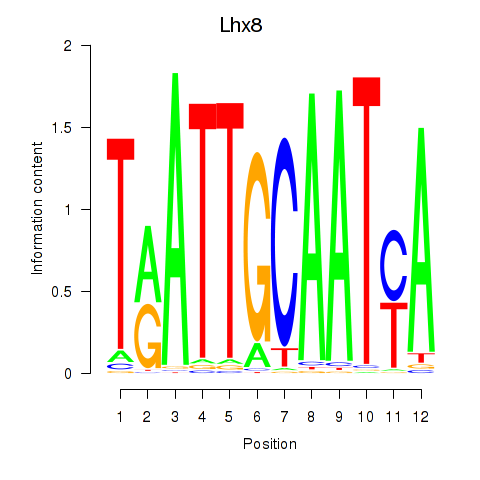
| Lhx8 | 0.243 |
|
|
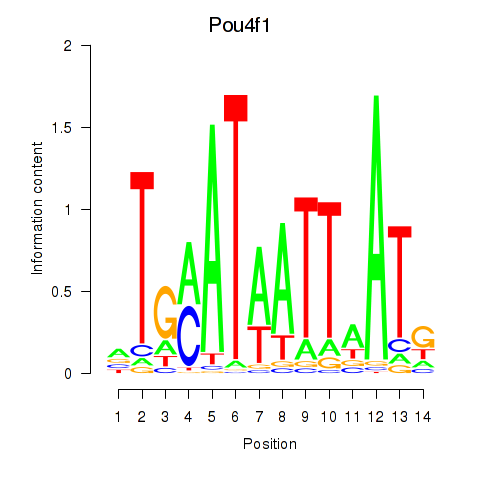
| Pou4f1_Pou6f1 | 0.232 |
|
|
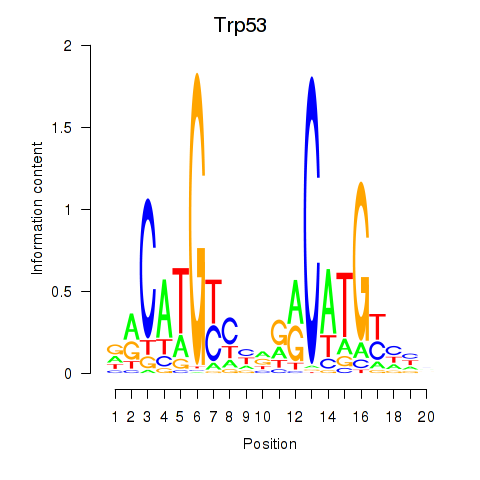
| Trp53 | 0.227 |
|
|
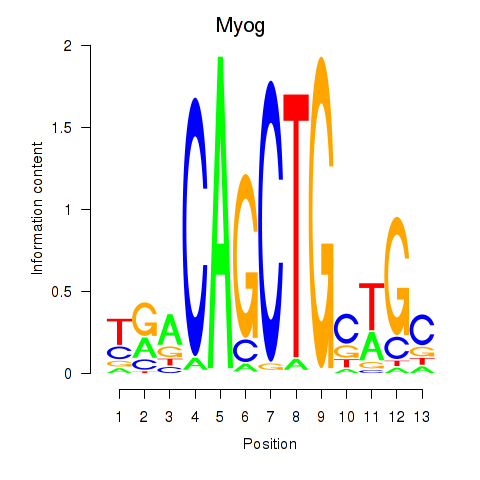
| Myog_Tcf12 | 0.225 |
|
|
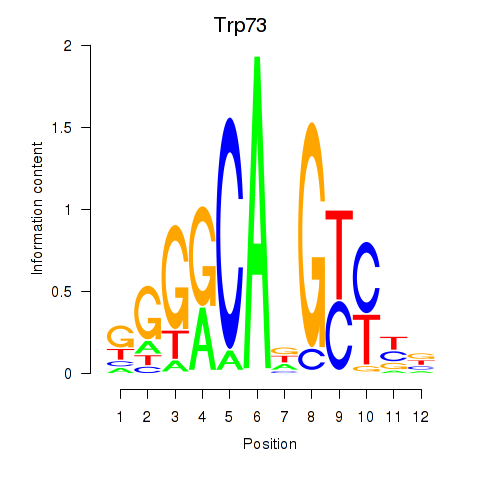
| Trp73 | 0.218 |
|
|
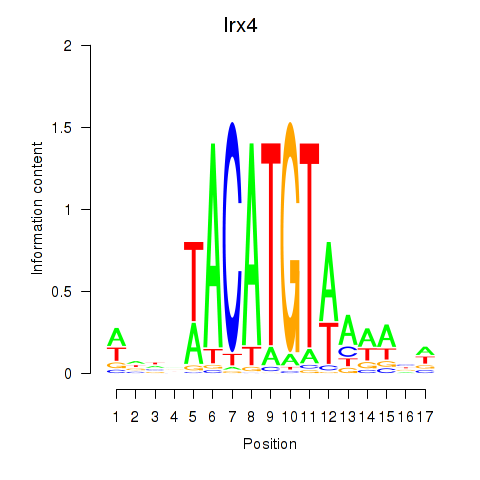
| Irx4 | 0.208 |
|
|
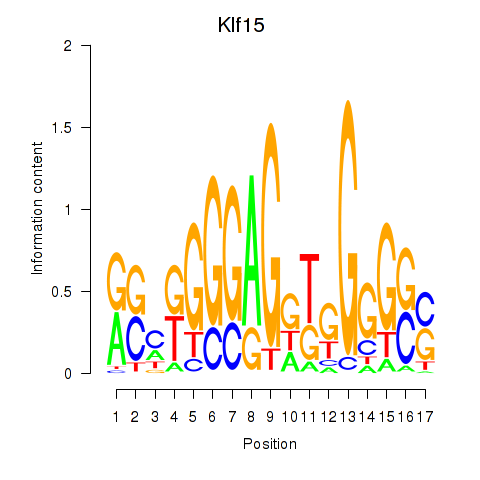
| Klf15 | 0.195 |
|
|
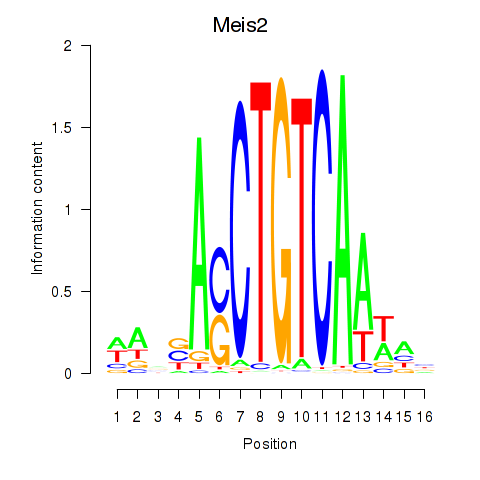
| Meis2 | 0.185 |
|
|
| Thra | 0.182 |
|

|
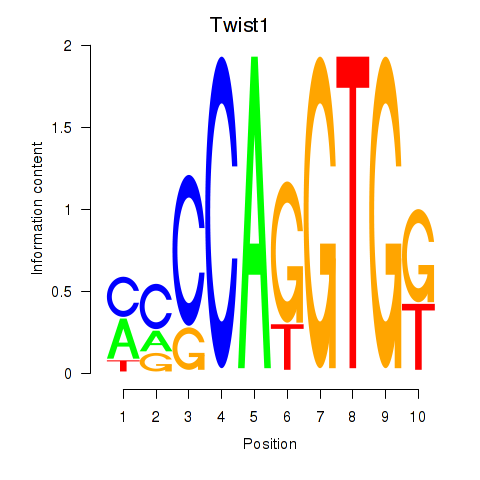
| Twist1 | 0.176 |
|
|
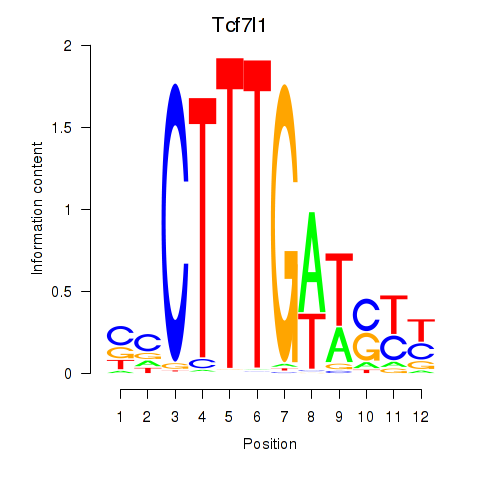
| Tcf7l1 | 0.170 |
|
|
| Barhl1 | 0.170 |
|
|
| Hoxa1 | 0.160 |
|
|
| Nfat5 | 0.145 |
|
|
| Figla | 0.143 |
|
|
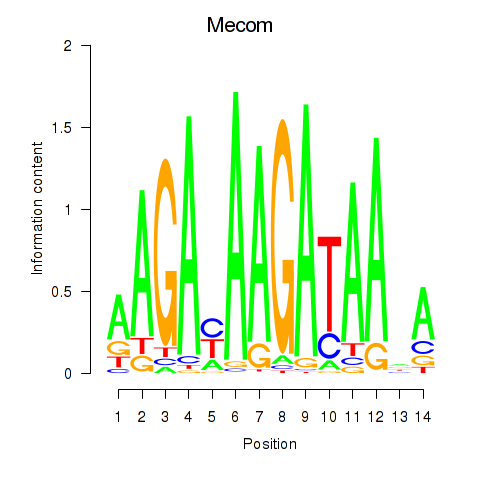
| Mecom | 0.127 |
|
|
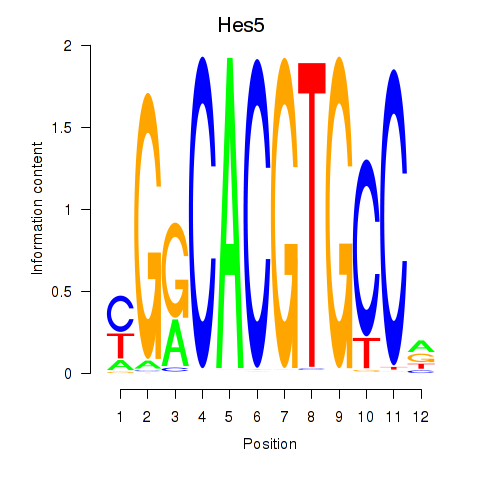
| Hes5_Hes7 | 0.127 |
|
|
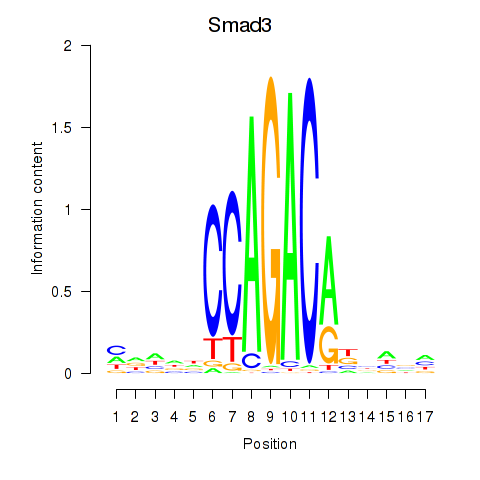
| Smad3 | 0.117 |
|
|
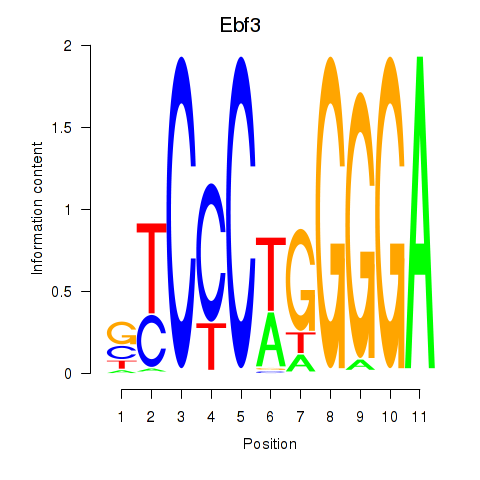
| Ebf3 | 0.110 |
|
|
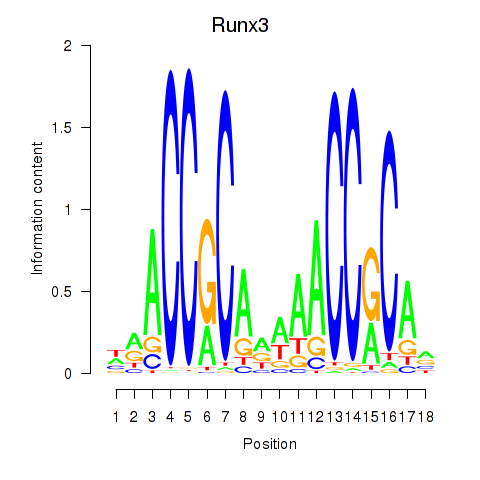
| Runx3 | 0.103 |
|
|
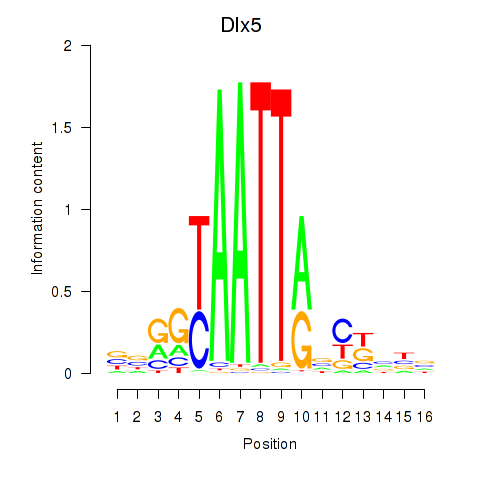
| Dlx5_Dlx4 | 0.103 |
|
|
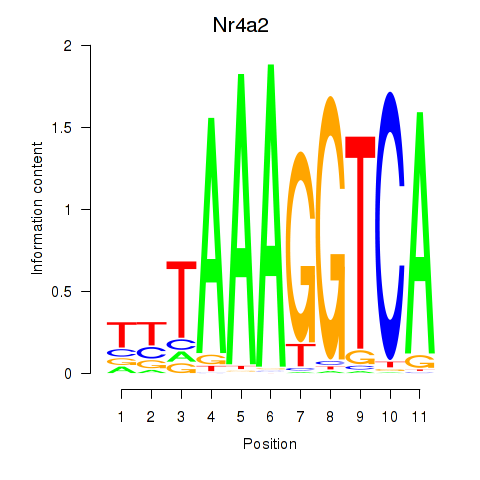
| Nr4a2 | 0.099 |
|
|
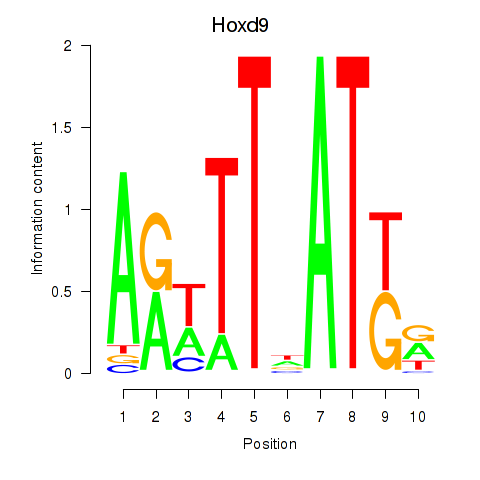
| Hoxd9 | 0.082 |
|
|
| Nfkb2 | 0.081 |
|
|
| Tfap2a | 0.077 |
|
|
| Egr4 | 0.074 |
|
|
| Ptf1a | 0.072 |
|
|
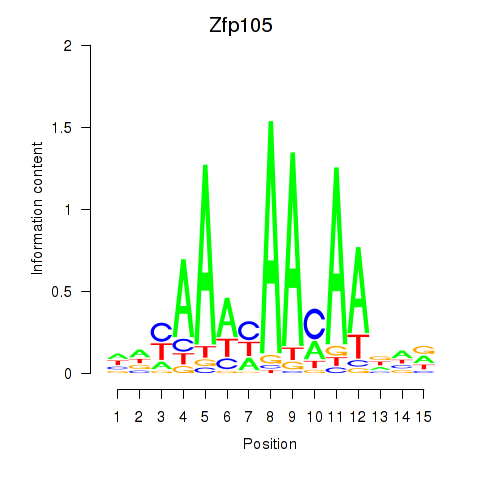
| Zfp105 | 0.072 |
|
|
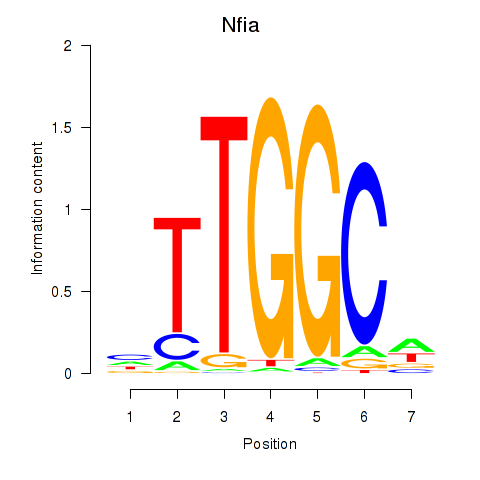
| Nfia | 0.069 |
|
|
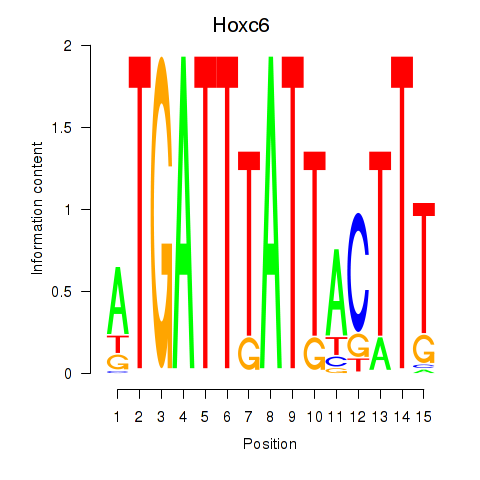
| Hoxc6 | 0.064 |
|
|
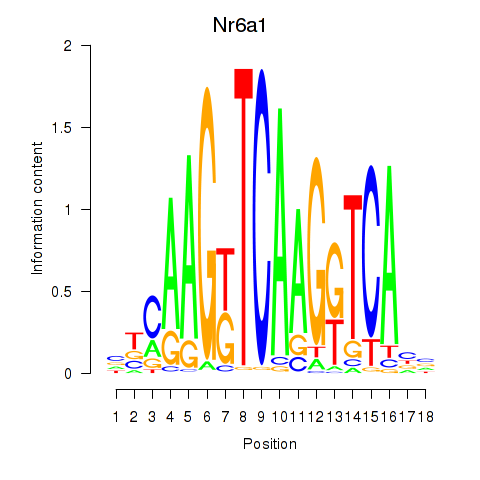
| Nr6a1 | 0.058 |
|
|
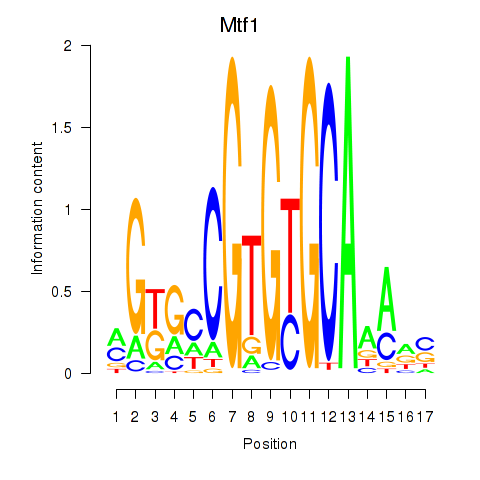
| Mtf1 | 0.048 |
|
|
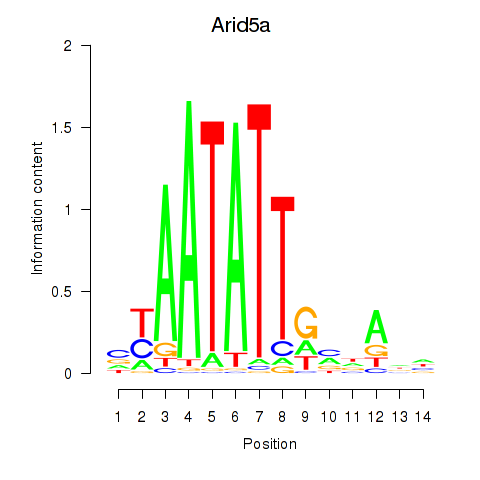
| Arid5a | 0.047 |
|
|
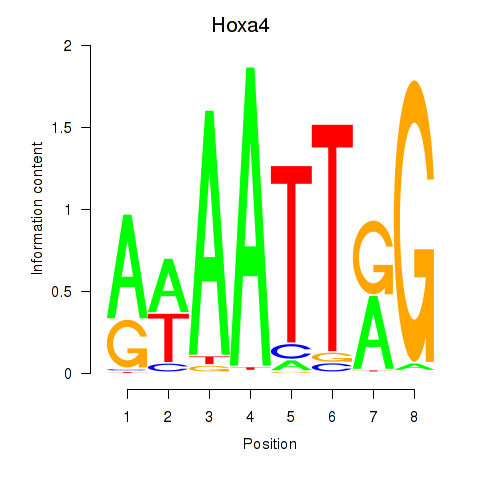
| Hoxa4 | 0.045 |
|
|
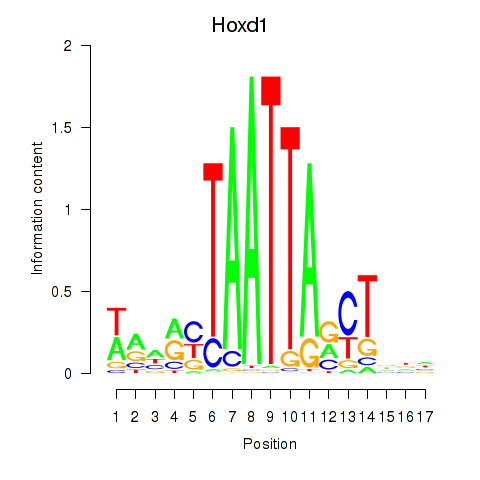
| Hoxd1 | 0.041 |
|
|
| Hoxb4 | 0.036 |
|
|
| Gli3_Zic1 | 0.023 |
|
|
| Gsx2_Hoxd3_Vax1 | 0.020 |
|
|
| Nkx2-6 | 0.019 |
|
|
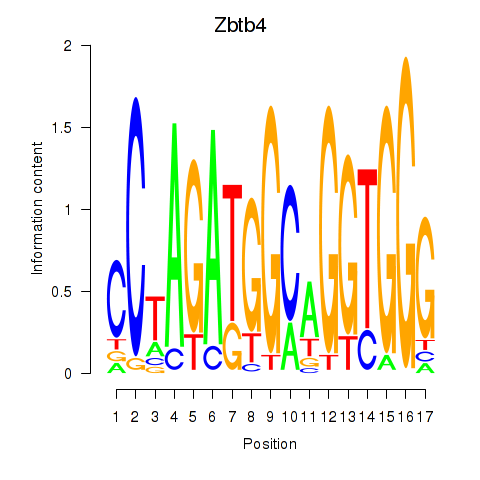
| Zbtb4 | 0.004 |
|
|
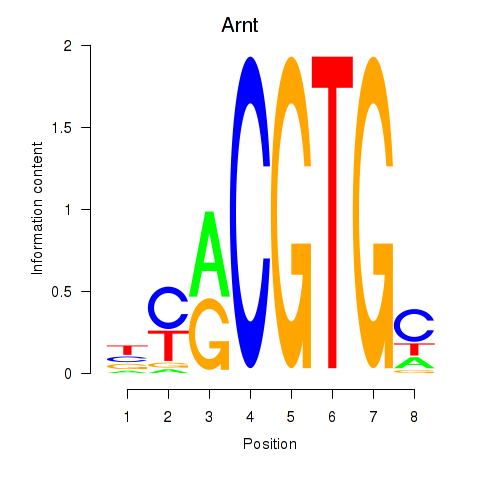
| Arnt | -0.000 |
|
|
| Cdx2 | -0.000 |
|

|
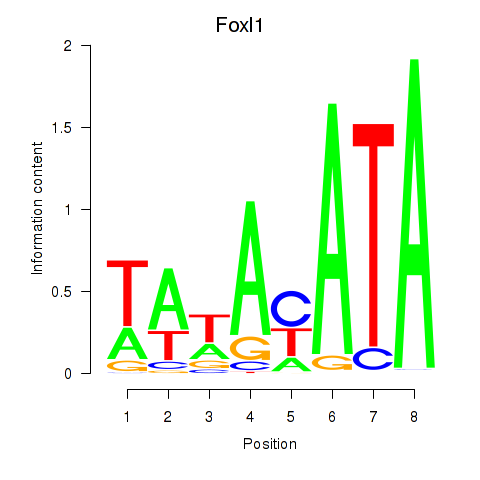
| Foxl1 | -0.000 |
|
|
| Hoxa6 | -0.000 |
|

|
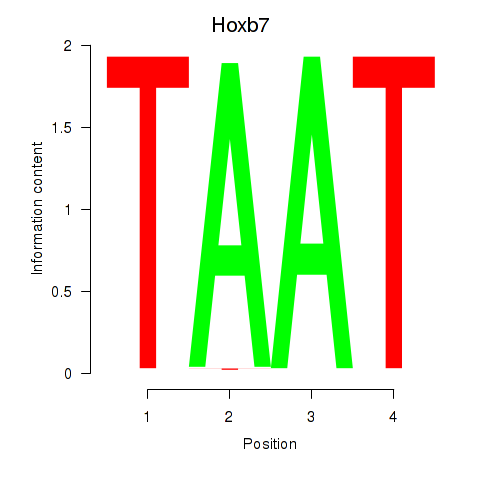
| Hoxb7 | 0.000 |
|
|
| Lef1 | -0.000 |
|

|
| Mzf1 | 0.000 |
|
|
| Pax2 | 0.000 |
|
|
| Pgr_Nr3c1 | -0.000 |
|
|
| Sox15 | -0.000 |
|
|
| Arnt2 | -0.002 |
|
|
| Msx1_Lhx9_Barx1_Rax_Dlx6 | -0.017 |
|
|
| Zfp524 | -0.017 |
|
|
| Six3_Six1_Six2 | -0.023 |
|
|
| Bbx | -0.027 |
|
|
| Foxf1 | -0.029 |
|
|
| Nkx2-9 | -0.039 |
|
|
| Pou1f1 | -0.046 |
|
|
| Myod1 | -0.055 |
|
|
| Atf5 | -0.060 |
|
|
| Myb | -0.070 |
|
|
| Msx3 | -0.075 |
|
|
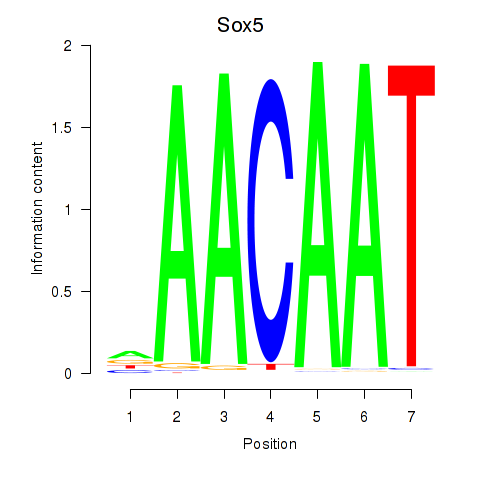
| Sox5_Sry | -0.092 |
|
|
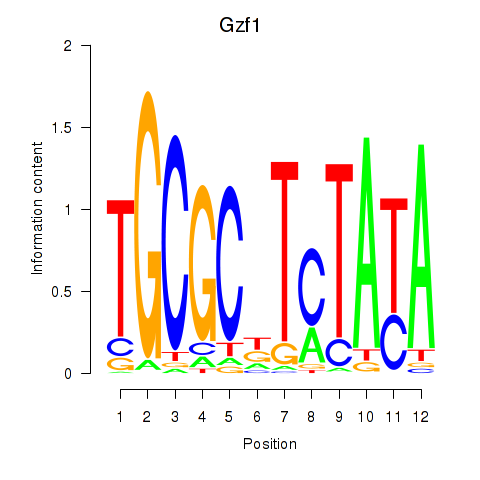
| Gzf1 | -0.096 |
|
|
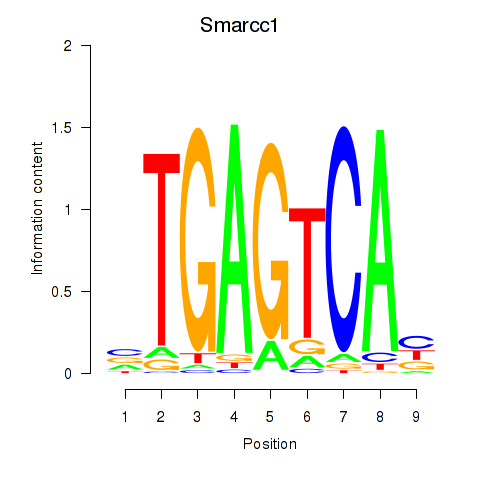
| Smarcc1_Fosl1 | -0.096 |
|
|
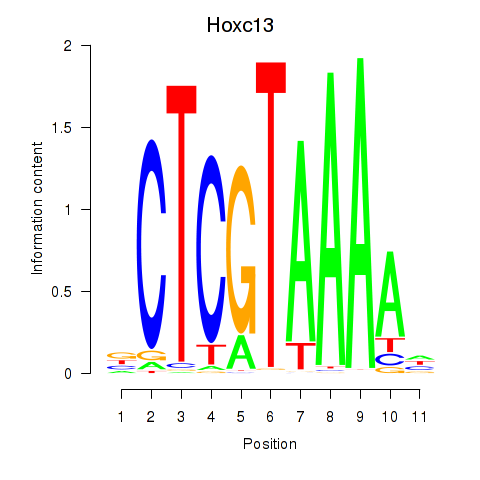
| Hoxc13_Hoxd13 | -0.098 |
|
|
| Elf3 | -0.099 |
|
|
| Phox2a | -0.104 |
|
|
| Hoxa2 | -0.106 |
|
|
| Zfp128 | -0.109 |
|
|
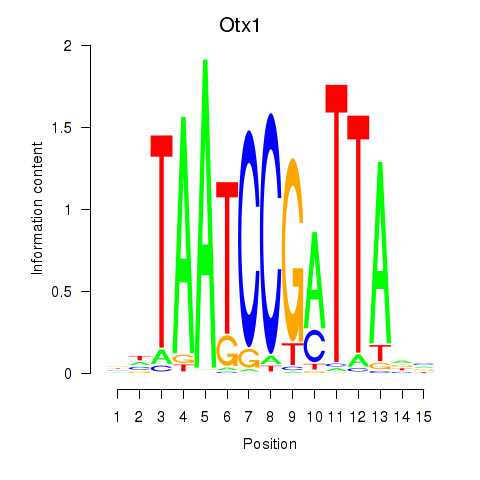
| Otx1 | -0.115 |
|
|
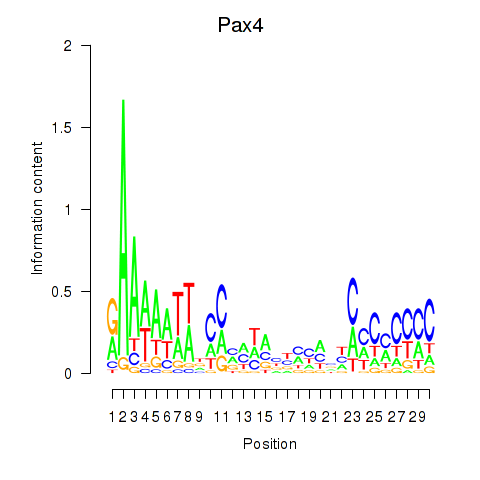
| Pax4 | -0.119 |
|
|
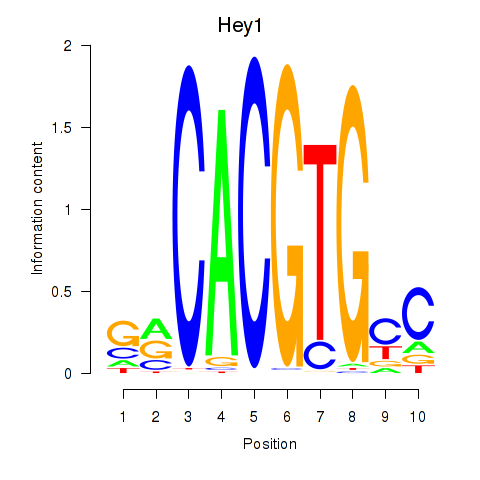
| Hey1_Myc_Mxi1 | -0.131 |
|
|
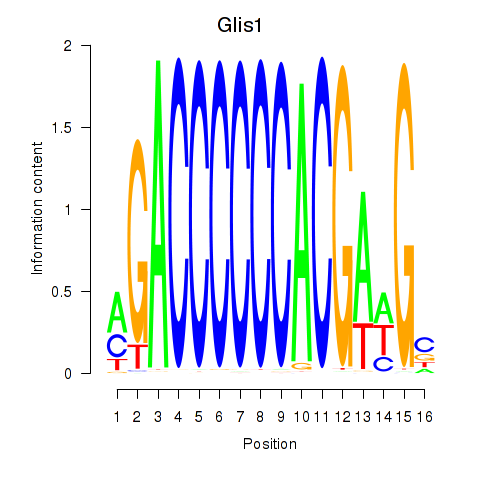
| Glis1 | -0.136 |
|
|
| Tfap4 | -0.142 |
|
|
| Hivep1 | -0.143 |
|
|
| E2f6 | -0.143 |
|
|
| Hoxd8 | -0.149 |
|
|
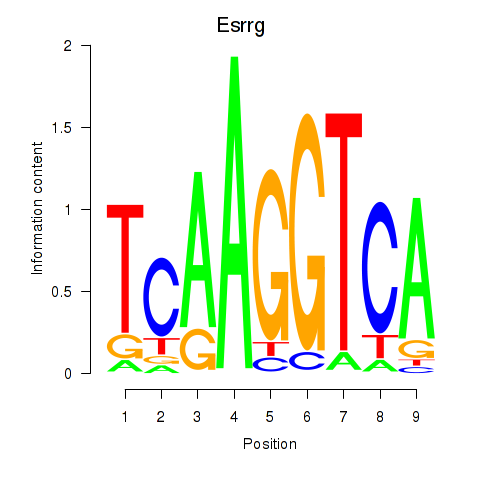
| Esrrg | -0.150 |
|
|
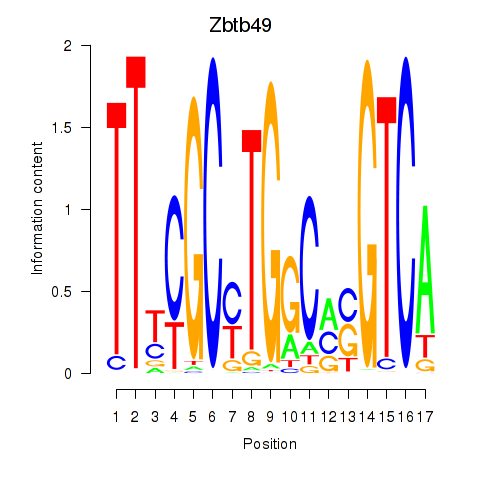
| Zbtb49 | -0.151 |
|
|
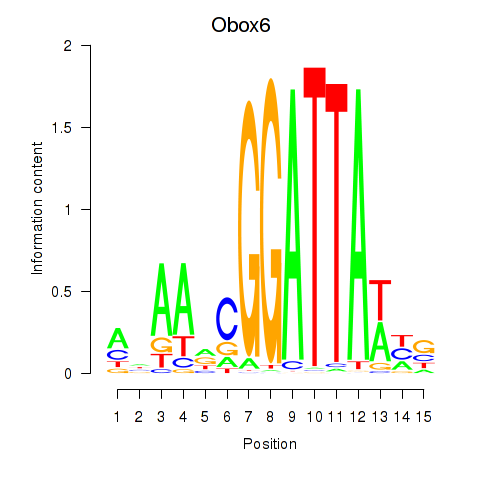
| Obox6_Obox5 | -0.154 |
|
|
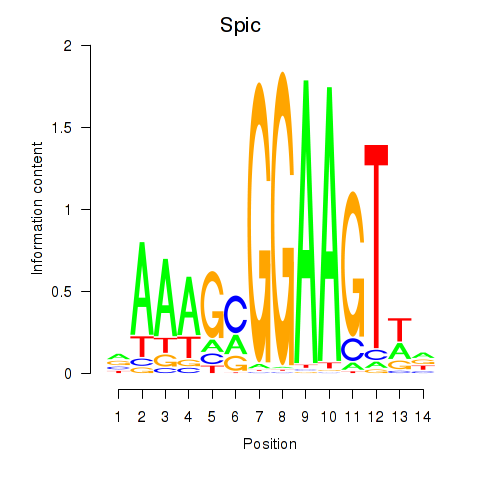
| Spic | -0.157 |
|
|
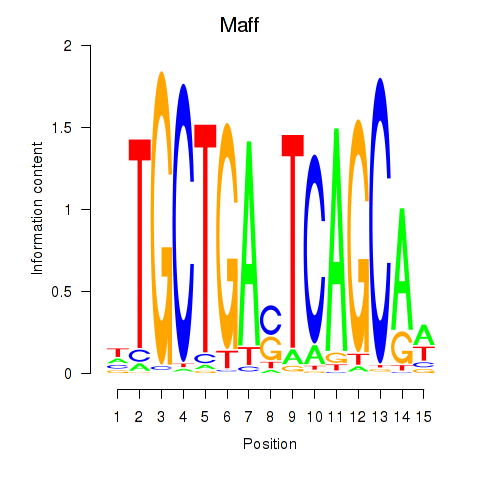
| Maff | -0.164 |
|
|
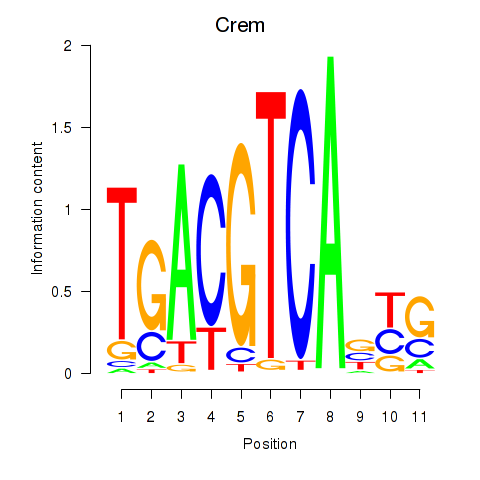
| Crem_Jdp2 | -0.169 |
|
|
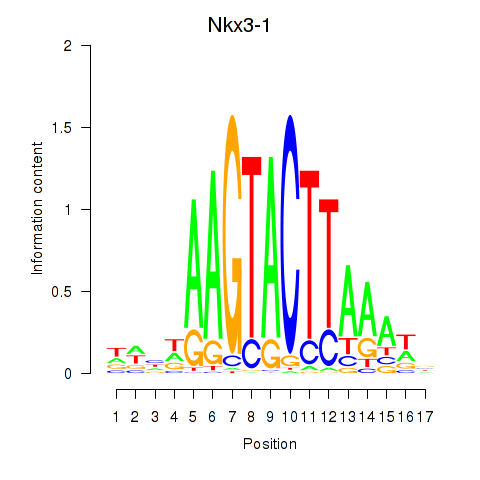
| Nkx3-1 | -0.207 |
|
|
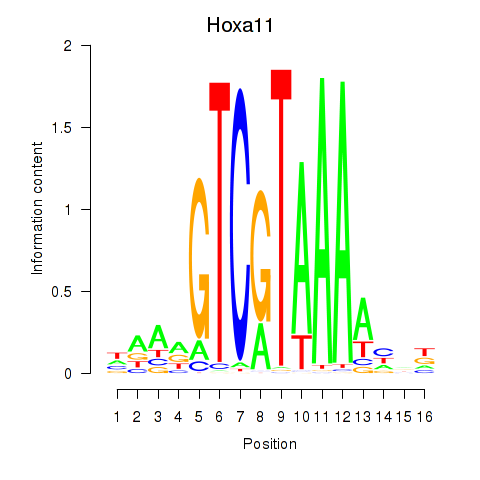
| Hoxa11_Hoxc12 | -0.210 |
|
|
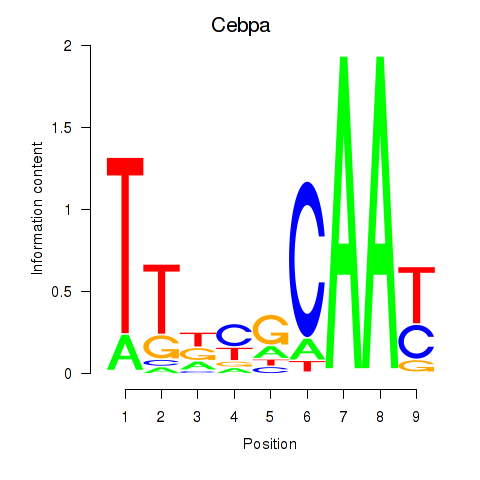
| Cebpa_Cebpg | -0.212 |
|
|
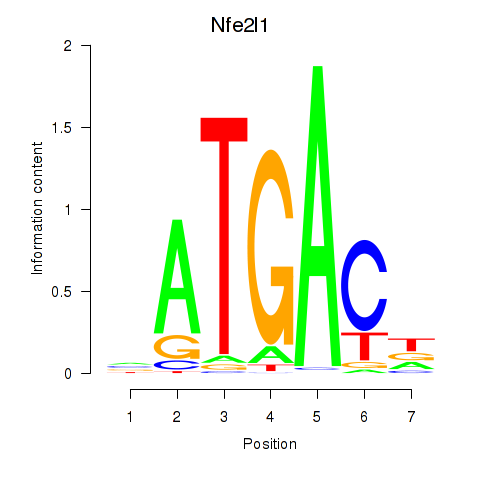
| Nfe2l1_Mafg | -0.236 |
|
|
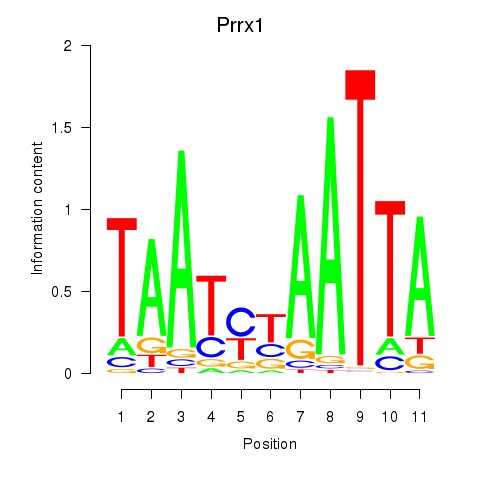
| Prrx1_Isx_Prrxl1 | -0.237 |
|
|
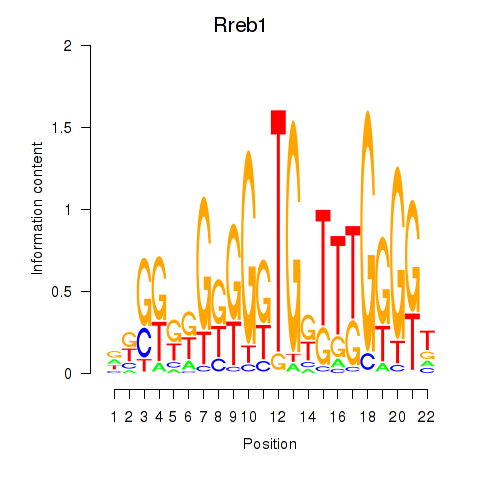
| Rreb1 | -0.239 |
|
|
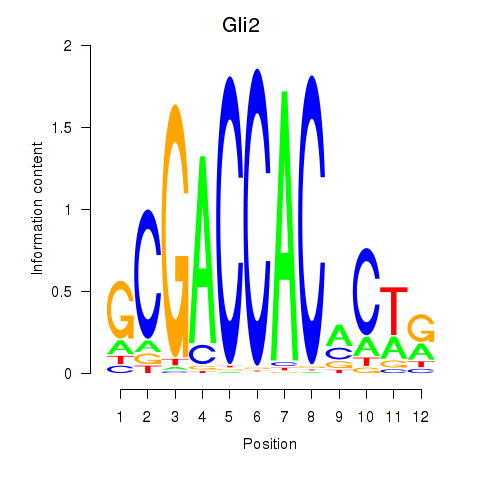
| Gli2 | -0.242 |
|
|
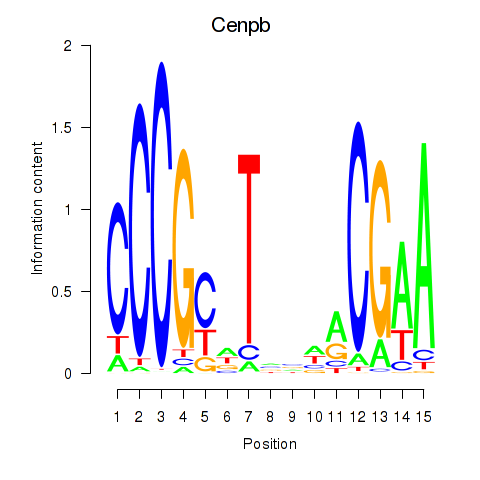
| Cenpb | -0.243 |
|
|
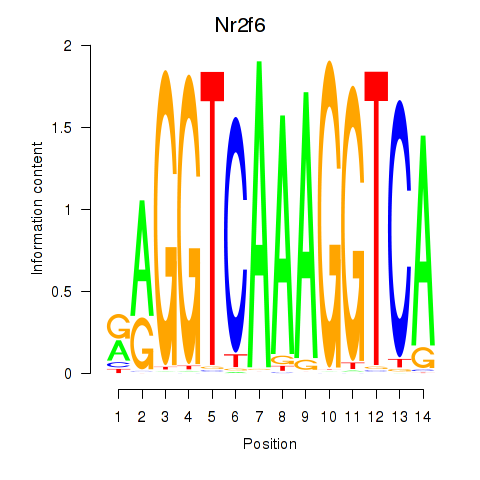
| Nr2f6 | -0.250 |
|
|
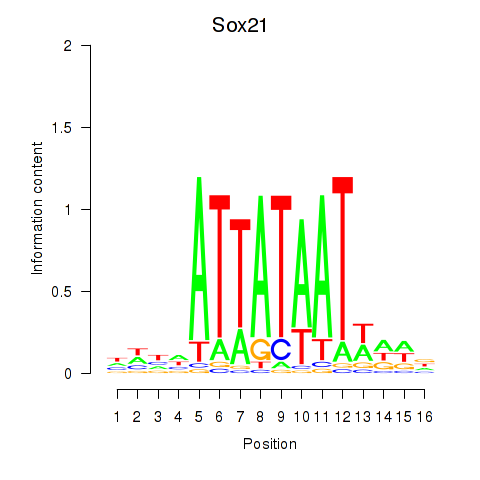
| Sox21 | -0.254 |
|
|
| Fosb | -0.268 |
|
|
| Zfp410 | -0.270 |
|
|
| Foxn1 | -0.272 |
|

|
| Pou3f2 | -0.272 |
|
|
| Elf5 | -0.284 |
|
|
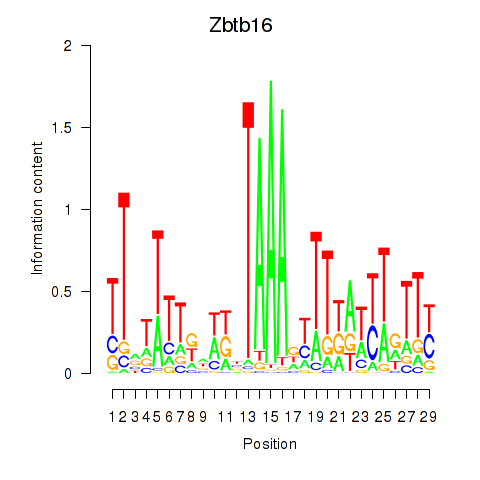
| Zbtb16 | -0.288 |
|
|
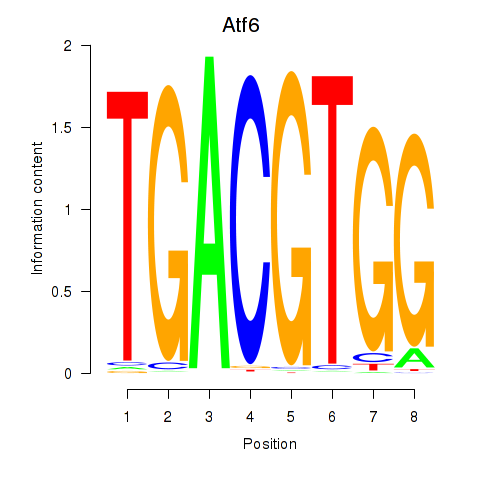
| Atf6 | -0.289 |
|
|
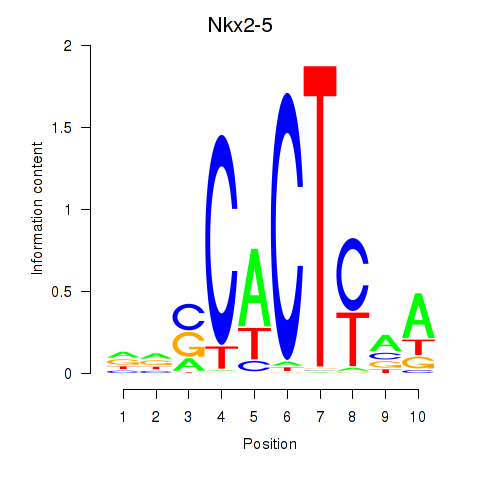
| Nkx2-5 | -0.292 |
|
|
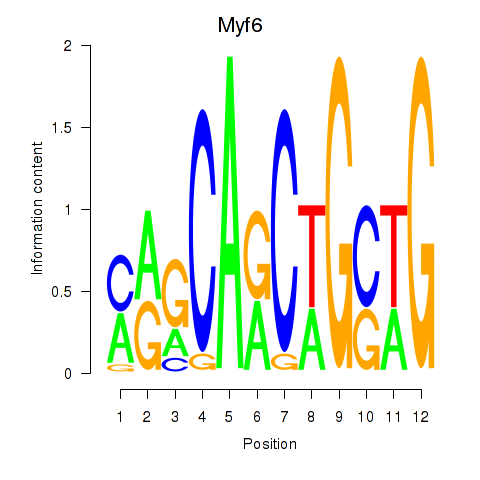
| Myf6 | -0.293 |
|
|
| Tbx1_Eomes | -0.296 |
|
|
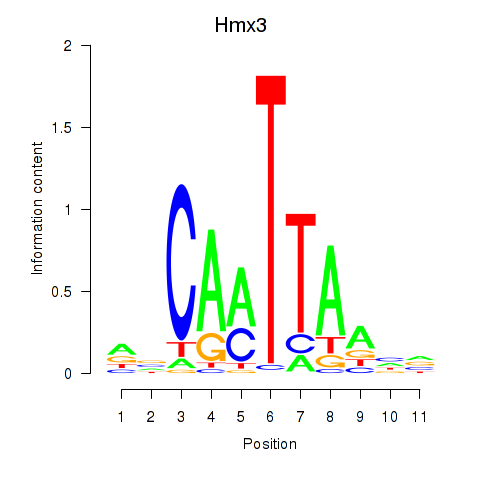
| Hmx3 | -0.297 |
|
|
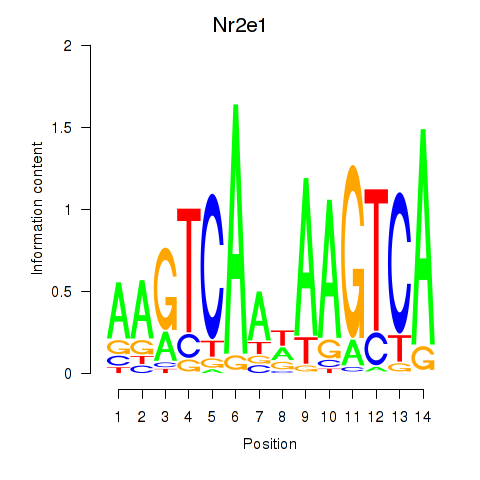
| Nr2e1 | -0.300 |
|
|
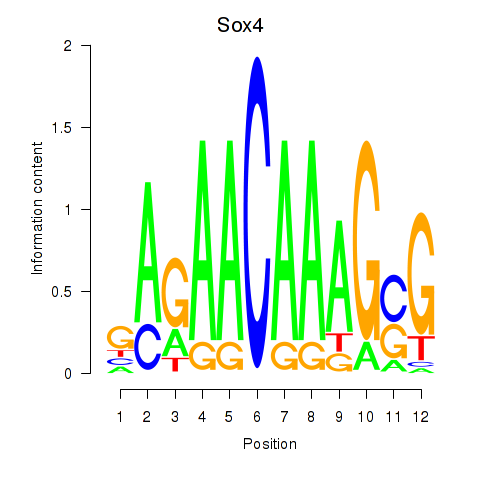
| Sox4 | -0.300 |
|
|
| Nfatc3 | -0.306 |
|
|
| Foxo3 | -0.307 |
|
|
| Hif1a | -0.308 |
|
|
| Mnx1_Lhx6_Lmx1a | -0.308 |
|
|
| Bhlhe40 | -0.331 |
|
|
| Hoxa3 | -0.333 |
|
|
| Trp63 | -0.356 |
|
|
| Cdc5l | -0.360 |
|
|
| Rad21_Smc3 | -0.360 |
|
|
| Irx6_Irx2_Irx3 | -0.363 |
|
|
| Fosl2_Bach2 | -0.364 |
|
|
| Hsf1 | -0.364 |
|
|
| Ppard | -0.372 |
|
|
| Hoxb1 | -0.378 |
|
|
| Cebpd | -0.385 |
|
|
| Tbx4 | -0.391 |
|

|
| Hlf | -0.392 |
|
|
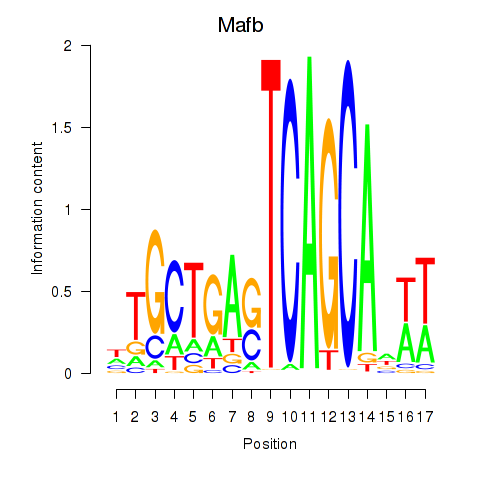
| Mafb | -0.398 |
|
|
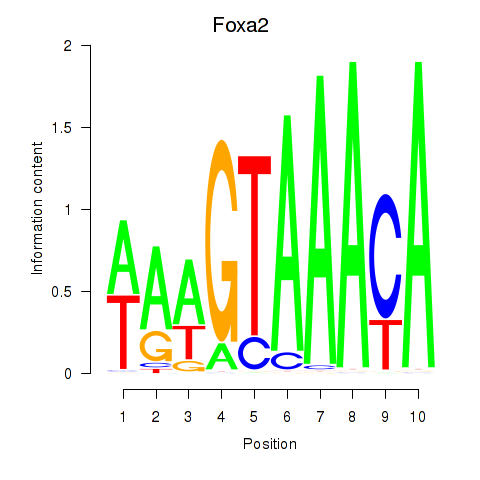
| Foxa2_Foxa1 | -0.403 |
|
|
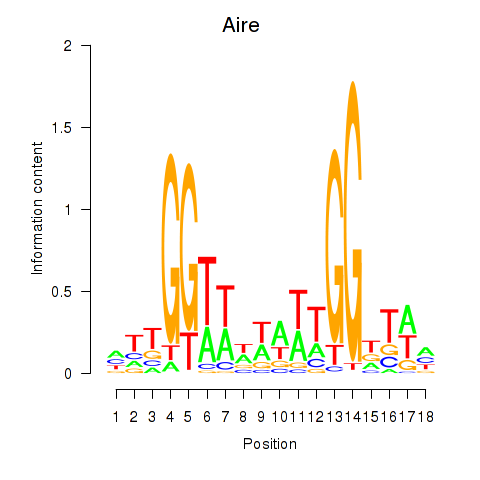
| Aire | -0.414 |
|
|
| Nr0b1 | -0.418 |
|

|
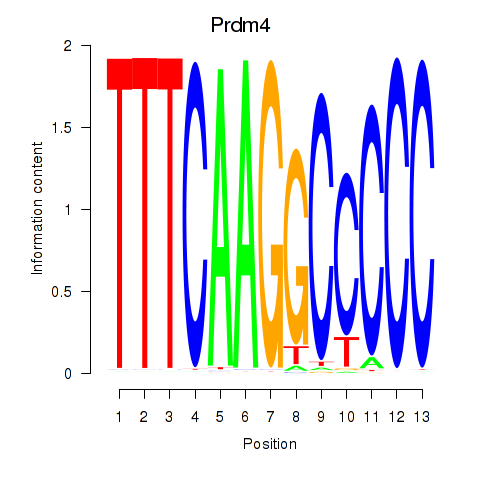
| Prdm4 | -0.426 |
|
|
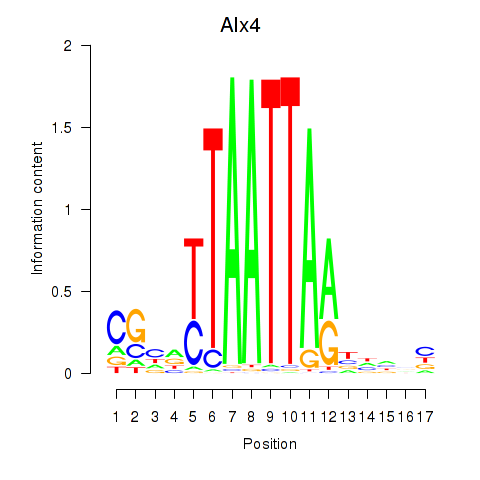
| Alx4 | -0.429 |
|
|
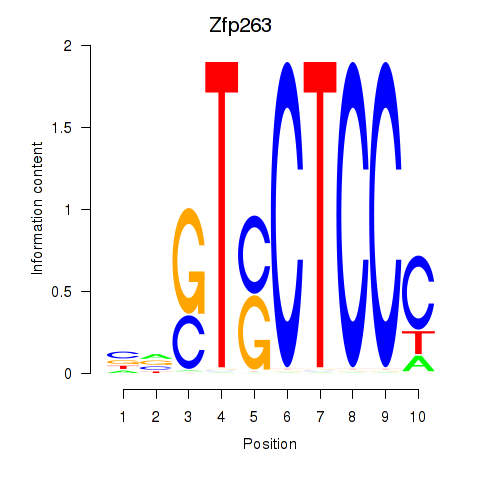
| Zfp263 | -0.453 |
|
|
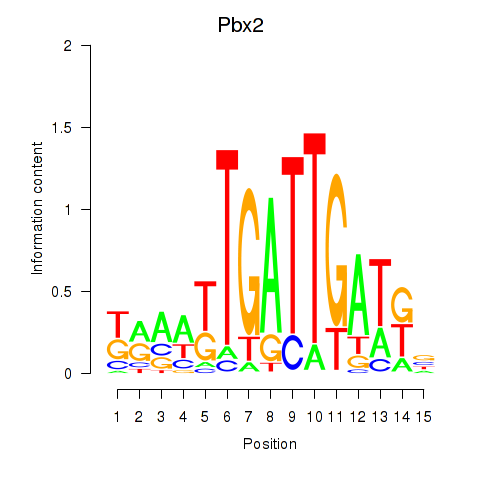
| Pbx2 | -0.454 |
|
|
| Ovol1 | -0.454 |
|

|
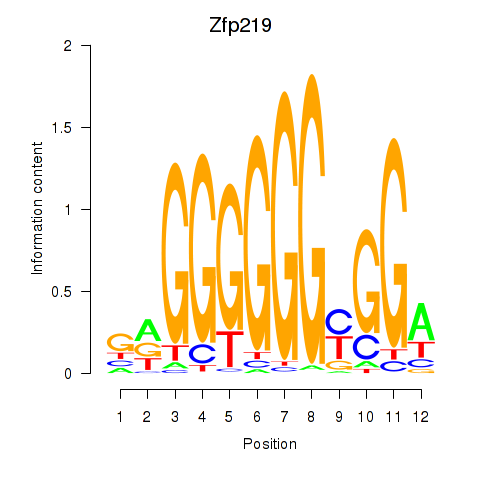
| Zfp219_Zfp740 | -0.457 |
|
|
| Foxp2_Foxp3 | -0.475 |
|
|
| Scrt2 | -0.481 |
|
|
| Cbfb | -0.494 |
|
|
| Clock | -0.504 |
|
|
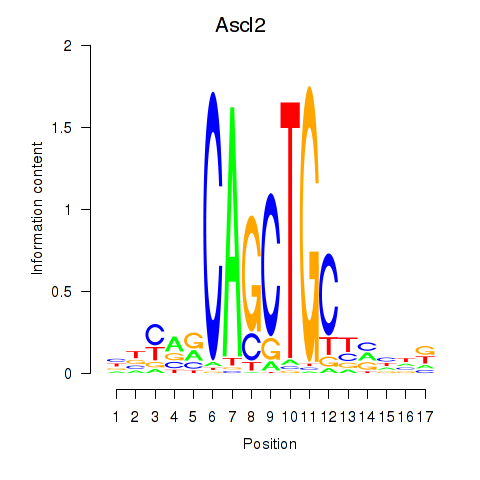
| Ascl2 | -0.508 |
|
|
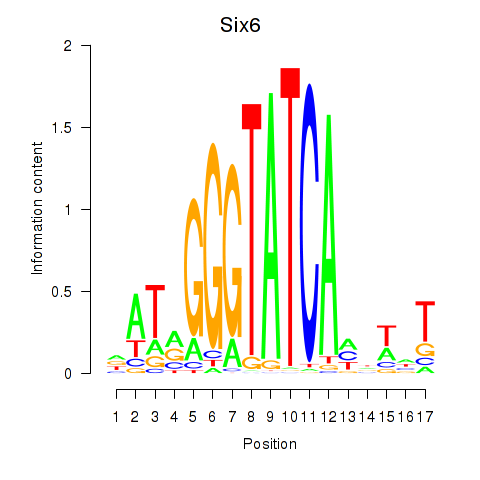
| Six6 | -0.509 |
|
|
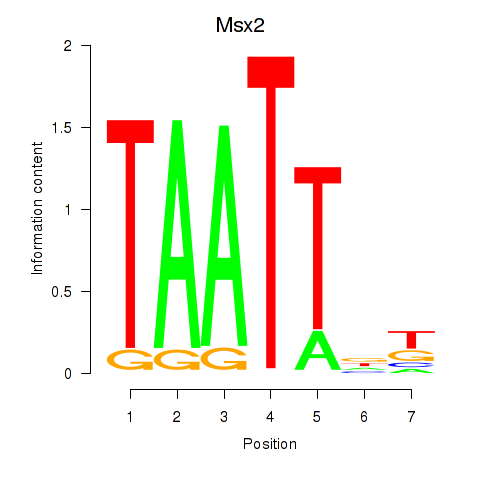
| Msx2_Hoxd4 | -0.527 |
|
|
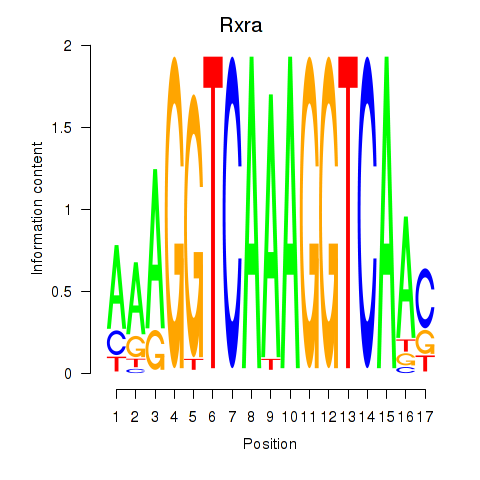
| Rxra | -0.532 |
|
|
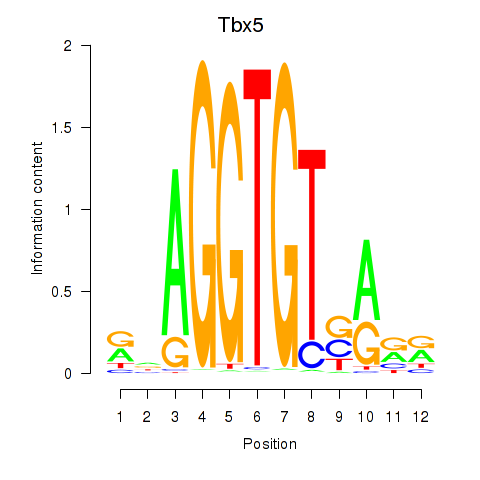
| Tbx5 | -0.539 |
|
|
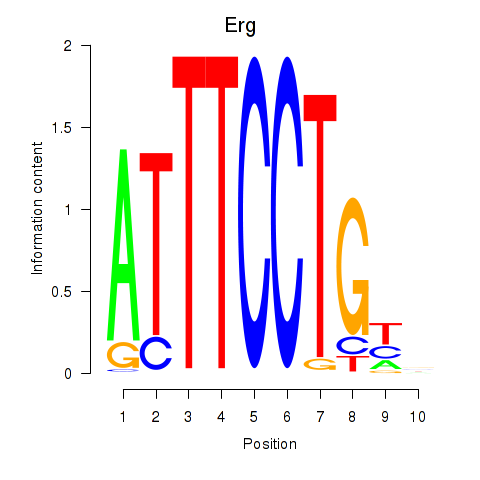
| Erg | -0.540 |
|
|
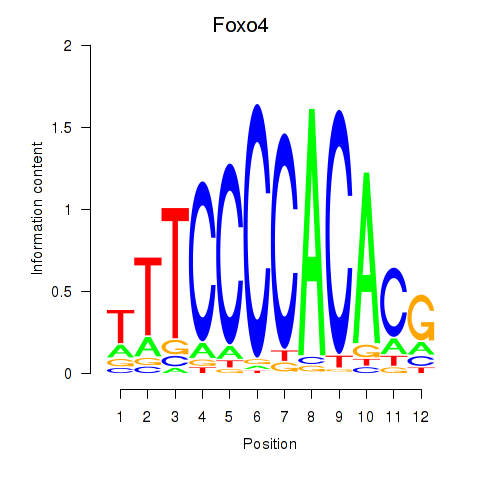
| Foxo4 | -0.542 |
|
|
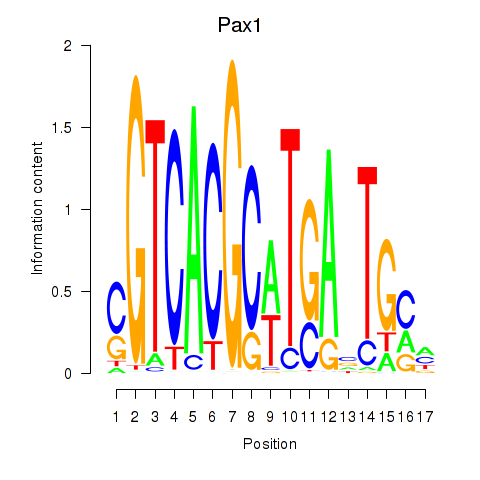
| Pax1_Pax9 | -0.545 |
|
|
| Vdr | -0.545 |
|
|
| Emx1_Emx2 | -0.546 |
|
|
| Nkx6-2 | -0.551 |
|
|
| Lhx4 | -0.553 |
|
|
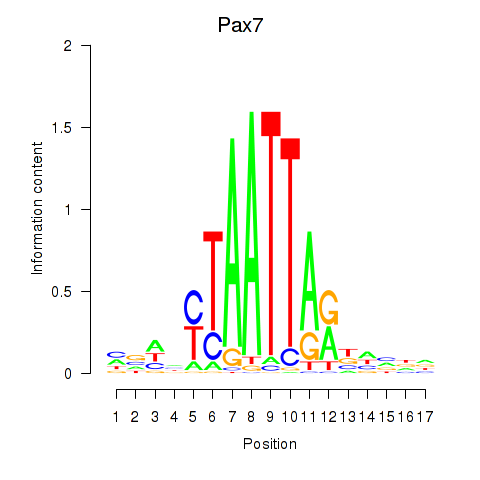
| Pax7 | -0.564 |
|
|
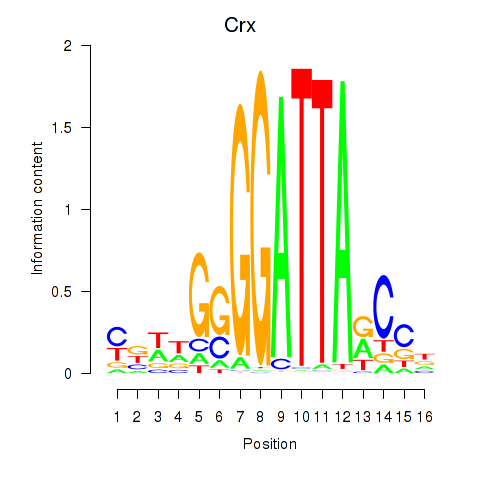
| Crx_Gsc | -0.565 |
|
|
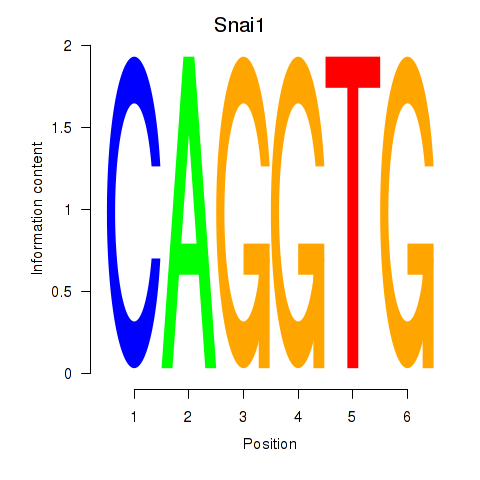
| Snai1_Zeb1_Snai2 | -0.570 |
|
|
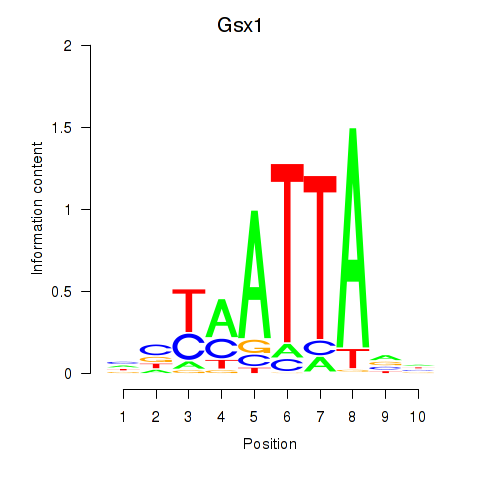
| Gsx1_Alx1_Mixl1_Lbx2 | -0.574 |
|
|
| Nr2c2 | -0.584 |
|
|
| Cpeb1 | -0.584 |
|
|
| Mef2c | -0.587 |
|
|
| Pax3 | -0.599 |
|
|
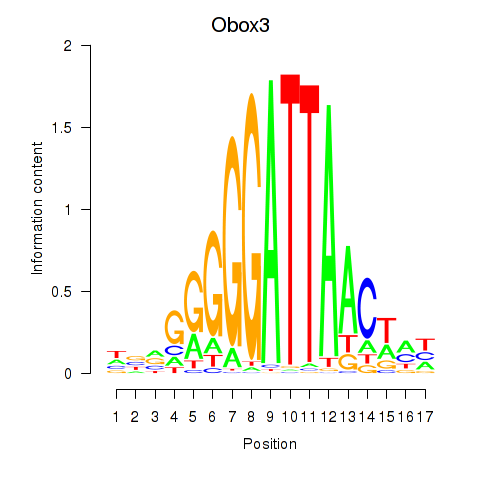
| Obox3 | -0.603 |
|
|
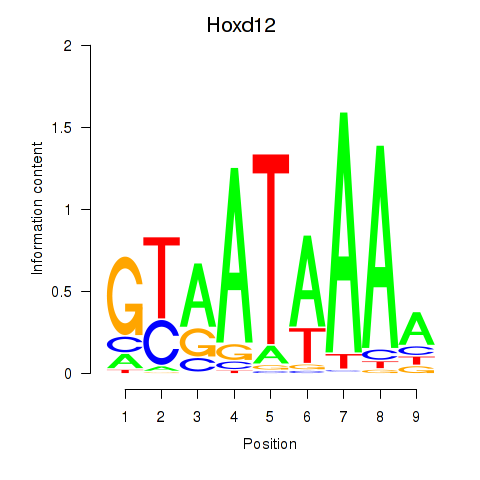
| Hoxd12 | -0.604 |
|
|
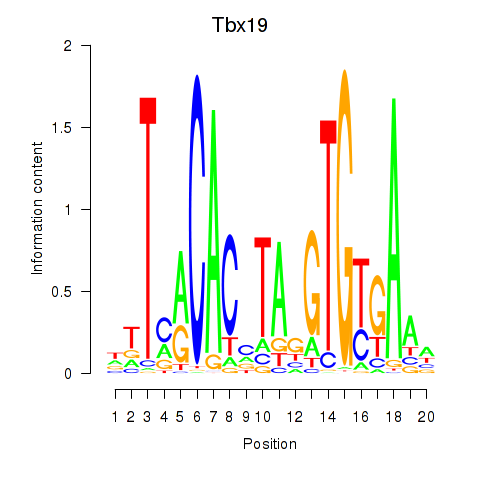
| Tbx19 | -0.609 |
|
|
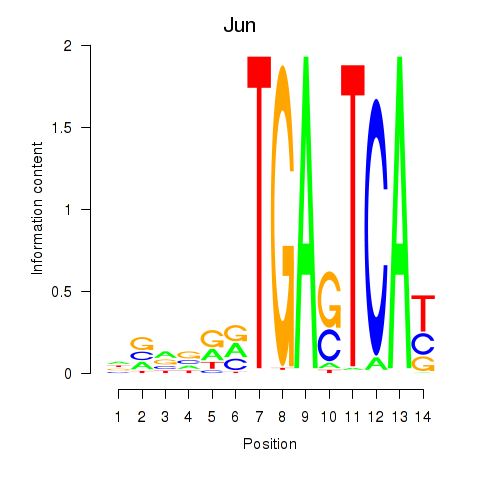
| Jun | -0.617 |
|
|
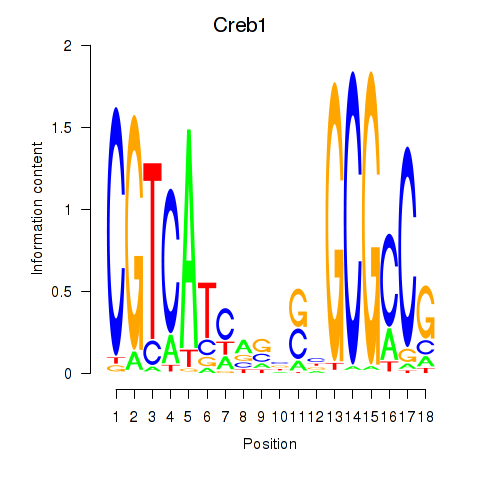
| Creb1 | -0.623 |
|
|
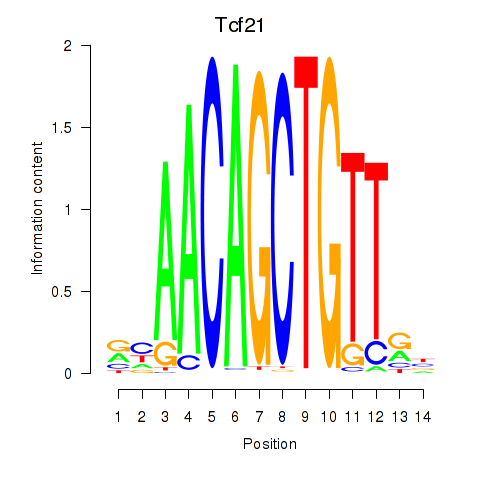
| Tcf21_Msc | -0.625 |
|
|
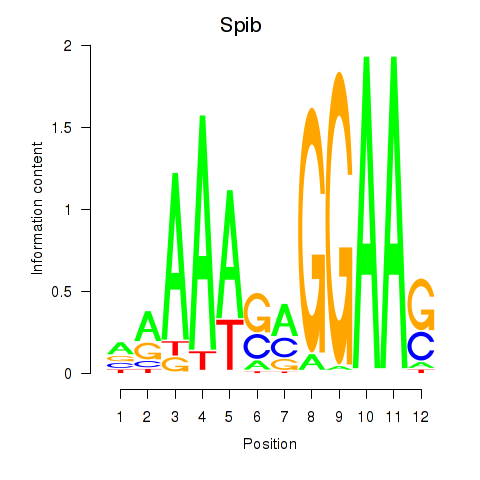
| Spib | -0.636 |
|
|
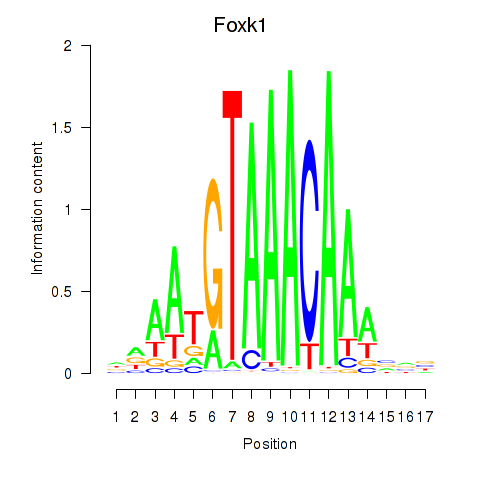
| Foxk1_Foxj1 | -0.643 |
|
|
| Nr3c2 | -0.646 |
|
|
| Gtf2i_Gtf2f1 | -0.659 |
|
|
| Stat2 | -0.668 |
|
|
| Thrb | -0.671 |
|
|
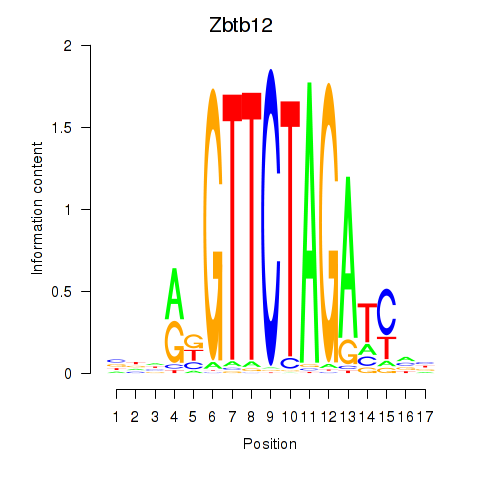
| Zbtb12 | -0.672 |
|
|
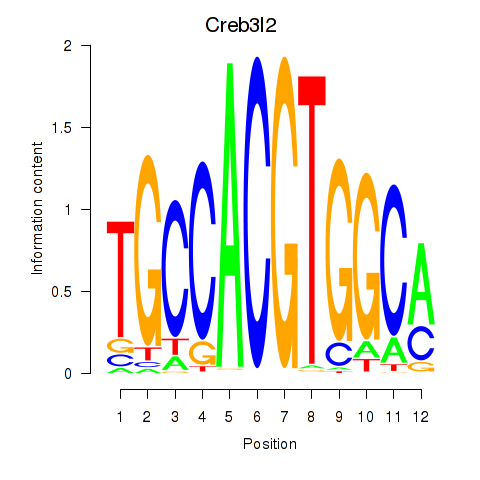
| Creb3l2 | -0.672 |
|
|
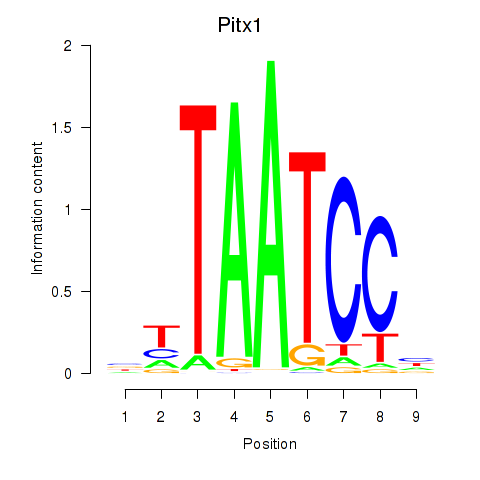
| Pitx1 | -0.675 |
|
|
| Hoxa7_Hoxc8 | -0.680 |
|

|
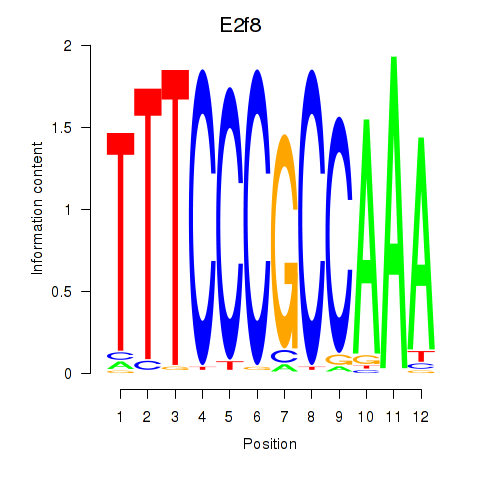
| E2f8 | -0.682 |
|
|
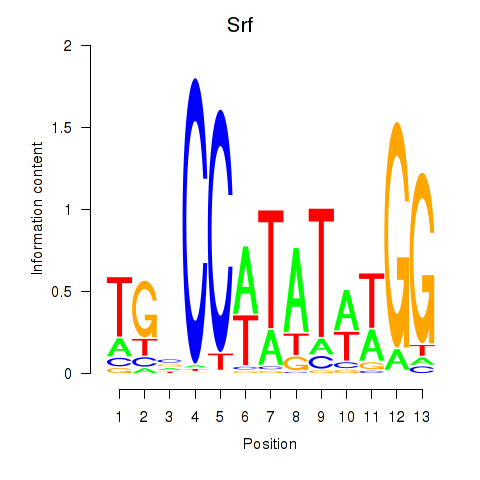
| Srf | -0.697 |
|
|
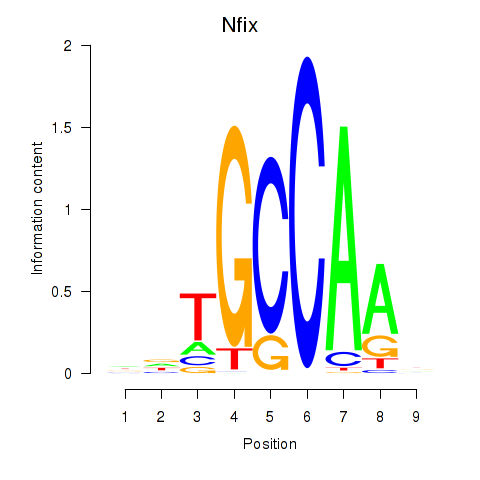
| Nfix | -0.705 |
|
|
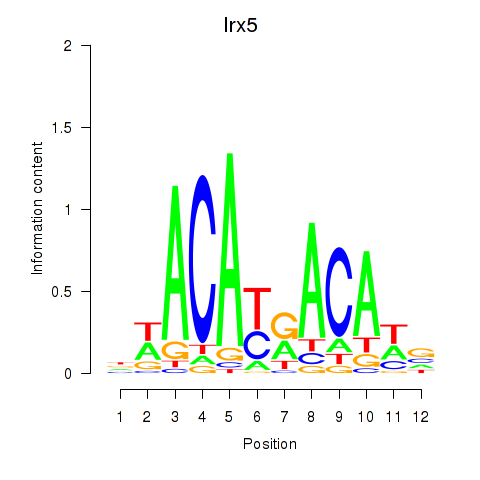
| Irx5 | -0.705 |
|
|
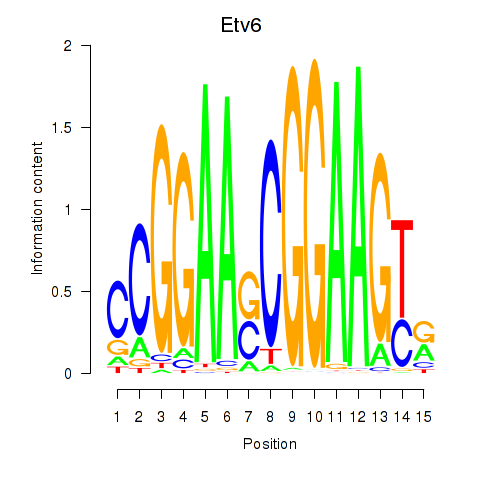
| Etv6 | -0.714 |
|
|
| Maf_Nrl | -0.719 |
|
|
| Pitx3 | -0.744 |
|

|
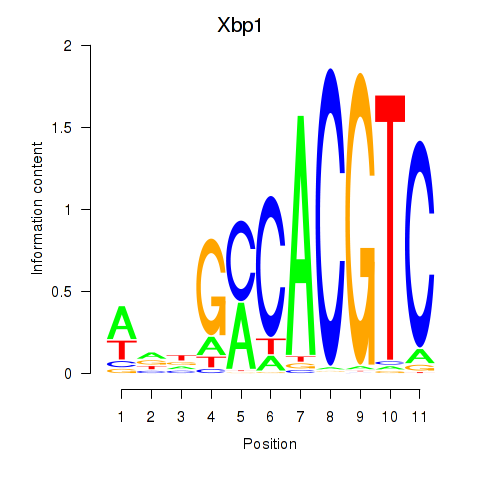
| Xbp1_Creb3l1 | -0.744 |
|
|
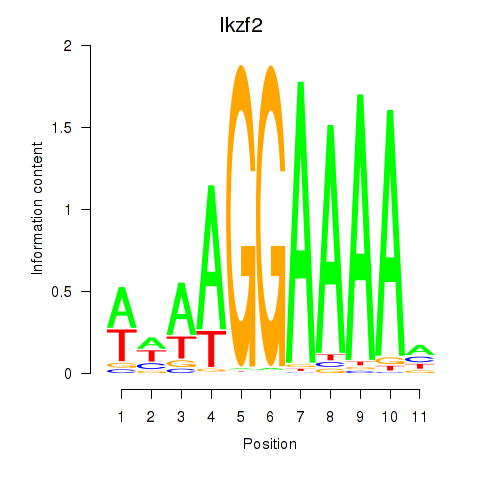
| Ikzf2 | -0.755 |
|
|
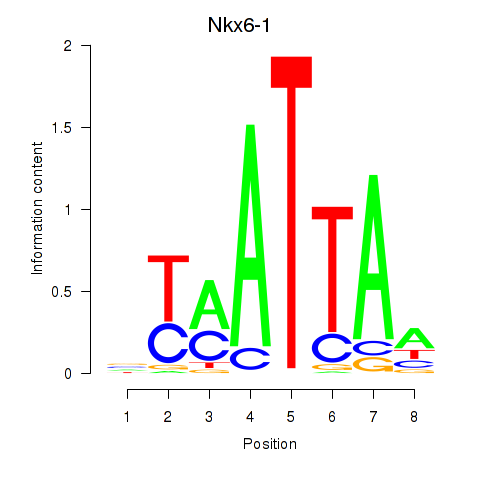
| Nkx6-1_Evx1_Hesx1 | -0.762 |
|
|
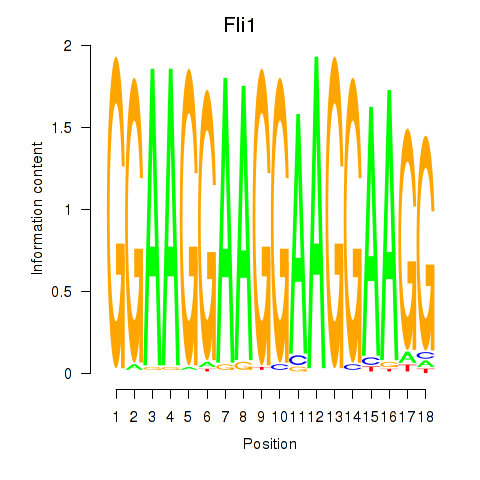
| Fli1 | -0.781 |
|
|
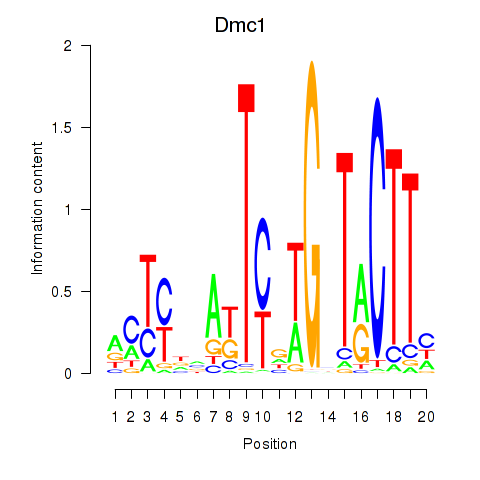
| Dmc1 | -0.791 |
|
|
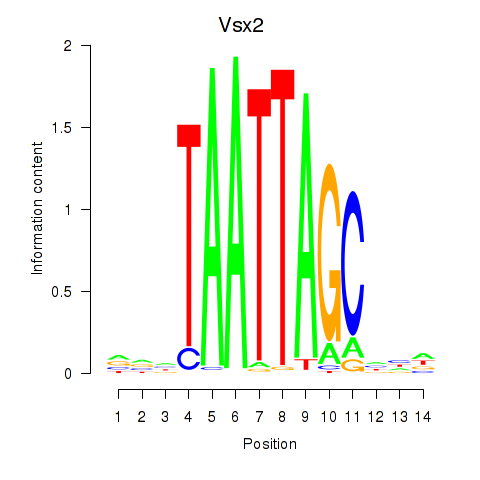
| Vsx2_Dlx3 | -0.798 |
|
|
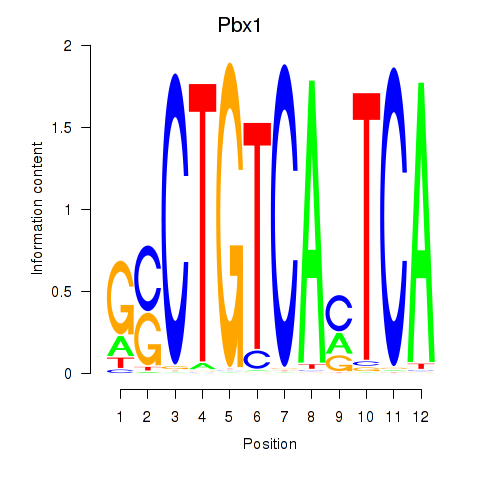
| Pbx1_Pbx3 | -0.800 |
|
|
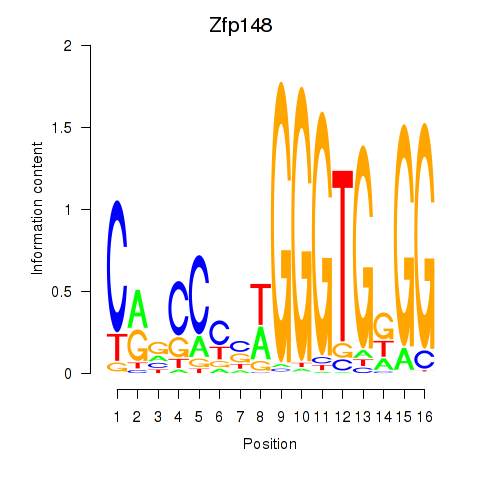
| Zfp148 | -0.809 |
|
|
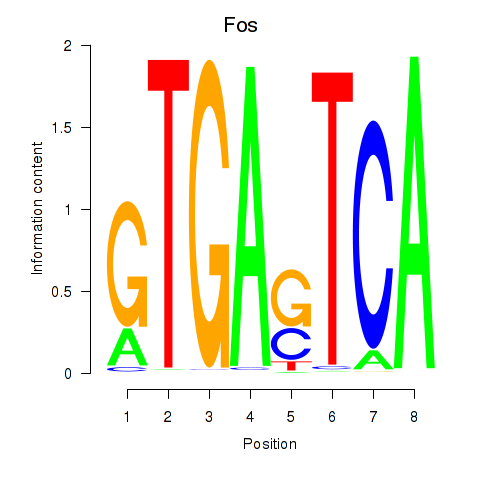
| Fos | -0.811 |
|
|
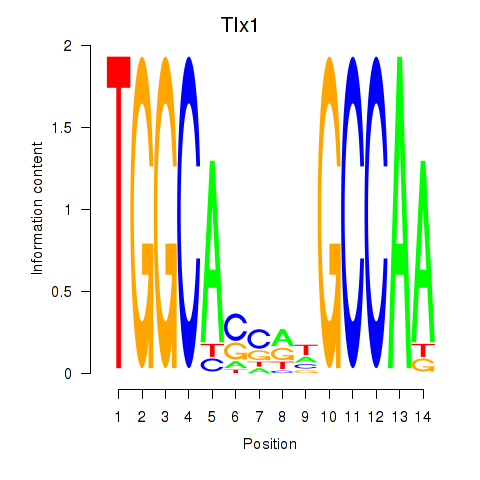
| Tlx1 | -0.816 |
|
|
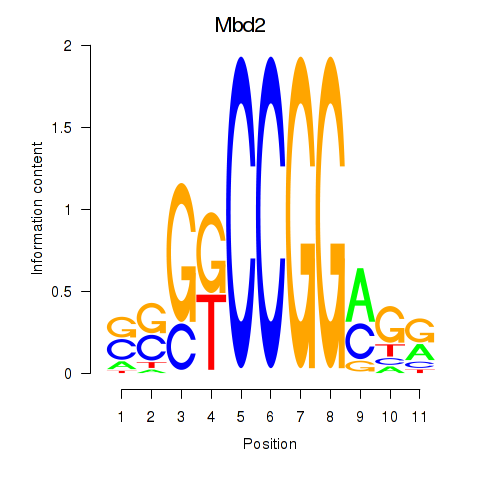
| Mbd2 | -0.848 |
|
|
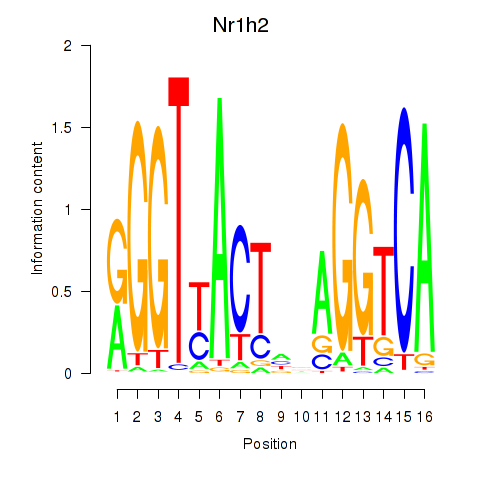
| Nr1h2 | -0.859 |
|
|
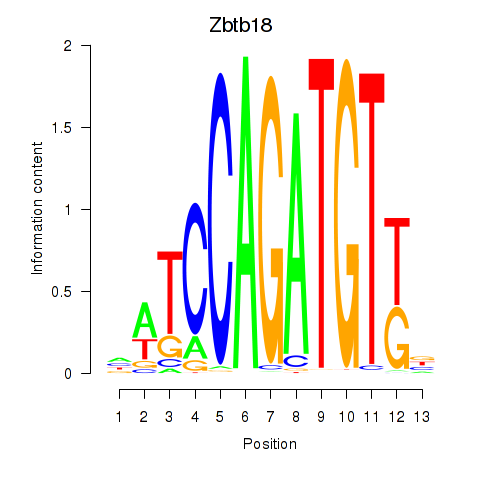
| Zbtb18 | -0.866 |
|
|
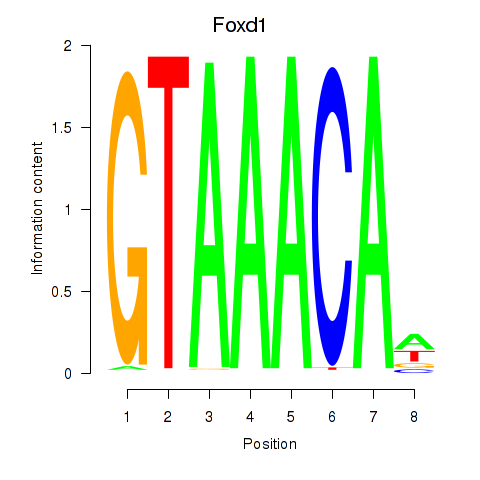
| Foxd1 | -0.876 |
|
|
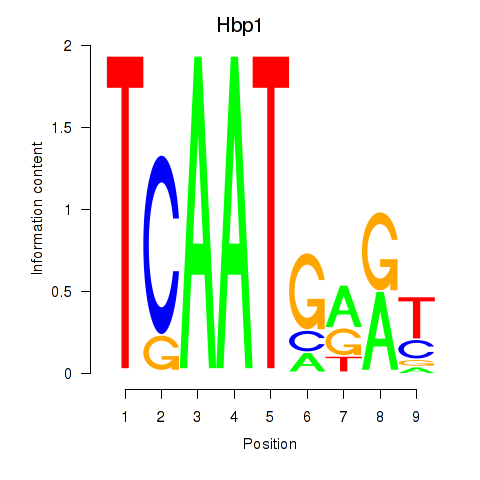
| Hbp1 | -0.884 |
|
|
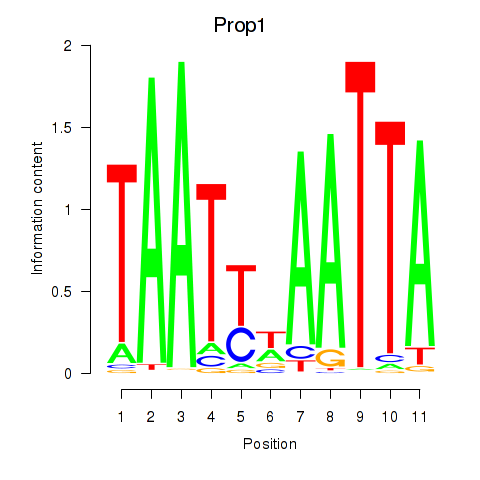
| Prop1 | -0.907 |
|
|
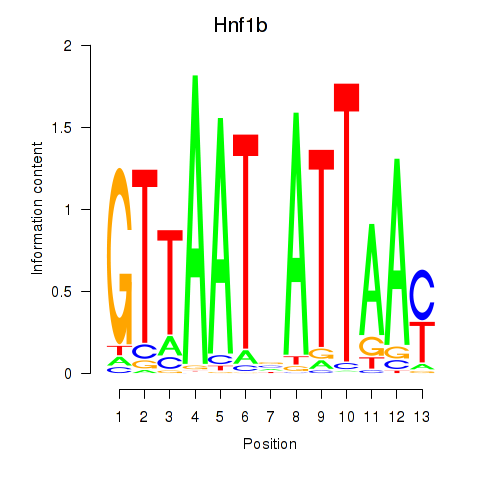
| Hnf1b | -0.910 |
|
|
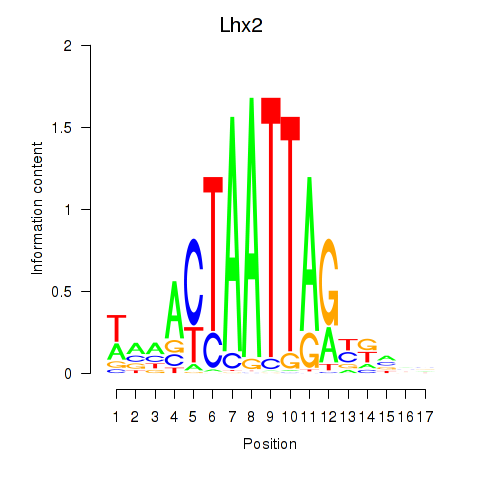
| Lhx2_Hoxc5 | -0.917 |
|
|
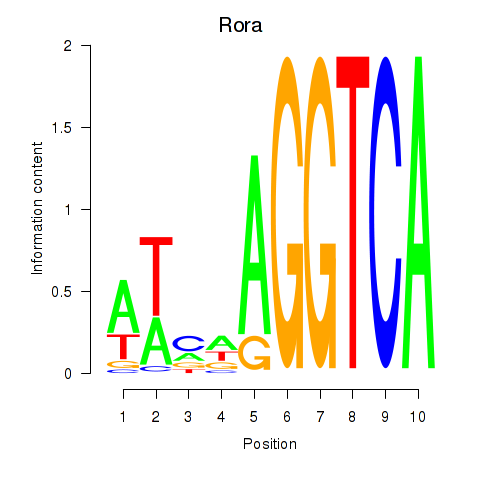
| Rora | -0.926 |
|
|
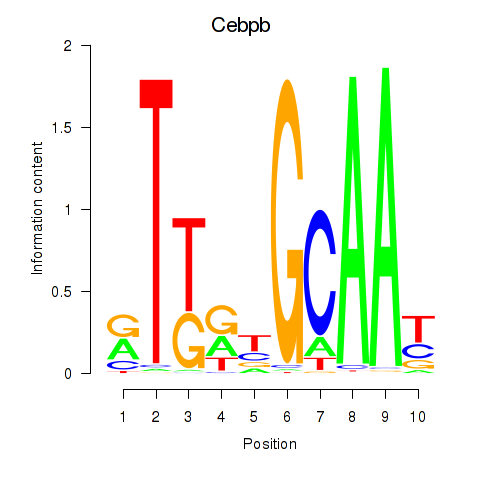
| Cebpb | -0.933 |
|
|
| Hoxa13 | -0.936 |
|

|
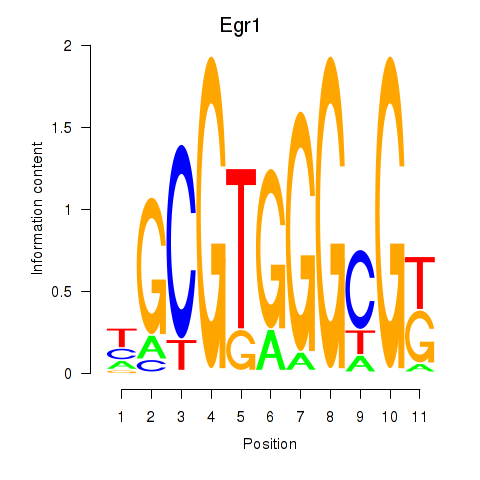
| Egr1 | -0.940 |
|
|
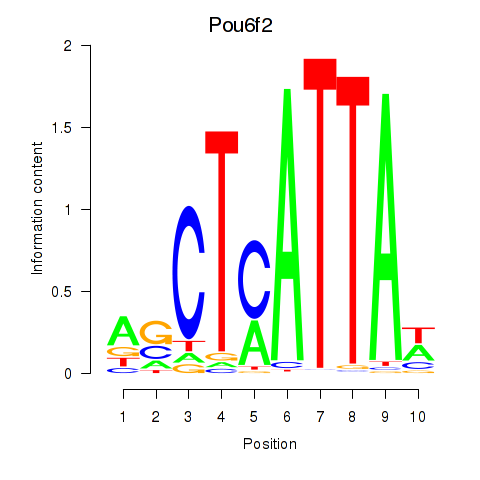
| Pou6f2_Pou4f2 | -0.957 |
|
|
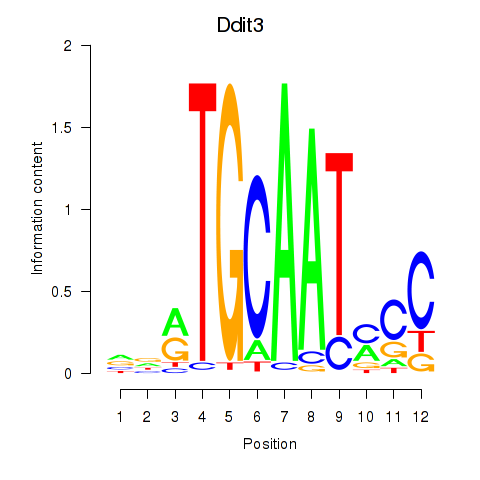
| Ddit3 | -0.958 |
|
|
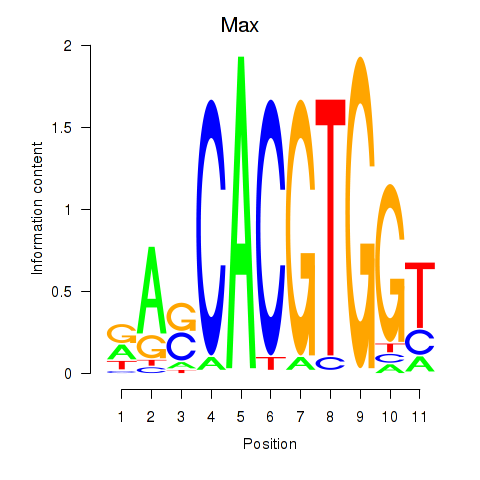
| Max_Mycn | -1.005 |
|
|
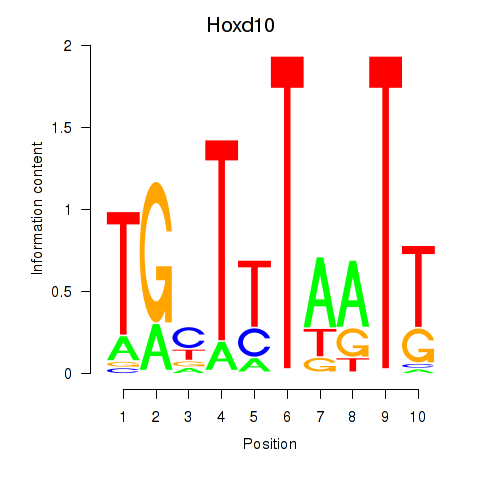
| Hoxd10 | -1.009 |
|
|
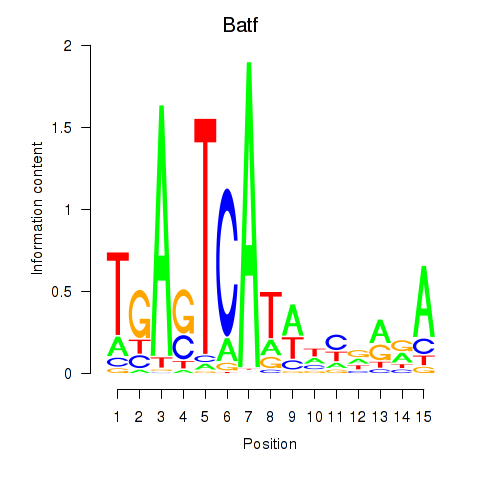
| Batf | -1.020 |
|
|
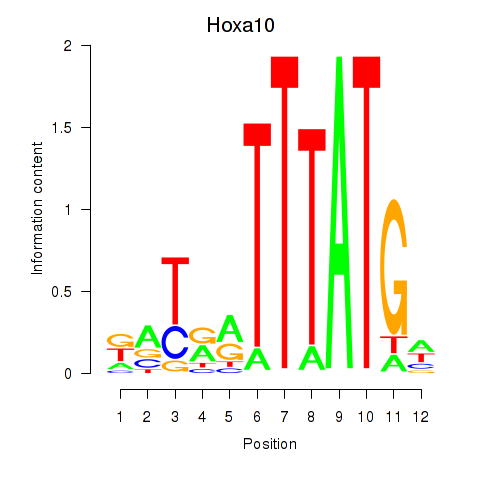
| Hoxa10 | -1.021 |
|
|
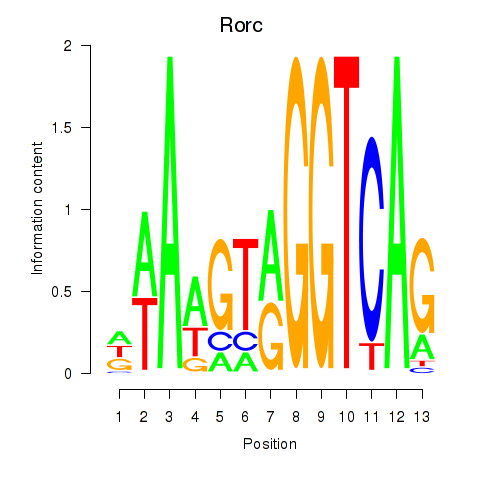
| Rorc_Nr1d1 | -1.026 |
|
|
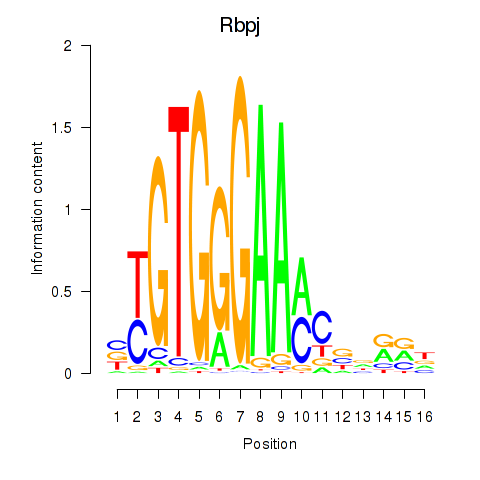
| Rbpj | -1.031 |
|
|
| Creb3 | -1.037 |
|

|
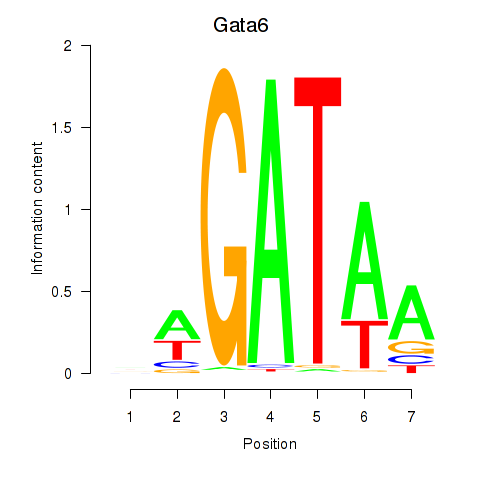
| Gata6 | -1.051 |
|
|
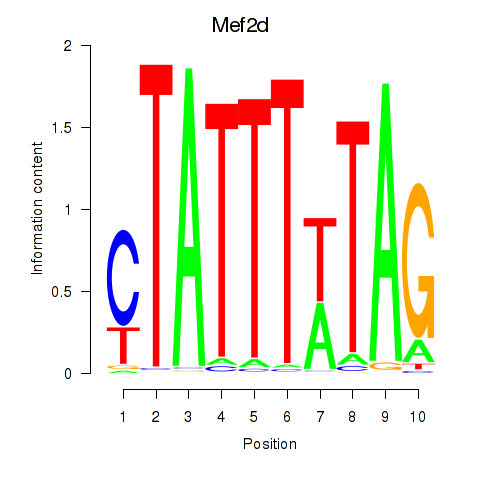
| Mef2d_Mef2a | -1.061 |
|
|
| Nr2f2 | -1.096 |
|
|
| Prox1 | -1.105 |
|
|
| Mnt | -1.116 |
|
|
| Evx2 | -1.124 |
|
|
| Atf4 | -1.135 |
|
|
| Lhx5_Lmx1b_Lhx1 | -1.152 |
|
|
| Pou3f3 | -1.156 |
|
|
| Sox30 | -1.165 |
|
|
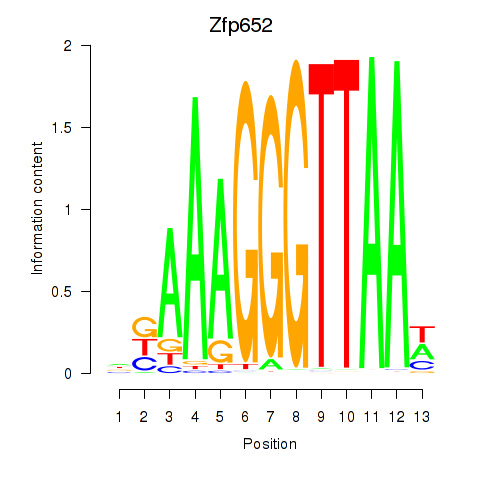
| Zfp652 | -1.180 |
|
|
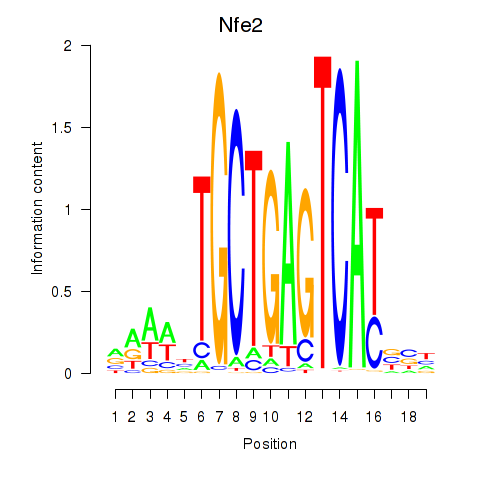
| Nfe2_Bach1_Mafk | -1.195 |
|
|
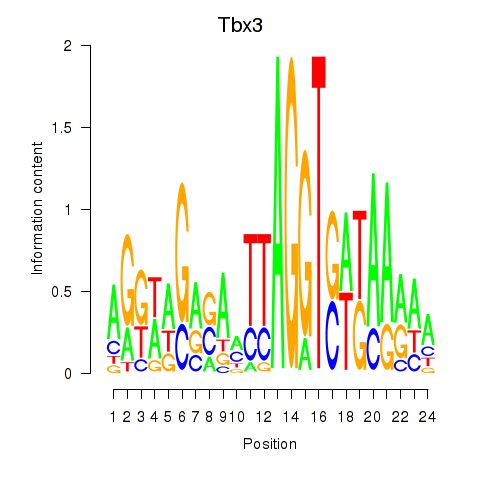
| Tbx3 | -1.207 |
|
|
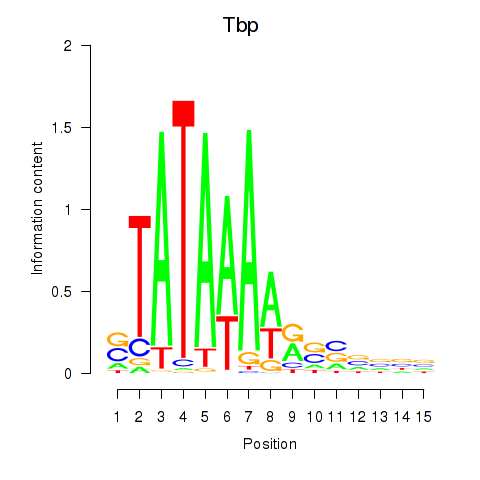
| Tbp | -1.222 |
|
|
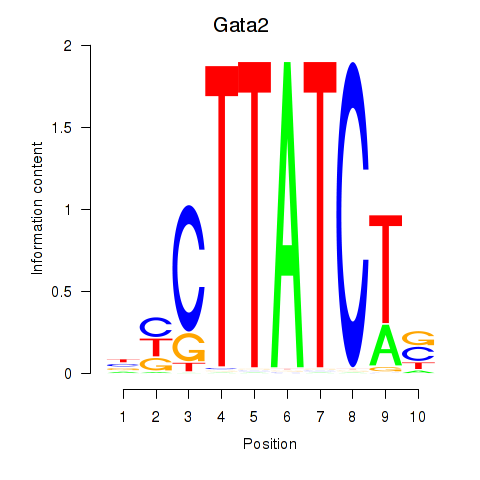
| Gata2_Gata1 | -1.237 |
|
|
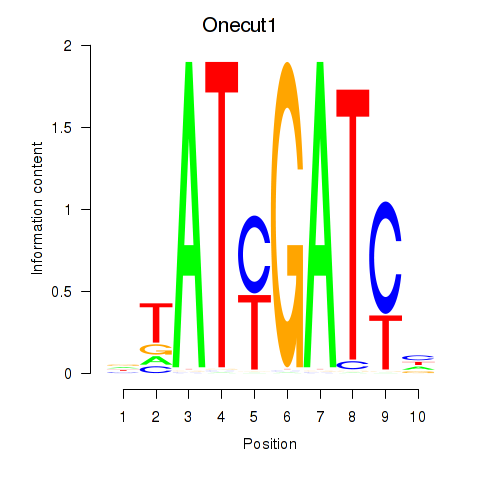
| Onecut1_Cux2 | -1.254 |
|
|
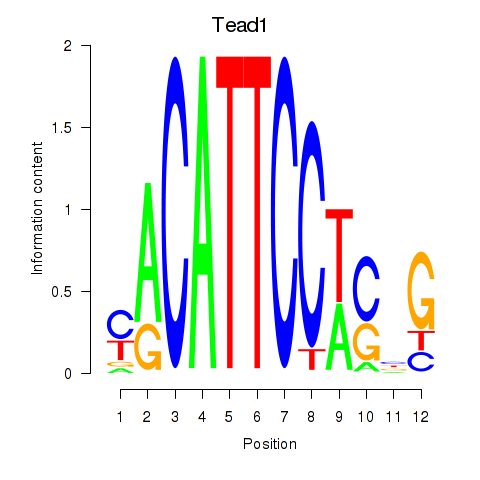
| Tead1 | -1.259 |
|
|
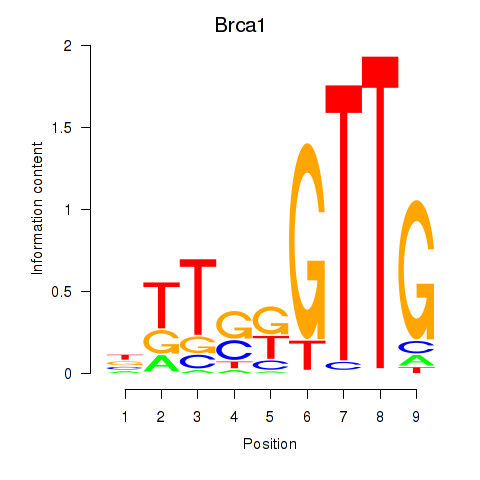
| Brca1 | -1.260 |
|
|
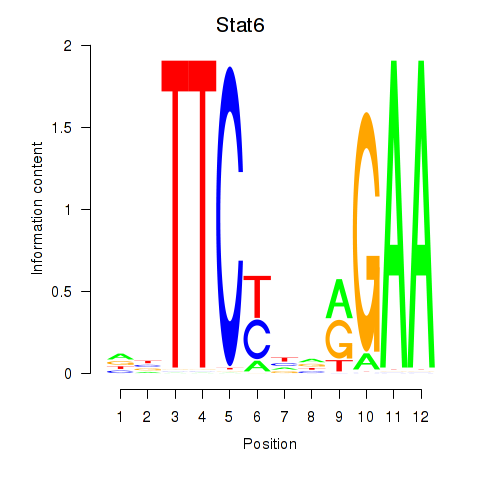
| Stat6 | -1.270 |
|
|
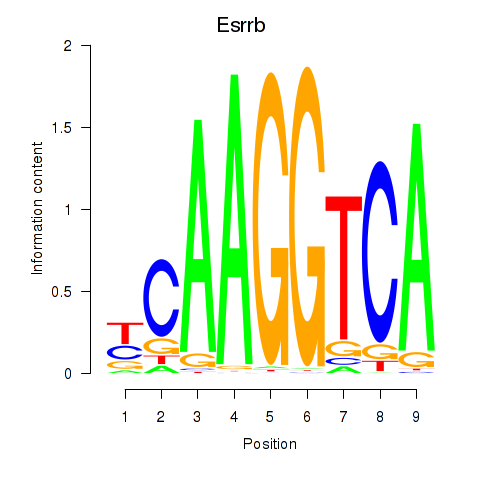
| Esrrb_Esrra | -1.281 |
|
|
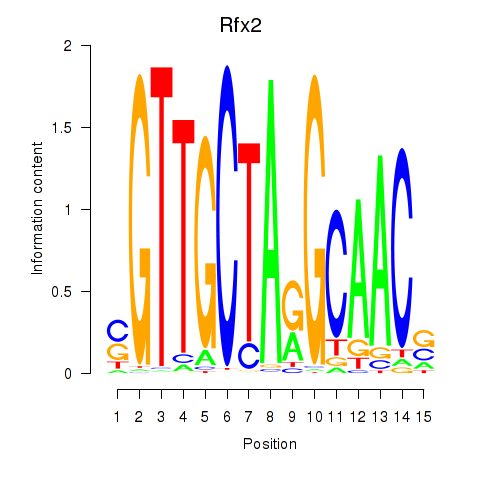
| Rfx2_Rfx7 | -1.290 |
|
|
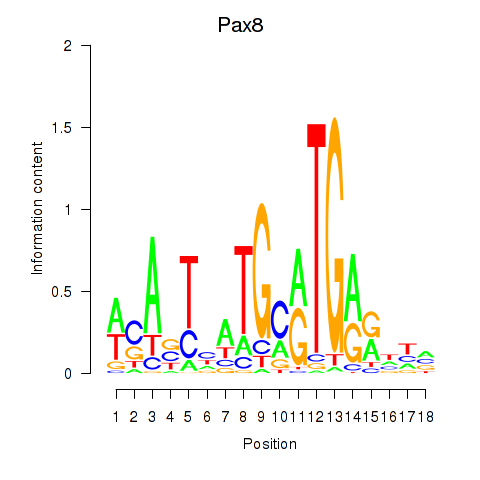
| Pax8 | -1.291 |
|
|
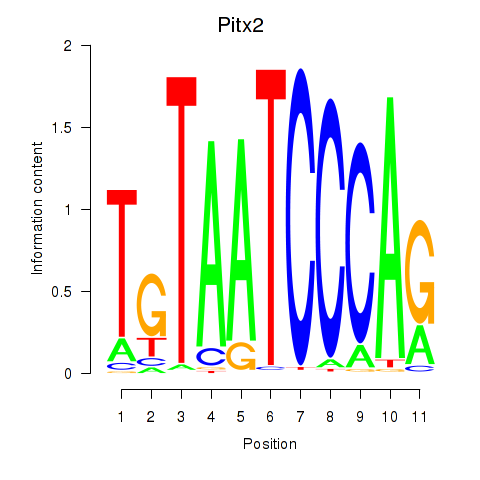
| Pitx2_Otx2 | -1.294 |
|
|
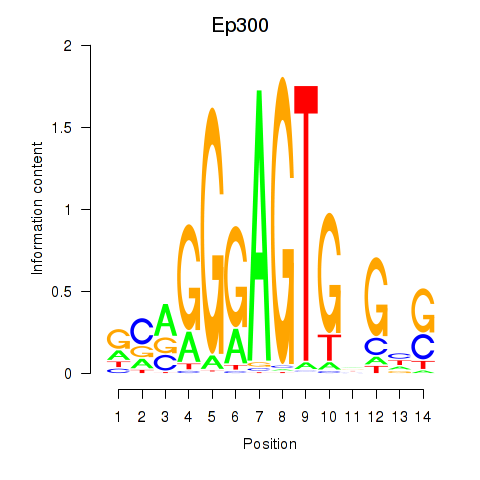
| Ep300 | -1.296 |
|
|
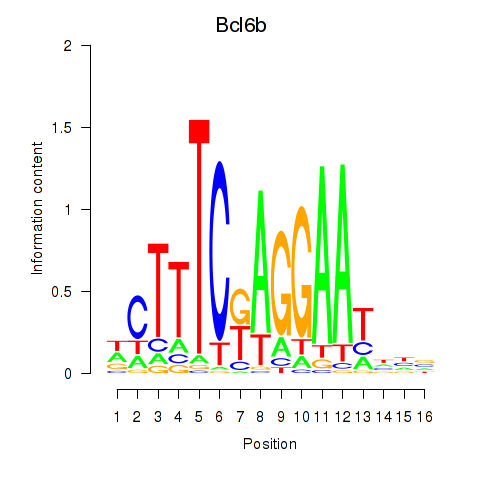
| Bcl6b | -1.316 |
|
|
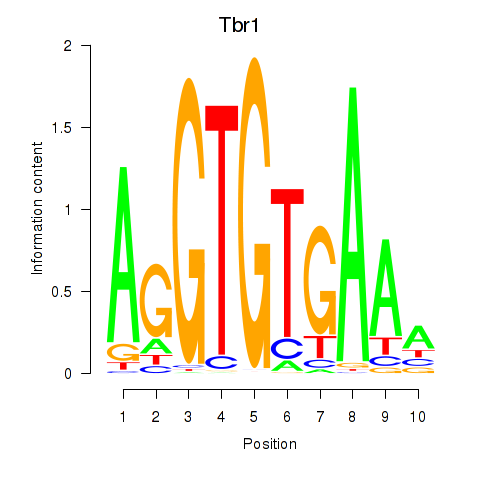
| Tbr1 | -1.336 |
|
|
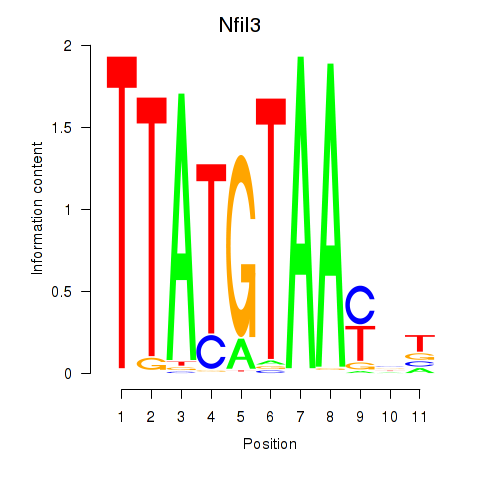
| Nfil3_Tef | -1.339 |
|
|
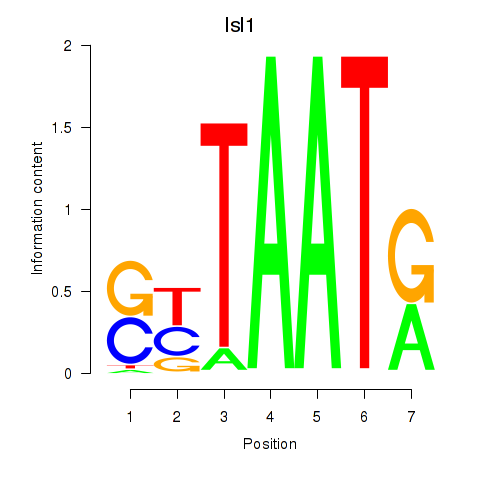
| Isl1 | -1.372 |
|
|
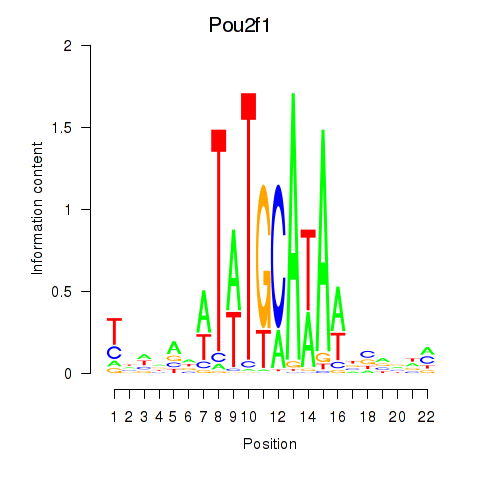
| Pou2f1 | -1.379 |
|
|
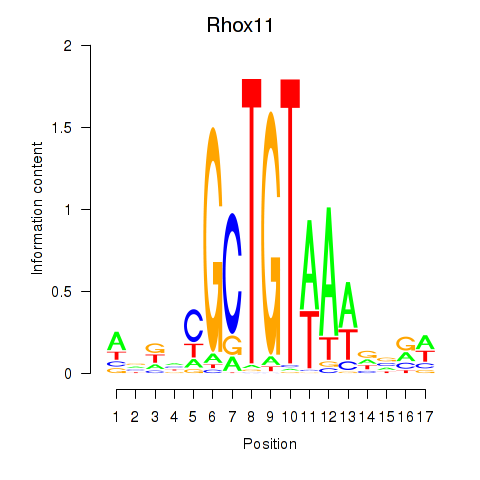
| Rhox11 | -1.381 |
|
|
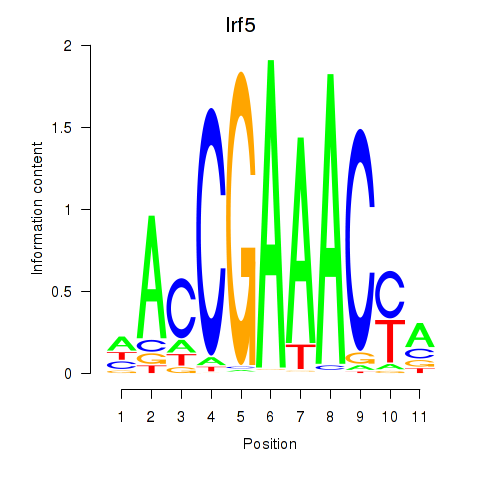
| Irf5_Irf6 | -1.385 |
|
|
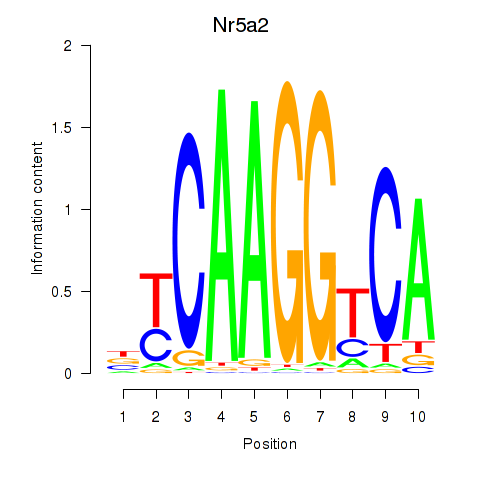
| Nr5a2 | -1.396 |
|
|
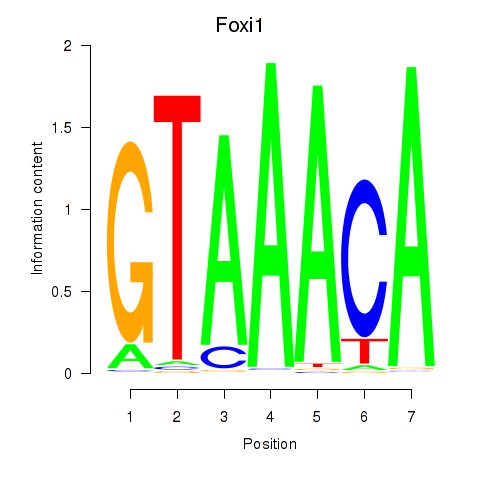
| Foxi1_Foxo1 | -1.427 |
|
|
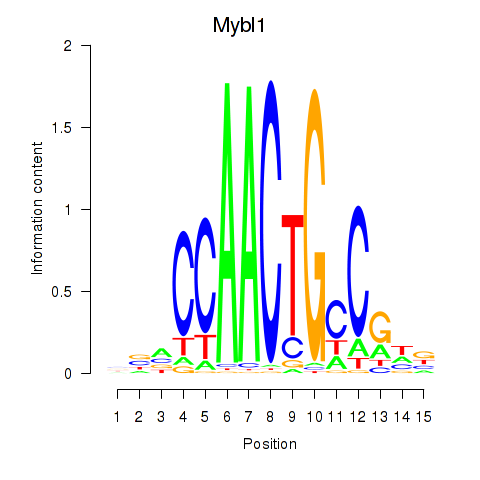
| Mybl1 | -1.431 |
|
|
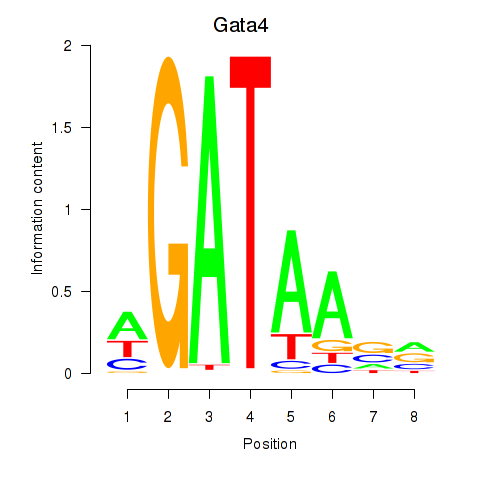
| Gata4 | -1.441 |
|
|
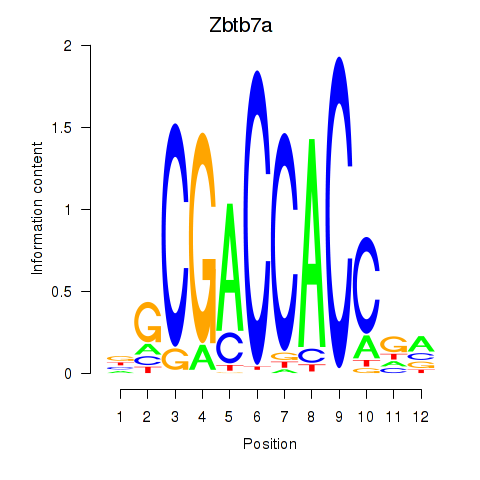
| Zbtb7a | -1.457 |
|
|
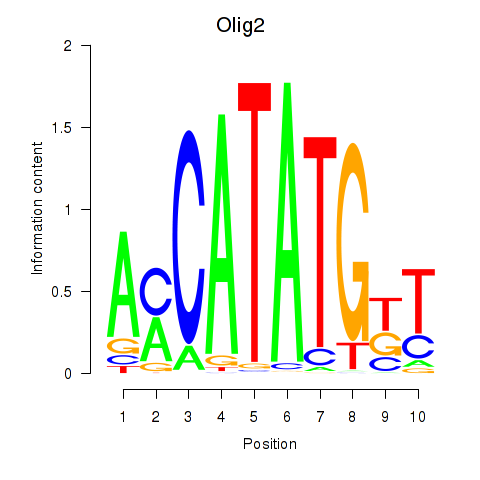
| Olig2_Olig3 | -1.470 |
|
|
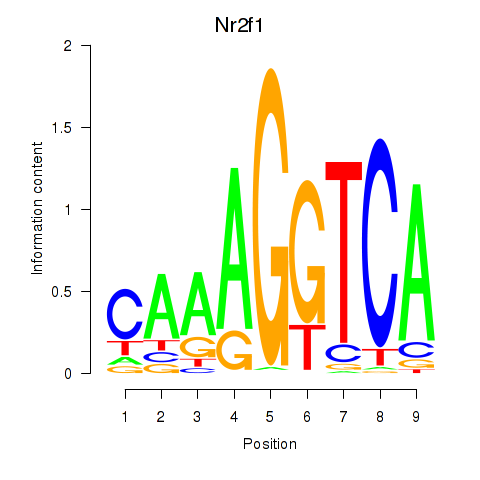
| Nr2f1_Nr4a1 | -1.489 |
|
|
| Irf3 | -1.517 |
|
|
| Grhl1 | -1.523 |
|
|
| Obox1 | -1.532 |
|
|
| E2f2_E2f5 | -1.535 |
|
|
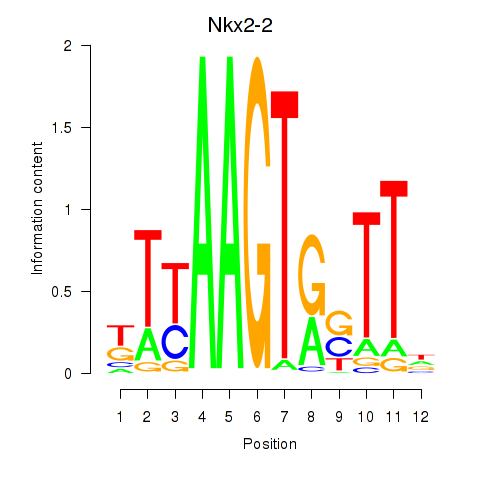
| Nkx2-2 | -1.558 |
|
|
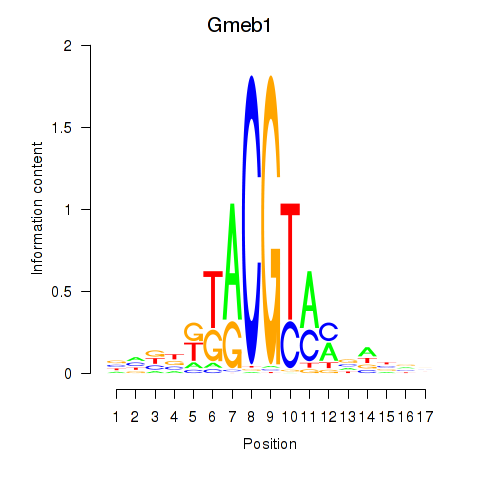
| Gmeb1 | -1.558 |
|
|
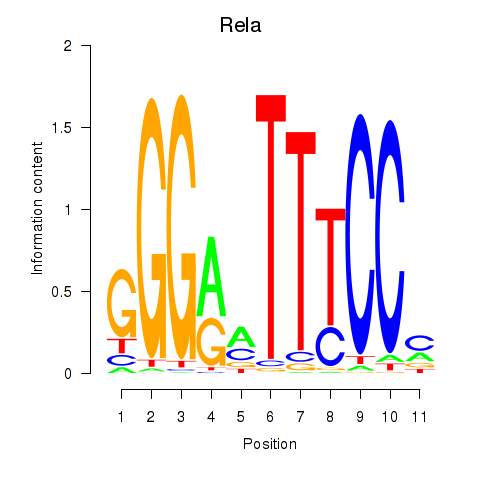
| Rela_Rel_Nfkb1 | -1.563 |
|
|
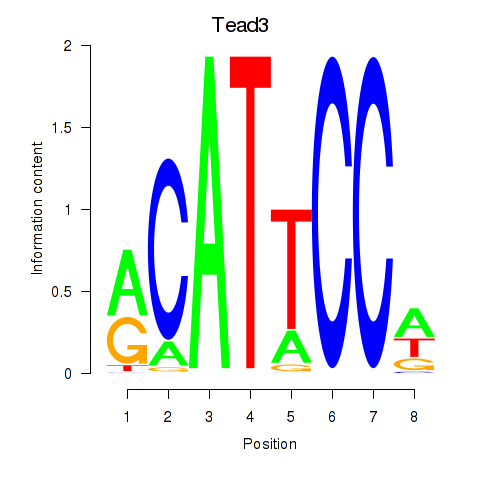
| Tead3_Tead4 | -1.591 |
|
|
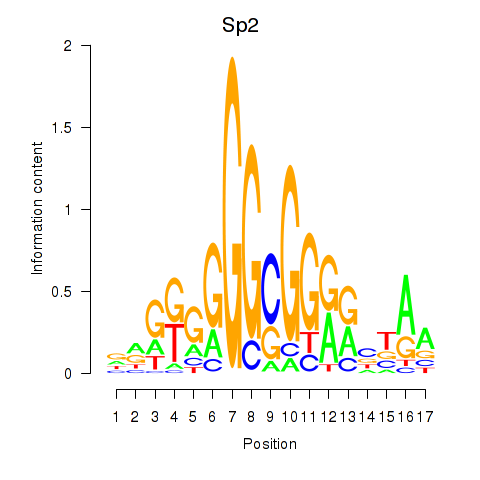
| Sp2 | -1.605 |
|
|
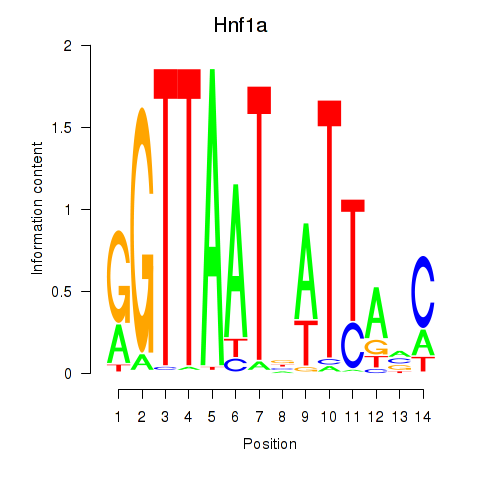
| Hnf1a | -1.610 |
|
|
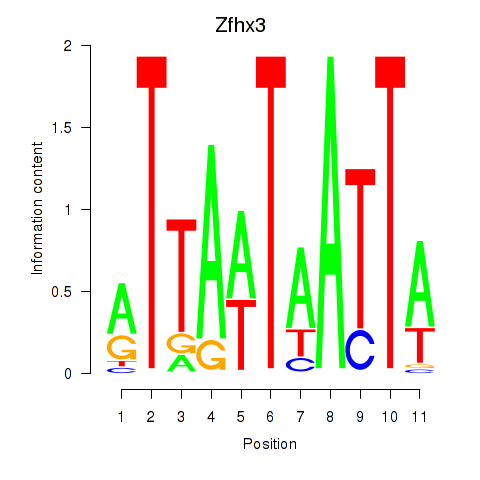
| Zfhx3 | -1.623 |
|
|
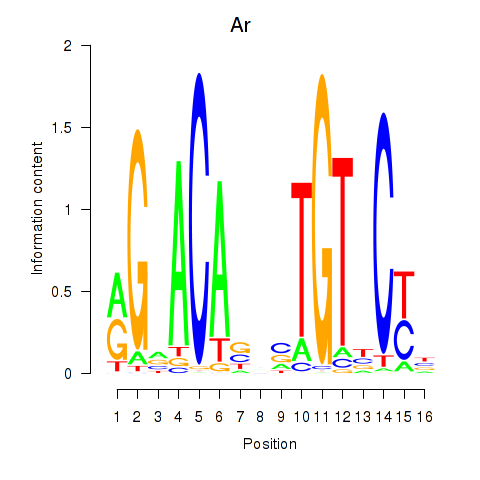
| Ar | -1.639 |
|
|
| Nkx2-4 | -1.671 |
|
|
| Atf3 | -1.681 |
|
|
| Hoxa5 | -1.694 |
|
|
| Hdx | -1.696 |
|
|
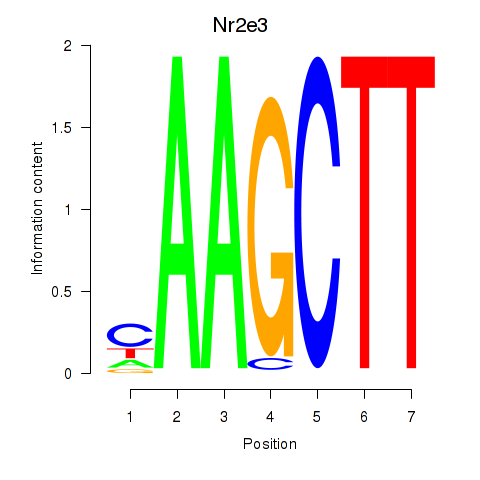
| Nr2e3 | -1.704 |
|
|
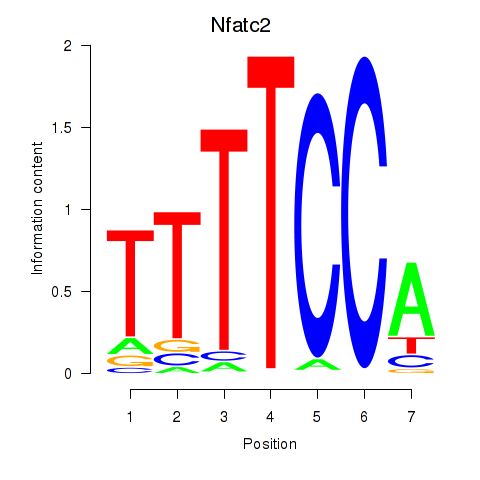
| Nfatc2 | -1.760 |
|
|
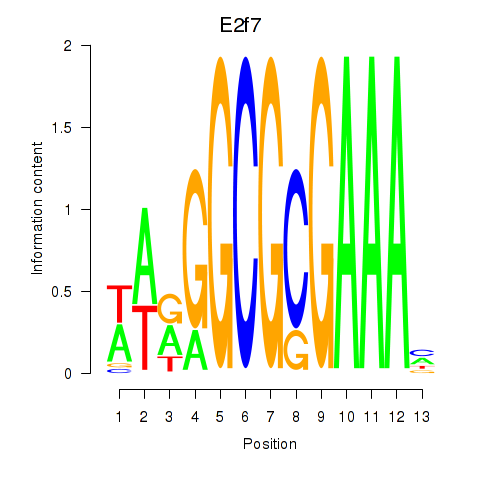
| E2f7 | -1.767 |
|
|
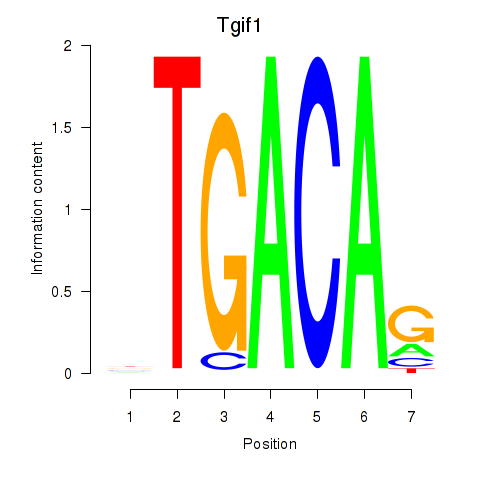
| Tgif1_Meis3 | -1.806 |
|
|
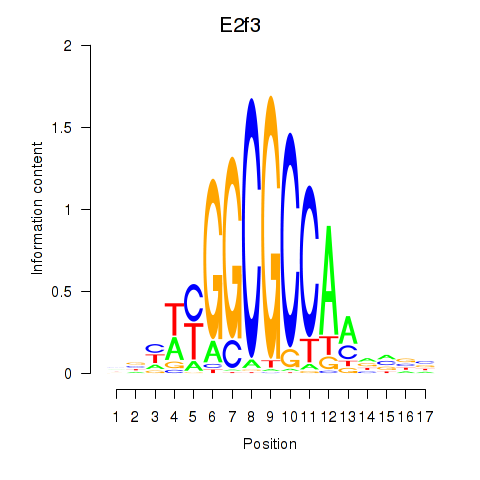
| E2f3 | -1.845 |
|
|
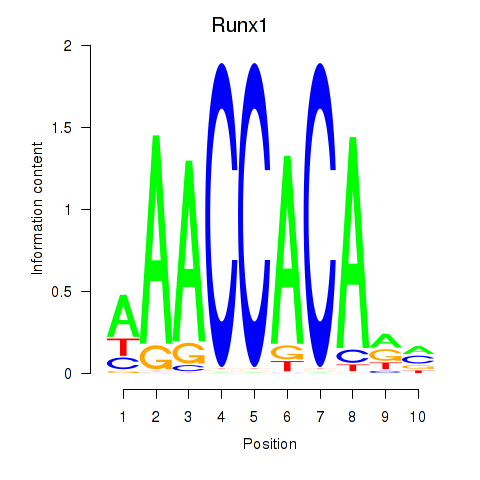
| Runx1 | -1.867 |
|
|
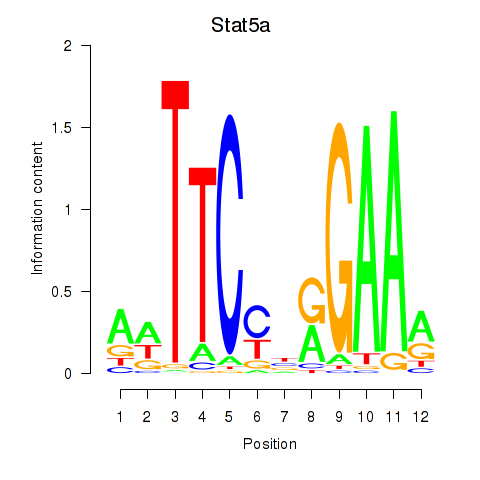
| Stat5a | -1.896 |
|
|
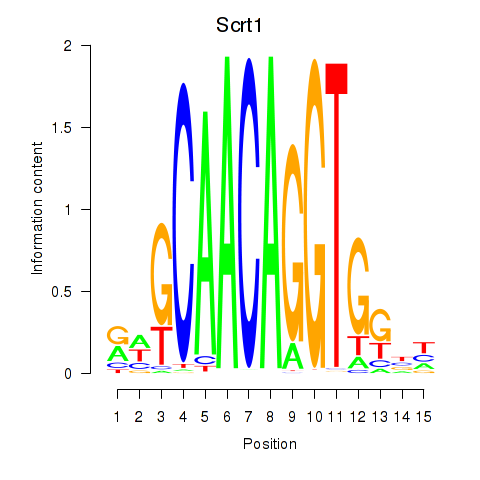
| Scrt1 | -1.992 |
|
|
| Dbp | -2.013 |
|
|
| Nkx2-3 | -2.017 |
|
|
| Rhox4e_Rhox6_Vax2 | -2.050 |
|
|
| Ubp1 | -2.061 |
|
|
| Ybx1_Nfya_Nfyb_Nfyc_Cebpz | -2.092 |
|
|
| Gata5 | -2.126 |
|
|
| Tfcp2 | -2.200 |
|
|
| Ehf | -2.230 |
|
|
| Tlx2 | -2.236 |
|
|
| Bsx | -2.260 |
|
|
| Mef2b | -2.279 |
|
|
| Foxc1 | -2.298 |
|

|
| Elf1_Elf2_Etv2_Elf4 | -2.300 |
|
|
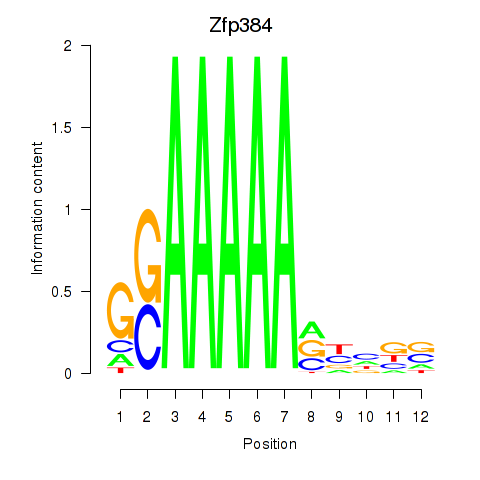
| Zfp384 | -2.370 |
|
|
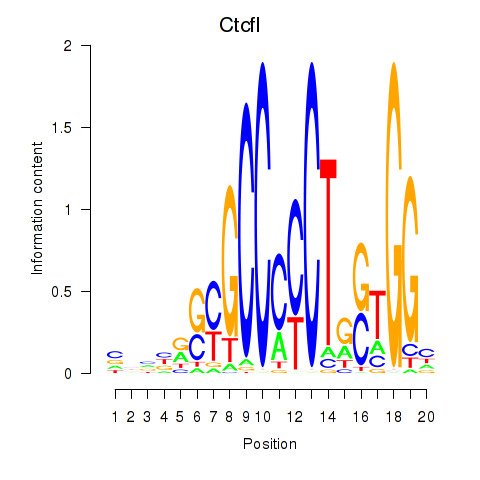
| Ctcfl_Ctcf | -2.409 |
|
|
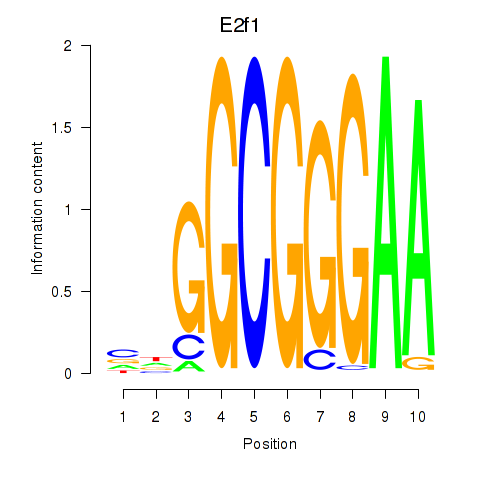
| E2f1 | -2.451 |
|
|
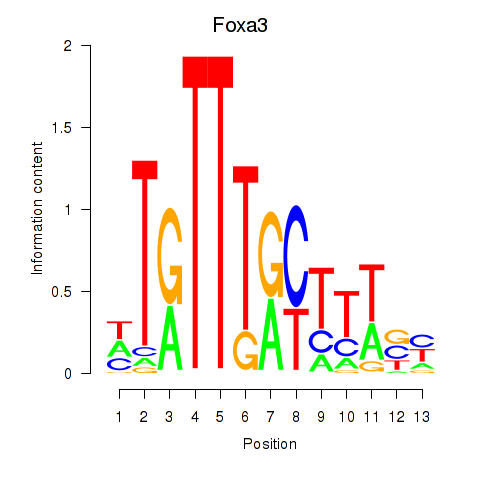
| Foxa3 | -2.457 |
|
|
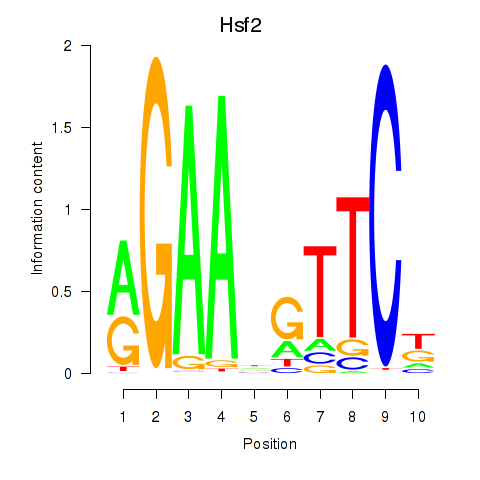
| Hsf2 | -2.492 |
|
|
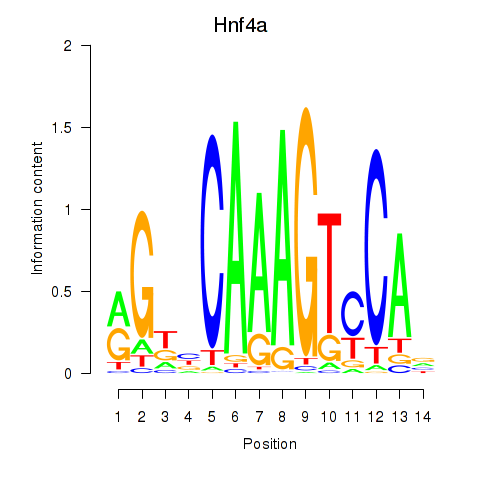
| Hnf4a | -2.516 |
|
|
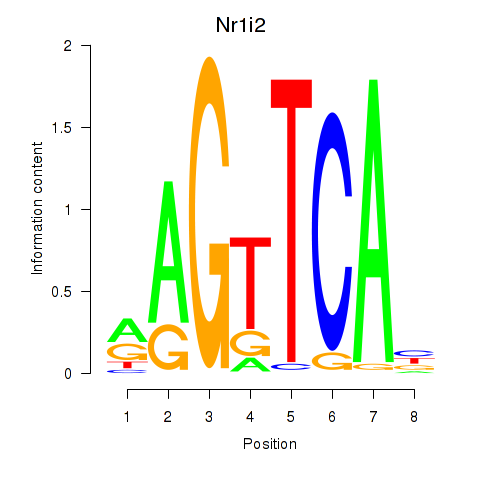
| Nr1i2 | -2.519 |
|
|
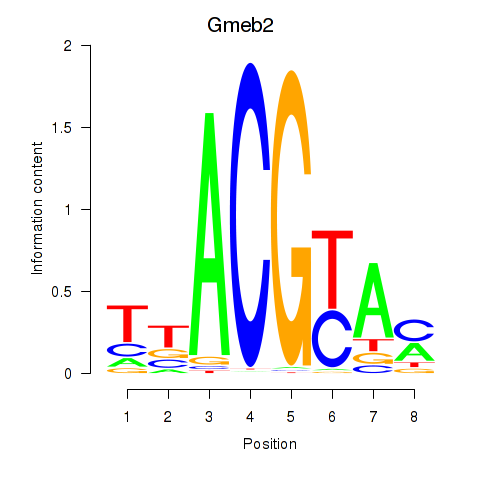
| Gmeb2 | -2.583 |
|
|
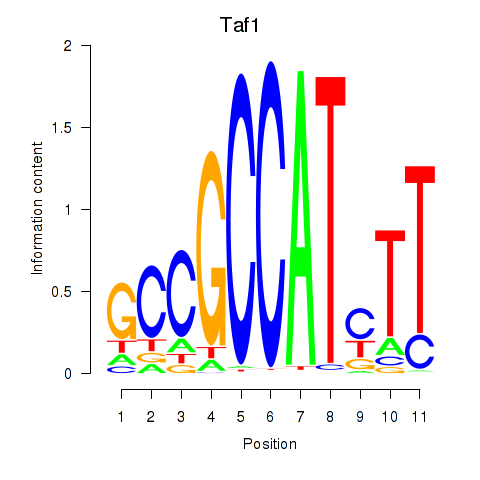
| Taf1 | -2.595 |
|
|
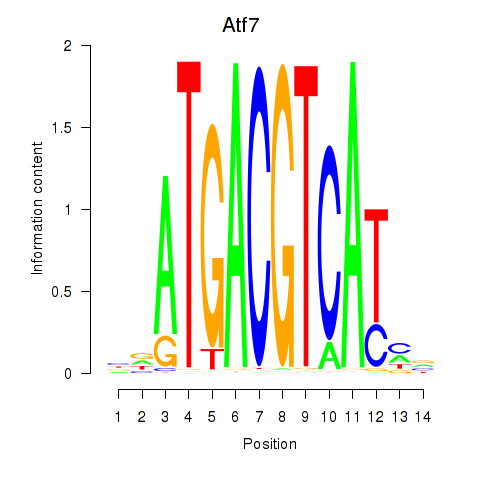
| Atf7_E4f1 | -2.681 |
|
|
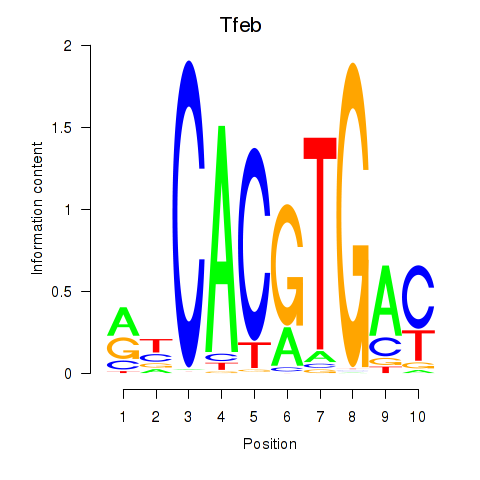
| Tfeb_Usf1_Srebf1_Usf2_Bhlhe41_Srebf2 | -2.736 |
|
|
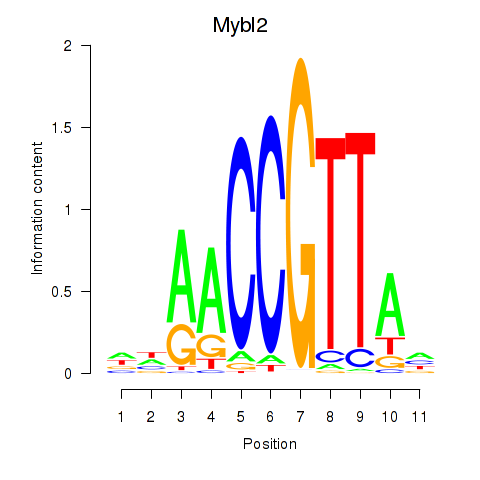
| Mybl2 | -2.771 |
|
|
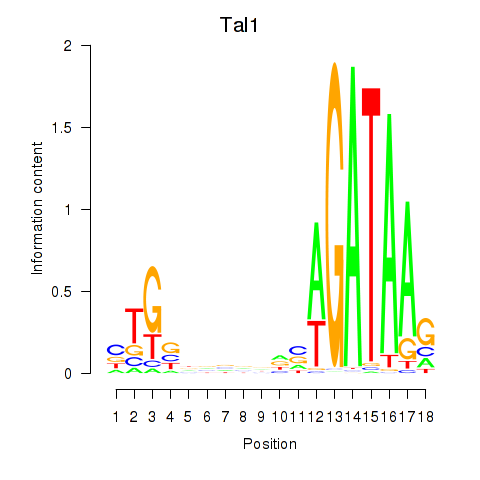
| Tal1 | -2.808 |
|
|
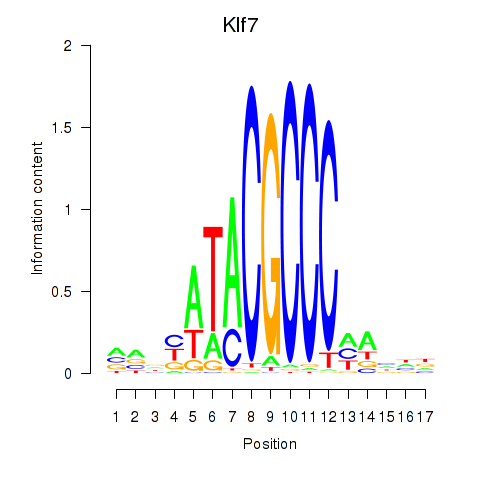
| Klf7 | -2.859 |
|
|
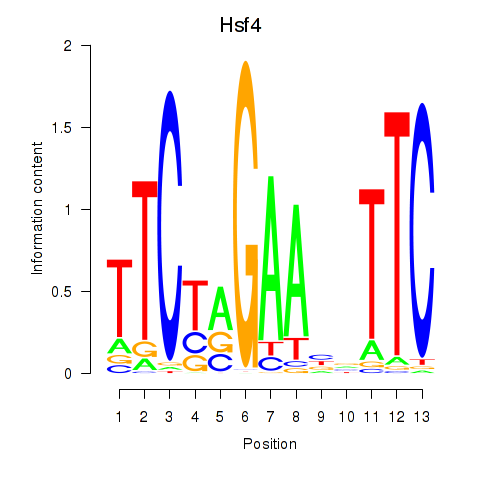
| Hsf4 | -2.937 |
|
|
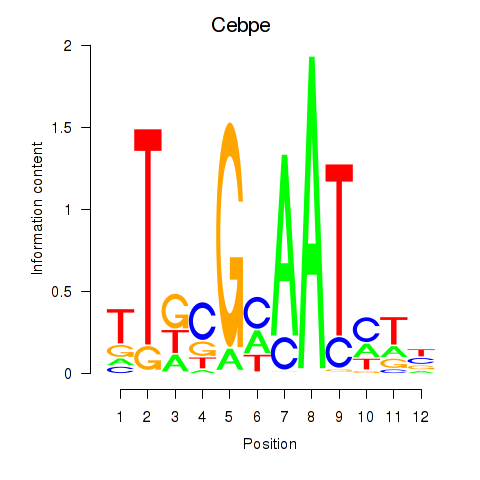
| Cebpe | -3.033 |
|
|
| Meis1 | -3.124 |
|
|
| Klf4_Sp3 | -3.145 |
|
|
| Homez | -3.266 |
|
|
| Sp100 | -3.302 |
|
|
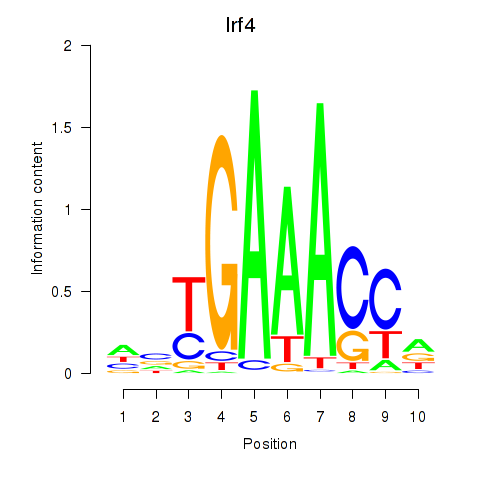
| Irf4 | -3.311 |
|
|
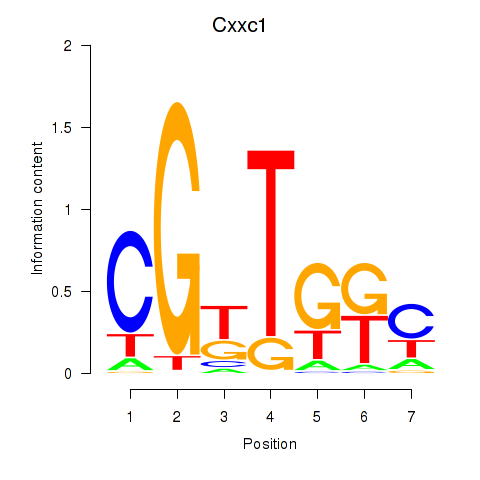
| Cxxc1 | -3.557 |
|
|
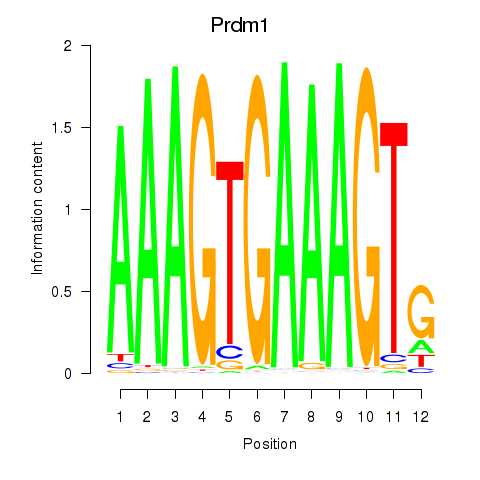
| Prdm1 | -3.627 |
|
|
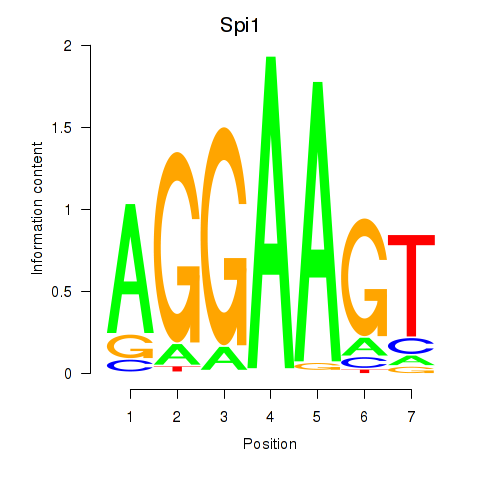
| Spi1 | -3.678 |
|
|
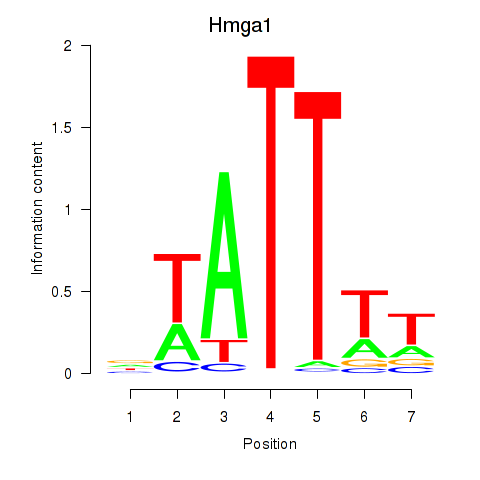
| Hmga1 | -3.840 |
|
|
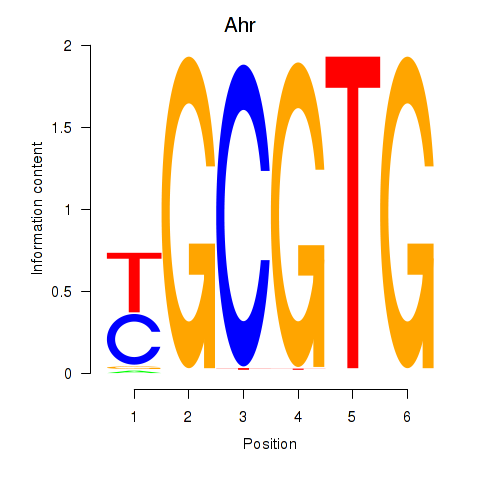
| Ahr | -3.855 |
|
|
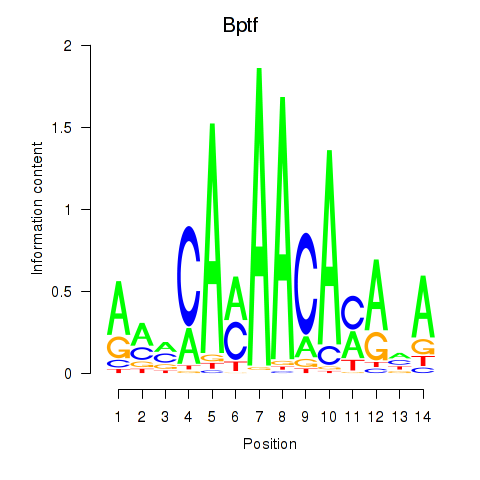
| Bptf | -3.890 |
|
|
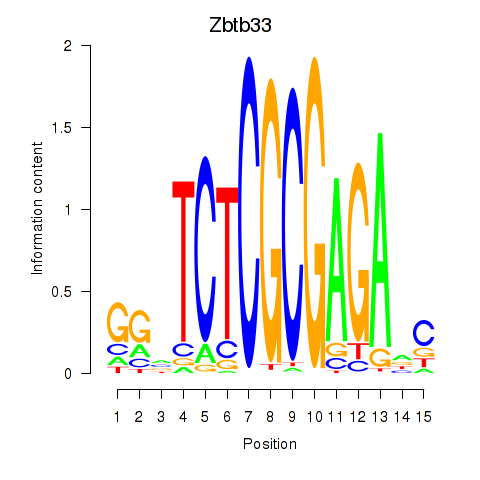
| Zbtb33_Chd2 | -3.936 |
|
|
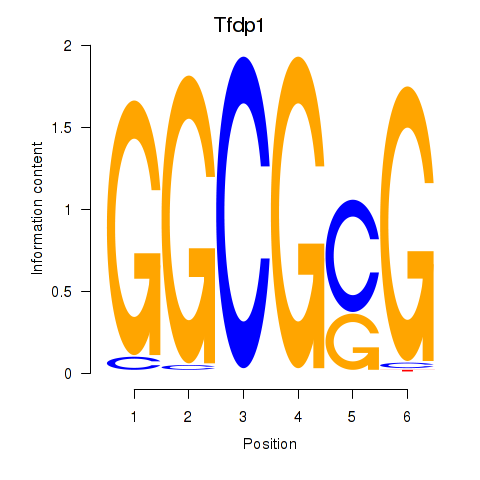
| Tfdp1_Wt1_Egr2 | -3.944 |
|
|
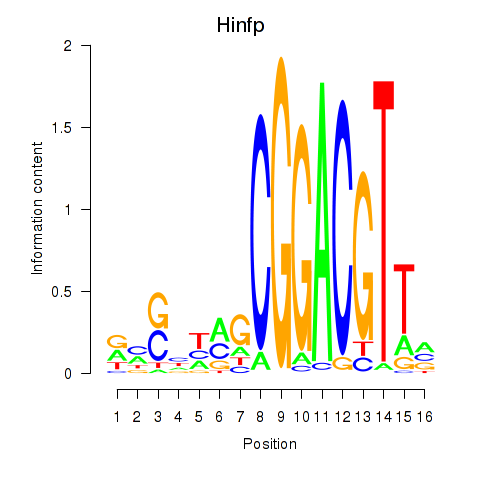
| Hinfp | -4.343 |
|
|
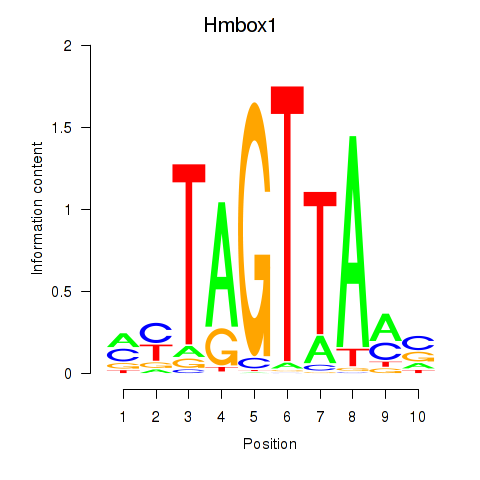
| Hmbox1 | -4.379 |
|
|
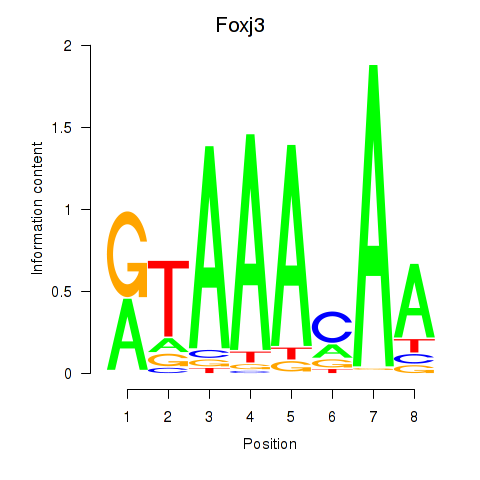
| Foxj3_Tbl1xr1 | -5.010 |
|
|
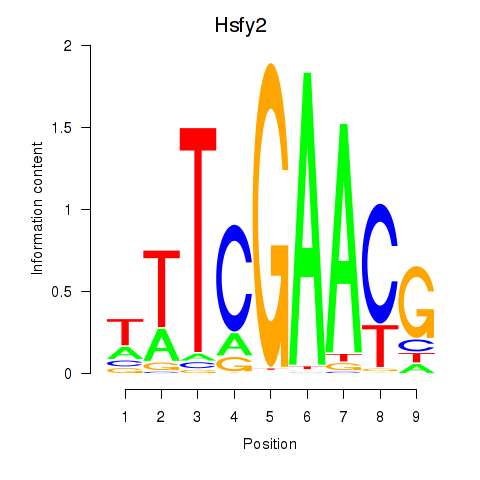
| Hsfy2 | -5.083 |
|
|
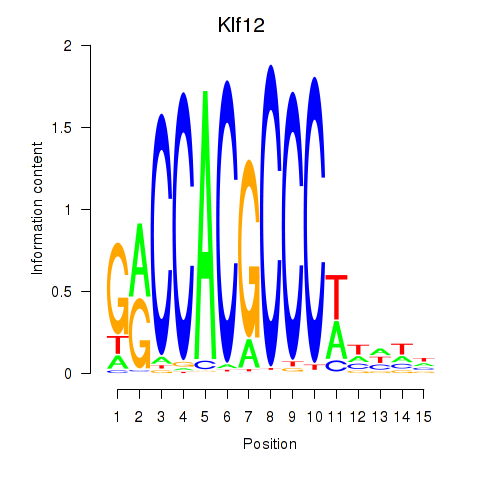
| Klf12_Klf14_Sp4 | -5.168 |
|
|
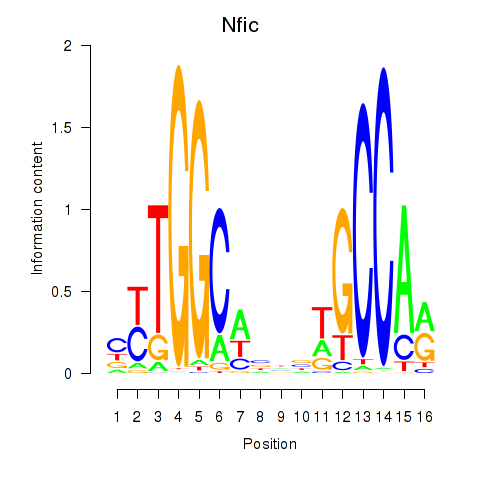
| Nfic_Nfib | -5.427 |
|
|
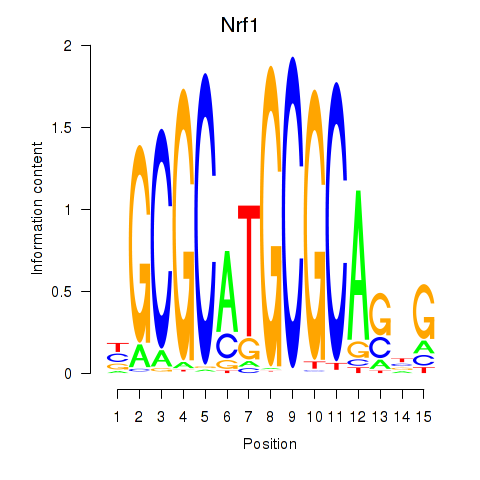
| Nrf1 | -5.437 |
|
|
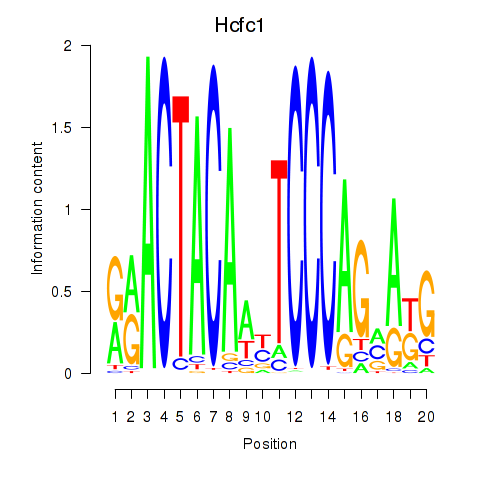
| Hcfc1_Six5_Smarcc2_Zfp143 | -5.759 |
|
|
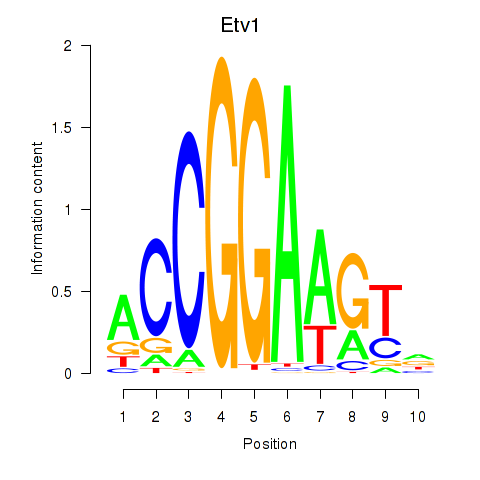
| Etv1_Etv5_Gabpa | -5.960 |
|
|
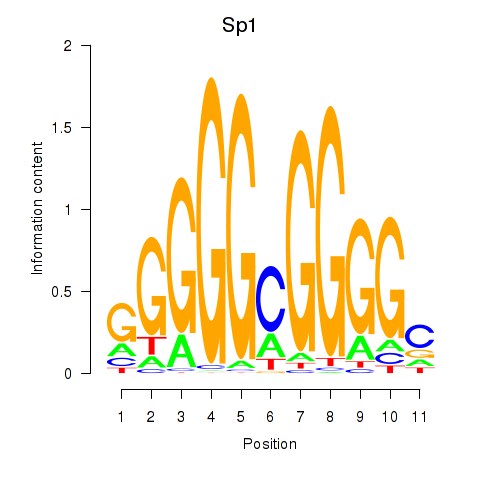
| Sp1 | -6.244 |
|
|
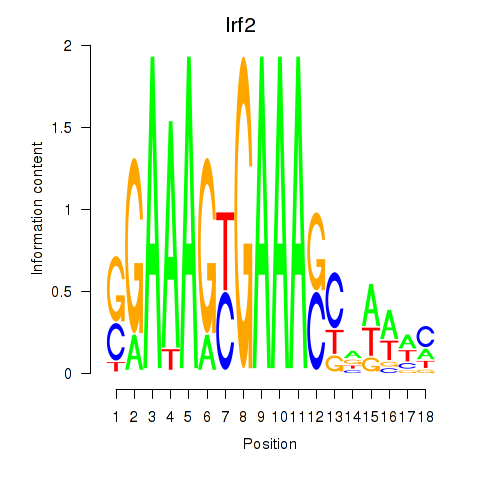
| Irf2_Irf1_Irf8_Irf9_Irf7 | -9.057 |
|
|
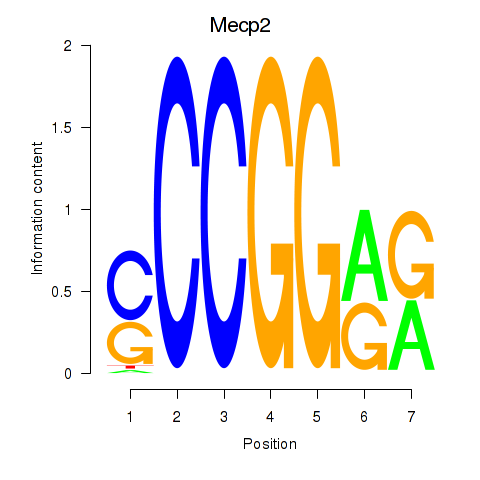
| Mecp2 | -9.749 |
|
|